monetary policy challenges under tighter external ... · 2. 11/07/2018 2 current ... reducing the...
TRANSCRIPT
11/07/2018
1
Monetary Policy Challenges under Tighter External Financial Conditions
FLAR‐CAF XIII Annual Conference
Juan José EchavarríaGovernor
1
Policy challenges
• External Risks and Policy Challenges – First line of defense: Exchange rate flexibility but there are preconditions
• Limited currency mismatches
• A credible monetary regime
• Sound and robust financial sector
• Sound fiscal policy
– Second line of defense: External buffers
• Other Policy Challenges– Higher participation of foreign investors in local public debt market poses
other policy challenges.
– Higher debt2
11/07/2018
2
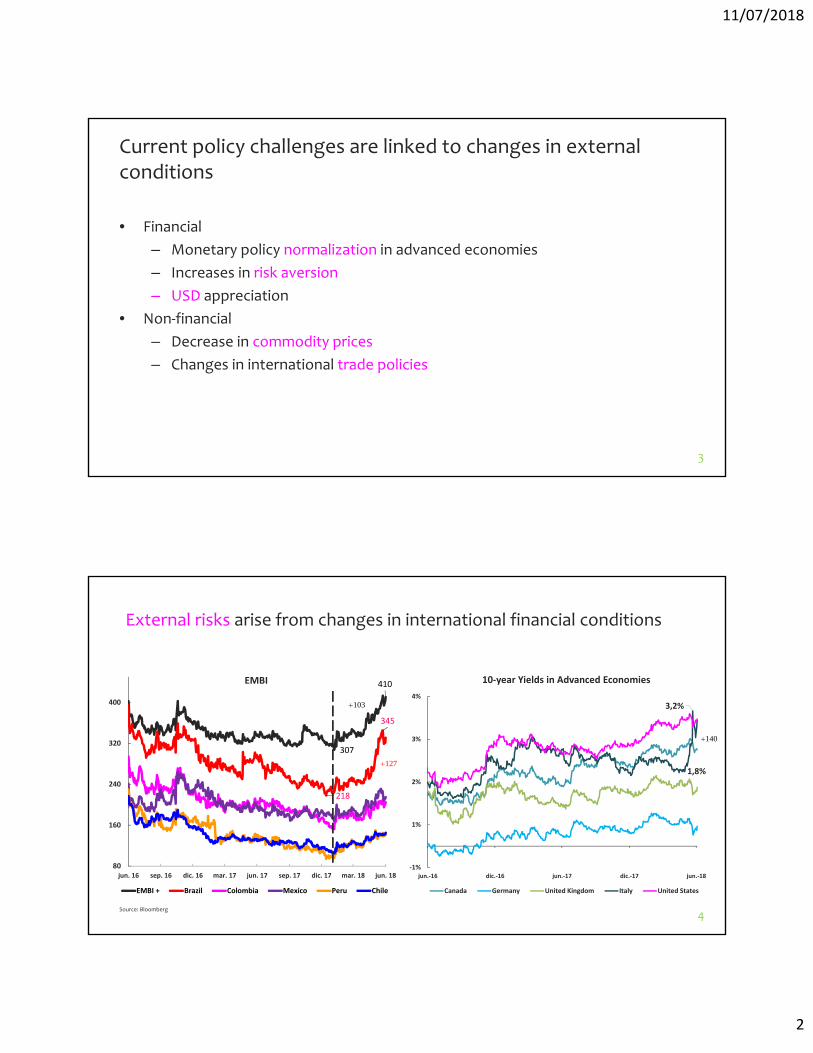
Current policy challenges are linked to changes in external conditions
• Financial
– Monetary policy normalization in advanced economies
– Increases in risk aversion
– USD appreciation
• Non‐financial
– Decrease in commodity prices
– Changes in international trade policies
3
External risks arise from changes in international financial conditions
Source: Bloomberg
4
1,8%
3,2%
‐1%
1%
2%
3%
4%
jun.‐16 dic.‐16 jun.‐17 dic.‐17 jun.‐18
10‐year Yields in Advanced Economies
Canada Germany United Kingdom Italy United States
307
410
218
345
80
160
240
320
400
jun. 16 sep. 16 dic. 16 mar. 17 jun. 17 sep. 17 dic. 17 mar. 18 jun. 18
EMBI + Brazil Colombia Mexico Peru Chile
EMBI
103
127
140
11/07/2018
3
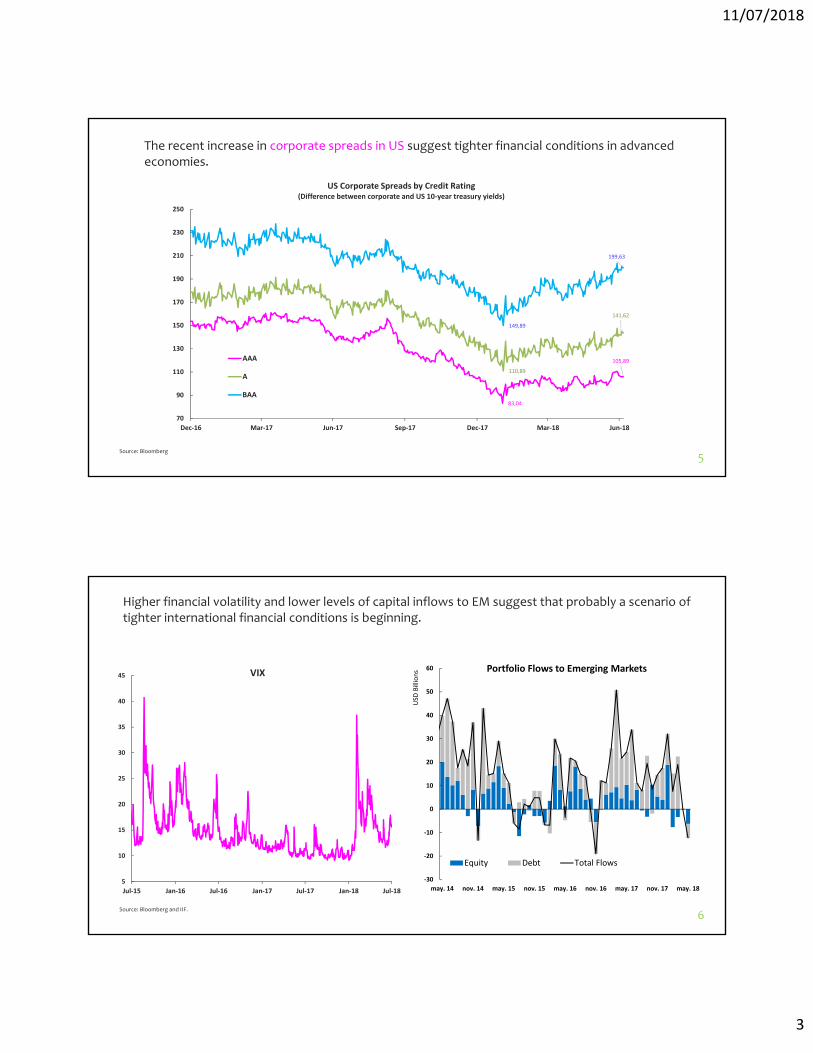
The recent increase in corporate spreads in US suggest tighter financial conditions in advanced economies.
Source: Bloomberg
5
83,04
105,89
110,89
141,62
149,89
199,63
70
90
110
130
150
170
190
210
230
250
Dec‐16 Mar‐17 Jun‐17 Sep‐17 Dec‐17 Mar‐18 Jun‐18
US Corporate Spreads by Credit Rating(Difference between corporate and US 10‐year treasury yields)
AAA
A
BAA
Source: Bloomberg and IIF.
6
5
10
15
20
25
30
35
40
45
Jul‐15 Jan‐16 Jul‐16 Jan‐17 Jul‐17 Jan‐18 Jul‐18
VIX
‐30
‐20
‐10
0
10
20
30
40
50
60
may. 14 nov. 14 may. 15 nov. 15 may. 16 nov. 16 may. 17 nov. 17 may. 18
Portfolio Flows to Emerging Markets
Equity Debt Total Flows
USD
Billions
Higher financial volatility and lower levels of capital inflows to EM suggest that probably a scenario of tighter international financial conditions is beginning.
11/07/2018
4
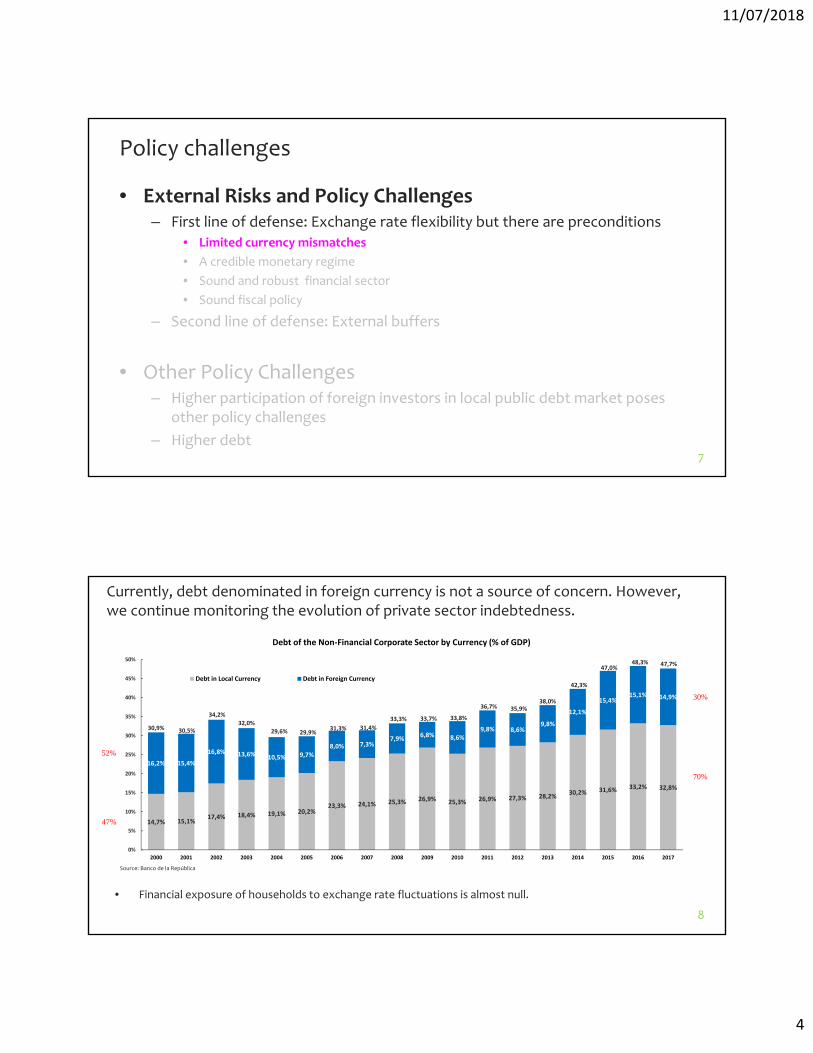
Policy challenges
• External Risks and Policy Challenges – First line of defense: Exchange rate flexibility but there are preconditions
• Limited currency mismatches
• A credible monetary regime
• Sound and robust financial sector
• Sound fiscal policy
– Second line of defense: External buffers
• Other Policy Challenges– Higher participation of foreign investors in local public debt market poses
other policy challenges
– Higher debt7
• Financial exposure of households to exchange rate fluctuations is almost null.
Source: Banco de la República
8
Currently, debt denominated in foreign currency is not a source of concern. However, we continue monitoring the evolution of private sector indebtedness.
14,7% 15,1%17,4% 18,4% 19,1% 20,2%
23,3% 24,1% 25,3% 26,9% 25,3% 26,9% 27,3% 28,2%30,2% 31,6% 33,2% 32,8%
16,2% 15,4%
16,8% 13,6% 10,5% 9,7%8,0% 7,3%
7,9%6,8% 8,6%
9,8% 8,6%9,8%
12,1%
15,4%15,1% 14,9%
30,9% 30,5%
34,2%
32,0%
29,6% 29,9%31,3% 31,4%
33,3% 33,7% 33,8%
36,7% 35,9%38,0%
42,3%
47,0%48,3% 47,7%
0%
5%
10%
15%
20%
25%
30%
35%
40%
45%
50%
2000 2001 2002 2003 2004 2005 2006 2007 2008 2009 2010 2011 2012 2013 2014 2015 2016 2017
Debt of the Non‐Financial Corporate Sector by Currency (% of GDP)
Debt in Local Currency Debt in Foreign Currency
Source: Banco de la República
30%
70%
47%
52%
11/07/2018
5
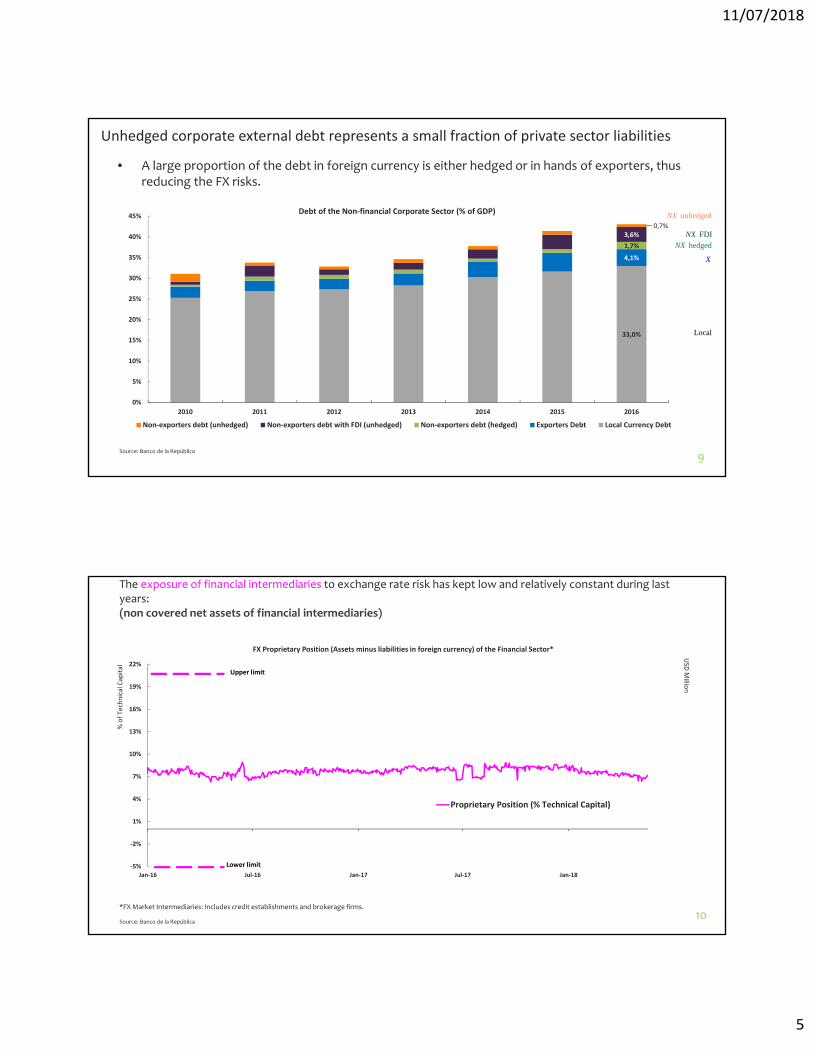
• A large proportion of the debt in foreign currency is either hedged or in hands of exporters, thus reducing the FX risks.
Source: Banco de la República
9
Unhedged corporate external debt represents a small fraction of private sector liabilities
33,0%
4,1%
1,7%
3,6%0,7%
0%
5%
10%
15%
20%
25%
30%
35%
40%
45%
2010 2011 2012 2013 2014 2015 2016
Debt of the Non‐financial Corporate Sector (% of GDP)
Non‐exporters debt (unhedged) Non‐exporters debt with FDI (unhedged) Non‐exporters debt (hedged) Exporters Debt Local Currency Debt
Local
X
hedgedNX FDINX
unhedgedNX
The exposure of financial intermediaries to exchange rate risk has kept low and relatively constant during last years: (non covered net assets of financial intermediaries)
*FX Market Intermediaries: Includes credit establishments and brokerage firms.
10Source: Banco de la República
‐5%
‐2%
1%
4%
7%
10%
13%
16%
19%
22%
Jan‐16 Jul‐16 Jan‐17 Jul‐17 Jan‐18
FX Proprietary Position (Assets minus liabilities in foreign currency) of the Financial Sector*
Proprietary Position (% Technical Capital)
% of Technical Capital
USD
Millio
n
Upper limit
Lower limit
11/07/2018
6
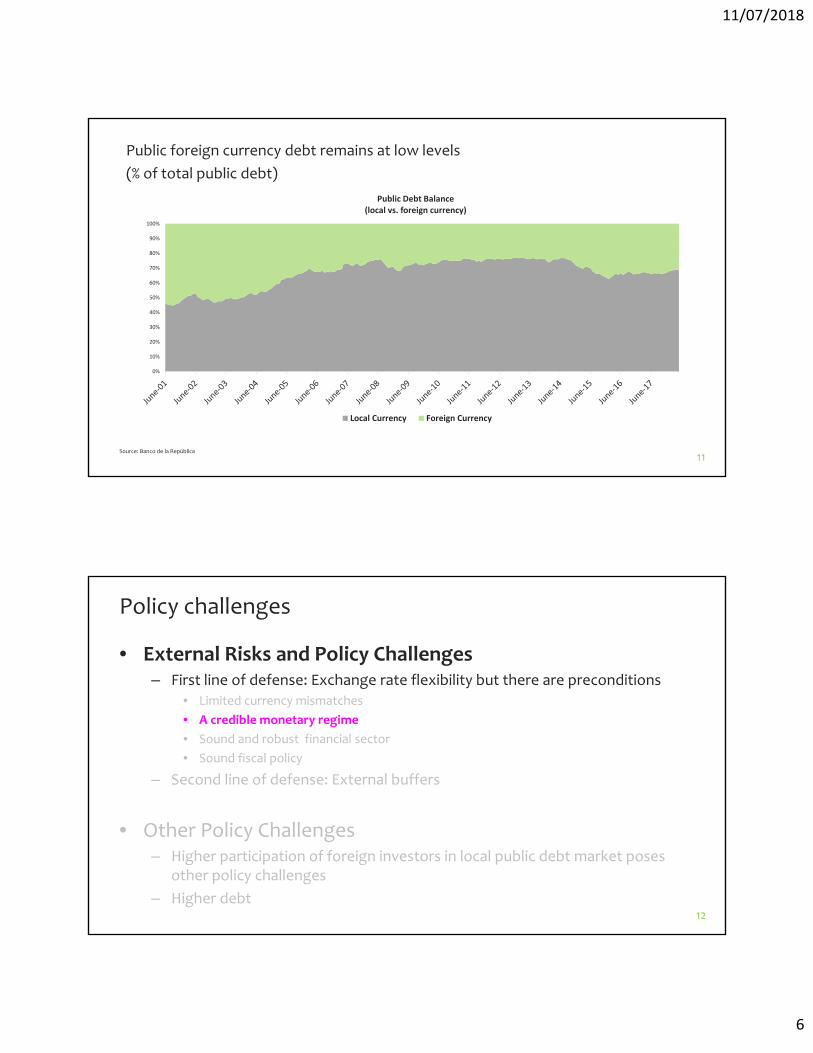
Public foreign currency debt remains at low levels
(% of total public debt)
Source: Banco de la República
11
0%
10%
20%
30%
40%
50%
60%
70%
80%
90%
100%
Public Debt Balance(local vs. foreign currency)
Local Currency Foreign Currency
Policy challenges
• External Risks and Policy Challenges – First line of defense: Exchange rate flexibility but there are preconditions
• Limited currency mismatches
• A credible monetary regime
• Sound and robust financial sector
• Sound fiscal policy
– Second line of defense: External buffers
• Other Policy Challenges– Higher participation of foreign investors in local public debt market poses
other policy challenges
– Higher debt12
11/07/2018
7
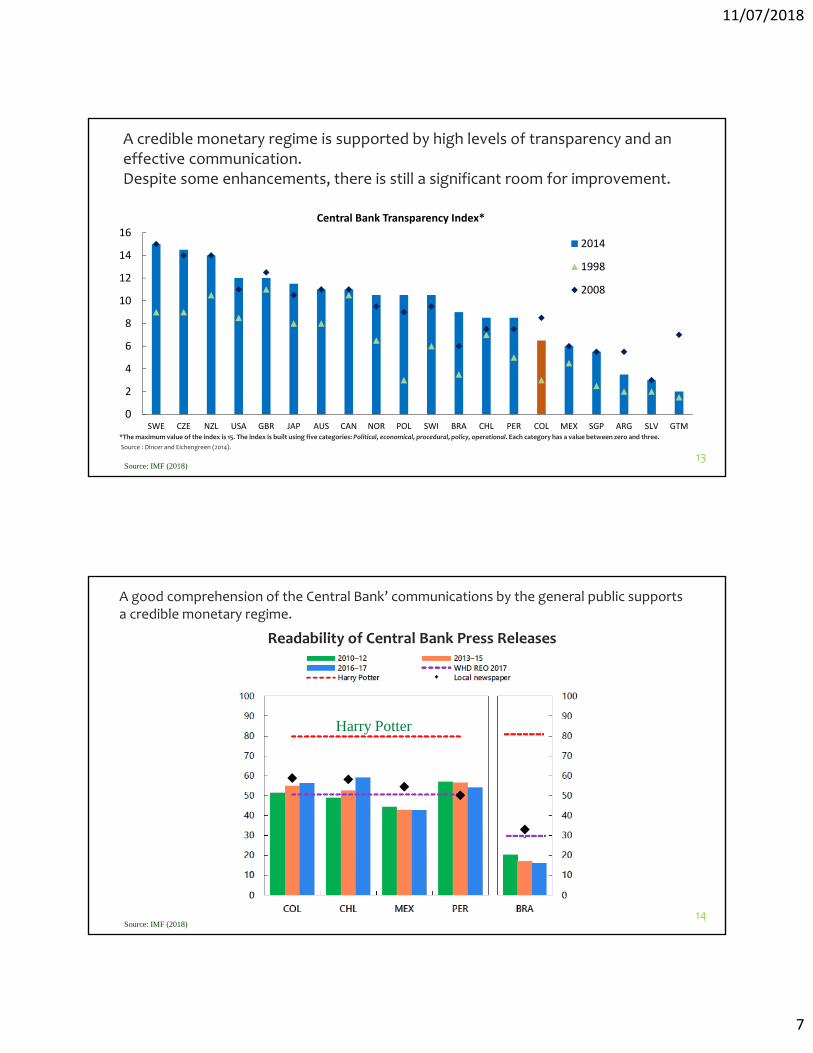
*The maximum value of the index is 15. The index is built using five categories: Political, economical, procedural, policy, operational. Each category has a value between zero and three.
Source : Dincer and Eichengreen (2014).
13
0
2
4
6
8
10
12
14
16
SWE CZE NZL USA GBR JAP AUS CAN NOR POL SWI BRA CHL PER COL MEX SGP ARG SLV GTM
Central Bank Transparency Index*
2014
1998
2008
A credible monetary regime is supported by high levels of transparency and an effective communication.Despite some enhancements, there is still a significant room for improvement.
Source: IMF (2018)
A good comprehension of the Central Bank’ communications by the general public supports a credible monetary regime.
14Source: IMF (2018)
Harry Potter
Readability of Central Bank Press Releases
11/07/2018
8
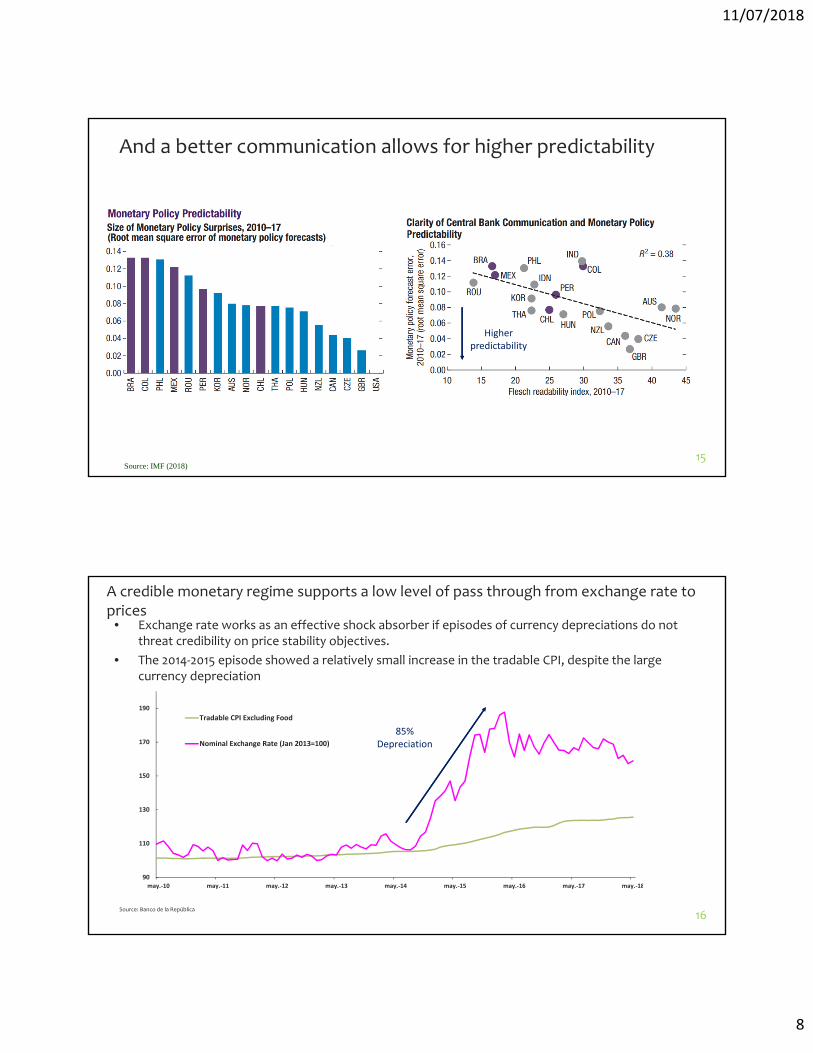
And a better communication allows for higher predictability
15Source: IMF (2018)
Higher predictability
• Exchange rate works as an effective shock absorber if episodes of currency depreciations do not threat credibility on price stability objectives.
• The 2014‐2015 episode showed a relatively small increase in the tradable CPI, despite the large currency depreciation
Source: Banco de la República
16
A credible monetary regime supports a low level of pass through from exchange rate to prices
90
110
130
150
170
190
may.‐10 may.‐11 may.‐12 may.‐13 may.‐14 may.‐15 may.‐16 may.‐17 may.‐18
Tradable CPI Excluding Food
Nominal Exchange Rate (Jan 2013=100)
85%Depreciation

11/07/2018
9
• Exchange rate works as an effective shock absorber if episodes of currency depreciations do not threat credibility on price stability objectives.
• The 2014‐2015 episode showed a relatively small increase in the tradable CPI, despite the large currency depreciation.
Source: Banco de la República
17
A credible monetary regime supports a low level of pass through from exchange rate to prices
7,9%
60,5%
‐15%
‐5%
5%
15%
25%
35%
45%
55%
65%
may.‐12 may.‐13 may.‐14 may.‐15 may.‐16 may.‐17 may.‐18
Tradables CPI Excl. Food (YoY Inflation)
Nominal Exchange Rate (% change YoY)
The low pass through could be partially accredited to the credibility of the inflation targeting regime. Therefore, improving communication and transparency is still one big challenge
Source: Banco de la República – Monthly Survey of Economic Expectations 18
4,50%
3,49%
0%
1%
2%
3%
4%
5%
6%
7%
8%
9%
10%
May‐10 May‐11 May‐12 May‐13 May‐14 May‐15 May‐16 May‐17 May‐18
Inflation Expectations
Median of 1‐year ahead expectations
Median of 2‐years ahead expectations
Inflation Target
Headline Inflation
2e1
e

11/07/2018
10
Policy challenges
• External Risks and Policy Challenges – First line of defense: Exchange rate flexibility but there are preconditions
• Limited currency mismatches
• A credible monetary regime
• Sound and robust financial sector
• Sound fiscal policy
– Second line of defense: External buffers
• Other Policy Challenges– Higher participation of foreign investors in local public debt market poses
other policy challenges
– Higher debt19
Source: Superintendencia Financiera de Colombia. Calculations by Banco de la República. 20
• Throughout the last few years, the Colombian banking system has kept solid liquidity and solvency indicators.• This has occurred despite the adjustment of the Colombian economy to negative external shocks. At the same
time, domestic regulation has contributed to building buffers for credit risk (e.g. dynamic provisioning) andliquidity risk.
333,65%342,15%
80%
120%
160%
200%
240%
280%
320%
360%
400%
440%
480%
Mar‐13 Sep‐13 Mar‐14 Sep‐14 Mar‐15 Sep‐15 Mar‐16 Sep‐16 Mar‐17 Sep‐17 Mar‐18
30‐Day Liquidity Coverage Ratio (LCR)
Total Depository Institutions
Banks
Minimum Requirement
LCR= Liquid Assets / net cash outflows over the next 30 days
15,79%
16,49%
8%
10%
12%
14%
16%
18%
20%
Mar‐12 Nov‐12 Jul‐13 Mar‐14 Nov‐14 Jul‐15 Mar‐16 Nov‐16 Jul‐17 Mar‐18
Total Solvency Ratio (Tier II)
Banks
Total Depository Institutions
Minimum Requirement
Total Solvency Ratio = Technical capital / weighted assets + (11.11)*Market Risk
Local banks are resilient to tighter external conditions

11/07/2018
11
Local banks are resilient to tighter external conditions II
• The latest stress test exercise simulates the effect of a full exit of foreign investors from domestic public/private debt marketstogether with a significant fall in GDP growth (1.3% for 2018).
• Under this extreme scenario the estimated cumulative losses would generate a reduction in Tier 1 Capital Ratio from 11,6% to 9,8% well above the regulatory minimum: 4,5%.
21
Policy challenges
• External Risks and Policy Challenges – First line of defense: Exchange rate flexibility but there are preconditions
• Limited currency mismatches
• A credible monetary regime
• Sound and robust financial sector
• Sound fiscal policy
– Second line of defense: External buffers
• Other Policy Challenges– Higher participation of foreign investors in local public debt market poses
other policy challenges
– Higher debt22
11/07/2018
12
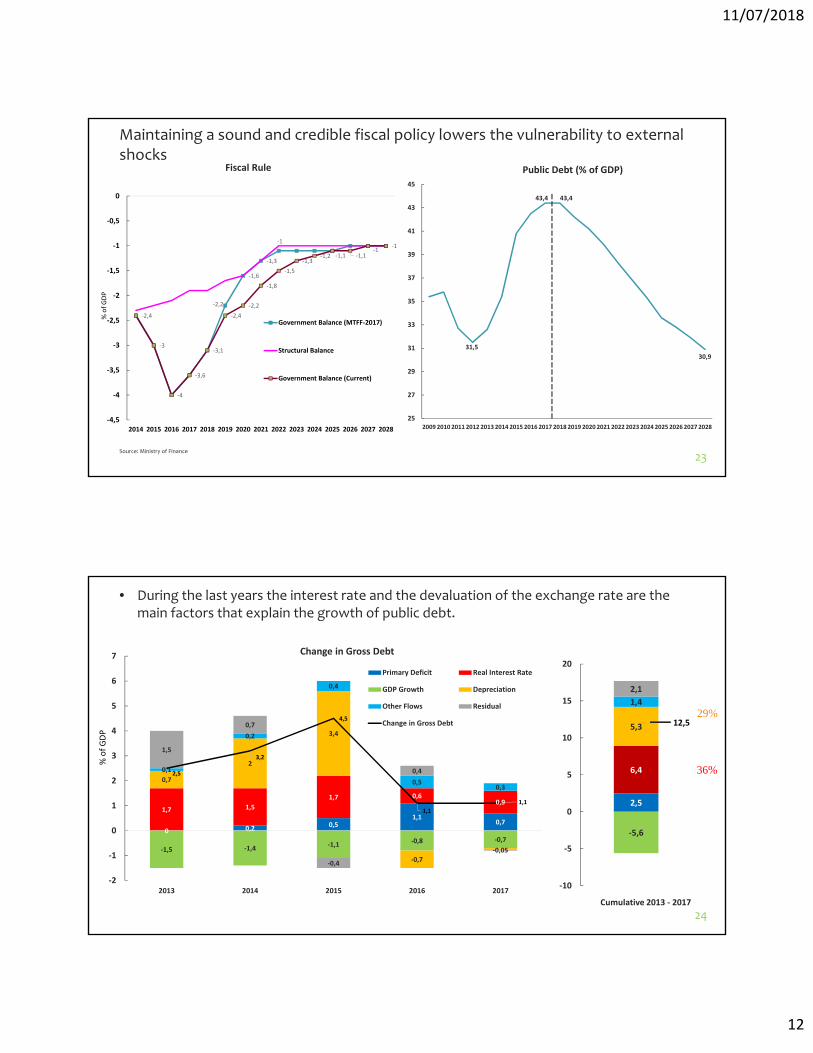
31,5
43,4 43,4
30,9
25
27
29
31
33
35
37
39
41
43
45
2009 2010 2011 2012 2013 2014 2015 2016 2017 2018 2019 2020 2021 2022 2023 2024 2025 2026 2027 2028
Public Debt (% of GDP)
Source: Ministry of Finance
‐2,2
‐1,6
‐1,3
‐1
‐2,4
‐3
‐4
‐3,6
‐3,1
‐2,4
‐2,2
‐1,8
‐1,5
‐1,3‐1,2 ‐1,1 ‐1,1
‐1‐1
‐4,5
‐4
‐3,5
‐3
‐2,5
‐2
‐1,5
‐1
‐0,5
0
2014 2015 2016 2017 2018 2019 2020 2021 2022 2023 2024 2025 2026 2027 2028
Fiscal Rule
Government Balance (MTFF‐2017)
Structural Balance
Government Balance (Current)
% of GDP
Maintaining a sound and credible fiscal policy lowers the vulnerability to external shocks
23
24
2,5
6,4
‐5,6
5,3
1,4
2,1
‐10
‐5
0
5
10
15
20
Cumulative 2013 ‐ 2017
12,5
0 0,2 0,51,1
0,7
1,7 1,5
1,7 0,60,9
‐1,5 ‐1,4‐1,1 ‐0,8 ‐0,7
0,7
2
3,4
‐0,7
0,1
0,2
0,4
0,50,3
1,5
0,7
‐0,4
0,4
‐0,05
2,5
3,2
4,5
1,1
1,1
‐2
‐1
0
1
2
3
4
5
6
7
2013 2014 2015 2016 2017
Change in Gross Debt
Primary Deficit Real Interest Rate
GDP Growth Depreciation
Other Flows Residual
Change in Gross Debt
% of GDP
• During the last years the interest rate and the devaluation of the exchange rate are the main factors that explain the growth of public debt.
29%
36%

11/07/2018
13
Debt levels have increased but remain below critical levels.
*Annual Moving Average (30% is considered risky and 40% vulneragle)
Source: Banco de la República 25
17,4
14
15
16
17
18
19
20
ene.‐12 ene.‐13 ene.‐14 ene.‐15 ene.‐16 ene.‐17 ene.‐18
(%) Households’ Financial Burden(Interest and Capital payments / Income)*
Total Solvency Ratio = (Interest payments + capital payments) / Monthly Income
Source: Superintendencia Financiera. Calculations by Banco de la República
-5%
0%
5%
10%
15%
20%
25%
30%
0
50
100
150
200
250
ago.-08 feb.-10 ago.-11 feb.-13 ago.-14 feb.-16 ago.-17
Composition and Real Annual Growth Rate of Households' Indebtedness
Consumption Mortgages Indebtedness Real Annual Growth Rate (RHS)
Policy challenges
• External Risks and Policy Challenges – First line of defense: Exchange rate flexibility but there are preconditions
• Limited currency mismatches
• A credible monetary regime
• Sound and robust financial sector
• Sound fiscal policy
– Second line of defense: External buffers
• Other Policy Challenges– Higher participation of foreign investors in local public debt market poses
other policy challenges
– Higher debt26

11/07/2018
14
A sufficient level of external buffers provides another safeguard against external shocks. The Flexible Credit Line (FCL) by the IMF has complemented the accumulation of international reserves.
*A ratio between 1 and 1.5 is considered adequate
Source: IMF. 27
0% 100% 200% 300% 400% 500% 600% 700%
Argentina
Turkey
Malaysia
South Africa
Chile
Poland
Mexico
Colombia (without FCL)
India
Colombia (with FCL)
Indonesia
Brazil
China
Philippines
Peru
Korea
International Reserves to Short‐term Debt and CurrentAccount Balance
0
0,5
1
1,5
2
2,5
3
3,5
2000 2001 2002 2003 2004 2005 2006 2007 2008 2009 2010 2011 2012 2013 2014 2015 2016 2017 2018 2019
Ratio of Reserves/ARA Metric*
Chile Colombia Mexico Peru
Policy challenges
• External Risks and Policy Challenges – First line of defense: Exchange rate flexibility but there are preconditions
• Limited currency mismatches
• A credible monetary regime
• Sound and robust financial sector
• Sound fiscal policy
– Second line of defense: External buffers
• Other Policy Challenges– Higher participation of foreign investors in local public debt market
poses other policy challenges
– Higher debt28

11/07/2018
15
Source: Banco de la República29
0%
5%
10%
15%
20%
25%
30%
jun.‐13 jun.‐14 jun.‐15 jun.‐16 jun.‐17 jun.‐18
% Offshore investors (TES) / Total outstanding
% Offshore investors (UVR inflation linked bonds) / Total outstanding
The development of the public debt market came hand on hand with an increased participation of foreign investors, particularly in recent years. This increase was mainly driven by the reduction of withholding tax for offshore investors (from 33% to 14% ) and the increase of Colombian debt weight in the JP Morgan’s GBI index since 2014.
The higher presence of offshore investors in Colombia goes in line with the experience of other emerging markets.
Source: IMF WP ‐ Arslanalp and Tsuda (2017)30
28%
43%
0%
10%
20%
30%
40%
50%
60%
2004
2005
2006
2007
2008
2009
2010
2011
2012
2013
2014
2015
2016
2017
Brazil
Colombia
Mexico
Peru
39%
0%
10%
20%
30%
40%
50%
60%
2004
2005
2006
2007
2008
2009
2010
2011
2012
2013
2014
2015
2016
2017
China
India
Indonesia
Malaysia
Philippines
Thailand
34%
0%
10%
20%
30%
40%
50%
60%
2004
2005
2006
2007
2008
2009
2010
2011
2012
2013
2014
2015
2016
2017
Hungary
Lithuania
Poland
Romania
41%
0%
10%
20%
30%
40%
50%
60%
2004
2005
2006
2007
2008
2009
2010
2011
2012
2013
2014
2015
2016
2017
Russia
South Africa
Turkey
Ukraine
Foreign Holdings of Local‐Currency EM Government Debt Securities (% of total)
11/07/2018
16
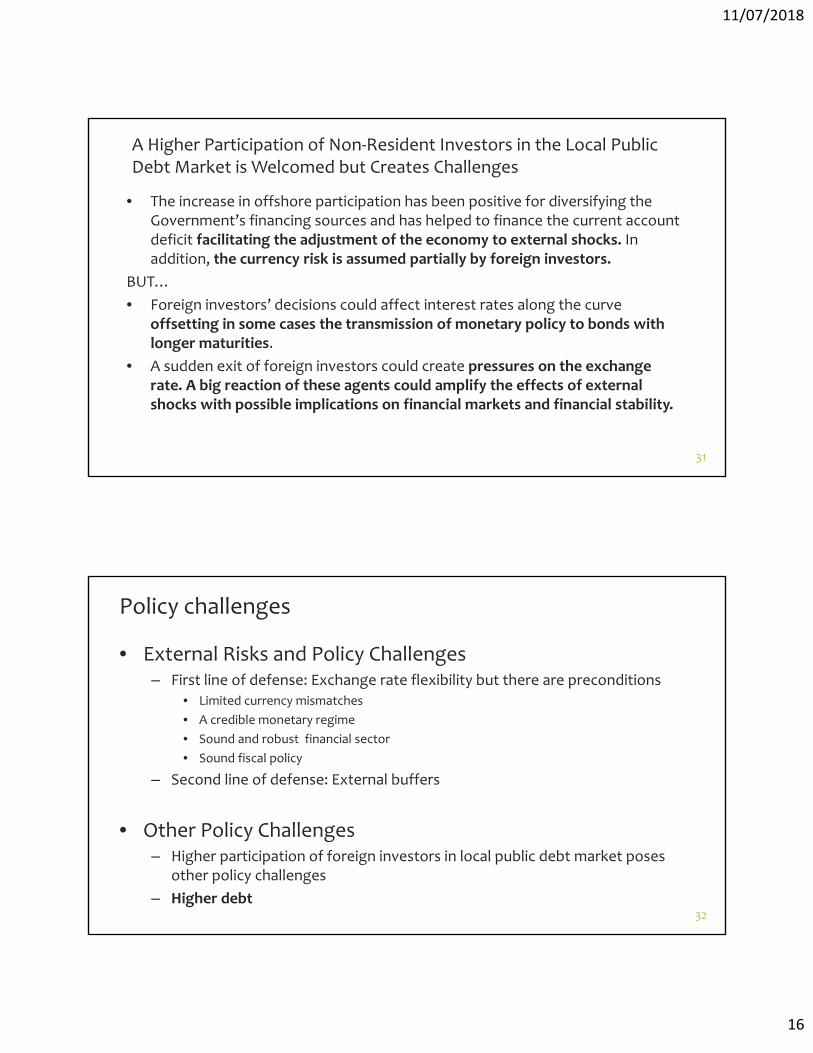
• The increase in offshore participation has been positive for diversifying the Government’s financing sources and has helped to finance the current account deficit facilitating the adjustment of the economy to external shocks. In addition, the currency risk is assumed partially by foreign investors.
BUT…
• Foreign investors’ decisions could affect interest rates along the curve offsetting in some cases the transmission of monetary policy to bonds with longer maturities.
• A sudden exit of foreign investors could create pressures on the exchange rate. A big reaction of these agents could amplify the effects of external shocks with possible implications on financial markets and financial stability.
31
A Higher Participation of Non‐Resident Investors in the Local Public Debt Market is Welcomed but Creates Challenges
Policy challenges
• External Risks and Policy Challenges – First line of defense: Exchange rate flexibility but there are preconditions
• Limited currency mismatches
• A credible monetary regime
• Sound and robust financial sector
• Sound fiscal policy
– Second line of defense: External buffers
• Other Policy Challenges– Higher participation of foreign investors in local public debt market poses
other policy challenges
– Higher debt32

11/07/2018
17
Thanks
33
Debt levels in Colombia have increased in last years but the size of the credit expansion is below international averages. Financial depth is still low relative other EME.
Source: Bank for International Settlements 34
0%
20%
40%
60%
80%
100%
120%
140%
160%
180%
Apr‐05 Apr‐08 Apr‐11 Apr‐14 Apr‐17
Total Credit to Non‐Financial Private Sector(ratio to GDP)
Emerging markets (aggregate) Advanced economies (aggregate)
Colombia Chile
Mexico Malaysia
Thailand
0%
20%
40%
60%
80%
100%
120%
140%
160%
Mar‐05 Mar‐08 Mar‐11 Mar‐14 Mar‐17
Credit‐to‐GDP gaps(% of GDP)
Colombia Chile Argentina Brazil Mexico Malaysia Thailand
11/07/2018
18
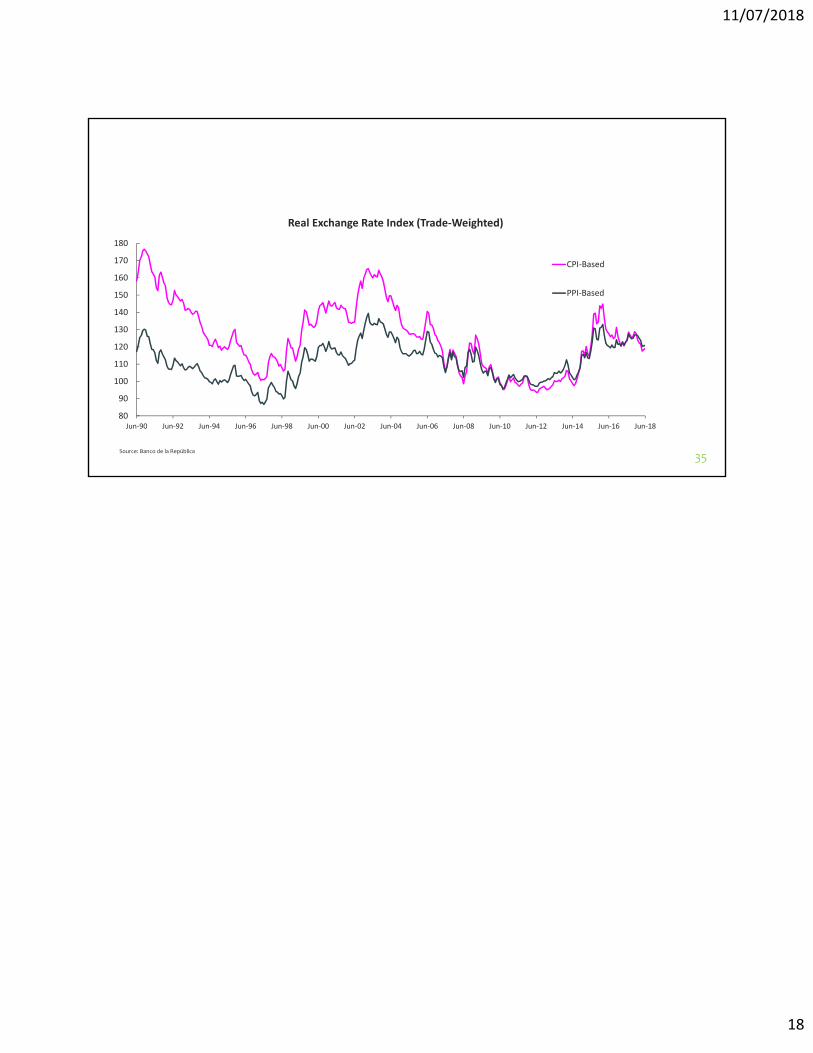
Source: Banco de la República
35
80
90
100
110
120
130
140
150
160
170
180
Jun‐90 Jun‐92 Jun‐94 Jun‐96 Jun‐98 Jun‐00 Jun‐02 Jun‐04 Jun‐06 Jun‐08 Jun‐10 Jun‐12 Jun‐14 Jun‐16 Jun‐18
Real Exchange Rate Index (Trade‐Weighted)
CPI‐Based
PPI‐Based