monetary policy review - world banksiteresources.worldbank.org/psglp/resources/... · the monetary...
TRANSCRIPT
Monetary Policy Review
Volume 1, Number 1 October 2005
Policy Analysis Unit (PAU) Research Department
Bangladesh Bank Head Office, Dhaka, Bangladesh
(www.bangladeshbank.org.bd) (www.bangladesh-bank.org)
Policy Analysis Unit (PAU)

MPR_06_01
i
Monetary Policy Review** Volume 1, Number 1
October 2005
Copyright © 2005 by Bangladesh Bank
* The Bangladesh Bank (BB), in cooperation with the World Bank Institute (WBI), has formed the Policy Analysis Unit (PAU) within its Research Department in July 2005. The aim behind this initiative is to upgrade the capacity for research and policy analysis at BB. As part of its mandate, PAU will prepare and publish, among other, the Monetary Policy Review on a bi-annual basis. However, neither the Board of Directors nor the management of the Bangladesh Bank, nor of WBI, nor any agency of the Government of Bangladesh nor the World Bank necessarily endorses any or all of the views expressed in these documents. The latter reflect views based on professional analysis carried out by the staff of the Policy Analysis Unit, and hence the usual caveat as to the veracity of research reports applies.
** http:// www.bangladesh-bank.org/research/pau/mpr_06_01 or, www.bangladeshbank.org.bd/research/pau/mpr_06_01
Policy Analysis Unit (PAU)*

MPR_06_01
ii
Dr. Salehuddin Ahmed Governor
Message from the Governor It gives me great pleasure to announce the launching of the Monetary Policy Review (MPR), first of its kind in the Bangladesh Bank. The MPR is designed to present a brief but comprehensive view of the real and monetary developments during the immediate past several quarters, and project the expected developments in the immediate future. In fact, in a rapidly globalizing environment, market participants' understanding of the conduct of monetary policy and its impact on the behaviour of real economy is a growing need in order to reduce uncertainties and make decision making smoother. The publication of the MPR is going to mark a major step forward in this direction. The present volume being the first of the series is somewhat lengthy because it incorporates a historical update of macroeconomic developments obtaining in the country over the recent past and it also deals in detail with sectors other than the financial sector. The future volumes to be published on a bi-annual basis (in October and April of each calendar year) will be shorter and in concise form incorporating developments in the monetary and the real sectors of the economy.
I am impressed both at the coverage and the depth of analysis contained in this Review. I thank the Policy Analysis Unit (PAU) Team Leader and his colleagues for this. Given that the PAU had to complete their analysis in a relatively short time, I am most hopeful that the next version will improve upon the present effort.
I hope that the information and analysis contained in this Review will be beneficial to policy makers, market participants, researchers as well as public in general, both within Bangladesh and abroad. October 31, 2005 (Dr. Salehuddin Ahmed)
Governor
MPR_06_01
iii
Preface
The Bangladesh Bank (BB) and the World Bank Institute (WBI) have initiated a project, ‘Partnership for Excellence in Research and Policy Analysis at the Bangladesh Bank’ which aims to upgrade the capacity for research and policy analysis at the Bangladesh Bank, the Central Bank of Bangladesh. The objective of this program is to create a new group, Policy Analysis Unit (PAU) that will focus on conducting quality research and policy analysis. Such a group would help the Central Bank devise better policies. It would also assist the Central Bank in its role as an advisor to the Government on economic and fiscal policy issues.
As part of the efforts to raise internal capability of the Bangladesh Bank for economic policy analysis, a number of new policy documents will have to be written and published by the Unit on a regular basis under the guidance of the Resident Economic Advisor. Prominent among these is the Monetary Policy Review (MPR) to be published bi-annually. Since assuming this position in late July, it is my pleasure to present the first issue of MPR that has been prepared by the new Unit under a number of challenging circumstances. The entire research staff of PAU, which is only a fraction of the full strength once the recruitment drive concludes, has worked very hard and with dedication to complete this report within a fairly short time (less than two months). I am most grateful to them all. The members are:
Dr. Md. Akhtaruzzaman, Senior Research Economist Dr. Md. Habibur Rahman, Senior Research Economist Dr. Sayera Younus, Research Economist Md. Kabir Ahmed, Research Economist Md. Shahiduzzaman, Research Economist Mainul Islam Chowdhury, Research Economist
In this task we have received wholehearted cooperation from WBI and BB. In particular we are grateful to Governor Dr. Salehuddin Ahmed, Deputy Governor M. A. M. Kazemi, and Dr. Anwar Shah of WBI for advice and encouragement. Deputy Governors M. A. M. Kazemi, Md. Nazrul Huda and Muhammad A. Ali, Executive Director Ziaul Hassan Siddiqui, Economic Advisor Habibullah Bahar, Advisor to the Governor Dr. Shahabuddin M. Hossain, and Executive Director K.M. Jamshed uz Zaman were each kind enough to read part or all of the document and provide constructive comments on the manuscript for which we remain most indebted. The members of the PAU are responsible for any errors and shortcomings, and hope to improve the quality of the Review with comments and suggestions from all concerned.
Dhaka, Bangladesh Syed M. Ahsan, Ph D October 31, 2005 WBI Resident Economic Advisor
MPR_06_01
iv
Monetary Policy Review Volume 1, Number 1
October, 2005 List of Contents
• Message from the Governor iii • Preface v • List of Contents vii • Overview and Executive Summary 01 1. The Monetary Policy Framework of the Bangladesh Bank 13 2. Developments in Aggregate Demand 25
2.1 Domestic Demand 25 2.2 Exports & External Demand 30 2.3 Imports 37 2.4 Current Account Balance 41
3. Monetary and Financial Developments 47 3.1 Short-term Interest Rates and Bond Yields 47 3.2 Long-term Rates and Inflation 50 3.3 Money Supply and Credit 58 Market Developments 3.4 Financing of Public Debt and Inflation 67 3.5 The Foreign Exchange Market 72 3.6 The Debt and Equity Markets 74
4. Supply Side Developments 79 4.1 Agriculture 79 4.2 Investment in Productive Capacity and its Utilisation 84 4.3 Employment, Labour Productivity and Wage Inflation 93 4.4 Cost Behaviour, and Consumer Price Inflation 96
5. Macroeconomic Outlook for FY 06 101 5.1 Domestic Demand 101 5.2 Net Trade 104 5.3 Exchange Rate Outlook 107 5.4 Price Stability 108
6. Monetary Policy Stance Going Forward 113 • Appendix: Press Release 117 • Boxes
Box 1.1 Flow Chart: Monetary Policy Framework 20 Box 3.1 Estimation Results 56 Box 3.2 A Comment on the Interest Rate Spread
in Bangladesh 65 Box 3.3 Monetary Policy and Islamic Banking in Bangladesh 68 Box 4.1 Agricultural Growth Projection for FY06 83

MPR_06_01
1
Monetary Policy Review Volume 1, Number 1
October, 2005
Overview and Executive Summary1
A. The Monetary Policy Framework
1. This being the first issue of the Monetary Policy Review of the Bangladesh Bank (BB), it is relevant that the monetary policy framework (in terms of the goals, the instruments, and the analytic channels of transmission) be articulated for greater clarity and transparency benefiting both the policy makers as well as the stakeholders. A policy regime, where the goals are transparent and their achievement verifiable, would directly add to the credibility of the central bank. A major objective of this document is to delineate such a framework.
2. It ought to be stressed that while the overriding concern in a mature economy is to keep output and employment close to the long-run potential (“the natural rate”), the challenge in the developing world is how to augment the capacity output through both productivity growth as well as via the installation of additional capacity. Faster growth in most developing contexts is necessary to reduce (and eventually eliminate) endemic poverty. Available evidence leads one to doubt if a country may rely on the low inflation environment alone to reach the poverty and output growth targets as for example envisioned in the National Strategy for Accelerated Poverty Reduction (NSAPR) approved recently (Government of Bangladesh, GOB, 2005).
3. The appropriate monetary policy strategy in the Bangladesh context is to achieve the goals of (a) price stability , (b) sustained and stable output growth. While these goals overlap and there is a need for policy coordination in order to attain the goals, monetary policy must play its due role. Recently the practice has been to situate both the monetary as well as fiscal policy parameters within a medium term (3-year) macroeconomic framework (MTMF), which enshrines the mutual consistency of the monetary and fiscal policies of the nation. Annual updates of the growth and inflation targets, and thus the parameters of mutually consistent monetary and fiscal programs must be based on sound forecasts of the level of consumer demand, investment, and the balance of payments (BOP) developments.
4. Accepting the view that a suitable core inflation measure ought to be the central focus, e.g., something between the non-food CPI and the full CPI, the question is where should the Bangladesh Bank set the target in the context? It is argued here that the Bangladesh Bank set its medium-term indicative mid-point target for a suitably defined core inflation at 5 percent (i.e., a band of 4 to 6 percent), which ought to allow enough flexibility to deal with a range of economic contingencies.
5. Exchange rate stability is a necessary part of maintaining overall monetary stability. However with the currency now successfully floating
1 Complied and edited by the Resident Economic Advisor.

MPR_06_01
2
Overview and Executive Summary (continued)
(since May 2003), the currency markets determine the equilibrium value of the Taka. The Central Bank does retain the residual mandate to ensure an orderly adjustment in the exchange rate in response to short -term events. It may be noted that the currency’s real effective exchange rate (REER) has maintained external competitiveness over the past decade or so.
6. In terms of the actual conduct of monetary policy, the Bangladesh Bank pursues its monetary policy within a framework of monetary targeting with reserve money as the operating target, and broad money as an intermediate target. BB programs the required limit of monetary expansion, M2 in this case, based on estimates of GDP growth, CPI and changes in income velocity of money. The GDP and inflation targets are in turn taken from the MTMF. In the Bangladesh monetary program, M2 was set to grow at 14.2 percent in FY’05 (i.e., to end June), but the actual provisional growth stood at 16.7 percent. Data for FY’04 shows that year-on-year actual growth had also been greater than the targeted rate (13.8 as against 11.9). The FY06 projected M2 growth rate has been set at 14.3 percent, which is somewhat lower than the immediate past experience. The corresponding reserve money growth for FY’05 stood at 12.5 percent.
7. In order to reinforce indirect monetary operation and to manage the day-to-day liquidity position in the market, Bangladesh Bank has introduced several new arrangements in recent years namely repo (repurchase agreement), reverse repo and interbank repo operations from July 2002, April 2003 and July 2003, respectively, while money at call still remains at the core of overnight money market in Bangladesh. The repo/reverse repo/T-bill auctions would in turn have an impact on the inter-bank call money rate. Control over liquidity may also be effective in influencing the market for foreign currency, and hence the short term equilibrium value of the exchange rate.
8. In order to refine the understanding of the policy framework and the associated transmission mechanisms, some rigorous empirical investigations need to be initiated on an urgent basis. Issues of the estimation of a stable money demand function in Bangladesh, an in-depth investigation of money-inflation relationship, and the interest rate sensitivity of aggregate demand components (mainly private investment and consumption) need to be reviewed afresh. These developments will be discussed in a future issue of this report.
B. Developments in Aggregate Demand
9. Domestic Demand: Real GDP growth is provisionally estimated to be 5.4 percent in FY05 which is 0.9 percentage points lower than the previous year's growth. The growth appear to have slowed down mainly due to some adverse domestic and external shocks notably the floods in July-August 2004, the sharp increase in the world prices of oil and oil products, and the abolition of textiles quota following the multi-fibre agreement (MFA) phase-out in January 2005.
10. The structure of the economy has been steadily evolving reflecting shifts in tastes, opportunities, and technological innovations. Share of agriculture in GDP decreased gradually over the years from 25.03 percent of total GDP in FY 01 to 21.91 percent in FY05. Share of
MPR_06_01
3
Overview and Executive Summary (continued)
industry on the other hand increased every year, from 26.2 percent in FY01 to 28.44 in FY05. Service sector has the highest share of GDP reaching 49.65 percent in FY 05.
11. Disposable income and private consumption are estimated to have grown at the rate of 6.27 percent and 4.41 percent respectively in FY05, which are consistent with the average growth of 5.67 percent and 4.41 percent respectively during the last five years.
12. Even though the growth of government consumption expenditure slowed down in FY05, its share in GDP has steadily climbed from 4.51 percent in FY01 to 5.62 percent in FY05. Average annual development plan (ADP) expenditure during the last five years has been 89 percent of the revised allocation. The government revenue collection however grew in FY05 by nearly one-percentage point to 10.6 from 9.8 percent of GDP in FY04 (revised figure). Both revenue and government expenditure appear to increase at a much faster rate in the fourth quarter of each fiscal year reflecting a strong seasonality, which if not smoothened, would continue to lead to a mismatch with the time pattern of spending requirements.
13. Gross capital formation (in real terms) has been estimated to have grown at the rate of 9.2 percent in FY05, which is marginally higher than that of the last year. The public investment growth has been 2.91 percent which, while much lower than the 13.12 percent figure of the previous year, is close to the recent experience. Private investment accounts for over 75 percent of the economy-wide investment. The latter is estimated to have grown at the rate of 11.5 percent in FY 05, a little higher than the average growth rate during the last five years, and was broad based across an array of industries. The percentage share of investment to GDP has reached 27.04 percent during FY05 from 26.09 percent in FY 04.
14. Exports and External Demand : The Bangladesh economy is increasingly open and the value of her exports was equivalent to about 15 percent of its output in FY05. However, Bangladesh’s export basket is rather narrow; for instance, RMG’s share alone has been more than 75 percent in recent years. Further the principal destinations are also limited; USA (about 28 percent in FY05) and the Euro area (about 50 percent in FY05) make up the bulk of national exports.
15. In FY05 Bangladesh’s overall exports grew by about 14 percent, which is above the trend growth rate during the 25 years period (1980-2005). However, starting January 2005, world-wide removal of apparel quota exerted competitive pressure on the RMG export, and the impact is already evident in that the FY05 annual growth was 12.65 percent as against 15.81 percent in FY04. Moreover, the growth was a mere 1.7 percent for the woven garments category.
16. The other component of RMG is knitwear, which experienced surprisingly but significantly higher year-on-year growth (more than 31 percent) in FY05. Knitwear is an area where Bangladesh appears to have gained a competitive advantage vis-à-vis other exporters, which is not evident in the case of the woven sub-sector. Knit wears also embody a higher level of domestic value addition than for woven products, which is a very positive development.
MPR_06_01
4
Overview and Executive Summary (continued)
17. Imports: Bangladesh imports experienced a robust growth of 21 percent during FY 05 (in value terms). The three major elements that fuelled this growth were the external shock via the international oil price accompanied by growing domestic demand for petroleum, shortage of food grains in the domestic economy due to the flood in 2004, and strong domestic demand for capital machinery particularly in the RMG sector. The import growth was evidently facilitated by the high demand for domestic credit, which grew by 17.53 percent over the year. Given the large import share (12 percent) of “petroleum, oil and lubricants” (POL), it alone explained one quarter of the increase in total value of imports. On the other hand, import of food grains and capital machinery grew by 33.18 and 53 percent, respectively.
18. Current Account Balance: The current account balance (CAB) swung from a continuous run of surpluses from FY02 to FY04 into a modest deficit during FY05. In fact, the current account recorded a deficit of USD 557 million in FY05 compared to a surplus of USD 176 million in FY04. A major expansion of imports, against a modest gain in exports due to the competitive pressure from China and India in RMG exports, substantially contributed to this outcome.
19. Among the four main components of the Current Account, service account (net) remained stable while both the trade balance and the income account (net) showed further deterioration. Current transfers registered a significant growth of 14.6 percent in FY05. Slowdown of growth of RMG exports (from 15.81 percent in FY04 to 12.65 percent in FY05) and strong growth of imports (20.58 percent in FY05 from 12.58 percent in FY04) caused trade deficit to widen by 42.2 percent in FY 05. Significant outflow of investment income and modest growth in interest payments on external debt caused further deterioration of the Income Account (outflow increasing by USD 266.7 million from the FY04).
20. While Bangladesh experienced a sizeable current account deficit in FY05 starting in the second quarter, correspondingly the currency experienced a marked depreciation against USD and other currencies. The depreciation (of about 6 percent) occurred mainly during Dec’04 –Feb’05 in response to the demand pressures, BDT remaining stable during the March-June’05. The extent of the depreciation would have been sharper but for monetary tightening and some net sales of foreign reserves on the part of BB.
C. Monetary and Financial Developments
21. Short-term Interest Rates and Bond Yields: In outlining the monetary and financial developments, Chapter 3 reports both short-term and long- term behaviour of the money market in Bangladesh. It contains a comprehensive discussion on the shape and movement of yield curves in Bangladesh. Although based on data on primary issues, the yield curve provides useful information regarding monetary policy stance of the Bangladesh Bank. It can be observed that the curve first substantially shifted down in 2004 from the 2003 level, and has since moved back up reflecting a shift in the monetary policy stance of BB starting in the third quarter of FY05. The tighter policy regime was necessary in order to cope with the pressures relating to the price and balance of payments (BOP) situations.

MPR_06_01
5
Overview and Executive Summary (continued)
22. In the first and second quarters of FY 05, the average 1-2 day repo rates were 4.9 and 4.6 percent respectively, while the 1-2 day interbank repo rates were 3.8 and 4.4 percent, respectively, and the call money rates were 5.2 and 6.4 percent, respectively. These rates moved up to 8.36, 12.4 and 12.7 percent, in the respective order, in the third quarter of FY05, and to 8.11, 11.2, and 11.3 percent, respectively, in the fourth quarter of FY05. These repo and reverse repo tools have proved useful in influencing the overnight money market in Bangladesh.
23. Long-term Rates and Inflation: This Review identifies the relationship between the long-term nominal interest rate and inflation in Bangladesh (Ch 3). In Bangladesh, the bond market is still in a rudimentary stage. For the purposes of this document, long-term interest rates are taken to refer to representative low-risk government treasury bills with a maturity of about 364-days and longer, namely, 2-years and 5-years. Yields on 5-year and 10-year Bangladesh Government Treasury Bonds (BGTB) are also taken as measures of long-term interest rates. In the face of upward inflationary pressure the yield on treasury bills (e.g., 364-day and 2-year) were raised from 6.31 and 6.99 percent, respectively, as of end June 04 to 7.00 and 7.18 percent, respectively, as of end June 05. The yield on 5-year treasury bonds also rose from 8.00 percent as of end June 04 to 8.75 percent as of end June 05, while the yield on 10-year bonds decreased slightly from 10 percent in FY04 to 9.93 percent in FY05.
24. Money Supply and Credit Market Developments: During the period from FY94 to FY05, monetary policy was cautiously accommodative with the objective of raising the rate of economic growth by ensuring adequate credit flow for productive pursuits. Broad money supply (M2) growth rose from 13.84 percent in FY04 to 16.7 percent in FY05 mainly resulting from the increase in net domestic assets (NDA). An analysis of the components of broad money (M2) shows that currency growth moved up from 13.81 percent in FY04 to 17.04 percent in FY05. Growth of demand and time deposits also rose from 13.91 and 13.78 percent in FY04, respectively, to 15.31 and 16.89 percent, respectively, in FY05. During FY05 private sector credit demand registered a growth of 16.8 percent as against 14.02 percent growth experienced in FY04.
25. The steady growth of the M2-to-GDP ratio is a welcome development recorded during the last few years. The higher monetary expansion during this period coupled with low inflation, reflects higher monetization of the economy and suggests increasing financial sector intermediation of economic activities. The liquidity preference of the economy, as measured by the M1 to M2 ratio, which was on a slight upward trend during FY94 to FY97, started to decline secularly since FY96 and stood at 0.23 in FY05 from 0.31 in FY93. The decrease in M1/M2 ratio is in part due to a decrease in the demand for holding currency or demand deposits. A significant development over the last few years is the gradual decrease in the currency to deposit (C/D) ratio, which also suggests increased intermediation through the banking system. This lower currency demand since FY95 in turn reflects increased financial innovations such as ATM, credit and debit cards.

MPR_06_01
6
Overview and Executive Summary (continued)
26. Equity Market: Although the overall capital market in Bangladesh has recovered from the damage done by the stock market bubble and its collapse in the mid-nineties, additional groundwork is called for. The regulatory framework aimed at ensuring financial transparency, preventing financial malpractice and any form of market manipulation would require further embellishment. Strengthening both the Securities and Exchange Commission’s (SEC) general supervision of public companies as well as Bangladesh Bank’s supervision of banks and financial institutions would add to the positive public perception and confidence in the capital market. Some of this new found confidence is already evident from the major indicators of the equity market (both the primary as well as the secondary market) in Bangladesh in recent years.
27. In the primary market, eight companies raised new equity of Taka 1.2 billion in FY05 as against Taka 2.4 billion raised by ten companies in FY04 where over-subscription in both the years has been a usual phenomenon. In the secondary market, on the other hand, the value of total issued equity and debt of all listed securities in the Dhaka Stock Exchange was Taka 66.4 billion in FY05 as compared with Taka 49.0 billion in FY04. Market capitalization inclusive of new issues grew by more than 50 percent in FY05 in both the stock exchanges. The rate of growth in all-share price index in the Dhaka and Chittagong Stock Exchanges (29.9 percent and 46.0 percent respectively) in FY05 were much higher than the nominal GDP growth rate, clearly sufficient to provide a cover for risk aversion to many.
28. The Foreign Exchange Market: Bangladesh followed a fixed exchange rate regime for most of the 1970s, and switched to a pegged exchange rate system in 1979 against a trade-weighted basket of currencies acting as a benchmark. However the rate setting proved hard to manage as the real exchange rate remained overvalued through most of the 70s and 80s. This led to the necessity of frequent adjustments and structural difficulties in the current account, and consequent quantitative controls and other restrictions on the flow of goods and currency continued to distort consumption and production behaviour. In May 2003, Bangladesh successfully adopted the market based floating exchange rate system, which has since allowed adjustments of the exchange rate to changing market fundamentals in an autonomous fashion.
29. While the floating currency is expected to find its own equilibrium level, short-term fluctuations are inevitable, and accordingly, the Bangladesh Bank undertakes to ensure that these need not be destabilizing. Indeed in recent months, as noted above, the foreign exchange market in Bangladesh witnessed some pressure on the Taka-Dollar exchange rates resulting from a relatively faster growth in the import bills (mainly due to the exceptionally high cost of oil imports) than that of combined export earnings and workers’ remittance flows. The (weighted) average Taka-Dollar exchange rate increased to BDT 63.48 at the end March’05 from 59.89 at the end November’04. The rate had stabilized to 63.75 by end June’05 (vis -à-vis 60.45 at the end of June’04), thus reflecting about 5 percent depreciation of the Taka against the US Dollar during FY05.
MPR_06_01
7
Overview and Executive Summary (continued)
30. With a view to mitigating the mismatch between the supply and demand for foreign exchange during the episode cited above, the Bangladesh Bank intervened by selling a sizeable amount of foreign currency in the foreign exchange market. BB sold about USD 459.5 million as against the purchase of only USD 70.1 million in FY05. Earlier there were substantial net purchases of foreign currency in FY03 and FY04. Besides intervening in the market, BB adopted a tighter monetary policy stance which included an increase in the cash reserve ratio to 4.5 percent (from 4.0) effective March 1, 2005, which too was intended to bring about currency stability.
D. Supply Side Developments
31. Agriculture: Chapter 4 observes that in the agricultural sector, crop production is estimated to have decreased in FY05 due to devastating floods, which caused the overall agricultural sector growth to decline to a mere 0.3 percent for the year against a 4.1 percent figure in FY04, and 3.1 percent in FY03. The low agricultural growth caused the overall FY05 GDP growth to be reduced to 5.4 percent vis-à-vis 6.3 percent recorded in the preceding year.
32. In the investment area, gross fixed capital formation (GFCF) in constant price has grown steadily since FY01 from 5.4 percent per annum to as high as 9.4 percent in FY04. The provisional figure for FY05 also shows a positive growth rate of GFCF. The total GFCF (investment) as percentage of GDP has been stable at around 26 percent during the FY00 to FY05 period. The overall growth performance of RMG, cotton and jute textile industries show an upward movement as evident from the quantum index is an indication of substantial utilization of newly enhanced capacity of gross fixed capital formation in capital and machinery in the industry sector in FY05.
33. FDI: After a remarkable inflow in FY01 and continued sluggish performance over the next three fiscal years, inflow of FDI in Bangladesh got momentum in the second half of calendar year 2004. However, in view of the nascent state of FDI activity in the country, it is expected that continued efforts to improve the investment climate will increase the inflow of FDI significantly in the near future.
34. Employment and Wages: The absence of an up to date labour force survey (LFS), the most recent available being the 2002-03 issue, made it hard to offer a proper analysis of this important aspect of the macro economy. In any event, wage data reveals that nominal and real general wage inflation stood at 5.85 and 1.37 percent respectively in FY05. Real wage inflation in agriculture, fishery, manufacturing and construction were 2.51, 3.48, 3.77 and 0.66 percent, respectively, in FY05, all very moderate vis-à-vis the real GDP growth rate. The competitive external market for frozen shrimps and fish and the RMG sectors probably explain the modest real wage growth in these sectors. Construction wages are evidently held down by the “reserve army of the unemployed” and the apparently seamless rural to urban migration.
35. Cost and CPI Behaviour: Analytically it can be argued that supply-side or cost channels are as powerful as the demand channel in transmitting monetary policy effects on the price level and the economy in the short-run. Monetary policy changes the cost and price behaviour of

MPR_06_01
8
Overview and Executive Summary (continued)
an economy, namely, the behaviour of inflation expectations, bond yields, import payments, labour cost and the cost of borrowing. These cost behaviour in turn lead to changes in the consumer price index. The high cost of imports (especially petroleum products and food grains) as well as the accommodative monetary policy to support the post-flood rehabilitation program contributed to the upward pressure on the price level. The CPI went up from 5.64 percent as of end June’04 to 7.4 percent as of end June’05 (12 month point-to-point, base FY96 = 100).
E. Macroeconomic Outlook for FY 06
36. GDP Growth : In view of strong consumer demand, robust industrial growth, and stable service sector growth, this Review expects the FY06 real GDP growth to come in at the 6.3 to 6.8 percent range (see Table below.)
37. This outlook for growth implies a modest rise in domestic demand which will be significantly aided by higher expected output growth in agriculture and the service sector, and also by robust growth of remittances offsetting the deficit in the trade balance. However, it ought to be stressed that this forward looking analysis assumes a stable and predictable import regime (including the petroleum price behaviour), remittance behaviour, adequate private sector credit flows, and the continuation of an appropriate cautionary (i.e., tight) monetary policy stance in light of inflationary pressures currently at play.
38. Domestic Demand: This Review expects the FY06 agricultural output to grow at about 4.0 percent (i.e., a range of 3.8 to 4.3), which is close to the recent disaster-free experience. The growth is likely to be led by solid advances in crop production, mainly rice.
39. With the continued buoyancy in domestic credit and overall export growth, the industrial growth may be expected to continue unhindered. One positive sign is the growing market share of knitwear products which so far has more than offset the relative decline in the export of woven products. Overall this Review would put the likely industrial growth for FY06 to lie in a range of 8.0 to 8.5 percent, which is a shade lower than the 8.6 percent figure realised in FY05, but well in excess of the average recorded over the past five years.
Table: FY06 GDP Projection
FY06 Growth Projection Range
Sector GDP Share in FY05 (%)
Average Growth
FY00-04(%)
FY05 Growth
(%) Low High
Agriculture 21.9 2.12 0.3 3.8 (0.83)*
4.3 (0.94)*
Industry 28.4 7.48 8.6 8.0 (2.27)*
8.5 (2.41)*
Services 49.7 5.72 6.6 6.5 (3.23)*
7.0 (3.48)*
Overall GDP
100.0 5.34 5.4 6.33 6.83
*Numbers in the parenthesis indicate sectoral contribution to overall GDP growth.

MPR_06_01
9
Overview and Executive Summary (continued)
40. The evidence of sustained output growth in major service sector components such as transport and communication, telecommunication, computer and internet, education, financial intermediation, health care, retail trade and commerce in FY06 would appear robust. Consequently, this Review expects FY06 service sector to build on the past year’s performance, and yield a growth rate between 6.5 to7.0 percent.
41. Net Trade: Though the economy experienced a modest deficit in the current account balance in FY05, flow data show that it continues to demonstrate surplus in the current account since May’05. Since the current account balance is greatly influenced by inward remittances, strong growth in the latter is expected to narrow the deficit in FY06, even though the net trade deficit is not expected to narrow significantly vis-à-vis the FY05 level. The continued high international price of petroleum products is a major force explaining the trade deficit.
42. Exchange Rate Stability : Given that the structural shortfall in merchandise exports over imports will take time to correct itself (i.e., allowing for exports to grow sufficiently, and/or the oil price to come down significantly), this Review expects that the recent weakening of the currency to persist well into FY06. However in view of expected performance from the leading export sectors along with the visibly healthy flow of workers’ remittances, it is anticipated that any further weakening of the currency in FY06 to be both orderly and well-contained within the band of 65 to 67 (i.e., in the inter-bank US Dollar market).
43. Price Stability: Globally inflation in 2005 has been showing an increasing tendency due mainly to higher energy prices in the international market. In Bangladesh, inflation has been in the single digit and has remained moderate during the last several years. Direct inflationary effects of the oil price increase have been limited due to the incomplete pass-through in view of the government’s policy on administered retail price of petroleum products in the domestic market. However, increased prices of imported goods combined with the rise in import prices due to the Taka depreciation also fuelled inflationary pressures in the economy. With no major disruption in domestic production and distribution, the MTMF document projects the average inflation rate in Bangladesh to be 7.5 percent in FY06.2
44. The thrust of the analysis contained in this Review would lead one to project a similar figure. It is noted that while the 12-month point-to-point inflation in August 2005 stood at 7.9 percent, the September figure shows a moderation in the rate to 7.0 percent. This apparent encouraging development holds an explanation that does not directly meet the eye. This decline is primarily due to a sharp rise in the price level in September 2004 (following the floods), and given the higher base this resulted in the relatively low 12-month, September to September, increase. This price behaviour appears to be independent of the actual monetary policy stance. It is of concern that the annualized figure of the month-to-month movement in the price index (especially on a point-to-point basis) has kept its upward move; the annualized monthly inflation
2 This relates to the Oct 24, 2005 revisions of the MTMF economic indicators, Bangladesh Bank, Ministry of Finance, and the Bangladesh Bureau of Statistics.

MPR_06_01
10
Overview and Executive Summary (continued)
rate in September shot up to 19.02 from 11.03 percent in August, 2005. It must be pointed out that high food price in the pre-harvest season as well as the upward adjustment in the administered energy prices were mainly responsible for the latest bout of inflationary pressure.
45. The continuing risk elements include the possible consequences of public borrowing in view of the sustained historically high oil price (of about USD 60 per barrel). The currency market is also assessed to remain weak for the balance of FY 06, which adds another dimension to the inflation build-up. On top of the risk elements cited above, there is the spectre of rising real interest rate in the global economy (led by the US) and the associated increase in the inflationary expectations in the industrial countries, the source of most of our imports. In the domestic scene, the possibility of another round of upward revision in the set of administered energy tariffs cannot be ruled out. On the positive side, however, in view of the bumper aman harvest, the food component of CPI is unlikely to register much further growth over the balance of FY06. Taking the above factors into account, and on the assumption that the tightened monetary policy stance will be maintained, this Review predicts that the12-month average inflation in FY06 is unlikely to exceed 7.0 percent.
F. Monetary Policy Stance Going Forward
46. The monetary policy stance for FY06 must take due cognizance of several factors. First, one has to monitor the developments in inflation as well as the exchange rate, both of which remain under pressure. Second, the outlook for real GDP growth in FY06 as envisioned in the Medium Term Macroeconomic Framework (MTMF) of the NSAPR document is higher than those of the recent years, and indeed this Review predicts that the real GDP growth in FY06 to come in somewhere in the vicinity of 6.5 percent (i.e., within the band of 6.3 to 6.8 percent). This level of growth is on the high side given the recent record, and will require adequate credit and capital market support to be feasible. Finally, the policy stance has to focus on the level of foreign exchange reserves build-up and to monitor the expansion of private sector credit which is programmed to grow slower than in the immediate past.
47. How does one meet the requirements of the fast pace of expected growth without jeopardising the monetary stability? It is argued that the monetary policy stance for FY06 will have to be consistent with the monetary program; the broad money growth is projected to slow down to the rate of 14.3 percent in FY06 (and 13.4 percent in FY07) to bring about a reduction in inflation. These money growth figures are sharply lower than the broad money growth in FY05 that stood at 16.1 percent. Correspondingly private sector credit flow has been programmed to grow at 13.9 percent in FY06 while it had grown at 17.0 percent in FY05. However, credit must flow to the growth points in the economy.
48. It is also necessary to keep an eye on the evolution of public sector spending pattern, and in particular public sector borrowing. The latter has been stretched due to borrowing by the Bangladesh Petroleum Corporation (BPC) on account of the incomplete pass-through of the (high) import cost of oil onto domestic users and delays in donor fund disbursement. Abstracting from donor funds, the national revenue goals

MPR_06_01
11
Overview and Executive Summary (continued)
can be expected to be realised thus rendering the budgeted expenditure to be feasible within the borrowing target specified in the Budget for FY06.
49. In view of the persistent inflationary pressure, this Review therefore recommends that the Bangladesh Bank remain vigilant as to the necessity of further monetary measures and be prepared to seek additional coordinating fiscal stance as may be warranted by unfolding developments in the monetary and the real sectors of the economy. The overall goal will be to contain inflationary expectations, maintain currency stability, and work towards smooth credit flows to the growth points in the productive sectors of the economy in support of the targeted real output growth.
Reference:
GOB (2005), “Unlocking the Potential: National Strategy for Accelerated Poverty Reduction,” Planning Commission (General Economic Division), Government of the People’s Republic of Bangladesh: October 2005.

MPR_06_01
12

MPR_06_01
13
Chapter 1
The Monetary Policy Framework of the Bangladesh Bank3
Historically the Central Bank mandate in Bangladesh has been of a broad nature. The original Bangladesh Bank Order of 1972 that provided the founding charter cited (a) price, (b) exchange rate and (c) economic growth and high level of employment among the major goals.4 All three of these elements had been among the core objectives of most central banks of that epoch. Indeed the practice of monetary policy in Bangladesh has evolved along these guidelines without further discussion as to the mutual ranking of the goals. The amended Order of 2003 is even broader requiring the Bangladesh Bank (BB), among other, to “formulate” its monetary policy, and to formulate a foreign exchange “intervention policy”.5 The newer piece of legislation, literally interpreted, allowed an even greater freedom to the central bank in terms of the monetary policy formulation, but hints at a pro-active stance regarding the foreign exchange market. However with the floating of the currency on May 31, 2003, since market is expected to bring about any necessary adjustment in the exchange rate (i.e., in the event of persistent current account imbalances), the Central Bank is left with the residual responsibility to smoothen the short-term volatility in the exchange rate. It is interesting to note that the analysis of the interaction between monetary and fiscal policy was added as a major responsibility of the central bank in the 2003 amendment, thus putting new stress on research.
1.1 The Policy Target(s)
In this backdrop it is necessary that the monetary policy framework (in terms of the goals, the instruments, and the analytic channels of transmission) be articulated for greater clarity and transparency benefiting both the policy makers as well as the stakeholders. A policy regime, where the goals are transparent and their achievement verifiable, directly adds to the credibility of the central bank. A major objective of this chapter is to delineate such a framework. Before describing the ultimate macro variable(s) that the Bangladesh Bank may target, the modern practice of monetary policy elsewhere is briefly reviewed. The
3 This chapter was edited by the Resident Economic Advisor on the basis of a brief prepared by Dr. Md. Habibur Rahman and Dr. Sayera Younus of the Policy Analysis Unit (PAU), and in light of consultations with Governor Dr. Salehuddin Ahmed, Deputy Governor M. A. M. Kazemi, Dr. Shahabuddin M. Hossain, and Mr. K. M. Jamshed uz Zaman. PAU members, notably, Dr. Md. Akhtaruzzaman, Md. Kabir Ahmed, Md. Shahiduzzaman and Mainul Islam Chowdhury also provided valuable comments and suggestions. 4 The original 1972 Order stated the broad objectives of the Bank: (a) to regulate the issue of the currency and the keeping of reserves; (b) to manage the monetary and credit system of Bangladesh with a view to stabilizing domestic monetary value; (c) to preserve the par value of the Bangladesh Taka; (d) to promote and maintain a high level of production, employment and real income in Bangladesh; and (e) to foster growth and development of the country's productive resources for the national interest. 5 The 2003 Order mandates the central bank (a) to formulate and implement monetary policy; (b) to formulate and implement intervention policies in the foreign exchange market; (c) to give advise to the Government on the interaction of monetary policy with fiscal and exchange rate policy, on the impact of various policy measures on the economy and to propose legislative measures it considers necessary or appropriate to attain its objectives and perform its functions; (d) to hold and manage the official foreign reserves of Bangladesh; (e) to promote, regulate and ensure a secure and efficient payment system, including the issue of bank notes; (f) to regulate and supervise banking companies and financial institutions.

MPR_06_01
14
Chapter 1 (continued) favourite target in current times, especially in the industrial countries, is inflation.6 While the US Federal Reserve System (FRS, or simply, the Fed) has not formally announced a switch to inflation targeting, implicitly it has been doing precisely that, and with great aplomb, especially during the Greenspan era (1987-2005). The Fed’s central goal has been to deal with the long-run inflation. One lasting legacy of the outgoing Fed chairman has been his intuition allowing him to take pre-emptive strikes against inflation well before any explicit signal of its arrival.
Most industrial economy monetary policy is run with the task of keeping watch on both the output gap (i.e., the deviation of actual output from the potential output) and the inflation gap , which is similarly defined. Hence if the economy appears to be growing too fast (i.e., when the output gap is narrowing), a contractionary monetary policy comes into force, and conversely when there is “too much” slack in the economy.
A low and stable inflation is not an end in itself. The Bank of Canada argues: “low inflation allows the economy to function more effectively. This contributes to better economic growth over time and works to moderate cyclical fluctuations in output and employment” (2005, inside front cover). It ought to be stressed however that while the overriding concern in a mature economy is to keep output and employment close to the long-run potential (“the natural rate”), the challenge in the developing world is how to augment the capacity output through both productivity growth as well as via the installation of additional capacity. Faster growth in most developing contexts is necessary to reduce (and eventually eliminate) endemic poverty. Available evidence leads one to doubt if a country may rely on the low inflation environment alone to allow the country to reach the poverty and output growth targets envisioned in the National Strategy for Accelerated Poverty Reduction (NSAPR) approved recently (Govt of Bangladesh, 2005).7
Hence the appropriate monetary policy strategy in the Bangladesh context would be to achieve the goals of (a) price stability and (b) sustained and stable output growth. Here price stability would also encompass the stability of the currency regime. While a stable financial system is a pre-condition for economic growth, and in the Bangladesh Bank context, it is indeed included among the objectives (especially the 2003 Order), this is not a monetary policy goal per se, and hence the related issues will feature elsewhere. 8 The monetary policy goals clearly overlap and there is a need for policy coordination in order to attain the objectives, monetary policy must play its due role.
While leading central banks in the industrial world have increasingly adopted the unitary goal of fighting inflation, it is noted with interest that Blinder and Reis (2005) have recently argued that it in keeping with
6 This policy switch was pioneered by New Zealand in 1990, but it soon attracted converts all around, with Canada (1991), UK (1992), Sweden and Finland (1993), Australia and Spain (1994) joining in. Subsequently, Botswana, Brazil, Chile, Israel and Korea, to name a few, followed suit. 7 Note that Bangladesh is a signatory to the IMF’s Poverty Reduction and Growth Facility (PRGF) compact, which mandates the country to target suitable growth, inflation and budgetary goals consistent with the timely attainment of the millennium development goals (MDGs). 8 The Policy Analysis Unit has also been entrusted with preparation of the Financial Sector Review on a bi-annual basis, the first issue of which is expected to be released in February, 2006.
MPR_06_01
15
Chapter 1(continued) actual behaviour of the Fed, it will make sense for the US Congress to augment the FRS mandate by enumerating (a) the promotion of price stability, (b) ensuring full employment, (c) supporting global economic and financial stability (so long as the latter may be targeted without prejudicing the first two goals) as the chief monetary policy goals. In broad terms therefore the latter view is consistent with the BB vision as enunciated above, albeit anchored along different perspectives.
Inflation Targets: It is the general wisdom that monetary policy tools are of immediate potency in controlling inflation. However contemporary evidence amply illustrates that monetary policy cannot deal well with the inflationary impact of external shocks such as the recent international price of oil and related energy products. Many central banks as a consequence focus on the “core” inflation, where one typically subtracts the most volatile components (e.g., food and energy prices, indirect taxes etc) from the consumer price index (CPI) in order to arrive at the core measure of inflation. The Bank of Canada argues that it is the core concept that better predicts the underlying price stability in the economy. Hence as a policy goal, core inflation is more credible a target than CPI inflation. While there is no standard measure of core inflation in the Bangladesh context at this time, the construction methodology is made complex by two facts. First is that food items constitute nearly 60 percent of the CPI index, but while the appropriate commodity group weights may require a re-think, to ignore food entirely in defining the “core” inflation may render the construction a bit like ‘throwing the baby away with the bath water’. Secondly, in the Bangladesh context, the volatility of the international energy prices appear not to filter down to the CPI since the relevant domestic prices are highly subsidised by the state. Periodic adjustments in administered energy prices have always lagged the world market changes in both the time line as well as in magnitude often most dramatically.9 While it may be useful to focus on the non-food component of the index (which occupies only 41.6 percent of the full CPI) in order to gauge at the build-up of underlying inflationary forces in the economy, it would be unwise to treat this as a valid measure of core inflation.10
Agreeing with the view that a suitable core inflation measure ought to be the central focus, say something between the non-food CPI and the usual CPI, the question is where should one set the target in the Bangladesh context? However note that numerical targeting of inflation is not common in the South Asian region, which in part may be due to the lack of confidence in the true extent of the relevant transmission processes. However, it is quite relevant to set an indicative target band that will be realizable over the medium term (say over the next 12-to-18 months’ time). Neither the analysis on the nexus between low inflation and
9 For the period of July 2004 to July 2005, the 12-month (point to point) CPI rose by 7.68 percent while the “fuel and lighting (along with rental) category” of CPI (with a significant weight of 16.9 percent) only rose by 5.24 percent. The latter pales in contrast with the increase in the international price of crude oil of over 50 percent over the same period. Energy subsidies of this scale have significant consequences on the government’s fiscal balance and beyond. 10 The Reserve Bank of India (RBI) appears to watch the wholesale price index, WPI, as well as the CPI (and the associated core measures of both) where the context is not too dissimilar as regards the energy subsidies, though not at the same scale. It is an urgent research agenda to come up with a well -thought out methodology for constructing a measure of core inflation relevant for Bangladesh, an index that would better predict the underlying inflationary pressures than would be indicated by the past behaviour of CPI.

MPR_06_01
16
Chapter 1(continued) growth, nor, the recent developing country experience provides a firm clue as to where to target the rate of inflation (IMF, 2005). However, it is widely held that in order for inflation to remain stable, it ought to be predictable, which in turn is extremely hard to come about if the actual rate is high (relative to its recent history). Low inflation is also believed to be pro-poor, as they possess few real assets. At the same time, many argue that a very low inflation may have unintentional contractionary output effects and lead to a loss of seigniorage revenue. Weighing various arguments, the above-cited IMF document recommends single -digit inflation target for developing countries. However the document is not explicit if the recommended target is at the core level or at a broader index (IMF, 2005).
Consequently, the Bangladesh Bank may set its medium-term indicative mid-point target for a suitably defined core inflation at 5 percent (i.e., a band of 4 to 6 percent), which ought to allow enough flexibility to deal with a range of economic contingencies. While the design of the suitable core rate is subject of further analysis, note that current non-food inflation rate of 5.46 percent [as of July 2005, 12- month, point-to-point], though on an upward trend, indicates that the less volatile component of the price index is well situated within the range of the proposed target band. The full CPI though for the above period (at 7.68 percent) is decidedly high. Accordingly, the BB has just announced a further tightening of monetary policy by raising both the cash reserve ratio (CRR) as well as the statutory liquidity ratio (SLR) by one -half and two percentage points, respectively, to 5.0 and 18 percent.
It ought to be emphasised that at this stage of the economic transformation of the Bangladesh economy, the growth strategy that the country is poised at is that of the export-led variety, common to all present-day developing world, and hence the real value of the exchange rate ought to be of concern. However as noted above, in a floating rate system, there is no question of a target band for the currency par value, and hence the orderly short-term adjustment in the exchange rate is a necessary accompaniment of the (export-led) growth (and hence poverty reduction) objectives.
In terms of export competitiveness, however, it is the wholesale price index (WPI) that is relevant. Producers too are sheltered from the world price of energy by public subsidies. However if the core inflation is kept within its target, the volatility in administered prices should not be an issue since international price shocks affect all competitor countries.11 Here one also has to allow for the evolving pattern of sectoral productivity changes in the same set of competitor countries. If the inflation or productivity slips, the subsequent depreciation in the par value of the currency will fuel further inflation, and one would end up in an un-winnable policy conundrum. However, the pattern of inflation adjusted real effective exchange rate (REER) index against a trade-weighed basket of currencies of the nation’s trading partners tracked by BB since the mid-1980s appear very stable, and is indicative of the continuing competitiveness of the par value of taka. Indeed a major task of this document, the bi-annual Monetary Policy Review , would be to
11 This of course implies that the domestic energy price support measures change uniformly for all competitors.

MPR_06_01
17
Chapter 1(continued) come up with an evaluation of the likely inflation behaviour over the next two-to-three quarters (chapters 5 and 6)
(b) Growth Targets: Once the NSAPR-PRGF framework is adhered to, the growth target is already built in there. The latter are based on the medium term macroeconomic framework (MTMF), which enshrines the mutual consistency of the monetary and fiscal policies of the nation. Annual updates of the growth and inflation targets, and hence the parameters of mutually consistent monetary and fiscal programs must be based on sound forecasts of the level of consumer demand, investment and the balance of payments (BOP). Only then can the consequent design of the policy environment, and the requisite means for implementation can be firmly grounded on reasoned hypotheses. The central bank can play a major role by focussing, and indeed, coordinating the on-going policy research of other institutions (e.g., the Planning Commission or the Ministry of Finance). Ideally such research will culminate in the issuing of the bi-annual Monetary Policy Review. Without solid policy research, the setting of policy parameters in search of the growth and inflation targets would remain less than credible.
1.2 Conduct of Monetary Policy
The consensus modern practice appears to favour a rule -based approach to the conduct of monetary policy. John Taylor (1998) defines a monetary policy rule very generally as a description of how the instruments of policy (e.g., a short-term interest rate) change in response to target economic variables. Thus Fed’s recent behaviour, especially over the Greenspan era, whereby it routinely monitors the inflationary outlook (typically by examining the evolving pattern of a broad index namely the GDP deflator) and the expected output (by analysing labour market data, namely non-farm employment growth), and periodically decides to adjust the federal funds rate or to leave it unchanged, is an example of a monetary policy rule.12
For reasons that are well-known interest rate interventions are believed not to be the most direct of tools to influence the aggregate demand in a developmental setting as Bangladesh. The industrial sector demand for private capital would be interest sensitive, other things being equal. The investment climate (inclusive of institutional aspects as well as the tax regime) likely plays an important, if not the dominant role. However given that total private sector credit demand is roughly 70 percent of the total domestic credit delivery, the share of investment credit would be even smaller.13 Hence the monetary policy tools would be effective to only a part of the total credit. Even here though movements in the short-term interest rates that serve as the Bank’s policy instruments, namely the repo and the reverse repo rates (see below), have little direct pass-
12 Recall though that the original rule proposed by Taylor (1993) actually calls for the Fed to adopt a given formula which would stipulate precisely by how much the short term interest rate would be changed in response to a unit change in the deviation of both output and inflation from their long-run levels. This formulation, widely known as the Taylor rule, assumes a constant growth of money stock. The formula of course will undergo revisions in the event of systematic changes in the money growth in response to changes in the interest rate and other variables. 13 Looking at July ’05 over July’04 figures, it is seen that of the total growth of domestic credit of 225 billion taka, total private sector share was about 159 billion (Bangladesh Bank, 2005a). Then there is the Islamic banking component (between 13 and 15 percent of the industry) which is essentially outside the interest rate mechanism.

MPR_06_01
18
Chapter 1(continued) through on to the spectrum of lending and deposit rates of commercial banks. Perceptions of high credit risk, non-market interest rates offered on government saving deposits, absence of secondary trading in public debt and the like are cited as reasons for the price rigidities (especially downward) in the financial system.
Insofar as private saving and money demand behaviour are concerned, in light of the shortcomings in financial deepening, there are doubts whether the plausible magnitude of the respective interest elasticities is beyond the insignificant level.
Consequently the Bangladesh Bank puts greater reliance on monetary targeting focussed on the reserve money (RM), and thus via the money multiplier, on the broad money, i.e., M2. BB programs the required limit of monetary expansion, broad money in this case, based on estimates of GDP growth, CPI and changes in income velocity of money.14 The simple relationship between broad and reserve money allows the latter to be used as an intermediate target, which is convenient since the policy instruments may directly target RM effectively. The details of the instruments and modalities used for this purpose are described below. The essence of this approach is to routinely (indeed on a daily basis) monitor and influence the supply of liquidity in the private credit market, which would be consistent with BB’s judgement of the inflation and GDP outlook. However, the success of this strategy squarely depends on the accuracy of inflation forecast built into the target money stock growth. Clearly the monetary programming idea is another obvious example of a monetary policy rule à la Taylor.
Lately the annual monetary program of the Bank and the fiscal program (i.e., the annual budget) have both been drawn up with reference to the MTMF cited above. Such coordination is expected to lead to greater stability in the policy stance adopted by each of the executing agencies, namely the Bangladesh Bank and the Ministry of Finance, respectively. In the Bangladesh monetary program, M2 was set to grow at 14.2 percent in FY’05 (i.e., to end June), but the actual provisional growth stood at 16.7 percent. Data for FY’04 shows that year-on–year actual growth had also been greater than the targeted rate (13.8 as against 11.9). The FY’06 currently projected growth rate has been set at 14.3 percent, which is somewhat lower than the immediate past experience. The corresponding reserve money growth for FY’05 stood at 12.5 percent.15
The success of targeting broad money in order to control inflation is premised on the long-term equilibrium relationship between money and prices. While the subject calls for a detailed analysis, a brief look at Figure 1.1 below suggests that even if the long-term co-movement of the two variables may appear stable, there are significant short-term
14 The monetary programming idea can be usefully described by a simple minded growth relationship derived from the old quantity equation: gP =(gM + gv - gY ), which states that the anticipated inflation rate (gP) can be decomposed into the sum of the growth rate of broad money (gM ) and velocity (gv ) while netting out the growth rate of real output (gY ). Broad money (M) may however be related to the operating target, the reserve money (RM), via the money multiplier (m), and in growth form: gP = ( gRM + gm + gv - gY ). See IMF (2005) for additional details. 15The monetary program data is taken from IMF and BB (Bangladesh Bank, 2005a). The FY’06 information is contained in GOB (2005).

MPR_06_01
19
Chapter 1(continued) deviations in such a relationship.16 The transmission mechanism between money supply and prices remain tenuous especially in the case of developing economies, and its further analysis is a topic of immediate policy interest.
Figure 1.1 Bangladesh: 12-month average growth rate of CPI and M2
Source: Constructed by Md. Shahiduzzaman of PAU based on annual data from
BB as well as from the ADB website (Key Indicators, 2005).
Insofar as output and productivity growth are concerned, monetary policy must contribute towards the enabling environment via appropriate credit and monetary interventions, and, by maintaining low inflation and a stable financial system. In order to improve the functioning of the interest rate mechanism to influence the aggregate demand, the banking system has to strive to allocate credit to most productive uses. The risk of using too much caution (and deny credit where due) is perhaps as harmful as erring on the wrong side. This adds an additional onus on the Central Bank’s regulatory and advisory roles as well as in the formulation of clear policy instructions.
In terms of the distributional objective consistent with poverty reduction, the central bank may keep an eye on the regulation of micro-finance industry and the credit adequacy of small and medium enterprise (SME) window of the commercial banking system.17 There is evidence that the SMEs primarily create low skill jobs, which serve as a major conduit for poverty reduction. Clearly fiscal measures (including the taxation regime and targeted interventions) and governance issues (including regulatory and institutional elements) must also offer the remaining elements of the enabling environment.
Movement in the exchange rate has a direct effect on GDP and employment outlook especially through the export channel where the
16 An implicit assumption behind monetary targeting is the existence of a stable money demand function. Some doubt if the money demand function is stable in a developmental setting; however the Reserve Bank of India economists argue that the money demand function is indeed stable at least under recent Indian conditions (Reddy, 1999). While further research using modern estimation methodologies is highly warranted on this important topic, one also has to wonder about the question of the quality of available data. 17 Recently a new regulatory body for the microfinance industry has been created with the Governor of the Bangladesh Bank as its Chairman: Steering Committee for Microfinance Research and Reference Unit, which will clearly facilitate the central bank’s oversight in this area.
0
2
4
6
8
10
12
14
16
18
20
1991 1992 1993 1994 1995 1996 1997 1998 1999 2000 2001 2002 2003 2004 2005FY
%
M2 CPI

MPR_06_01
20
Chapter 1(continued)
competitiveness of a country's goods depends on the REER. A misaligned rate structure may also lead to resource misallocation in domestic production. The issue of exchange rate management is further discussed below.
1.3 Choice of the Monetary Instruments
Since monetary policy goals cannot be influenced directly, like most central banks BB uses a set of indirect instruments. As noted above, the Bangladesh Bank pursues its monetary policy within a framework of monetary targeting with reserve money as the operating target, and broad money as an intermediate target. The Flow Chart on the Monetary Policy Framework provides a simple illustration.
As described above, the broad money (M) can be influenced indirectly by changes in policy instruments that target and monitor the reserve money (RM) via the money multiplier (m). The primary mechanism employed for this purpose is the direct control of liquidity on a day-to-day basis achieved by the repo, reverse-repo and the weekly T-bill auctions. The latter instruments would in turn have an impact on the inter-bank call money rate for overnight transactions. While adjusting the excess liquidity in the banking system by this mechanism, BB simultaneously re-sets the repo and reverse-repo rates on a daily basis.
Box 1.1
Monetary Policy Framework of Bangladesh Bank
Policy Instruments: Ø Repo & Reverse
Repo Auctions Ø Various T-bill
Auctions ØSetting SLR & CRR Ø Bank Rate
Targets: (i) Operating Target Ø Reserve Money
(ii) Intermediate Target Ø Broad Money
Goals:
Ø Price Stability
Ø Economic Growth
FLOW CHART: Monetary Policy Framework
Information Variables: Ø Foreign Reserves Ø Short-term Interest Rates Ø Liquidity Situation Ø Domestic Credit Ø Inflation and Exchange
Rates
Policy Decision: Ø Based on market
information and judgment of the policy makers

MPR_06_01
21
Chapter 1(continued)
The cash reserve requirement ratio (CRR) and the statutory liquidity ratio (SLR) are effective means of announcing the monetary policy stance. In a tightening mode, BB adjusted CRR twice recently (first in the third quarter of FY’ 05, and again in the first quarter of FY’06, though effective from October 1, 2005). In the latter occasion the SLR was also raised to 18 percent. Earlier reasons were cited as to why the traditional bank rate has not been effective in signalling the monetary policy stance via the adjustment of the borrowing and deposit rates in the banking system. It is also noteworthy that the Bangladesh Bank has of late encouraged the activation of the inter-bank call money market instead of the reliance of commercial banks on the rediscount window the Central Bank.
As the time lag between policy actions and the eventual impact on goals is usually several quarters long, additional information variables such as foreign reserves, short-term interest rates, liquidity situation and domestic credit growth appear handy for policy makers to adapt and revise its policy measures if and as needed. No matter how sound is the monetary programme being pursued and its analytical base, the monetary authorities need to use their judgment deciding the future direction of the policy stance and communicate that rationale to the public.
1.4 Exchange Rate Management18
It has already been observed that under the floating rate regime, Bangladesh Bank does not have a target band for the exchange value of the currency. However there are at least a couple of areas where it has to be vigilant. In the short term, it has to smoothen any adjustment in the exchange rate in an orderly fashion. This may involve the release of foreign reserves and, where relevant, international cooperation. Other than occasional direct intervention in the currency market, the Bangladesh Bank also has in its tool kit the indirect instruments that can exert an indirect influence on the par value of the currency. These relate to the control over liquidity via repo, reverse repo, and t-bill auctions.
Figure 1.2 The REER Index
REER Index
80.0
85.0
90.0
95.0
100.0
105.0
Mar
03
Jun
e 0
3
Sep
03
Dec
03
Mar
04
Jun
e 0
4
Sep
04
Dec
04
Mar
05
Jun
e 0
5
July
05
Au
g 0
5
Sep
t 0
5
Source: Monetary Policy Department, Bangladesh Bank
18 Adapted from Bangladesh Bank (2005b).

MPR_06_01
22
Chapter 1 (continued)
Over the longer run, however, the primary exchange rate issue has to do with the real value of the exchange rate, namely the real effective exchange rate (REER). In particular it would be remiss of the central bank not to keep an eye on the relative values of REER of the domestic currency vis-à-vis that of its trading partners and competitors. The nominal exchange rate changes may not fully and instantaneously reflect the differential purchasing power of different currencies even in a fully flexible regime. Relative domestic aggregate demand pressures as well as productivity changes may all work with a lag on the value of nominal exchange rates. Fortunately, however, the inflation adjusted par value of the national currency has held up well against its competitors and the pattern has been stable, even depreciating a little during the past two-to-three years. To illustrate, the REER index of the currency stood at nearly 100 in early 2003 (indicating no over-or-under valuation); it has fallen to 90 in the current quarter, which represents a 10-percent depreciation rendering national exports more attractive. In the event of a persistent misalignment that is not being corrected by the market, the instruments at the disposal of BB are same as noted above.
In the shorter term, BB therefore articulates its concerns and views on the evolving pattern of both the anticipated temporary discrepancies in demand for and supply of foreign currency as well as on the pattern of REER. Brief statements on these accounts may be released to the media and the public in regular intervals, and of course, at other times should events so warrant. Such forward-looking statements are of great help to all who are directly related to the FOREX market, but unable to do their own in-house research (e.g., the exporter and importer associations, professionals engaged in these fields, potential foreign investors and importers). Anticipation of events is likely to make the eventual fluctuations more orderly as time and the risks actually unfold, and thereby render the Central Bank policies more effective.
1.5 Conclusion
This chapter has outlined the logic behind the macroeconomic goals set by the Bangladesh Bank, and demonstrates how the multiple goals are being kept in balance by the design of policy tools. In concluding this chapter, it is stressed that in order to refine the understanding of the policy framework and the associated transmission mechanisms, some rigorous empirical investigations need to be initiated on an urgent basis. Issues of the estimation of a stable money demand function in Bangladesh, an in-depth investigation of money-inflation relationship, and the interest rate sensitivity of aggregate demand components (mainly private investment and consumption) need to be reviewed afresh. The absence of a smooth linkage between the short term rate setting targeted by the monetary policy tools and the broader credit market is also an area of further focus . In addition, the development of technical capability in modeling and forecasting the key macroeconomic variables is also crucial in formulating and analysing monetary policy effectively.
MPR_06_01
23
Chapter 1 (continued) References:
1. Bangladesh Bank (2005 a), Major Economic Indicators: Monthly Update, Volume 09/2005, Monetary Policy Department.
2. Bangladesh Bank (2005 b), “On the Communication Policy of the Bangladesh Bank”, Policy Note, PN01-05 (forthcoming).
3. Bank of Canada (2005), Monetary Policy Report, Ottawa, April 2005.
4. Blinder, A, and R. Reis (2005), Paper presented at the Jackson Hole Symposium in honour of Alan Greenspan, August 28-29.
5. GOB (2005), Unlocking the Potential: National Strategy for Accelerating Poverty Reduction (NSAPR), Planning Commission, Government of Bangladesh.
6. IMF (2005), “Monetary and Fiscal Policy Design Issues in Low-Income Countries”, August 08, mimeo, Washington, DC.
7. Reddy, Y. V. (1999), “Monetary Policy Operating Procedures in India” in Emerging Market Economies, BIS Policy Papers, No. 5 – March 1999, Bank for International Settlements, Basle.
8. Taylor, John B., (1993), “Discretion versus Policy Rules in Practice”, Carnegie-Rochester Conference Series on Public Policy , 39, 195-214.
9. Taylor, John B., (1998) “An Historical Analysis of Monetary Policy Rules”, Working Paper 6768, NBER, Cambridge, Mass.

MPR_06_01
24

MPR_06_01
25
Chapter 2 Developments in Aggregate Demand19
2.1 Domestic Demand
20
Bangladesh's Real GDP growth is provisionally estimated to be 5.4 percent in financial year 2004-05 (FY05) which is 0.9 percentage points lower than the previous year's growth of 6.3 percent. The growth rate was projected to have slowed down mainly due to some adverse domestic and external shocks, notably floods in July-August 2004, the sharp increase in the world prices of oil and oil products and the abolition of textiles quota following phase-out of the MFA in January 2005.
Figure 2.1 Growth Ra te of Real GDP
Source: Economic Trends, September 2005, Bangladesh Bank
Figure 2.2 shows sectoral share of GDP (at constant 1995-96 prices) by broad categories. Share of Agriculture decreased gradually over the years from 25.03 percent of total GDP in FY 01 to 21.91 percent in FY05. Share of Industry on the other hand increased every year from 26.2 percent in FY01 to 28.44 in FY05. Service sector has the highest share of GDP during the last five years and the share has increased every year from 48.77 percent in FY01 to 49.65 percent in FY05. Therefore, the economy's dependence on agriculture is decreasing while that on industry and services is increasing. Agricultural output is estimated to have grown only at the rate of 0.32 percent at constant prices in FY05 as against 4.09 percent in FY04. Overall agricultural growth was dwarfed primarily due to flooding which caused a poor Aus and Aman production though estimates suggest a nine percent increase in Boro production (to 14 million metric tons, [MT]) which was not affected by the flood. Wheat production also decreased by 22 percent to 976 thousand MT. Figure 2.3 shows per acre yield of major crops. It is evident from the figure that per acre yield of Aus gradually increased over the years up to FY04 but fell in FY05. Per acre yield of Aman and Boro fell in FY02 as compared to that of FY01. Per acre yield of these two crops then increased in FY03 and FY04. In FY04 per acre yields stood at 0.82 MT
Chapter 2 (continued)
19 Contributed by Dr. Md. Akhtaruzzaman, Md. Kabir Ahmed and Mainul Islam Chowdhury 20 Prepared by Mainul Islam Chowdhury
02468
2001 2002 2003 2004 2005
Fiscal Year
Gro
wth
Rat
e

MPR_06_01
26
and 1.32 MT respectively but again fell to 0.67 MT and 1.18 MT respectively in FY05. Per acre yield of wheat has gradually decreased over the years.
Figure 2.2 Sectoral Share of GDP
0
1 0
2 0
3 0
4 0
5 0
6 0
2 0 0 1 2 0 0 2 2 0 0 3 2 0 0 4 2 0 0 5
F i s c a l Y e a r
Pe
rc
en
ta
ge
Sh
ar
e
A g r i c u l t u r e I n d u s t r y S e r v i c e s
Source: National Accounts Statistics, June 2005, BBS
Figure 2.3 Production (per acre) of Major Crops
0 0 .2 0 .4 0 .6 0 .8
1 1 .2 1 .4
2 0 0 1 2 0 0 2 2 0 0 3 2 0 0 4 2 0 0 5
F i s c a l Y e a r
Pe
r A
cre
Yie
ld (
MT
)
A u s A m a n B o r o W h e a t
Source: Economic Trends, September 2005, Bangladesh Bank and Bangladesh
Bank Quarterly, April-June 2005 Per acre yield of Aus, Aman, Boro and Wheat fell by 3.92, 17.6, 10 and 19.2 percent respectively in FY05. Production of minor crops like potato and vegetables however improved. Growth of livestock and poultry is expected to have increased by 7.8 percent and that of fisheries by 4 percent in FY05. This reflects the increased disbursement of agricultural credit. Growth of agricultural credit disbursement in FY05 is 34.4 percent which is 10 percentage points higher than that of the previous year. But in view of poor agricultural output, it would appear that most credit was directed at recouping the flood losses (e.g. need to replant the seeds and/or replace lost inputs) including the necessities to meet the final consumption needs.
Industrial output growth is expected to have been 8.55 percent in FY 05 which is 0.95 percentage points higher than that of FY04. This higher expected growth is partly due to the robust manufacturing activities in the fourth quarter of FY05. The growth appeared broad based including
Chapter 2 (continued)

MPR_06_01
27
jute, cotton and RMG and leather. The effect of the phase out of MFA has been moderate despite the speculation that Bangladesh might have to lose a quarter of its exports and a huge number of jobs. Comparing the last two quarters of FY04 and FY05 it is seen that total export earnings from woven garments was USD 1862.5 million in FY04 while that in FY05 in the corresponding quarters was USD 1774.8 million showing a 4.7 percent diminution. In case of knitwear, growth rates in Q3 and Q4 in FY05 were 4.2 and 18.3 percent respectively. Growth rates during the corresponding quarters in FY04 were 7 percentage points lower and 23.3 percentage points higher respectively.
The service sector is expected to have grown at the rate of 6.63 percent in FY05, which is 0.97 percentage points higher than that of the previous fiscal. Total output of the service sector consists of the collective outputs of the wholesale and retail trade, transport, storage and communication, financial intermediations, real estate, rental, leasing and business activities, public administration and defence, education, health and social work and community, social and personal services activities.
(a) Household Consumption
Disposable income21 and private consumption are estimated to have grown at the rate of 6.27 percent and 4.41 percent respectively in FY05 which are consistent with the average growth of 5.67 percent and 4.14 percent respectively during the last five years. Figure 2.4 indicates that disposable income and private consumption follow similar patterns, the former lying higher, leaving some room for growth in private saving. Growth of real wage rate index slowed down to 1.36 percent in FY05 whereas the average growth during last five years has been 4.13 percent. CPI inflation (12-month average) in FY05 and FY04 was 6.13 and 5.83 percent respectively while the average during the last five years has been 4.21 percent. Figure 2.5 implies that real wage increased even in the face of increasing inflation up to 2003 but after that it fell drastically though the pace of inflation continued. One explanation can be the growth of overseas employment. The figure shows that real wage increases in the face of a boom in overseas employment (as occurred in FY03). A fall in overseas employment seems to have a diminishing effect on wage index by increasing the labour supply even in the face of inflation. The deceleration in wage index may also be the outcome of the recent lay- offs in some large State Owned Enterprises (SOEs) which created additional labour supply pushing nominal wages downwards thus causing the real wage to decline. The fall in real wages may also be an indication of sluggish productivity growth.
(b) Government Expenditure
The growth of government spending is estimated to have continued the decelerating trend initiated during the fourth quarter of FY03. The level of government consumption expenditure22 as a percentage of GDP has increased from 4.51 percent in FY01 to 5.62 percent in FY05. In FY05 actual ADP expenditure was only 50.3 percent of the revised allocation
Chapter 2 (continued)
21 Disposable income (Yd = Y – t + TR) is calculated by deducting total income tax from and adding foreign remittance (as a proxy for transfers) to the sum total of private consumption and saving in respective years. 22 BBS extrapolates government final consumption based on national budget allocations.

MPR_06_01
28
Figure 2.4 Growth of Disposable Income and Private Consumption
0
1
2
3
4
5
6
7
8
2001 2002 2003 2004 2005
Fiscal Year
Gro
wth
Ra
te
Pr ivate Consumpt ion Disposable Income
Source: National Accounts Statistics, June 2005, BBS
Figure 2.5 CPI Inflation, Real Wage Index and Overseas Employment
Source: Economic Trends, September 2005, Bangladesh Bank and National
Accounts Statistics, June 2005, BBS up to the third quarter. Whereas the average annual actual ADP expenditure during the last five years has been 89 percent of the revised allocation. Revenue earnings and government expenditure increased at a much faster rate in the fourth quarter of each fiscal year reflecting a strong seasonality. Sharp rise in expenditure from 2.9 percent of GDP in the third quarter to 4.5 percent of GDP in the fourth quarter of FY05 reflected accelerated release of cash for ADP as well as current expenditure, with the latter reflecting large back payment of salary and benefits associated with new national pay scale. Overall annual public expenditure was recorded at 12.8 percent of GDP, compared with FY04 level of 12.9 percent of GDP but more significantly below the budgeted amount of 15.1 percent of GDP. As in the previous years, the observed outcome reflected partly ambitious ADP target and weak implementation of the ministries and government agencies with only a few exceptions.
Another pattern that is evident in Figure 2.6 is that even though both expenditure and revenue appear to get a boost during the third and fourth
Chapter 2 (continued)
-20 -15 -10
-5
0 5
10 15 20 25 30 35
2001 2002 2003 2004 2005
Fiscal Year
Perc
enta
ge C
hang
e
CPI Inflation Change in Real Wage Index Overseas Employment Growth
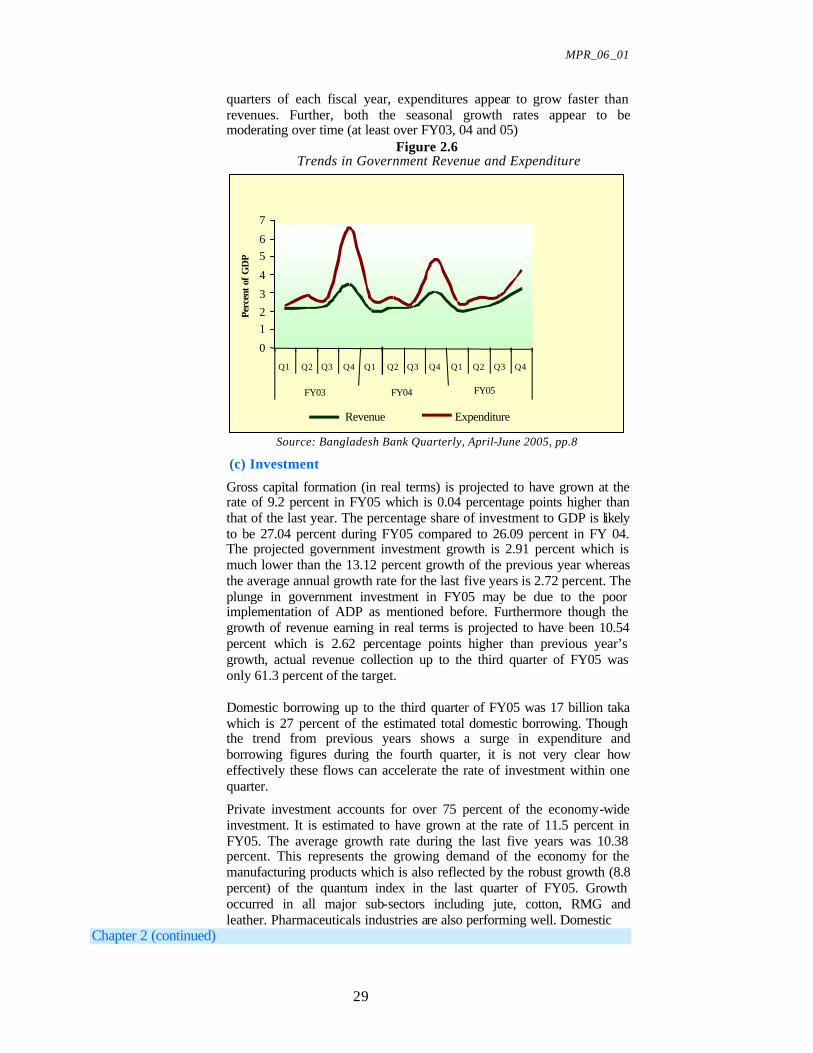
MPR_06_01
29
quarters of each fiscal year, expenditures appear to grow faster than revenues. Further, both the seasonal growth rates appear to be moderating over time (at least over FY03, 04 and 05)
Figure 2.6 Trends in Government Revenue and Expenditure
Source: Bangladesh Bank Quarterly, April-June 2005, pp.8
(c) Investment
Gross capital formation (in real terms) is projected to have grown at the rate of 9.2 percent in FY05 which is 0.04 percentage points higher than that of the last year. The percentage share of investment to GDP is likely to be 27.04 percent during FY05 compared to 26.09 percent in FY 04. The projected government investment growth is 2.91 percent which is much lower than the 13.12 percent growth of the previous year whereas the average annual growth rate for the last five years is 2.72 percent. The plunge in government investment in FY05 may be due to the poor implementation of ADP as mentioned before. Furthermore though the growth of revenue earning in real terms is projected to have been 10.54 percent which is 2.62 percentage points higher than previous year’s growth, actual revenue collection up to the third quarter of FY05 was only 61.3 percent of the target. Domestic borrowing up to the third quarter of FY05 was 17 billion taka which is 27 percent of the estimated total domestic borrowing. Though the trend from previous years shows a surge in expenditure and borrowing figures during the fourth quarter, it is not very clear how effectively these flows can accelerate the rate of investment within one quarter.
Private investment accounts for over 75 percent of the economy-wide investment. It is estimated to have grown at the rate of 11.5 percent in FY05. The average growth rate during the last five years was 10.38 percent. This represents the growing demand of the economy for the manufacturing products which is also reflected by the robust growth (8.8 percent) of the quantum index in the last quarter of FY05. Growth occurred in all major sub-sectors including jute, cotton, RMG and leather. Pharmaceuticals industries are also performing well. Domestic
Chapter 2 (continued)
0 1 2 3 4 5 6 7
Q1 Q2 Q3 Q4 Q1 Q2 Q3 Q4 Q1 Q2 Q3 Q4
FY03 FY04 FY05
Revenue Expenditure
Per
cent
of
GD
P

MPR_06_01
30
production and import of cement in the first six months of FY05 is higher than that of the same period of the previous year. Growth in construction, mining and quarrying, power and gas sub-sectors are also estimated to be higher than the corresponding growth recorded in FY04.
Figure 2.7 Growth in Public and Private Investment
-1 0
-5
0
5
1 0
1 5
2 0
2001 2002 2003 2004 2005
F i s c a l Y e a r
Gro
wth
Ra
te
Publ ic I nves tmen t
Pr iva te Inves tmen t
Source: National Accounts Statistics, June 2005, BBS In Figure 2.7 growth in public and private investment follow a mirror image which gives the appearance of a possible crowding out effect. To explore this further a plot of public borrowing from the banking system and bank credit to the private sector is shown in Figure 2.8. From the figure it is quite evident however that growth in public borrowing has not affected private sector credit growth much.
Figure 2.8 Public Borrowing and Private Sector Credit Growth
- 2 0 0
- 1 0 0
0
1 0 0
2 0 0
3 0 0
4 0 0
2 0 0 1 2 0 0 2 2 0 0 3 2 0 0 4 2 0 0 5
F i s c a l Y e a r
Gr
ow
th R
ate
P u b l i c B o r r o w i n g f r o m t h e B a n k i n g S y s t e m C r e d i t t o t h e P r i v a t e S e c t o r
Source: Economic Trends, September 2005, Bangladesh Bank
2.2 Exports & External Demand23
In this section the external demand of Bangladesh’s exports with special reference to global economic progress during the year FY05 is analyzed.24 In doing so an attempt is made to address the country’s
Chapter 2 (continued)
23 Prepared by Dr. Md. Akhtaruzzaman. 24 FY indicates fiscal year, July-June. Year mentioning in full digit form like 2004, 2005 etc. indicate calendar year.

MPR_06_01
31
Table 2.1
Quantum Index of Manufacturing Industries
(By Major Industry Group)
Sub-sectors Old New FY02 FY03 FY04 FY05E FY05
weight1 weight2 Q1 Q2 Q3 Q4
Food beverage & tobacco 22.1 9.7 215.2 217.0 229.1 238.9 250.6 254.1 216.2 234.6
Jute, cotton, RMG & leather 38.2 68.1 277.7 287.7 311.0 343.6 358.2 292.3 343.1 381.0 Wood products including furniture 0.2 0.1 182.2 178.6 183.2 201.2 190.7 195.4 207.2 211.6
Paper and paper products 4.7 1.1 306.8 305.1 329.5 371.7 328.2 364.9 395.3 398.5 Chemical petroleum & rubber 24.0 15.6 213.3 241.5 250.2 270.6 259.8 258.8 281.1 282.6
Non-metallic products 2.8 3.7 311.8 326.7 344.4 388.2 357.4 377.5 405.6 412.5
Basic metal products 2.1 0.7 197.3 202.4 208.8 239.4 220.9 230.7 244.6 261.5
Fabricated metal products 5.9 1.0 108.6 99.8 111.8 129.9 127.2 123.3 133.1 135.8 General index of manufacturing 100.0 100.0 260.8 275.9 292.2 321.0 328.6 285.1 321.1 349.4
Growth rate (new weight) 1.7 5.8 5.9 9.9 6.5 -13.2 12.6 8.8
Growth rate (old weight) 4.6 4.6 4.5 9.2 -0.9 -7.6 7.2 6.8
Source : Bangladesh Bank Quarterly, Vol II, No. 4 1/ Old weights are calculated by BBS (base 1989-90); 2/ New weights are estimated by Bangladesh Bank (base 2000-01) and E=Estimated
current overall export growth prospect in liaison with the development of import demand condition in the market of chief trading partners like USA and the Euro area countries.
(a) Output and External Demand of Exports
Bangladesh’s GDP growth performance during the recent decade could be viewed as steady albeit modest in the sense that its trend is fairly stable around 5 percent during the last couple of years. The growth record of FY04 was the highest since the inception of the country in 1971. The 6.3 percent growth record of Bangladesh economy in the FY04 outperformed the provisional estimate of BBS (5.3 percent) which was announced earlier. For the FY05 BBS estimated that output growth would come to somewhat moderate figure of around 5.5 percent.
The economy of Bangladesh is increasingly open and the value of her exports stood at about 15 percent of GDP FY05. Since, global economic developments affect aggregate demand in the Bangladesh economy its exports, as one of the large component of GDP, would be affected by the spending capacity of a number of major destination countries. In fact, only a handful of countries contribute a lion’s share (about 80 percent) of the national export demand. More particularly, about 28 percent of Bangladesh’s total exports are destined to USA and about 50 percent to the Euro area of which about 17 percent to Germany and about 11 percent, 7 percent, and 4 percent to UK, France and to three other European countries like Italy, Netherlands and Belgium respectively. Of the total exports the major share is contributed by RMG exports and about 95 percent of those are exported to US and the Euro area.
Chapter 2 (continued) Furthermore, in rest of the export items like frozen foods, leather and leather products, jute goods and tea are the major items whose main destinations are again euro area countries. The overall economic

MPR_06_01
32
performance and the near term prospect of those chief trading partner economies would have a great influence in determining the external demand of Bangladesh’s exports.
(b) World Economy Outlook
After achieving 5 percent growth in the year 2004, the highest peak in decades, the global output growth is likely to recede to around 4 percent during 2005. Despite the fact that the growth of United States’ economy, the main propeller of world GDP growth, is likely to slowdown and to be somewhat less than the estimated 3.6 figure in 2005 due to both long existing, and indeed growing imbalances in U.S.’s budget deficit and the deficit in the current account balance, the global GDP has been progressing largely on the past five years’ trend average of new millennium. From a regional perspective, the continued fairly high global growth has become increasingly broad-based, though some regions continue to grow more buoyantly than others. Overall, world GDP growth in the current year continues to be well supported by the USA though somewhat weakly, followed by the high growth performance of developing Asian countries including China and India and to some extent by other emerging economies in Latin America. However, very little progress is being made in removing some looming downside risks, notably those arising from increasingly higher oil prices, a slower growth outlook of the Japanese economy during 2005 relative to the year 2004, and an absence of any significant pickup of growth rate projection for the Euro area in 2005, higher U.S. interest rates, and a continued appreciation of Japanese yen albeit modest during 200525. Inflationary pressures however remained subdued throughout most of the regions of the world.
Current payment imbalances in most of the developed countries are potentially a threat to the progress of developing countries’ external trade. These imbalances are contributing to volatility in the exchange rates of international currencies irrespective of regions or countries. The lethargic pace of economic expansion of Euro area countries specially, Germany and the inflexibility of some Asian exchange rates would also contribute in this process. The dependence of the global economy on the USA as the primary driver of global output growth is itself a source of vulnerability. This is manifest in the fact that the frequent depreciation of the US dollar against the other major currencies during 2004 has led to current account balance of all LDCs with a significant pressure on US imports26. Likewise in response to that the money-market interest rates have moved up globally, which may further aggravate the US import demand and it can also create pressures on the debt burden of developing countries.
Chapter 2 (continued) Figure 2.9
World's Major Advanced Countries Output Growth
25 Most recently (in 2nd quarter of 2005) Japan shows sign of some sparks and the yen appreciated briskly in trade weighted terms. The REER index shows a modest fall to 86.3 on September 14 th from 87.2 a year ago (source: The Economist , September 17th, 2005) 26 The depreciation of the US dollar between February 2002 and March 2005 amounted to 15 percent, according to the U.S. Federal Reserve Board’s real effective broad index (Bank of Canada’s Monetary Policy Report-April 2005). In the first quarter of 2005 the US dollar started appreciating modestly in trade weighted terms (source: The Economist , September 17th, 2005)

MPR_06_01
33
The year 2005 witnessed a general downward trend of both export and import in almost all the advanced countries. The only exception is France which recorded a big increase in export growth, while Japan and Germany recorded a sharp fall. In import growth the United States and Japan registered a huge fall. As a major indicator of consumer spending the volume of retail sales shows no sign of significant improvement in the current year in many advanced countries especially in the Euro area though US and Japan have gained a fairly high positive growth (Table -2.2).
The continued buoyancy of China’s high growth economy has very important implications for world economy’s growth including the growth prospect of other developing Asian countries. For instance, China succeeded to attract an unprecedented volume of FDI during the current decade, gained high competitiveness in global export markets, and its import upsurge contributed to more or less permanent increases in key industrial commodity prices like oil and steel. Consequently, there remains a constant risk that the high oil price may act to dampen China’s decade long high GDP growth record as well as world output growth by more than it has so far. Nevertheless, if China’s huge investment spending (which is more than 40 percent) would lead to eventually excess capacity in the economy its growth momentum is likely to be affected. Furthermore, international pressure, especially from US, to revalue the Chinese Yuan (RMB), which could affect its otherwise robust growth performance by easing its relative competitiveness in the international market27.
In contrast, growth in Japan turned out to be stronger than anticipated in the current quarter (Q1) of 2005. Consequently, the growth projections by IMF and other organizations may have to be revised upwards. Furthermore, the expansion of other emerging growth nodes in the Asian region could contribute to effectively reverse the otherwis e decelerated growth outlook of the world economy during 2005. However, greater exchange rate flexibility in developing Asia including China and Japan
Chapter 2 (continued)
would also facilitate the higher growth prospect in the Asian region as well as their American and European trade partners.
27 The Chinese Yuan has already appreciated by an annualized rate of 4 percent during December 31 st 2004-September 21st 2005 (source: (The Economist , September 24th, 2005)
0.00.51.01.52.02.53.03.54.0
US Japan France UK Belgium Euro Area %
cha
nge
on y
ear a
go
Q1 Q2

MPR_06_01
34
Table 2.2 Indicators of Consumer’s Spending Capacity
Retail Sales 2005 (Volume)
Unemployment (latest)
Unemployment a year ago
US 7.5 July 4.9 Aug. 5.4 Japan 3.6 June 4.4 July 4.9 China nil nil nil
Germany -3.0 11.6 Aug. 10.6 France -1.2 9.9 July 10.0
UK 1.8 4.7 (May-July)
4.7
Belgium 5.9 13.4 (May-July)
12.8
Euro area nil 8.6 July 8.9 Source: The Economist, 24 th September, 2005
Figure 2.10
World’s Major Advanced Countries’ Export Growth
Source: The Economist, 24 th September, 2005
Figure 2.11
World’s Major Advanced Countries’ Import Growth
Source: The Economist, 24 thSeptember, 2005
Chapter 2 (continued) (c) Export Performance of Bangladesh
0.0 2.0 4.0 6.0 8.0
10.0 12.0 14.0 16.0
US Japan Germany France UK Euro Area
2004 2005
0 2 4 6 8
10 12
US Japan Germany France UK Euro Area
2004 2005

MPR_06_01
35
Bangladesh’s total export has been growing very regularly, without any erratic fluctuations, at an average annual rate of around 13 percent for more than two decades. Trend of period average simple growth rate of total export of Bangladesh is almost similar in two periods; 1980-90 and 1991-2004 (Table-2.3). During the whole period under consideration ready-made garments (RMG) exports contribute lion’s share (around 75 percent). But before that jute and jute goods combined contribute the major share (around 70 percent). The other major products are frozen foods, leather and leather products and tea whose combined share is currently around 15 percent. For RMG export as a whole the average annual growth rate is much higher (95.2 percent) during the first period. Of the RMG export the average annual growth rate of knitwear export is much higher (74.0 percent) during the last period as compared to woven wear.
Table 2.3 Period Average Growth of Export and the RMG Sector
FY80-FY90
FY90-FY04
FY05
TOTAL EXPORT GROWTH RATE 13.8 12.91 13.3 RMG EXPORT GROWTH RATE 95.2 18.83 16.7 WOVEN EXPORT GROWTH RATE NA 13.24 1.7 KNIT WEAR EXPORT GROWTH RATE NA 74.0 31.4
Source: Export Promotion Bureau of Bangladesh.
In the backdrop of the moderation in world output growth outlook and Bangladesh’s GDP growth projection during 2005, the economy’s export growth record in FY05 could be viewed as fairly strong. Given the fact that Bangladesh’s export is significantly destined to USA and the Euro area (more than 70 percent), it is a matter of imminent concern that the current year’s reduced growth forecast of both the USA and European countries particularly, Germany, UK, France and Belgium could squeeze the demand for Bangladesh’s exports, especially that for RMG and other textile products, leather and leather products, frozen foods, raw jute and jute products in those markets. But also other positive factors are there such as the recent depreciation of taka against US and Euro dollar28, improvement of Bangladesh’s terms of trade against the major export destination countries etc. which could improve Bangladesh’s export competitiveness in the international markets.
Bangladesh’s export basket is rather narrow, only a few products contribute a lion’s share of total exports. For instance, the RMG products’ share alone in total export earning is more than 75 percent and its main destinations are the USA and the Euro area. So, with the GDP growth moderating in those countries during 2005, the export demand would be lax. Again, with the world-wide removal of quota on RMG create heavy pressure on the price competitiveness of Bangladesh’s export and its negative impact has already been evident in the sharply decelerated annual growth record of only 1.7 percent of the woven RMG exports as of end June which is markedly lower than the target, and the
Chapter 2 (continued)
28 The depreciation of the Bangladesh’s taka against US dollar between July 2004 and July 2005 amounted to 6.9 percent (source: Bangladesh Bank Monthly Economic Trend, August 2005).

MPR_06_01
36
underperformance may partly reflect a loss in competitiveness in the international market. Last one month’s export figures also recorded a sharply receded growth of woven RMG exports29 which still represent more than half of the total RMG exports. The other component of RMG is knitwear which experienced significantly higher year on year growth (more than 31 percent) in FY05. Given the extreme importance of Bangladesh knitwear export trade with the Euro area, part of the rebound of export growth in those countries is probably explained by the fact that Bangladesh appears to have maintained the growing competitive advantage in knitwear products vis-à-vis other exporters, which is not evident in the case of woven garments sub-sector. Knit wears also proved to be the sector of higher level of domestic value addition than for woven products, which is also playing positive role in achieving higher growth record of its exports. However, in the backdrop of near-term lower growth prospect in both USA and the Euro area countries particularly, Germany, UK, France and Belgium and also of growing competition from such economies as China and India, that Bangladesh’s overall export growth will remain relatively robust in the first half of FY06.
On the upside, there is also prospective future for Bangladesh’s knitwear exports to the Euro area. First, given the fact that knitwear products are relatively inexpensive, these are unlikely to be adversely affected if economic growth remains anaemic, and indeed register solid growth, in the event the low and middle income earners’ spending capacity in the Euro area is enhanced. Secondly, in the Euro area a gradual pickup in the rate of growth of economic activity is also expected this year and next, especially if the adverse impact stemming from the past appreciation of the euro gradually tapers off. Thirdly, Germany, France and UK have gained competitiveness, which has boosted their export growth albeit slowly in the year 2005 and also their imports have picked up briskly.
Therefore, there are, as yet, few signs of any significant slackening of domestic demand growth. Looking ahead, these improvements may allow some scope for employment and real wage growth in these three countries. Particularly, employment growth, which had been notably
Figure 2.12 Export Performance during FY04-FY05
0100200300400500600700800900
1000
July
04
Aug
,04
Sept 0
4
Oct 0
4
Nov
04
Dec
04
Jan 05
Feb 05
Mar
ch 05
Apr
il 05
May
05
June
05
July
05
Mil
lio
n U
S d
oll
ar
Woven Knitwear Others
Source: Export Promotion Bureau of Bangladesh. Chapter 2 (continued)
29 According to EPB figures, in July, FY06 woven exports recorded a negative growth of 0.09 percent over the previous month but the kn itwear exports recorded a positive growth of more than 23 percent. The overall export growth has decelerated sharply to 4.18 percent in July, FY06 compared to 8.6 percent growth record in the same month of FY05.

MPR_06_01
37
weak in the early stages of the recovery, picked up both in 2004 and also in 2005. Similarly, lower near term growth prospect together with recent rebound of employment growth in USA (Table-2.2) may divert low and middle income earners’ spending to inexpensive clothing from many developing countries including Bangladesh.
2.3 Imports30
Bangladesh experienced a faster growth (21 percent or USD 2244 million) in imports during FY05. The three major causes that fuelled this strong growth were external shock from international oil prices accompanied by growing domestic demand for petroleum, shortage of food grains in the domestic economy due to the adverse flood in 2004 and strong domestic demand for capital machinery particularly in the RMG sector. However, expansionary fiscal policy accompanied by high credit growth influenced high growth of imports throughout the last fiscal year.
(a) Composition of Major Import Items
In FY 05 imports of Bangladesh were dominated mainly by textile, POL31, capital machinery, construction32, food grain, chemical, fertilizer and edible oil. Textile (21 percent) and petroleum (12 percent) accounted for major share of imports. Textile items were mostly inputs for RMG exports. Except textile, POL was the largest import item. The composition of the import portfolio has been shown in Figure 2.13.
Figure 2.13 Share of Major Import Items
Source: Based on data supplied by Statistics Department , Bangladesh Bank.
(b) Growth of Major Import Items and the Factors at Work
POL: Import of POL increased by 580 million US dollar i.e. 56.75 percent higher than the previous fiscal year. Given the large share of POL, it alone caused one quarter of the increase in total imports. Ninety one percent of the increased cost of POL (525 million US dollar) emanated from the big surge in international oil price. In quantum terms,
Chapter 2 (continued) 30 Prepared by Md. Kabir Ahmed. 31POL refers t o petroleum (crude & refined), oil and lubricants. 32 Construction includes clinker, iron and steel etc.
1 4
1 6
1 8
2 0
2 2
2 4
9 5 - 9 6 9 6 - 9 7 9 7 - 9 8 9 8 - 9 9 9 9 - 0 0 0 0 - 0 1 0 1 - 0 2 0 2 - 0 3 0 3 - 0 4 0 4 - 0 5
Impo
rt/G
DP
ratio
I m p o r t / G D P r a t i o

MPR_06_01
38
POL imports grew only by 5.38 percent due to rising domestic demand, which augmented additional import cost of 55 million USD. In fact, price of petroleum/petroleum products in the international market continuously grew in the last four fiscal years. Petroleum per barrel was 22.6 US dollar in FY02, which stood at 50.6 US dollar in FY 05. It can be expected that oil price will not go down below its current price in near future. Given the large share of POL in total imports, the recent boost in oil price may continue to create pressure on Current Account Balance in FY 06.
Figure 2.14 Changes in Price and Volume of POL Imports
3300
3400
3500
3600
3700
3800
3900
2002-03 2003-04 2004-05
tho
usan
d m
etr
ic t
on
0
500
1000
1500
2000
mil
lio
n U
S d
oll
ar
Quantity Price
Source: Based on data supplied by Statistics Department, Bangladesh Bank
Capital Machinery: In FY 05, import of capital machinery grew by 53 percent compared to 33 percent in the previous fiscal year. The industries that enjoyed this high growth were textile, garments, pharmaceuticals and printing. Growth rates of textile and garments machinery in FY05 were 50.20 percent and 31.92 percent respectively. These increased investments would enhance productive capacity of the economy and may enable RMG sector to become more competitive with the rest of the world. It can be mentioned that though Bangladesh maintained a high stable growth (12.9 percent) in RMG exports during the MFA-phase out period, the main source of this growth was knitwear exports. At the same time, Bangladesh experienced a notable downward trend (from a growth rate 8.6 percent in FY04 to 1.7 percent in FY05) in the export of Woven Garments, which usually makes up about two thirds of the total RMG exports. It can be expected that high growth rate in imports of textile machinery would have a positive influence on exports of Bangladesh including woven garments.
Figure 2.15 Import of Textile and Garments Machinery
0
50
100
150
200
250
300
2002-03 2003-04 2004-05
Mill
ion
US
dol
lar
Textile Garment
Source: Based on data supplied by Statistics Department, Bangladesh Bank Chapter 2 (continued)
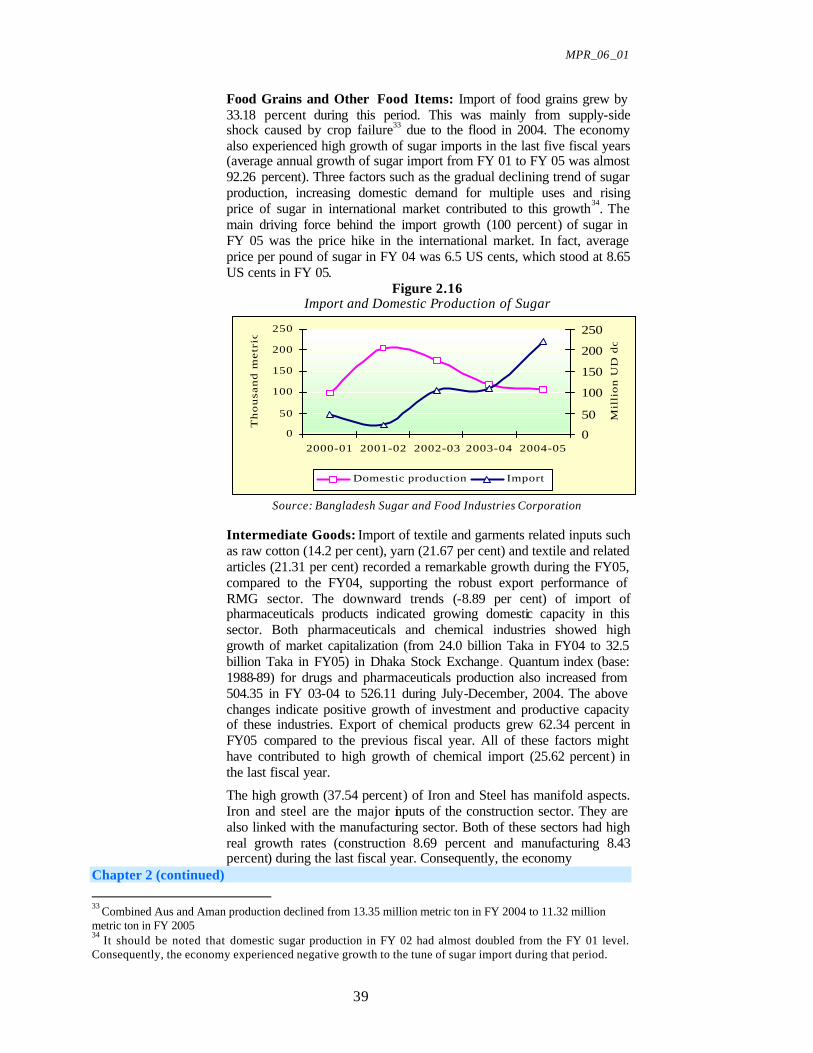
MPR_06_01
39
Food Grains and Other Food Items: Import of food grains grew by 33.18 percent during this period. This was mainly from supply-side shock caused by crop failure33 due to the flood in 2004. The economy also experienced high growth of sugar imports in the last five fiscal years (average annual growth of sugar import from FY 01 to FY 05 was almost 92.26 percent). Three factors such as the gradual declining trend of sugar production, increasing domestic demand for multiple uses and rising price of sugar in international market contributed to this growth34. The main driving force behind the import growth (100 percent) of sugar in FY 05 was the price hike in the international market. In fact, average price per pound of sugar in FY 04 was 6.5 US cents, which stood at 8.65 US cents in FY 05.
Figure 2.16 Import and Domestic Production of Sugar
0
50
100
150
200
250
2000-01 2001-02 2002-03 2003-04 2004-05
Th
ou
san
d m
etr
ic t
on
0
50
100
150
200
250
Mil
lio
n U
D d
oll
ar
Domestic production Import
Source: Bangladesh Sugar and Food Industries Corporation
Intermediate Goods: Import of textile and garments related inputs such as raw cotton (14.2 per cent), yarn (21.67 per cent) and textile and related articles (21.31 per cent) recorded a remarkable growth during the FY05, compared to the FY04, supporting the robust export performance of RMG sector. The downward trends (-8.89 per cent) of import of pharmaceuticals products indicated growing domestic capacity in this sector. Both pharmaceuticals and chemical industries showed high growth of market capitalization (from 24.0 billion Taka in FY04 to 32.5 billion Taka in FY05) in Dhaka Stock Exchange. Quantum index (base: 1988-89) for drugs and pharmaceuticals production also increased from 504.35 in FY 03-04 to 526.11 during July-December, 2004. The above changes indicate positive growth of investment and productive capacity of these industries. Export of chemical products grew 62.34 percent in FY05 compared to the previous fiscal year. All of these factors might have contributed to high growth of chemical import (25.62 percent) in the last fiscal year.
The high growth (37.54 percent) of Iron and Steel has manifold aspects. Iron and steel are the major inputs of the construction sector. They are also linked with the manufacturing sector. Both of these sectors had high real growth rates (construction 8.69 percent and manufacturing 8.43 percent) during the last fiscal year. Consequently, the economy
Chapter 2 (continued)
33 Combined Aus and Aman production declined from 13.35 million metric ton in FY 2004 to 11.32 million metric ton in FY 2005 34 It should be noted that domestic sugar production in FY 02 had almost doubled from the FY 01 level. Consequently, the economy experienced negative growth to the tune of sugar import during that period.

MPR_06_01
40
experienced high growth in imports of these intermediate goods. Continuous growth of these two sectors along with Government’s expansionary fiscal policy, particularly Annual Development Programme (ADP) that increased significantly (22.10 percent higher) from the previous fiscal year, may continue to influence high growth in imports of these items. Considering China’s impressive growth, price of construction materials may increase in FY 2005-06.
The economy had unprecedented experience in fertilizer import. It grew by 121.33 percent in the last fiscal year. This is due to declining trend of fertilizer production (5.43 percent from previous fiscal year) accompanied by high domestic demand. However, if the problem persists, import of fertilizer will increase and agriculture production may be hampered due to high import cost emanating from the depreciation of local currency in the recent past.
(c) Trend of Import/GDP Ratio
In terms of Import/GDP ratio, Bangladesh experienced stable growth in imports except a moderate upsurge in 2001-02; afterwards, it gradually rose but the rate was marginal. In 2004-05, it experienced a significant upswing. The ratio increased by 2.65 percent from the last fiscal year.
Figure 2.17 Import/GDP Trend
14
16
18
20
22
24
95
-96
96
-97
97
-98
98
-99
99
-00
00
-01
01
-02
02
-03
03
-04
04
-05
Impo
rt/G
DP
Rat
io
Import/GDP ratio
Source: Based on BB and National Accounts Statistics, BBS, June 2005
(d) Import/Export Trend
Apparently import over export increased significantly during the fiscal year 2004-05 causing a further deficit in the trade balance. Since import of capital machinery increases productive capacity of the economy and will have a positive effect on trade balance through import substitution effect and export-led growth effect, import of capital machinery can be momentarily disregarded in order to sharpen the understanding of the "core" import/export trend. It is observed that though import/export ratio in FY 05, compared to previous fiscal year, rose rather sharply it was stable compared to the recent experience.
It can be argued that tightening of monetary policy accompanied by depreciation of local currency may stabilize the current growth rate of imports in the medium term.
Chapter 2 (continued)

MPR_06_01
41
Figure 2.18
Import/Export Trends
Source: Based on data supplied by Statistics Department, Bangladesh Bank
Figure 2.19 Import/Export trends excluding the imports of capital machinery
Source: Based on data supplied by Statistics Department, Bangladesh Bank
2.4 Current Account Balance35
The current account balance (CAB) swung from a continuous run of surpluses from FY 02 to FY 04 into a modest deficit during FY 05. In fact, the current account recorded a deficit of USD 557 million in FY05 compared to a surplus of USD 176 million in FY 04. CAB/GDP ratio turned into a deficit of 0.86 percent in FY05 from its surplus position of 0.31 percent in FY04. Large expansion of imports due to domestic macroeconomic factors such as high growth of domestic credit (17.53 percent), expansionary fiscal policy (budget deficit grew to 4.5 percent of GDP), rising inflation, strong demand for capital machinery and external developments such as oil price hike in international market, competitive pressure from China and India in RMG exports substantially contributed to this cause.
35 Prepared by Md. Kabir Ahmed
Import/Export Trend
1.49
1.45
1.53
1.44
1.381.401.421.441.461.481.501.521.541.56
2001-02 2002-03 2003-04 2004-05
Impo
rt/E
xpor
t Rat
io
1.35
1.41
1.35
1.40
1.241.28
1.321.36
1.40
1.441.48
1.521.56
2001-02 2002-03 2003-04 2004-05
Impo
rt/E
xpor
t Rat
io
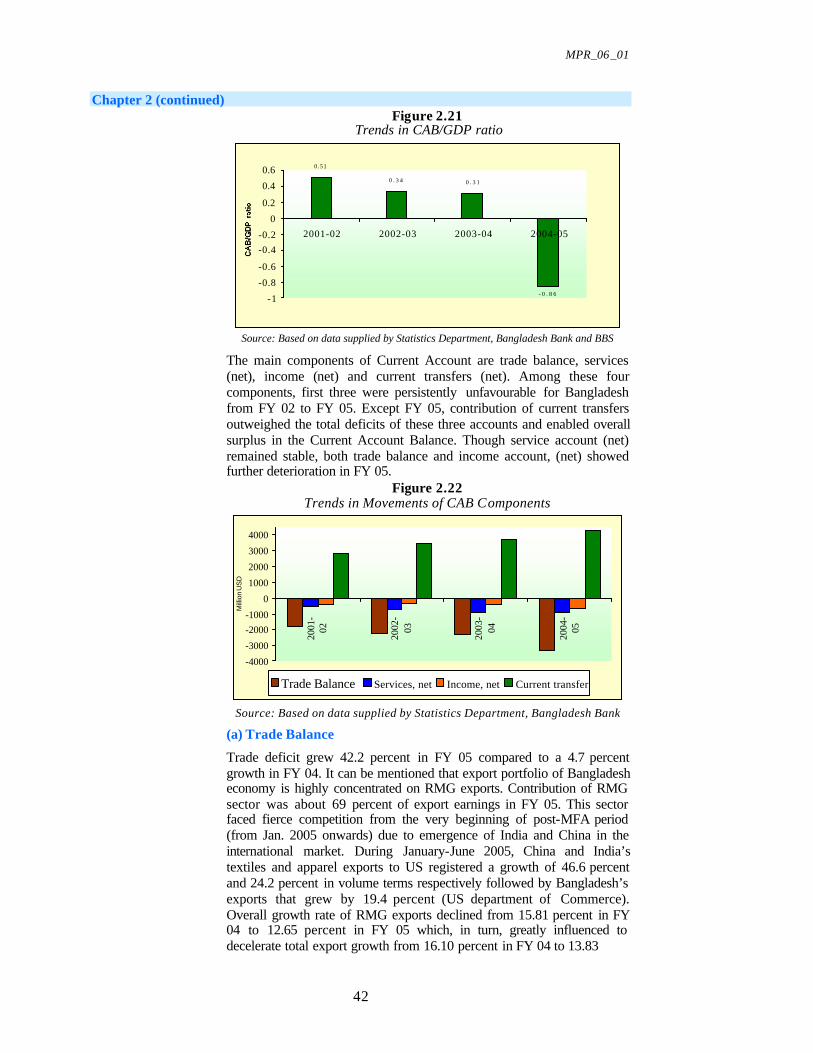
MPR_06_01
42
Chapter 2 (continued) Figure 2.21
Trends in CAB/GDP ratio
0.51
0 . 3 4 0 . 3 1
- 0 . 8 6-1
-0.8
-0.6
-0.4
-0.2
0
0.2
0.4
0.6
2001-02 2002-03 2003-04 2004-05
Source: Based on data supplied by Statistics Department, Bangladesh Bank and BBS
The main components of Current Account are trade balance, services (net), income (net) and current transfers (net). Among these four components, first three were persistently unfavourable for Bangladesh from FY 02 to FY 05. Except FY 05, contribution of current transfers outweighed the total deficits of these three accounts and enabled overall surplus in the Current Account Balance. Though service account (net) remained stable, both trade balance and income account, (net) showed further deterioration in FY 05.
Figure 2.22 Trends in Movements of CAB Components
-4000
-3000
-2000
-1000
0
1000
2000
3000
4000
2001
-02
2002
-03
2003
-04
2004
-05
Mill
ion
US
D
Trade Balance Services, net Income, net Current transfer
Source: Based on data supplied by Statistics Department, Bangladesh Bank
(a) Trade Balance
Trade deficit grew 42.2 percent in FY 05 compared to a 4.7 percent growth in FY 04. It can be mentioned that export portfolio of Bangladesh economy is highly concentrated on RMG exports. Contribution of RMG sector was about 69 percent of export earnings in FY 05. This sector faced fierce competition from the very beginning of post-MFA period (from Jan. 2005 onwards) due to emergence of India and China in the international market. During January-June 2005, China and India’s textiles and apparel exports to US registered a growth of 46.6 percent and 24.2 percent in volume terms respectively followed by Bangladesh’s exports that grew by 19.4 percent (US department of Commerce). Overall growth rate of RMG exports declined from 15.81 percent in FY 04 to 12.65 percent in FY 05 which, in turn, greatly influenced to decelerate total export growth from 16.10 percent in FY 04 to 13.83

MPR_06_01
43
Chapter 2 (continued) percent in FY 05. On the other hand, strong growth of imports for capital machinery (about 53 percent), Fertilizer (121.33 percent), POL (56.75 percent ), agricultural products such as food grains and sugar, construction materials caused the growth of imports by 20.58 percent in FY 05 from 12.58 percent in FY 04.
(b) Services (net)
The main components of services account are transportation, travel and others. The net balance of this account in FY 2004 was (–) 874.3 million USD which increased to (–) 870.1 million USD indicating marginal improvement. However, deficit in the net balance of transportation increased by 1538.6 million USD which was partly compensated by favourable improvement of 761.3 million USD in "Others" category. This upward trend of transportation cost (net) may persist in future due to mainly rising price of oil in the international market.
(c) Income Account (net)
Net outflow of income account in FY 05 was 640.8 million USD, which was significantly higher (about 266.7 million USD) than FY 04. A further analysis shows that interest and investment income were the major sources of these outflows. Outflow of investment income, mostly on Foreign Direct Investment (FDI), increased from 260.9 million USD in FY 04 to 550.8 million USD in FY 05. These payments were mainly remitted to Belgium, Hong Kong, Malaysia , Netherlands, Norway, Switzerland, UAE and UK. Another component, though not so significant, that contributed to this cause was interest payments on external debt stocks that rose from 17.95 billion USD in FY04 to 18.57 billion (provisional) USD in FY05. Consequently, interest on external debt rose from 174.6 million USD in FY04 to 203.1 million USD in FY05.
Figure 2.23 Trends in Outflow Investment Income and Interest on External Debt
-560-510-460-410-360-310-260-210-160-110-60-1040
2001-02 2002-03 2003-04 2004-05
Mil
lion
USD
Investment income Interest payment Others
Source: Based on data supplied by Statistics Department, Bangladesh Bank
(d) Current Transfers
During FY 05, current transfers reached at 4290 million USD from 3743 million USD in FY 04 by registering a significant growth of 14.6 percent. About 90 percent of transfers (3848 million USD) in this

MPR_06_01
44
Chapter 2 (continued) account was inward remittances from expatriate Bangladesh nationals working abroad. Indeed, workers’ remittances are the real strength of Current Transfers as well as Current Account. It can be noted that from FY 02 to FY 04, remittances covered more than 95 percent of total deficits in trade, service and income accounts and this contribution significantly dropped down to 80 percent of total deficit in FY 05 due to burgeoning trade deficit. Though inflow of remittances was buoyant (14.1 percent) in FY 05 but was outstripped by 42.5 growth in trade deficit. (e) Remittances
About 70 percent (based on FY 05’s remittances) of the total foreign remittances flowed from the Gulf States. It can be argued that the recent increase in the oil prices will lead to greater economic activity in these oil producing countries resulting in more demand of workers from Bangladesh in the coming years. Continuous improvement of workers’ remittances through official channels, among other factors, may be due to high labour mobility, domestic and international restrictions on undocumented transactions, speeding up of delivery services and opening of exchange houses in source countries.
Figure 2.24 Current Transfers
Source: Based on data supplied by Statistics Department, Bangladesh Bank
Figure 2.25 Share of Workers' Remittances
Gulf region70%
Euro region10%
Asia pacific
2%
ROW18%
Source: Based on data supplied by Statistics Department, Bangladesh Bank
05 0 0
1 0 0 01 5 0 02 0 0 02 5 0 03 0 0 03 5 0 04 0 0 04 5 0 05 0 0 0
2 0 0 1 - 0 2 2 0 0 2 - 0 3 2 0 0 3 - 0 4 2 0 0 4 - 0 5
Mil
lio
n U
SD
W o r k e r s ' r e m i t t a n c e s O t h e r t r a n s f e r s
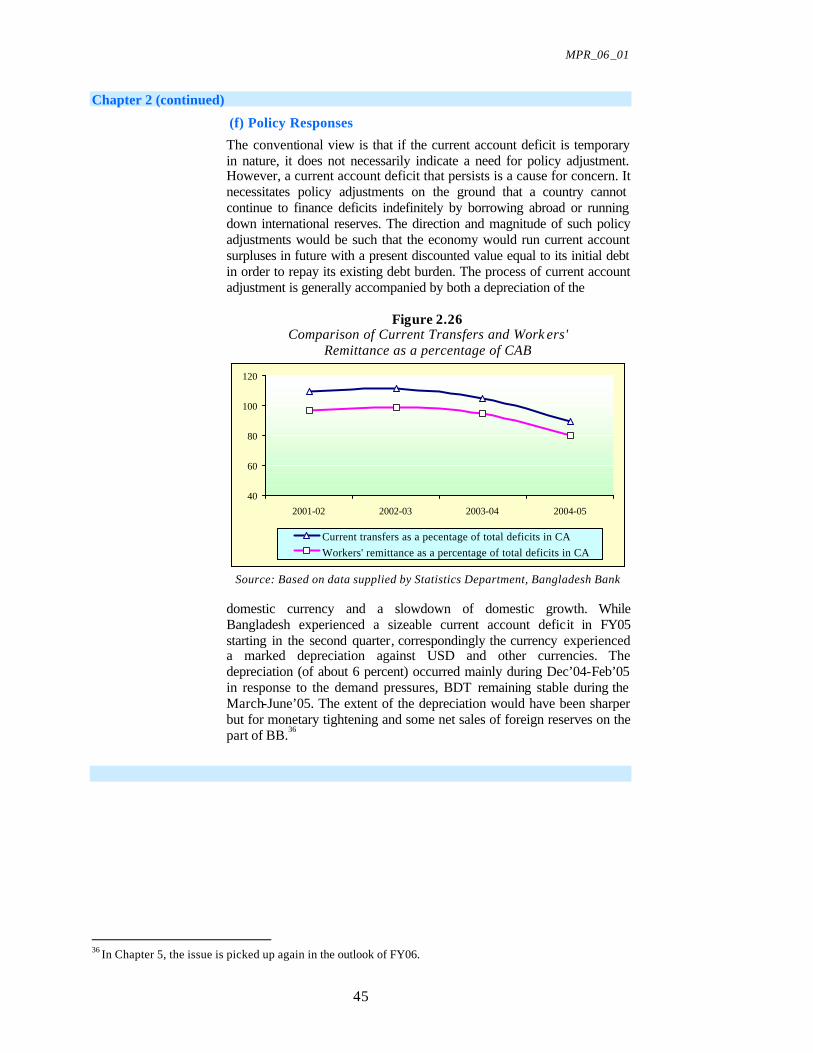
MPR_06_01
45
Chapter 2 (continued)
(f) Policy Responses
The conventional view is that if the current account deficit is temporary in nature, it does not necessarily indicate a need for policy adjustment. However, a current account deficit that persists is a cause for concern. It necessitates policy adjustments on the ground that a country cannot continue to finance deficits indefinitely by borrowing abroad or running down international reserves. The direction and magnitude of such policy adjustments would be such that the economy would run current account surpluses in future with a present discounted value equal to its initial debt in order to repay its existing debt burden. The process of current account adjustment is generally accompanied by both a depreciation of the
Figure 2.26 Comparison of Current Transfers and Work ers'
Remittance as a percentage of CAB
40
60
80
100
120
2001-02 2002-03 2003-04 2004-05
Current transfers as a pecentage of total deficits in CA Workers' remittance as a percentage of total deficits in CA
Source: Based on data supplied by Statistics Department, Bangladesh Bank
domestic currency and a slowdown of domestic growth. While Bangladesh experienced a sizeable current account deficit in FY05 starting in the second quarter, correspondingly the currency experienced a marked depreciation against USD and other currencies. The depreciation (of about 6 percent) occurred mainly during Dec’04-Feb’05 in response to the demand pressures, BDT remaining stable during the March-June’05. The extent of the depreciation would have been sharper but for monetary tightening and some net sales of foreign reserves on the part of BB.36
36 In Chapter 5, the issue is picked up again in the outlook of FY06.

MPR_06_01
46
Chapter 2 (continued) References:
Annual Report 2004, Bangladesh Bank Asian Development Outlook, 2005, ADB Bangladesh Bank, Economic Trends, September 2005 Bangladesh Bank, Bangladesh Bank Quarterly , April –June 2005 Bangladesh Bureau of Statistics (2004), Report on Labour Force Survey 2002-2003. Bangladesh Bureau of Statistics (2005), National Accounts Statistics, June 2005. Bangladesh Economic Review 2005, Ministry of Finance, Finance Division Economic Trend, Various Issues, Bangladesh Bank Import Payments, Various issues, Bangladesh Bank Reserve Bank of India Bulletin, September 2005 The Economist, September 23, 2005 World Economic Outlook, October 2005, IMF

MPR_06_01
47
Chapter 3 Monetary and Financial Developments37
3.1 Short-term Interest Rates and Bond Yields38
(a) Overnight Money Market in Bangladesh
Money market in Bangladesh, especially the overnight market, has undergone significant changes in the last few years. In order to reinforce indirect monetary operation and to manage the day-to-day liquidity position in the market, Bangladesh Bank has introduced several new arrangements in recent years namely Repo (Repurchase Agreement), Reverse Repo and Interbank Repo Operation from July 2002, April 2003 and July 2003, respectively. Both Repo and Reverse Repo transactions are conducted through auctions held on each working day at Bangladesh Bank. Through Repo operation, BB lends fund to a bank or financial institution by purchasing security, which the bank or financial institution repurchases upon maturity. The Reverse Repo facility enables participating institutions to purchase government securities from Bangladesh Bank upon commitment of resale after the agreed upon term. Both Repo and Reverse Repo arrangements are for overnight to seven-day terms39.
In addition to the Repo and Reverse Repo arrangements, the Bangladesh Bank also allows the banks and other financial institutions to make secondary transaction of treasury bills and other government securities in their possession, which is called “Interbank Repo” in Bangladesh banking jargon. The rate in the interbank repo operation is freely determined in the market place where the central bank exercises zero intervention. Interbank Repo transactions can be made for a term depending on the maturity of the bills and bonds. However, it is observed from the market that a majority of the deals are for one- to- two days.
Figure 3.1 Trade in Overnight Money Market in FY05
1-2 Day Interbank Repo, 3%
1-2 Day Repo , 4%
M o n e y a t c a l l , 9 3 %
Source: Constructed based from data from the Monetary Policy Department, BB
Chapter 3 (continued) 37 Contributed by Dr. Md. Habibur Rahman, Dr. Sayera Younus and Md. Shahiduzzaman 38 Prepared by Md. Shahiduzzaman 39 The term can be extended by the number of Bank holidays.
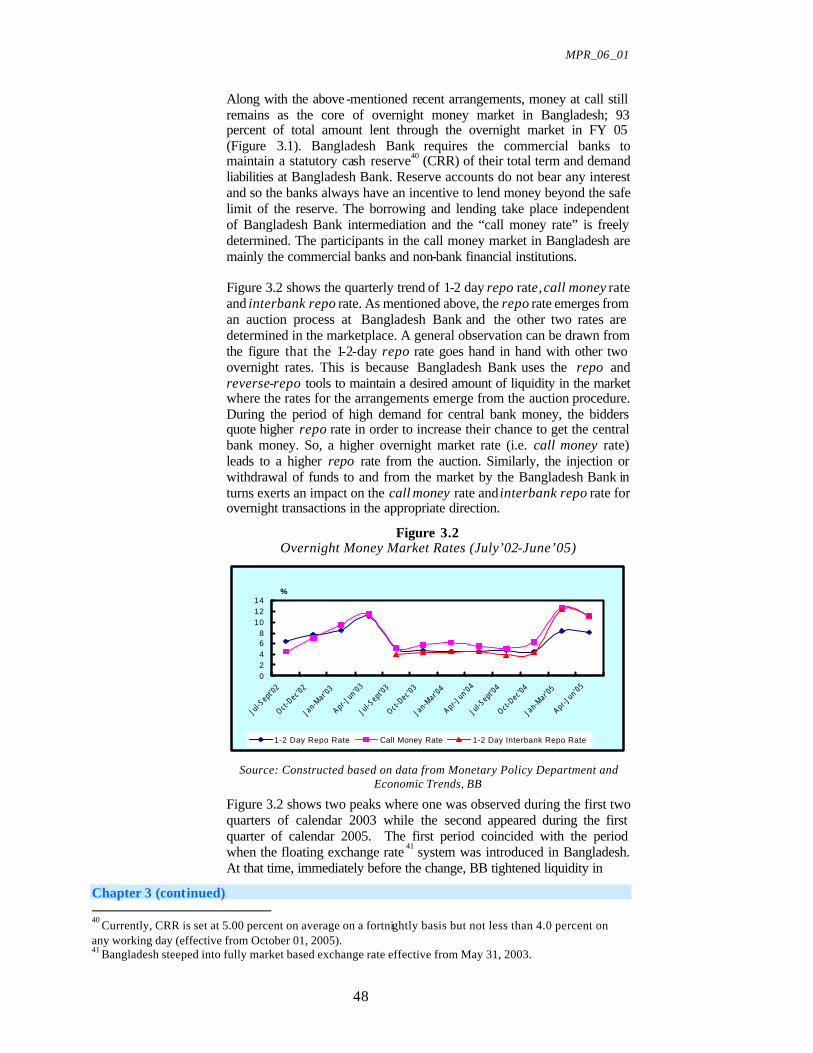
MPR_06_01
48
Along with the above-mentioned recent arrangements, money at call still remains as the core of overnight money market in Bangladesh; 93 percent of total amount lent through the overnight market in FY 05 (Figure 3.1). Bangladesh Bank requires the commercial banks to maintain a statutory cash reserve40 (CRR) of their total term and demand liabilities at Bangladesh Bank. Reserve accounts do not bear any interest and so the banks always have an incentive to lend money beyond the safe limit of the reserve. The borrowing and lending take place independent of Bangladesh Bank intermediation and the “call money rate” is freely determined. The participants in the call money market in Bangladesh are mainly the commercial banks and non-bank financial institutions. Figure 3.2 shows the quarterly trend of 1-2 day repo rate, call money rate and interbank repo rate. As mentioned above, the repo rate emerges from an auction process at Bangladesh Bank and the other two rates are determined in the marketplace. A general observation can be drawn from the figure that the 1-2-day repo rate goes hand in hand with other two overnight rates. This is because Bangladesh Bank uses the repo and reverse-repo tools to maintain a desired amount of liquidity in the market where the rates for the arrangements emerge from the auction procedure. During the period of high demand for central bank money, the bidders quote higher repo rate in order to increase their chance to get the central bank money. So, a higher overnight market rate (i.e. call money rate) leads to a higher repo rate from the auction. Similarly, the injection or withdrawal of funds to and from the market by the Bangladesh Bank in turns exerts an impact on the call money rate and interbank repo rate for overnight transactions in the appropriate direction.
Figure 3.2 Overnight Money Market Rates (July’02-June’05)
02468
101214
Jul-S
ept'02
Oct-Dec'02
Jan-Mar'0
3
Apr -Jun '0
3
Jul-S
ept'03
Oct-Dec'03
Jan-Mar'0
4
Apr -Jun '0
4
Jul-S
ept'04
Oct-Dec'04
Jan-Mar'0
5
Apr -Jun '0
5
%
1-2 Day Repo Rate Call Money Rate 1-2 Day Interbank Repo Rate
Source: Constructed based on data from Monetary Policy Department and Economic Trends, BB
Figure 3.2 shows two peaks where one was observed during the first two quarters of calendar 2003 while the second appeared during the first quarter of calendar 2005. The first period coincided with the period when the floating exchange rate 41 system was introduced in Bangladesh. At that time, immediately before the change, BB tightened liquidity in
Chapter 3 (continued) 40 Currently, CRR is set at 5.00 percent on average on a fortnightly basis but not less than 4.0 percent on any working day (effective from October 01, 2005). 41 Bangladesh steeped into fully market based exchange rate effective from May 31, 2003.

MPR_06_01
49
the market as a precautionary measure in order to curb speculative tendencies in the foreign exchange market and to contain the value of domestic currency. As a result of such tight open market operation, the overnight money market interest rates faced pressure as evidenced by the call money rate as it reached a level of above forty percent (Bangladesh Bank, 2002-2003) at that time. The second hike occurred during a period when the central bank tightened liquidity in the market as it found problems relating to the prices of essentials and balance of payment situation more pressing. In both the cases, BB successfully managed the pressure on rates in overnight market as evident from the immediate downward move after the hikes. It can be concluded that even though the scale of trade in repo operation in overnight market is very small (only 4 percent in FY05), it works as an effective fine tuning device in the overnight money market and Bangladesh Bank has been very successful in using the repo and reverse repo tools to influence the market rates.
Figure 3.3 shows the movement of yield curve in recent years. The curves have typical upward sloping shape. It can be observed that the curve first went substantially shifted down in 2004 from the 2003 level, and then shifted up reflecting a swift move in the monetary policy stance of BB. Secondly, the most recent curve (as at 28.08.2005) is most flattened, mainly driven by the comparatively faster increase of the shorter term rates than the longer ones.
Figure 3.3 Movement of Yield Curve42s on Government B onds/ Bills in Recent Years
3.00
5.00
7.00
9.00
11.00
0 1000 2000 3000 4000
%
06 July,03
13 March 0527 June 0428 August 05
Days
Source: Constructed based on data from Monetary Policy Department
Conclusion
It is evident from the above analysis that the recently introduced overnight money market arrangements (e.g. Repo, Reverse Repo etc.) have proved useful in influencing the overnight money market in Bangladesh. However, as the exchange rate and inflationary pressures are persisting, BB's involvement in the overnight market is likely to remain of prime importance.
Chapter 3 (continued)
42 The yield curve produced here is based on primary market data. It pro vides useful information regarding monetary policy stance of Bangladesh Bank. A yield curve based on full market based data is extremely crucial to understand the economic condition of the country.

MPR_06_01
50
3.2 Long -term Interest Rates and Inflation43
(a) Introduction
The intention of this section is to identify the relationship, if any between the long-term nominal interest rate and inflation in Bangladesh. Irving Fisher’s (1907) seminal work on nominal interest rate determination perhaps is the earliest theory about the determination of nominal interest rates. According to Fisher’s theory of interest, movements in nominal bond yields originate in two sources: changes in real interest rates and changes in expected inflation. Thus, Fisher’s theory provides a guide for investigating the extent to which long-term bond yields serve as reliable indicators of long-term inflationary expectations. Specifically, it implies that movements in long-term bond yields provide useful signals of changes in inflationary expectations if and only if their other determinant, the long-term real interest rate, is stable.
Federal Reserve (Fed) policymakers rely on long-term bond yields to measure the public’s long-term inflationary expectations. Mehra (1995) using an econometric model demonstrated that changes in long-term bond rates did help explain movements in the federal funds rate during the 1980s. Mishkin (1988) also find evidence that there is significant information of the term structure about the future path of inflation for maturities greater than six months for the sample period from 1964 to 1986. However, there is no information about the future path of inflation that can be obtained from the shorter end of the term structure for maturities of six months or less. Mishkin and Jorion (1991) extended this study for West Germany, Switzerland and Britain for the 1973-1989 periods, and found evidence that even with wide differences in inflation in these countries there is strong evidence that the term structure does have forecast ability for future change in inflation particularly at longer maturities in these countries.
This topic is very important because inflation is a major concern for policymakers and real long-term interest rates play an important role in determining longer-term saving and investment decisions of a country. They also influence business spending, household investment and the consumption of durable goods, which in turn affect the business cycle, and the transmission of macroeconomic policies.
(b) An Overview of the Long Term Interest Rate
In Bangladesh, the bond market is still in its rudimentary stage. In order to develop the secondary marke t for bonds eight banks and one financial institution has been given primary dealership by the Bangladesh Bank. However, they are yet to adopt any effective measure to develop the secondary market. For the purposes of this document, long-term interest rates are taken to refer to representative low-risk government treasury bills with a maturity of about 364-day, 2-year and 5-year, and also 5-year and 10-year Bangladesh Government Treasury Bond (BGTB). It could be mentioned here that the auction of 5-year Treasury bill is suspended since March 10, 2004 and the inception of the 5-year and 10-year BGTBs started since December 28, 2003. Non-availability of time series data on bonds for regression purposes is a bottleneck for those working
43 Prepared by Dr. Sayera Younus.

MPR_06_01
51
Chapter 3 (continued) with Bangladesh data. However, in order to get a sense of the relationship between long term interest rate and inflation in Bangladesh, 364-day, 2-year and 5-year Treasury bills rates are used. Data plot of the 5-year and 10-year government bonds and inflation is used to gauge the relationship. Next, the yield curves of bonds and Treasury bills and trends of other related variables are examined.
Figure-3.4 shows the yield curves of govt. treasury bills and bonds during January 2005 and August 2005. It is evident from Fig-3.4 that the yield curves of govt. treasury bills and bonds shifts upward and became very steep at the right end indicating large increase in the interest rate at longer maturities due to time preference of an economic agent. The steep yield curve at the right end also reflects higher inflation expectations and short-term interest rate in the future.
Figure 3.4 Yield curve of Govt. Treasury Bills and Bonds
Source: Monetary Policy Department
Figure 3.5
Yield Curve of Govt. Treasury Bills
Figure-3.5 shows the yield curve of govt. treasury bills of different terms to maturity. The upward sloping and upward shifting yield curves of treasury bills again reflecting the possibility of increase in the short term interest rate in the future in the face of upward inflationary pressures.
Figure-3.6 shows the BGTB yield curves. The upward sloping yield curve indicating that future short-term interest rate may increase.
Chapter 3 (continued)
02468
101214
28-Day 91-Day 182-Day 364-Day 2-Year 5-Year Term to maturity
Inte
rest
rate
16-02-03 15-02-04
0 2 4 6 8
10 12
28-Day TB 91-Day TB 182-Day TB
364-Day TB 2-Year TB 5 Year BGTB
10 Year BGTB
Term to Maturity
Nom
inal
Inte
rest
Rat
e
02-01-05 28-08-05

MPR_06_01
52
Figure 3.6 Yield Curve of Long Term Interest Rate
Source: Monetary Policy Department
Figure 3.7
Yield curve of Govt. Bond with the same maturity
Source: Monetary Policy Department
Figure-3.7 is showing the yield curve of special govt. bond (e.g., Jute, BJMC, and Biman) of the same maturity. It reveals that even though the term to maturity is same the interest rate is different mainly due to different default risk, liquidity and tax considerations (Mishkin, 1992).
Figure 3.8
Yield curve of Govt. Special Bond with different maturity
Source: Monetary Policy Department
Chapter 3 (continued)
0.00
2.00
4.00 6.00
8.00
10.00 12.00
5-Year BGTB* 10-Year BGTB
28-12-03 03-04-05
0 0.02 0.04 0.06 0.08
0.1 0.12
3 3 3 3 3 3 3 Years
Inte
rest
rate
0 0.02 0.04 0.06 0.08 0.1
0.12
3 3 3 3 3 3 3 5 10 10 25 25 25 Term to Maturity
Inte
rest
rate

MPR_06_01
53
Figure-3.8 shows the yield curve of special govt. bond (e.g., Jute, BJMC, and Biman) of different maturities. It reveals that the interest rate of different terms to maturity bonds are different and has lower interest rate for the bonds with longer maturities.
Figure-3.9 shows the trends in investment in govt. treasury bills by Deposit Money Banks (DMBs). It is evident from Figure 3.7 that DMBs investment in govt. treasury bills of less than 1-year maturity is higher than investment in govt. treasury bills of 1 year and above.
Figure 3.9 Trends of Investment in T. Bill by DMBs
Source: Monetary Policy Department
Figure 3.10 Trends of investment in Treasury Bonds by DMBs
Source: Monetary Policy Department
The scenario is reversed when it comes to the question of investment in govt. treasury bonds. Investment in govt. treasury bonds with longer maturities is higher than the bonds with lower maturities. Figures 3.11 and 3.12 show the growth rate of DMB investment in govt. treasury bills and bonds. The Figures 3.12 and 3.13 indicate that short-term investment is more volatile than long-term investment.
The above yield curves and trends of govt. treasury bills and bonds give an idea how does the primary market in treasury bills and bonds work in Bangladesh.
Chapter 3 (continued)
-50000
0
50000
100000
150000
200000
Jan, 03 June, 03 Nov, 03 April, 04 Sept, 04 Feb., 05 July, 05BD
T in
Mill
ion
T.BILL (LESS 1YR)
T.BILL (1YR & ABOVE)
-15000 -5000 5000
15000 25000 35000 45000 55000
Jan, 03 May, 03 Sep, 03 Jan, 04 May, 04 Sept, 04 Jan., 05 May, 05
BDT
in m
illion
T. Bond (1 YR & less than 5 YR) T. Bond (5 YR & above)

MPR_06_01
54
Figure 3.11 Growth Rate of T. Bill
Source: Monetary Policy Department
Figure 3.12
Growth Rate of T. Bond
Source: Monetary Policy Department
(c) Inflation Trends
At the beginning of FY05, Bangladesh Bank followed a cautiously accommodative monetary policy to support strong private sector credit demand. Private sector credit demand together with forgiveness of interest rate of about 202 crore on agriculture credit up to BDT 5000 by the government under post-flood rehabilitation program, and fresh agricultural credit disbursement by the commercial and specialized banks registered a growth of 16.8 percent private sector credit in FY05 as against 14.02 percent growth in FY04. These domestic factors combined with a sizable depreciation of Taka-Dollar exchange rate during second half of FY05 essentially put upward pressure on CPI inflation, which exhibited moderating trend during the first half of the year and showed an upward trend in the second half of FY05. Inflation rate went up from 5.64 percent as of end June, 04 to 7.4 percent as of end June , 05 (12 month point-to-point CPI inflation, Base FY96 =100). A number of factors contributed to the rapid rise in inflation for example, shortage of some food items in the domestic market, energy price adjustment, marked depreciation of the Taka vis-à-vis US dollar and other major
-40 -20
0
20 40 60 80
100
Feb, 03 June, 0 Oct, 03 Feb, 04 June, 0 Oct., 0 Feb., 0 June, 0
Time
%
GT.BILL (LESS 1YR) GT.BILL (1YR&ABOVE)
-40 -20
0 20 40 60 80
100 120 140
Feb, 03 Aug, 03 Feb, 04 Aug, 04 Feb., 05
Time
%
GT.Bond (1 YR, LESS 5 YR) GT.Bond (5 YRS & ABOVE)

MPR_06_01
55
Chapter 3 (continued) currencies, and rise in prices of some commodities in the international market particularly, petroleum products.
(d) Relationship between Long-term Interest rate and Inflation
Figure 3.13 shows the trends of 12-month point-to-point rate of inflation and long-term interest rate. It is evident from Fig-3.13 that there is apparently a negative relationship between long-term Treasury bill rates and inflation. When the interest rate is higher, inflation is lower; gradually interest rate start to decrease following tight monetary policy and inflation starts to increase following expansionary monetary policy.
Figure 3.13 Trends of long term interest rate and inflation
0.002.00
4.006.008.00
10.0012.0014.00
27-10-02 23-02-03 29-06-03 26-10-03 15-02-04
Inte
rest ra
te/in
flati
on
rate
364-Day 2-Year 5-Year CPI
Source: Monetary Policy Department and Research Department
Figure 3.14
Trends of long term (BGTB) yields and inflation
0.00
2.00
4.00
6.00
8.00
10.00
12.00
Jan-05 Mar-05 May-05
Inte
rest ra
te/in
flati
on
rate
5 Year BGTB 10 Year BGTB12m pto inf
Source: Monetary Policy Department and Research Department
Figure 3.14 shows the trends of 12-month point-to-point rate of inflation and long-term bond (BGTB) yield rates. It is evident from Fig-3.14 that long-term Treasury bond rates and inflation are moving together. It could be mentioned here that the inception of 5-Year and 10-Year BGTB started from December 28, 2003.
The yield data analysed above are not market determined, and hence the conclusions can only be taken as illustrative in nature. Nevertheless some preliminary estimates offered in the Box 3.1 show that various intermediate term yields (e.g. the 2-year T-bill rate) may succeed in predict future inflation. However, one would require further analysis to validate these findings
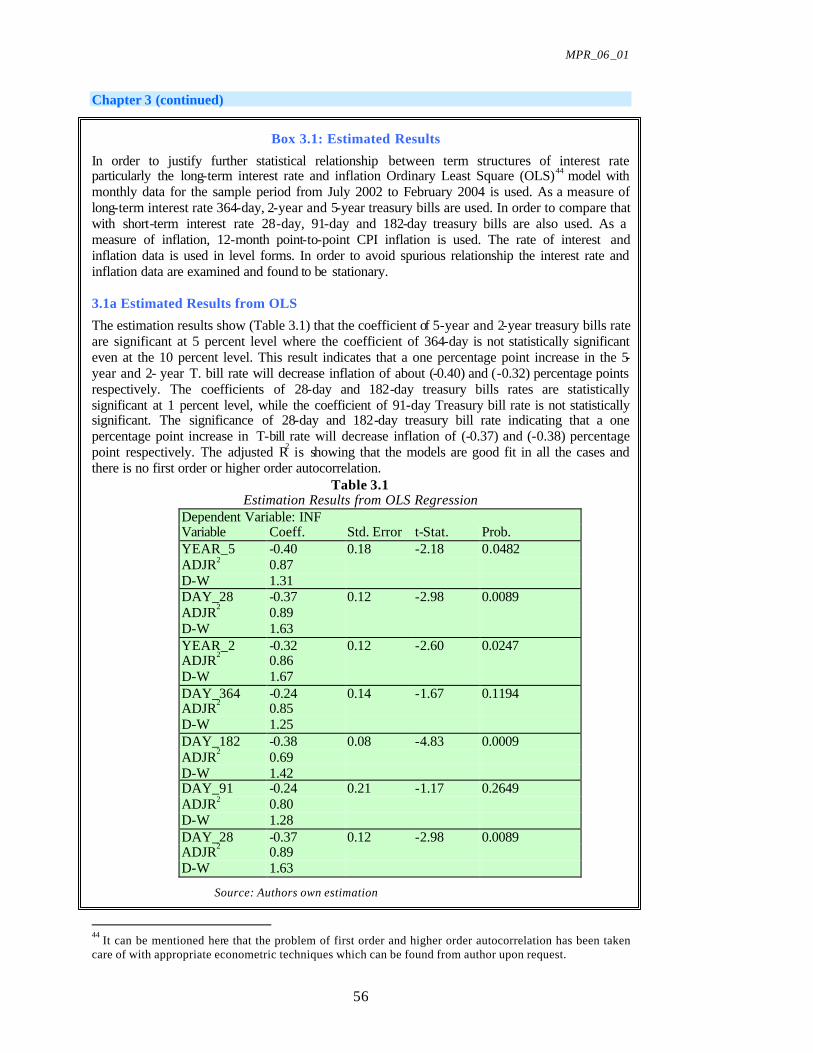
MPR_06_01
56
Chapter 3 (continued)
Box 3.1: Estimated Results
In order to justify further statistical relationship between term structures of interest rate particularly the long-term interest rate and inflation Ordinary Least Square (OLS)44 model with monthly data for the sample period from July 2002 to February 2004 is used. As a measure of long-term interest rate 364-day, 2-year and 5-year treasury bills are used. In order to compare that with short-term interest rate 28-day, 91-day and 182-day treasury bills are also used. As a measure of inflation, 12-month point-to-point CPI inflation is used. The rate of interest and inflation data is used in level forms. In order to avoid spurious relationship the interest rate and inflation data are examined and found to be stationary. 3.1a Estimated Results from OLS
The estimation results show (Table 3.1) that the coefficient of 5-year and 2-year treasury bills rate are significant at 5 percent level where the coefficient of 364-day is not statistically significant even at the 10 percent level. This result indicates that a one percentage point increase in the 5-year and 2- year T. bill rate will decrease inflation of about (-0.40) and (-0.32) percentage points respectively. The coefficients of 28-day and 182-day treasury bills rates are statistically significant at 1 percent level, while the coefficient of 91-day Treasury bill rate is not statistically significant. The significance of 28-day and 182-day treasury bill rate indicating that a one percentage point increase in T-bill rate will decrease inflation of (-0.37) and (-0.38) percentage point respectively. The adjusted R2 is showing that the models are good fit in all the cases and there is no first order or higher order autocorrelation.
Table 3.1 Estimation Results from OLS Regression
Dependent Variable: INF Variable Coeff. Std. Error t-Stat. Prob. YEAR_5 -0.40 0.18 -2.18 0.0482 ADJR2 0.87 D-W 1.31 DAY_28 -0.37 0.12 -2.98 0.0089 ADJR2 0.89 D-W 1.63 YEAR_2 -0.32 0.12 -2.60 0.0247 ADJR2 0.86 D-W 1.67 DAY_364 -0.24 0.14 -1.67 0.1194 ADJR2 0.85 D-W 1.25 DAY_182 -0.38 0.08 -4.83 0.0009 ADJR2 0.69 D-W 1.42 DAY_91 -0.24 0.21 -1.17 0.2649 ADJR2 0.80 D-W 1.28 DAY_28 -0.37 0.12 -2.98 0.0089 ADJR2 0.89 D-W 1.63
44 It can be mentioned here that the problem of first order and higher order autocorrelation has been taken care of with appropriate econometric techniques which can be found from author upon request.
Source: Authors own estimation
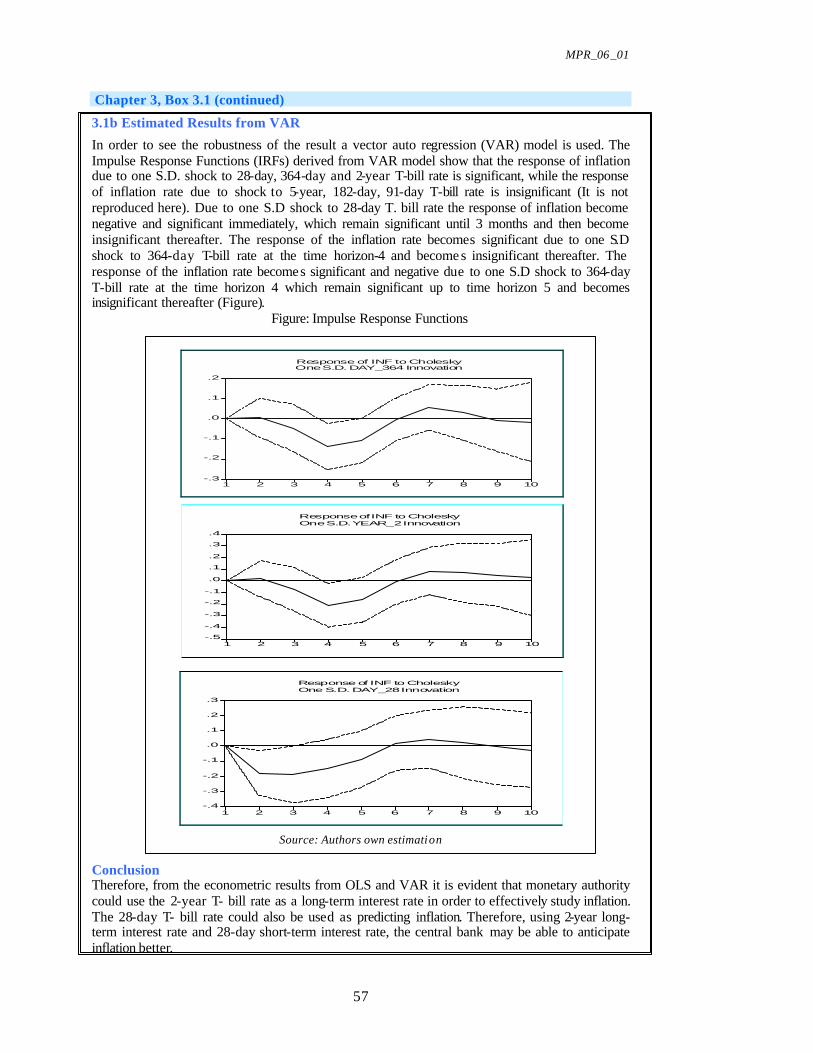
MPR_06_01
57
Chapter 3, Box 3.1 (continued)
3.1b Estimated Results from VAR
In order to see the robustness of the result a vector auto regression (VAR) model is used. The Impulse Response Functions (IRFs) derived from VAR model show that the response of inflation due to one S.D. shock to 28-day, 364-day and 2-year T-bill rate is significant, while the response of inflation rate due to shock to 5-year, 182-day, 91-day T-bill rate is insignificant (It is not reproduced here). Due to one S.D shock to 28-day T. bill rate the response of inflation become negative and significant immediately, which remain significant until 3 months and then become insignificant thereafter. The response of the inflation rate becomes significant due to one S.D shock to 364-day T-bill rate at the time horizon-4 and become s insignificant thereafter. The response of the inflation rate becomes significant and negative due to one S.D shock to 364-day T-bill rate at the time horizon 4 which remain significant up to time horizon 5 and becomes insignificant thereafter (Figure).
Figure: Impulse Response Functions
Source: Authors own estimation Conclusion Therefore, from the econometric results from OLS and VAR it is evident that monetary authority could use the 2-year T- bill rate as a long-term interest rate in order to effectively study inflation. The 28-day T- bill rate could also be used as predicting inflation. Therefore, using 2-year long-term interest rate and 28-day short-term interest rate, the central bank may be able to anticipate inflation better.
-.3
-.2
-.1
.0
.1
.2
1 2 3 4 5 6 7 8 9 10
Response of INF to CholeskyOne S.D. DAY_364 Innovation
-.4
-.3
-.2
-.1
.0
.1
.2
.3
1 2 3 4 5 6 7 8 9 10
Response of INF to CholeskyOne S.D. DAY_28 Innovation
-.5
-.4
-.3
-.2
-.1
.0
.1
.2
.3
.4
1 2 3 4 5 6 7 8 9 10
Response of INF to CholeskyOne S.D. YEAR_2 Innovation
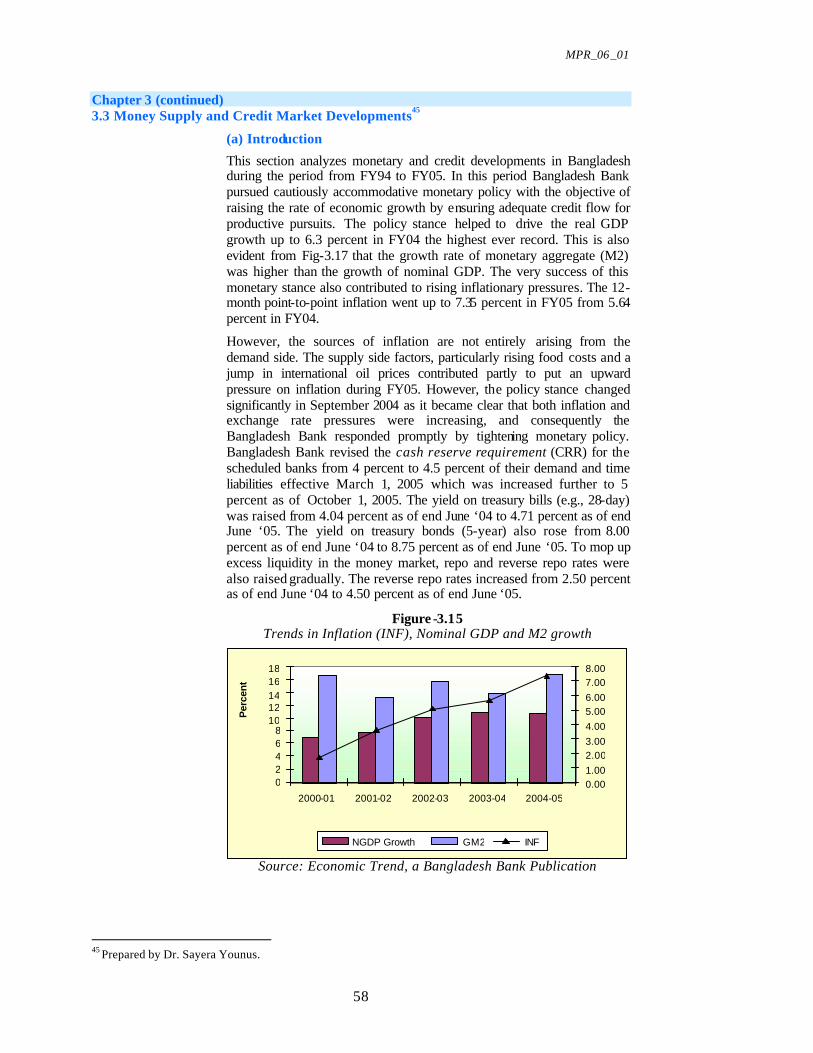
MPR_06_01
58
Chapter 3 (continued) 3.3 Money Supply and Credit Market Developments
45
(a) Introduction
This section analyzes monetary and credit developments in Bangladesh during the period from FY94 to FY05. In this period Bangladesh Bank pursued cautiously accommodative monetary policy with the objective of raising the rate of economic growth by ensuring adequate credit flow for productive pursuits. The policy stance helped to drive the real GDP growth up to 6.3 percent in FY04 the highest ever record. This is also evident from Fig-3.17 that the growth rate of monetary aggregate (M2) was higher than the growth of nominal GDP. The very success of this monetary stance also contributed to rising inflationary pressures. The 12-month point-to-point inflation went up to 7.35 percent in FY05 from 5.64 percent in FY04.
However, the sources of inflation are not entirely arising from the demand side. The supply side factors, particularly rising food costs and a jump in international oil prices contributed partly to put an upward pressure on inflation during FY05. However, the policy stance changed significantly in September 2004 as it became clear that both inflation and exchange rate pressures were increasing, and consequently the Bangladesh Bank responded promptly by tightening monetary policy. Bangladesh Bank revised the cash reserve requirement (CRR) for the scheduled banks from 4 percent to 4.5 percent of their demand and time liabilities effective March 1, 2005 which was increased further to 5 percent as of October 1, 2005. The yield on treasury bills (e.g., 28-day) was raised from 4.04 percent as of end June ‘04 to 4.71 percent as of end June ‘05. The yield on treasury bonds (5-year) also rose from 8.00 percent as of end June ‘04 to 8.75 percent as of end June ‘05. To mop up excess liquidity in the money market, repo and reverse repo rates were also raised gradually. The reverse repo rates increased from 2.50 percent as of end June ‘04 to 4.50 percent as of end June ‘05.
Figure -3.15 Trends in Inflation (INF), Nominal GDP and M2 growth
Source: Economic Trend, a Bangladesh Bank Publication
45 Prepared by Dr. Sayera Younus.
02468
1012141618
2000-01 2001-02 2002-03 2003-04 2004-05
Per
cent
0.001.002.003.004.005.006.007.008.00
NGDP Growth GM2 INF

MPR_06_01
59
Chapter 3 (continued) In the Medium-term Macroeconomic Framework (MTMF) the projection46 for real GDP growth during the period of FY06, FY07 and FY08 are set at 6.0 percent, 6.0 percent and 6.5 percent, respectively, where the projection for 12-month average inflation are 7.5 percent, 6.0 percent and 5.0 percent, respectively. It will be challenging for monetary authority to pursue a policy regime to facilitate the growth momentum in one hand and to bring down inflation to the level projected in the MTMF.
(b) Broad Money (M2)
Figure-3.16 shows the trends of broad money (M2) and narrow money (M1) during the period from 1993-94 to 2004-05. Initially the growth rate of M2 was lower than M1, but the former started to increase since FY96 and maintained a higher growth than M1 until FY03. During FY05 the growth rate of M2 slowed down resulting from slower growth in time deposits and higher growth in currency demand (Fig-3.17). An analysis of the components of broad money (M2) show that growth rate of time deposits started to increase from FY96 and maintained higher growth than that of currency and demand deposits until 2003-04. During FY05 the growth rate of currency demand was higher than that of demand and time deposits reflecting higher demand for holding currency in the face of higher inflationary expectations. The growth rate of currency outside banks contributed to growth in M1 from 14.05 percent in FY04 to 16.54 percent in FY05 and M2 from 13.84 percent in FY04 to 16.7 percent in FY05 respectively.
Figure 3.16 Trends of Narrow Money (M1) and Broad Money Growth (M2)
0.002.004.00
6.008.00
10.0012.0014.0016.0018.0020.00
1994-95
1995-96
1996-97
1997-98
1998-99
1999-00
2000-01
2001-02
2002-03
2003-04
2004-05
period
Pe
rce
nt
GM1 GM2
Source: Economic Trend, a Bangladesh Bank Publication
(c) Demand to Time Deposits Ratio (DD/TMD)
An analysis of the trend in demand and time deposits shows (Fig.3.18) that the ratio (DD/TMD) started to decline from 0.23 in FY96, and gradually declined to 0.16 in FY05. The higher growth in time deposits (TMD) partly reflects the higher opportunity cost of holding money due to attractive returns on different term deposits during this period, though the deposit had declined toward the end of FY04. This decline was intended to decrease the cost of borrowing and thus to stimulate the economy.
46GOB (2005) “Unlocking the Potential: National Strategy for Accelerated Poverty Reduction,” Planning Commission (General Economic Division), Government of the People’s Republic of Bangladesh: October 2005.
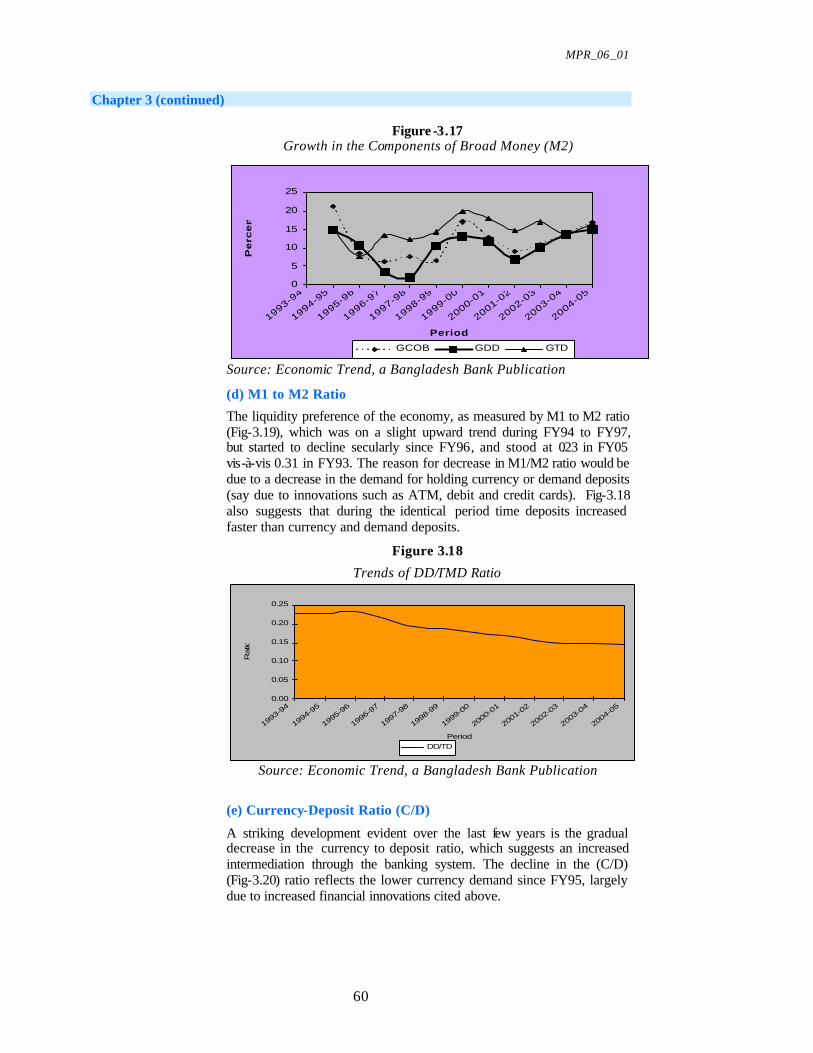
MPR_06_01
60
Chapter 3 (continued)
Figure -3.17 Growth in the Components of Broad Money (M2)
0
5
10
15
20
25
1993-94
1994-95
1995-96
1996-97
1997-98
1998-99
1999-00
2000-01
2001-02
2002-03
2003-04
2004-05
Period
Pe
rce
nt
GCOB GDD GTD
Source: Economic Trend, a Bangladesh Bank Publication
(d) M1 to M2 Ratio
The liquidity preference of the economy, as measured by M1 to M2 ratio (Fig-3.19), which was on a slight upward trend during FY94 to FY97, but started to decline secularly since FY96, and stood at 0.23 in FY05 vis-à-vis 0.31 in FY93. The reason for decrease in M1/M2 ratio would be due to a decrease in the demand for holding currency or demand deposits (say due to innovations such as ATM, debit and credit cards). Fig-3.18 also suggests that during the identical period time deposits increased faster than currency and demand deposits.
Figure 3.18
Trends of DD/TMD Ratio
0.00
0.05
0.10
0.15
0.20
0.25
1993-94
1994-95
1995-96
1996-97
1997-98
1998-99
1999-00
2000-01
2001-02
2002-03
2003-04
2004-05
Period
Ratio
DD/TD
Source: Economic Trend, a Bangladesh Bank Publication
(e) Currency-Deposit Ratio (C/D)
A striking development evident over the last few years is the gradual decrease in the currency to deposit ratio, which suggests an increased intermediation through the banking system. The decline in the (C/D) (Fig-3.20) ratio reflects the lower currency demand since FY95, largely due to increased financial innovations cited above.

MPR_06_01
61
Chapter 3 (continued) Figure 3.19
Trends of M1/M2 Ratio
M1/M2
0.000.050.100.150.200.250.300.35
1993-94
1994-95
1995-96
1996-97
1997-98
1998-99
1999-00
2000-01
2001-02
2002-03
2003-04
2004-05
Period
Ratio
M1/M2
Source: Economic Trend, a Bangladesh Bank Publication
(f) M2 to GDP Ratio
A welcome development recorded during the last few years is the secular rise in M2 to GDP ratio (Fig-3.21). The higher monetary expansion during this period was principally driven by the acceleration in net domestic assets (NDA) coupled with low inflation. This pattern also reflects higher monetization of the economy amid increasing financial sector intermediation of economic activities.
Figure 3.20 Trends of Currency/Deposits Ratio (C/D)
0.000
0.050
0.100
0.150
0.200
1993-94
1994-95
1995-96
1996-97
1997-98
1998-99
1999-00
2000-01
2001-02
2002-03
2003-04
2004-05
Period
Ra
tio
C/D
Source: Economic Trend, a Bangladesh Bank Publication
Figure 3.21 Trends of M2/GDP
0.00
0.05
0.100.15
0.20
0.25
0.300.35
0.400.45
1993
-94
1994
-95
1995
-96
1996
-97
1997
-98
1998
-99
1999
-00
2000
-01
2001
-02
2002
-03
2003
-04
2004
-05
Ratio
M2/GDP
Source: Economic Trend, a Bangladesh Bank Publication

MPR_06_01
62
Chapter 3 (continued) (g) Reserve Money (RM)
An analysis of the trend of reserve money (RM) growth show that RM started to increase from FY96 at an annual rate of less than 5 percent reaching close to 25 percent growth in FY02. However it dramatically fell to the 3-percent range in FY03 before attempting another run-up. The high figure of a few years ago was due mainly to growth in net foreign assets (NFA) and, to an extent, in net domestic assets as well (NDA). The FY03 drop in RM was led by an equally dramatic decrease in NDA (from Tk.159.43 billion in FY02 to Tk.120.01 billion in FY03) and increase in net foreign assets (from Tk.75.90 billion in FY02 to Tk. 123.12 billion in FY03). This behaviour may have been triggered in part by the impending floating of the national currency in the fourth quarter of FY03.
(h) Bank Credit
The movements of total deposits (TD) and advances (ADVAN) of the banking system show a similar pattern (Fig.3.24) during the period from FY94 to FY05 except for a few deviations. The growth rate of total deposits was higher than advances during the period of FY00 and FY03, indicating significant monetary stimulus in those years of low inflation.
Figure 3.22
Trends of Growth Rate of Reserve Money (RM)
-10.00
-5.00
0.00
5.00
10.00
15.00
20.00
25.00
30.00
1994
-95
1995
-96
1996
-97
1997
-98
1998
-99
1999
-00
2000
-01
2001
-02
2002
-03
2003
-04
2004
-05
Period
Perc
ent
GRM
Source: Economic Trend, a Bangladesh Bank Pu blication
Figure 3.23
Sources of Reserve Money (RM)
0.00
0.10
0.20
0.30
0.40
0.50
0.60
0.70
0.80
RATIO
FY01 FY02 FY03 FY04 FY05
NFA/RM
NDA/RM
Source: Economic Trend, a Bangladesh Bank Publication
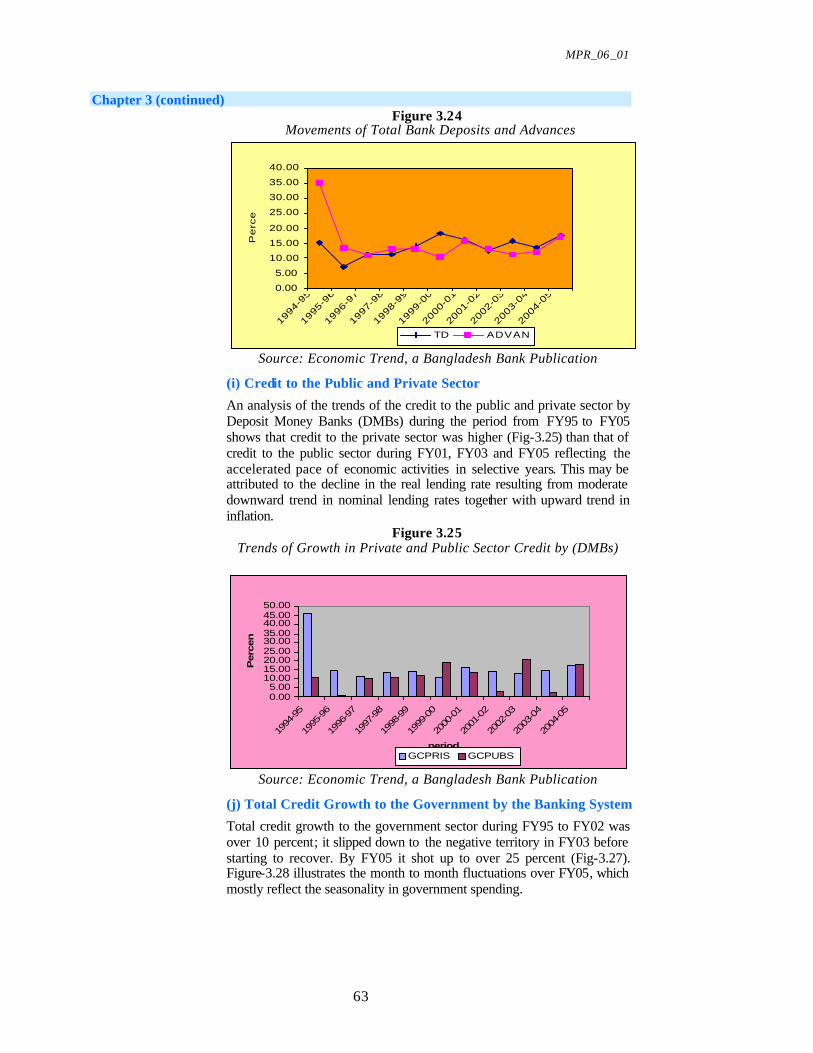
MPR_06_01
63
Chapter 3 (continued) Figure 3.24
Movements of Total Bank Deposits and Advances
0.00
5.00
10.00
15.00
20.00
25.00
30.00
35.00
40.00
1994
-95
1995
-96
1996
-97
1997
-98
1998
-99
1999
-00
2000
-01
2001
-02
2002
-03
2003
-04
2004
-05
Period
Pe
rce
nt
TD ADVAN
Source: Economic Trend, a Bangladesh Bank Publication
(i) Credit to the Public and Private Sector
An analysis of the trends of the credit to the public and private sector by Deposit Money Banks (DMBs) during the period from FY95 to FY05 shows that credit to the private sector was higher (Fig-3.25) than that of credit to the public sector during FY01, FY03 and FY05 reflecting the accelerated pace of economic activities in selective years. This may be attributed to the decline in the real lending rate resulting from moderate downward trend in nominal lending rates together with upward trend in inflation.
Figure 3.25 Trends of Growth in Private and Public Sector Credit by (DMBs)
0.005.00
10.0015.0020.0025.0030.0035.0040.0045.0050.00
1994
-95
1995
-96
1996
-97
1997
-98
1998
-99
1999
-00
2000
-01
2001
-02
2002
-03
2003
-04
2004
-05
period
Perc
en
t
GCPRIS GCPUBS
Source: Economic Trend, a Bangladesh Bank Publication
(j) Total Credit Growth to the Government by the Banking System
Total credit growth to the government sector during FY95 to FY02 was over 10 percent; it slipped down to the negative territory in FY03 before starting to recover. By FY05 it shot up to over 25 percent (Fig-3.27). Figure-3.28 illustrates the month to month fluctuations over FY05, which mostly reflect the seasonality in government spending.

MPR_06_01
64
Chapter 3 (continued)
Figure 3.26 Growth of Private and Public Sector Credit by DMBs during FY05
-8.00-6.00-4.00-2.000.002.004.006.008.00
10.0012.00
Jul-04
Aug-0
4
Sep-0
4
Oct
-04
Nov-
04
Dec-
04
Jan-0
5
Feb-0
5
Mar-
05
Apr-
05
May-
05
Jun-0
5
Jul-05
GCPRIS GCPUBS
Source: Economic Trend, a Bangladesh Bank Publication
(k) Bank Deposits
An analysis of bank deposits show that the relatively slower growth rate of deposits can be attributed to increased consumption and investment expenditure reflecting higher level of economic activity and lower real interest rate. On the other hand, downward revision of deposit rate may have some effect on the lower growth rate of time deposit.
Figure 3.27 Total Credit to the Government by Banking System
0
500010000
1500020000
2500030000
35000
40000
1994-95
1995-96
1996-97
1997-98
1998-99
1999-00
2000-01
2001-02
2002-03
2003-04
2004-05
-5.00
0.00
5.00
10.00
15.00
20.00
25.00
30.00
CGS GCGOS
Source: Economic Trend, a Bangladesh Bank Publication
Figure 3.28 Growth Rate of Total Credit to Government Sector by the Banking System during FY05
0
5000
10000
15000
20000
25000
30000
35000
40000
Jul-0
4
Aug-0
4
Sep-0
4
Oct
-04
Nov
-04
Dec
-04
Jan-0
5
Feb-0
5
Mar
-05
Apr-0
5
May-
05
Jun-0
5
Jul-0
5-10.00
-5.00
0.00
5.00
10.00
15.00
20.00
CGS GCGOS
Source: Economic Trend, a Bangladesh Bank Publication

MPR_06_01
65
Chapter 3 (continued)
Table 3.2 contains weighted average interest rates of scheduled banks on deposits and advances along with the spread during FY01 to FY05. It is evident from the table that the weighted average interest rates on deposits and advances were declining over the years with a view to stimulating investment and economic growth. The nominal spread between advances and deposit rates remained mostly within the range of 6.4 to 6.7 during the period from FY01 to FY03 before declining to 5.3 in FY05. The low real interest rate (even negative in some cases) on deposits is indicative of the absence of competitive pressures in the commercial banking system.
The relatively high magnitude of the interest rate spread has been a topic of much discussion of late. Recently, a study by Roe and Peachey (2005) has examined this issue in detail and a brief review is given below in Box 3.2.
(l) Cash Reserve Requirement (CRR)
The Cash Reserve Requirement (CRR) for the scheduled banks with the Bangladesh Bank has been revised upward to 4.5 percent of their total demand and time liabilities effective March 1, 2005, which had been 4.0 percent since October 1, 1999. The CRR was increased further to 5 percent in with effect from October 1, 2005.
Box 3.2
A comment on the Interest Rate Spread in Bangladesh47
This comment is based on a consultancy report prepared by Roe and Peachey (2005), which provide preliminary indications of the key factors causing high interest rate spreads and actions needed to address the issue.
Overall, the Roe-Peachey (2005) document provides an excellent background of the persistent high interest rate spread in Bangladesh. First, they correctly mention the root of the problem, which is government ‘interventionist policies’ of the past. For example, state control of lending (both volumes and price), absence of risk management practices, and huge accumulation of bad loans because of political interference on commercial lending decisions, and limited technical skills particularly in the arena of risk management are the major reasons behind the high-classified loan ratio and spread in Bangladesh. The adverse consequences of the mistakes in the past have at least two effects. First, this is one major reason why non-performing loan (NPLs) ratios are so much higher in Bangladesh than they would be in a well functioning banking system. Second, since total supply of fund is limited at each point of time, the favours granted to some borrowers also means that many less well-connected borrowers have probably faced a cost of capital that is high relative to the risk-adjusted rate of return that they can achieve.
This interventionist policy in the past did not affect all forty-nine banks the same way now operating in Bangladesh. It affects first and second generation banks badly, then new and third generation banks. It can be mentioned here that of the thirty private banks (PCBs), nineteen have entered the market since 1995. In Bangladesh, banking markets are highly segmented and non-competitive at least for three reasons as Roe-Peachey (2005) point out. First, there are some older private banks (10 out of 30) who made mistakes in the past, accumulated huge classified loans and are currently constrained by the need to maintain capital adequacy levels in accordance with the tighter Bangladesh Bank rules. They are trying to achieve the necessary recovery of past losses partly through their current level of loan charges. Second, there are almost all the Foreign
47 By Dr. Sayera Younus
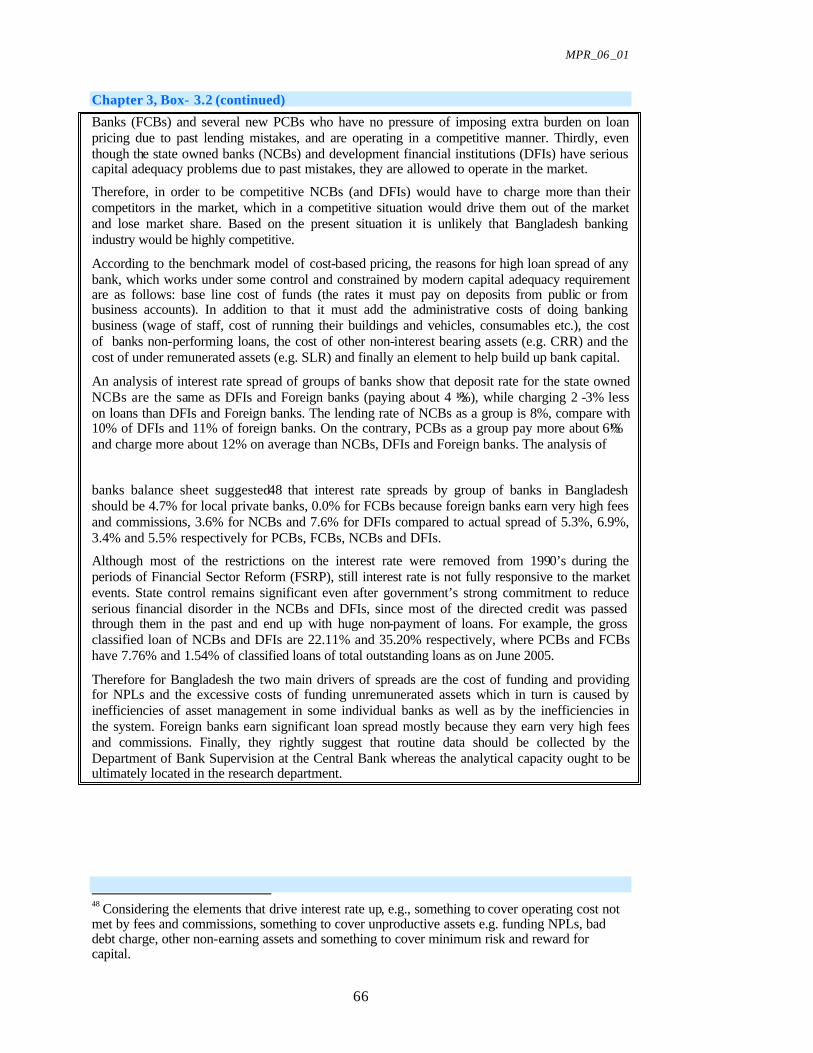
MPR_06_01
66
Chapter 3, Box- 3.2 (continued)
Banks (FCBs) and several new PCBs who have no pressure of imposing extra burden on loan pricing due to past lending mistakes, and are operating in a competitive manner. Thirdly, even though the state owned banks (NCBs) and development financial institutions (DFIs) have serious capital adequacy problems due to past mistakes, they are allowed to operate in the market.
Therefore, in order to be competitive NCBs (and DFIs) would have to charge more than their competitors in the market, which in a competitive situation would drive them out of the market and lose market share. Based on the present situation it is unlikely that Bangladesh banking industry would be highly competitive.
According to the benchmark model of cost-based pricing, the reasons for high loan spread of any bank, which works under some control and constrained by modern capital adequacy requirement are as follows: base line cost of funds (the rates it must pay on deposits from public or from business accounts). In addition to that it must add the administrative costs of doing banking business (wage of staff, cost of running their buildings and vehicles, consumables etc.), the cost of banks non-performing loans, the cost of other non-interest bearing assets (e.g. CRR) and the cost of under remunerated assets (e.g. SLR) and finally an element to help build up bank capital.
An analysis of interest rate spread of groups of banks show that deposit rate for the state owned NCBs are the same as DFIs and Foreign banks (paying about 4 ½ %), while charging 2 -3% less on loans than DFIs and Foreign banks. The lending rate of NCBs as a group is 8%, compare with 10% of DFIs and 11% of foreign banks. On the contrary, PCBs as a group pay more about 6½ % and charge more about 12% on average than NCBs, DFIs and Foreign banks. The analysis of
banks balance sheet suggested48 that interest rate spreads by group of banks in Bangladesh should be 4.7% for local private banks, 0.0% for FCBs because foreign banks earn very high fees and commissions, 3.6% for NCBs and 7.6% for DFIs compared to actual spread of 5.3%, 6.9%, 3.4% and 5.5% respectively for PCBs, FCBs, NCBs and DFIs.
Although most of the restrictions on the interest rate were removed from 1990’s during the periods of Financial Sector Reform (FSRP), still interest rate is not fully responsive to the market events. State control remains significant even after government’s strong commitment to reduce serious financial disorder in the NCBs and DFIs, since most of the directed credit was passed through them in the past and end up with huge non-payment of loans. For example, the gross classified loan of NCBs and DFIs are 22.11% and 35.20% respectively, where PCBs and FCBs have 7.76% and 1.54% of classified loans of total outstanding loans as on June 2005.
Therefore for Bangladesh the two main drivers of spreads are the cost of funding and providing for NPLs and the excessive costs of funding unremunerated assets which in turn is caused by inefficiencies of asset management in some individual banks as well as by the inefficiencies in the system. Foreign banks earn significant loan spread mostly because they earn very high fees and commissions. Finally, they rightly suggest that routine data should be collected by the Department of Bank Supervision at the Central Bank whereas the analytical capacity ought to be ultimately located in the research department.
48 Considering the elements that drive interest rate up, e.g., something to cover operating cost not met by fees and commissions, something to cover unproductive assets e.g. funding NPLs, bad debt charge, other non-earning assets and something to cover minimum risk and reward for capital.

MPR_06_01
67
Chapter 3 (continued) Table 3.2
Weighted Average Lending and Deposits Rates (in percent) Period Nominal
Lending Rate
Nominal Deposit
Rate
Spread Inflation (12 month
AVG.)
Real Lending
Rate
Real Deposit Rate
2000-01 13.75 7.03 6.72 1.94 11.81 5.09 2001-02 13.16 6.74 6.42 2.79 10.37 3.95 2002-03 12.78 6.29 6.49 4.38 8.4 1.91 2003-04 11.01 5.65 5.36 5.83 5.18 -0.18 2004-05 10.92 5.64 5.28 6.49 4.43 -0.85
Source: Economic Trend, a Bangladesh Bank Publication (m) Statutory Liquidity Ratio (SLR)
The Statutory Liquidity Ratio (SLR) for the scheduled banks, excepting banks operating under the Islamic Shariah and the specialized banks, was raised from 16 percent of their demand and time liabilities excluding interbank items to 18.0 percent in October 2005. The SLR for the Islamic banks remained unchanged at 10.0 percent (see Box 3.3 below for additional details). The specialized banks continued to remain exempt from maintaining the SLR. Given the persistence of excess liquidity in the baking system, the issue, among other, of the appropriate level of SLR for the Islamic banking sector (vis-à-vis other DMBs) as well as for the entire sector warrants further consideration.
(n) Bank Rate
The bank rate remained unchanged at 5.0 percent in FY05. This rate has been in effect since November 06, 2003.
(o) Conclusion
An analysis of the trends of different monetary indicators during the period from FY94 to FY05 reveals a welcome development in the M2 to GDP and C/D ratios. One finds the period of higher monetary expansion to be characterized by a period of low currency demand with low inflation, mainly reflecting higher monetization of the economy. This feature is suggestive of eventual growth of the financial sector intermediation of economic activities.
3.4 Financing of Public Debt and Inflation49
(a) Introduction
Despite near unanimous concern over deficits, there is considerable controversy about its effects on the economy. The goal of this note is to clarify some of the effects of financing budget deficits on the economy, particularly inflation. It has been argued that in a developing country fiscal dominance suggests that the monetary authority can do little else than to accommodate fiscal deficits by money creation which in turn increases inflation.
49 By Dr. Sayera Younus
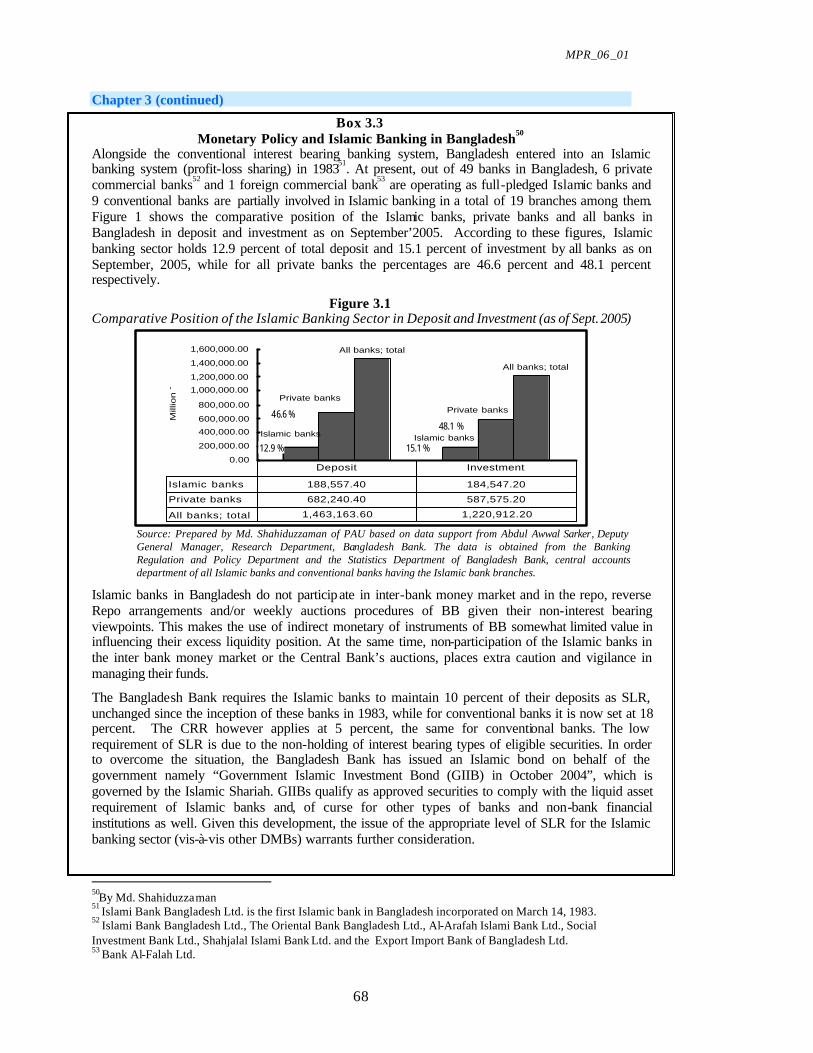
MPR_06_01
68
Chapter 3 (continued)
Box 3.3 Monetary Policy and Islamic Banking in Bangladesh
50 Alongside the conventional interest bearing banking system, Bangladesh entered into an Islamic banking system (profit-loss sharing) in 198351. At present, out of 49 banks in Bangladesh, 6 private commercial banks52 and 1 foreign commercial bank53 are operating as full-pledged Islamic banks and 9 conventional banks are partially involved in Islamic banking in a total of 19 branches among them. Figure 1 shows the comparative position of the Islamic banks, private banks and all banks in Bangladesh in deposit and investment as on September’2005. According to these figures, Islamic banking sector holds 12.9 percent of total deposit and 15.1 percent of investment by all banks as on September, 2005, while for all private banks the percentages are 46.6 percent and 48.1 percent respectively.
Figure 3.1 Comparative Position of the Islamic Banking Sector in Deposit and Investment (as of Sept. 2005)
Islamic banks Islamic banks
Private banks Private banks
All banks; total
All banks; total
0.00
200,000.00
400,000.00
600,000.00
800,000.00
1,000,000.00
1,200,000.00
1,400,000.00
1,600,000.00
Mill
ion T
k.
Islamic banks 188,557.40 184,547.20
Private banks 682,240.40 587,575.20
All banks; total 1,463,163.60 1,220,912.20
Deposit Investment
Source: Prepared by Md. Shahiduzzaman of PAU based on data support from Abdul Awwal Sarker, Deputy General Manager, Research Department, Bangladesh Bank. The data is obtained from the Banking Regulation and Policy Department and the Statistics Department of Bangladesh Bank, central accounts department of all Islamic banks and conventional banks having the Islamic bank branches.
Islamic banks in Bangladesh do not participate in inter-bank money market and in the repo, reverse Repo arrangements and/or weekly auctions procedures of BB given their non-interest bearing viewpoints. This makes the use of indirect monetary of instruments of BB somewhat limited value in influencing their excess liquidity position. At the same time, non-participation of the Islamic banks in the inter bank money market or the Central Bank’s auctions, places extra caution and vigilance in managing their funds.
The Bangladesh Bank requires the Islamic banks to maintain 10 percent of their deposits as SLR, unchanged since the inception of these banks in 1983, while for conventional banks it is now set at 18 percent. The CRR however applies at 5 percent, the same for conventional banks. The low requirement of SLR is due to the non-holding of interest bearing types of eligible securities. In order to overcome the situation, the Bangladesh Bank has issued an Islamic bond on behalf of the government namely “Government Islamic Investment Bond (GIIB) in October 2004”, which is governed by the Islamic Shariah. GIIBs qualify as approved securities to comply with the liquid asset requirement of Islamic banks and, of curse for other types of banks and non-bank financial institutions as well. Given this development, the issue of the appropriate level of SLR for the Islamic banking sector (vis-à-vis other DMBs) warrants further consideration.
50By Md. Shahiduzzaman 51 Islami Bank Bangladesh Ltd. is the first Islamic bank in Bangladesh incorporated on March 14, 1983. 52 Islami Bank Bangladesh Ltd., The Oriental Bank Bangladesh Ltd., Al-Arafah Islami Bank Ltd., Social Investment Bank Ltd., Shahjalal Islami Bank Ltd. and the Export Import Bank of Bangladesh Ltd. 53 Bank Al-Falah Ltd.
12.9 %
46.6 %
15.1 %
48.1 %

MPR_06_01
69
Chapter 3 (continued) (b) Fiscal Policy Stance in Bangladesh
Bangladesh had been following an expansionary fiscal policy during the decade of 1970s in pursuance of post-liberation reconstruction efforts. Besides, due to centrally planned economic framework of the day, the Bangladesh economy started with a relatively large public sector where a majority of large enterprises were nationalized. Indeed the financial losses in the state-owned enterprises (SOEs) have often been the root cause of consolidated fiscal deficits.
Table 3.3 Government Revenue, Expenditure and Fiscal Balance in
Bangladesh (% of GDP) Year (end
June) Revenue
(T) Expenditure
(G) Fiscal
Balance (T-G)
1973-1980 7.2 14.8 -7.6 1981-1990 8.5 15.5 -6.9
1991-2000 9.1 13.7 -4.6
2000-01 9.6 14.8 -5.1
2001-02 10.2 14.9 -4.7
2002-03 10.3 14.0 -3.7
2003-04 10.63 14.17 -3.54 2004-05 11.21 15.54 -4.33
Source: Hossain (1996) and GOB (2004)
It is observed from Table 3.3 that the Government of Bangladesh witnessed a relatively high fiscal deficit of 7.6 percent of GDP during 1973-1980, which moderated to 6.9 percent of GDP during 1981-1990. The fiscal deficit was maintained well below 5.0 percent of GDP during the late 1990s (averaging 4.6 percent during the period 1991-2000). More recent data, as reported in Table-1, show that the central government deficit was reduced from 5.1 percent of GDP in FY01 to 4.7 percent of GDP in FY02 on account of both revenue measures and expenditure discipline. Revenues rose modestly in successively years (FY04 and 05), but expenditure rose even faster in FY05, whereby the budget deficit rose to 4.33 percent in FY05 from 3.54 percent of GDP in FY04.
According to the traditional view a rise in public debt increases private sector wealth which in turn increases private sector spending that leads to increases in the price level, output and interest rate. In contrast, Barro (1974) argued that the increase in debt can be seen as leading to increased future tax liabilities of the same present value as the current stock of debt. According to the Recardian Equivalence (RE) hypothesis, because government debt need not be viewed as private sector wealth, an increase in debt would not alter private spending. Hence changes in government debt do not cause changes in the price level, output, or interest rates.
Easterly and Schmidt-Hebbel (1993) examined fiscal deficits and macroeconomic performance in 10 developing countries. They found that over the medium term, money financing led to higher inflation and debt financing to higher real interest rates. Regarding private investment

MPR_06_01
70
Chapter 3 (continued) and fiscal policies, they found evidence that higher interest rates due to bond financing had a negative effect on private investment. Though the latter finding is consistent with investment theory, it contradicts other empirical evidence showing that investment is insensitive to interest rates in developing countries. Increasing public investment was found to reduce private investment in some countries and to increase it in others. This result confirms previous studies showing that the net effect of public investment on private investment depends on its composition--whether it is a complement to or a substitute for private investment.
Prasad and Khundrakpam (2000) find that government deficit has been an important cause for long-run inflationary trend in India. However, their study suggests that there is an optimal level of monetization for a given level of government deficit, which refutes the concern that monetization of deficits is always inflationary. For example estimates that during 1999 the actual level (20-25 percent) of monetization is much lower than optimal level of 40 percent.
(c) Government Borrowing from the Domestic Sources in Bangladesh
In order to finance deficits governments borrow from the domestic and external sources. Among the domestic sources, borrowing from individuals, central bank, scheduled banks, and non-bank sources are noteworthy. The consequences of the government borrowing depend on how the deficits are financed. Figure-1 shows the recent trend in government borrowing in Bangladesh.
Figure 3.29 Trends of Government Borrowing From Domestic Sources
Source:
From the above graph, it can be seen that government borrowing from the domestic sources increased substantially during the second half of the 1990’s up to the end of FY02. From the above chart it is also evident that government borrowing from other than bank sources has been increasing overtime while borrowing from scheduled banks and the central bank follow an irregular trend.
From Table 3.4 it can be seen that government borrowing from the external sources are much higher than domestic sources. The outstanding foreign debt is increasing overtime, while borrowing from the domestic sources fluctuate over time.
Trends in Governmnet Borrowing From Domestic Sources
-6000
-4000
-2000
0
2000
4000
6000
1990
-91
1991
-92
1992
-93
1993
-94
1994
-95
1995
-96
1996
-97
1997
-98
1998
-99
1999
-00
2000
-01
2001
-02
2002
-03
2003
-04
Period
Tk
. in
Cro
re
Claims by CBClaims by SBOther than Bank

MPR_06_01
71
Chapter 3 (continued) Table-3.4
Total Government Debt (BDT in crore)
Year Govt. Borrowing from Banking
System
Sub-Total
Non-Banking Source
Total Internal Debt
Foreign Debt Outstanding
Bangladesh
Bank Commercial
Banks 1 2 3 4=2+3 5 6=4+5 7
1990-91 -0.60 173.70 173.10 467.12 640.22 42570.00 1991-92 -480.80 1918.60 1437.80 806.04 2243.84 47194.98 1992-93 250.90 45.60 296.50 1157.50 1454.00 49897.24 1993-94 -438.20 1198.10 759.90 751.30 1511.20 58246.40 1994-95 244.40 -312.40 -68.00 1098.20 1030.20 64105.33 1995-96 1782.80 -86.60 1696.20 1597.00 3293.20 59028.91 1996-97 1452.10 254.90 1707.00 947.42 2654.42 61372.28 1997-98 806.60 448.20 1254.80 1905.17 3159.97 60985.72 1998-99 1064.40 912.20 1976.60 2772.44 4749.04 68986.29 1999-00 1738.10 1786.20 3524.30 3229.68 6753.98 79120.02 2000-01 2009.30 895.10 2904.40 4208.42 7112.82 79182.95 2001-02 2727.00 -158.60 2568.40 4711.47 7279.87 91228.70 2002-03 -2589.70 1607.20 -982.50 4795.22 3812.72 98158.45 2003-04 1653.00 1016.10 2669.10 4598.94 7268.04 108491.79 2004-05 -1461.80 1090.10 -371.70 2182.30 1810.60 118301.07
Source: Economic Relations Division and Statistics Department, Bangladesh Bank.
(d) Share of Government Debt in GDP and Inflation
Figure 2 reveals that there is no regular pattern between inflation (12-month average) and government debt as a percentage of GDP in Bangladesh. Debt from internal sources is increasing overtime particularly from non-bank sources. On the other hand, though public debt outstanding from external sources has decreased marginally (from about 34 to 32 percent of GDP between FY97 and FY04), the ratio is still rather high.
Figure 3.30 Government Debt as % of GDP and Inflation
05
10152025303540
FY97 FY98 FY99 FY00 FY01 FY02 FY03 FY04
(%)
Inf Domestic Debt External Debt
Source: Economic Review (2004)

MPR_06_01
72
Chapter 3 (continued) 3.5 The Foreign Exchange Market
54
(a) Exchange Rate Regimes in Bangladesh
Within the nominal anchor approach, there are broadly two strategies for monetary policy in developing countries – exchange rate pegging and monetary targeting. Bangladesh followed a fixed exchange rate regime for most of the 1970s, and switched to a pegged exchange rate system in 1979. It was part of structural adjustment programs that aimed at achieving and sustaining macroeconomic stability for rapid economic growth. As the fixed or pegged exchange rate arrangement was not associated with disciplined fiscal and monetary policy, there was limited credibility in the peg. Until early 2003, Bangladesh followed an exchange rate policy of occasionally adjusting the rate with an eye on maintaining export competitiveness, mainly with reference to the trend of Real Effective Exchange Rate (REER) Index based on a trade weighted basket of currencies acting as a sort of benchmark. A market based floating exchange rate system has been introduced in Bangladesh from May 31, 2003. This has been expected to bring about adjustments of the exchange rate to changing market conditions.
In view of embracing the market-based exchange rate system, Bangladesh entered into a floating exchange rate regime effective from May 31, 2003. Before the flotation of currency, BB used to administratively prescribe a preannounced rate band within which the purchase or sale of USD could take place between the authorized dealer banks and BB. Main objective of the flotation of currency was to let the market forces determine the par value of Taka. After the flotation, therefore, the BB no longer uses any preannounced rate for transactions with banks with the exception of occasional intervention by purchasing or selling foreign exchange to maintain orderly adjustment in the exchange rates. With a view to indirectly influencing the market exchange rate of Taka in the floating regime, in addition to the occasional intervention in the foreign exchange market, BB employs tightening or loosening in the money market through the auctions of T-bills, repos and reverse repos. Despite some concern, the transition to a floating rate regime turned out to be exceptionally smooth in Bangladesh compared to experiences elsewhere. As the main objective of the flotation of currency is to let the market forces to determine the par value of Taka , respect some fluctuations and adjustments in the exchange rate is acceptable and usually influenced by the market fundamentals.
With the flotation of the exchange rate, the monetary authorities have been more active in using market based instruments to manage liquidity and maintain short-term interest rates at levels appropriate for exchange rate stability. The monetary policy framework as described above, and incorporated in the Monetary Policy Statement of the Bangladesh Bank , further explains the precise role and modalities of the conduct of monetary policy in the country.
(b) The Inter-bank Foreign Exchange Market
In recent months, the foreign exchange market in Bangladesh witnessed some pressure on the Taka-Dollar exchange rate resulting from a relatively faster growth in the import bills than that of combined export
54 Prepared by Dr. Md. Habibur Rahman.

MPR_06_01
73
Chapter 3 (continued) earnings and workers’ remittance flows. The weighted average Taka-Dollar exchange rate increased to Tk.63.75 at end June 2005 from Tk. 63.31 at end March 2005. This rate stood at Tk. 60.45 per USD at the end of June 2004 thus reflecting about 5 percent depreciation of Taka against US Dollar exchange market during the FY05.
Figure 3.31 Taka-Dollar Exchange Rate and REER
56
58
59
61
62
64
65
Mar
03
June
03
Sep
03
Dec
03
Mar
04
June
04
Sep
04
Dec
04
Mar
05
June
05
Tk.
per
US
Dol
lar
85
89
92
96
99
103
106
RE
ER
REER Nominal exchange rate
During the fourth quarter of FY05 the real effective exchange rate (REER) also showed a depreciating trend; it declined to 90.34 at the end of June 2005 from 91.95 at the end of December 2004. As all authorized dealer banks were instructed not to undertake any non-real cross currency forward and swap transaction and because of the restriction imposed on building up of forward sales, inter-bank foreign exchange transaction volume in FY05 stood at USD 19.9 billion, which is 64.7 percent lower than the USD 56.4 billion of FY04. The Figure-3.31 exhibits very recent movements in Taka-Dollar exchange rate and REER index. Since the flotation of the Taka the Bangladesh Bank has been active in maintaining orderliness of the changes in the market exchange rate by purchases at times of surplus and net sales at times of scarcity of liquidity in the inter-bank foreign exchange market. But even the necessary fluctuations need not be destabilizing. Because of relatively faster growth in import payments than export receipts, the net demand for foreign exchange was strong during the second half of FY05 generating pressure on the Taka-Dollar exchange rate. With a view to mitigating the mismatch between the supply and demand for foreign exchange, the Bangladesh Bank intervened by selling a sizeable of amount of foreign currency in the foreign exchange market. The BB sold about USD 459.5 million as against the purchase of only USD70.1 million in FY05. Earlier there were substantial net purchases of foreign currency in FY03 and FY04.

MPR_06_01
74
Chapter 3 (continued) 3.6 The Debt and Equity Markets
55
(i) The Equity Market (a) Background As an integral part of the National Strategy for Accelerated Poverty Reduction (NSAPR), the GOB has pursued a series of major policy actions under the financial sector reform program in line with the goals and objectives of the medium term policy matrix. A sound and well-functioning financial system is a pre-condition for implementing such a strategic policy announcements in order to ensure growth and provide access to the financial resources for the poor. It has been argued that a sound and well-functioning financial system helps mobilize savings, allocate resources, exert corporate control, facilitate risk management and ease trades and contracts by solving market frictions (Levine, 1997 and Levine-Zervos, 1998). While Levine (1997) argues for a positive relationship between financial development and long-run economic growth, Levine-Zervos (1998) find convincing evidence that stock market liquidity and banking development are both significantly correlated with long-run economic growth, capital accumulation and productivity.
The stock market in Bangladesh, however, is yet to serve the ultimate purpose of mobilizing necessary funding for private as well as public sector investment projects, while building up of sustained growth momentum in investment financing would require a better debt-equity balance with higher role of equity from the capital market. The developing economies are looking forward to their capital markets as the engine for future growth as its presence ensures mobilization of funds from surplus units to the ones suffering from deficits. Business firms, which are supposed to constitute the deficit units, need credit to pay to the factors of production, i.e., land, labor, capital, and entrepreneurship. Households, the surplus sector have residual earnings, i.e., savings after their consumption but usually less than the business firms' needs. It is the financial intermediaries, such as banks (i.e., the Central Bank, commercial banks, investment banks etc.), Securities and Exchange Commission (SEC), specialized financial institutions, development financial institutions and institutional investors (i.e., Investment Corporation of Bangladesh [ICB]) usually pools the funds from a wide number of units and channels it to the ultimate borrowers via capital market instruments - debt and equity.
Both money and capitals market are underdeveloped in Bangladesh. Generally, equity financing is superior to debt financing, since equity historically yielded higher returns to compensate its in-built higher risks than debt; business firms in Bangladesh, however, have preferred debt financing. Due to the absence of a strong capital market, large projects are predominantly debt-financed in Bangladesh because of its availability and soft terms. The low equity requirements by banks and the liberal terms under which debt is available and the lax encroachment of debt contracts all combine to make equity less necessary and debt more attractive as a financing alternative. But debt-ridden projects carry a higher total risk as financial risk increases on top of business risk with financing projects inundated in debt. Consequently, these projects become more susceptible to business disruption because of their high debt burden.
55 Prepared by Dr. Md. Habibur Rahman.

MPR_06_01
75
Chapter 3 (continued)
(b) Historical Developments of the Equity Market in Bangladesh
To facilitate formal trading of listed securities the Dhaka Stock Exchange (DSE), a self regulated non-profit organization, was first incorporated as the East Pakistan Stock Exchange Association Limited on April 28, 1954. However, formal trading began in 1956 with a total of 196 listed securities amounting to a paid up capital of about Taka 4 billion. On June 23, 1962 it was renamed as the Dhaka Stock Exchange (DSE) Limited. After 1971, trading activities of the Stock Exchange remained suppressed until 1976 due to the liberation war and the economic policy pursued by the then government. Trading activities resumed in 1976 with only 9 companies listed having a paid up capital of Taka 137.52 million on the stock exchange (Chowdhury, 1994). The Chittagong Stock Exchange (CSE), on the other hand, established in 1995 with 129 listed companies56. All exchanges are self-regulated, private sector entities, which must have their operating rules approved by the Securities and Exchange Commission (SEC). The SEC was established on 8th June 1993 under the Securities and Exchange Commission Act, 1993. The Chairman and members of the Commission are appointed by the government and have overall responsibility to administer securities legislation. Central Depositor Bangladesh Limited (CDBL) was incorporated as a public limited company on 20th August 2000 to operate and maintain the Central Depository System (CDS) of electronic book entry, recording and maintaining securities accounts and registering transfer of securities; changing the ownership without any physical movement or endorsement of certificates and execution of transfer instruments, as well as various other investor services including facilitation of the secondary market trading of Treasury Bills and Government Bonds issued by the Bangladesh Bank. CDBL runs a fully computerized central depository system and is also regulated by the SEC under the provisions of Depository Act, 1999, Depositories Regulations, 2000 and Depository (User) Regulations, 2003.
(c) Recent Developments in the Capital Market in Bangladesh
Although the overall capital market in Bangladesh has mostly recovered from the damage done by the stock market bubble and its collapse in the mid-nineties, a lot of groundwork still needs to be done in order to induce greater investor confidence in corporate governance and financial disclosure practices of the companies listed in the stock exchanges. However, efforts have been taken to gain a positive public perception about the Bangladesh Bank’s supervision of banks and financial institutions in addition to the SEC’s general supervision of public companies. Among other pertinent developments, we have the issuance of asset-backed securities, steps toward the activation of the secondary market in government securities including the introduction of delivery versus payment (DVP) eliminating the settlement risks, paperless electronic registry system in the CDBL, marking-to-market requirements for securities held for trading are noteworthy.
These measures have attracted strong investor interest in the new capital issues of banks and financial institutions. All major indicators of the equity market in Bangladesh, however, show signs of gradual
56 Note that all CSE-listed companies also listed on the DSE.

MPR_06_01
76
Chapter 3 (continued) improvement reflecting some gains of investor confidence in the capital market. This reawakened investor confidence in the capital market should extend to new issues of listed companies in other economic sectors under stronger SEC supervision, more demanding audit and financial disclosure standards, and credit rating of issuers by independent rating agencies, of which one has commenced operation in the recent past.
Primary Issuance: Eight companies raised new equity of Taka 1.2 billion from the primary market in FY05, lower than the Taka 2.4 billion raised by ten companies in FY04. Of the new equity issues, Taka 0.1 billion raised through private placements and Taka 1.0 billion through public offerings in FY05 as against Taka 1.3 billion raised through private placements and Taka 1.1 billion through public offerings in FY04. The very low volumes of public offerings in FY04 and FY05 were predictably oversubscribed several times, indicating the scope and possible need of rebalancing, perhaps by regulatory prescription, of the proportions of offers through private placements and public offerings. Bonus shares valued at Taka 3.5 billion were issued in FY05 by forty-five companies against retained profits, much higher than the Taka 2.5 billion issued in FY04 by twenty-four companies.
Secondary Market Activities: As of 30th June 2005 there were 259 Securities listed on the DSE with a market capitalization of Taka 224.6 billion. In the FY05, the total issued equity and debt of all listed Securities with the Dhaka Stock Exchange was Taka 66.4 billion compared to Taka 49.0 billion in the FY04. Market capitalization inclusive of new issues became more than 1.5 times higher in FY05 than that of FY04 in both the stock exchanges. In FY05, the amount of market capitalization inclusive of new issues increased by 57.7 percent and 58.6 percent in the Dhaka and Chittagong stock exchanges respectively. In FY05, the amount of market turnovers in the secondary market increased by 203.2 percent and 98.8 percent at the Dhaka and Chittagong stock exchanges respectively. The main reasons for escalation of the turnover were increased confidence of the investors in the capital market changing the settlement system of shares, which allowed excess trading. The rate of growth in all-share price index in the Dhaka and Chittagong Stock Exchanges (29.9 percent and 46.0 percent respectively) in FY05 were much higher than the nominal GDP growth rate, clearly sufficient to arouse investor appetite. Day-to-day changes in price indices and market capitalization in FY05 mainly reflected local conditions with no unusual volatility.
(d) The Way Forward for the Debt-Equity Market Development
In order to further capital market development, the government needs to participate in the market more actively. Initiatives are needed to make the market more liquid, and facilitate trading in already issued government bonds in the secondary market. Availability of risk-free instruments would thus allow investors to diversify their portfolio and carry lower risks. By successfully mobilizing funds from local sources, the government can also reduce its dependency on foreign funds to finance its growth. Of course, public awareness and the development of stock market infrastructure are also essential to the capital market growth. Side by side, enforceable regulation will also have to be ascertained to ensure financial transparency, stop financial malpractice and to prevent any

MPR_06_01
77
Chapter 3 (continued) form of market manipulation. There appear to be some key sectors which are primed for development. Information technology is one sector to which Bangladesh can pay attention to. This nascent industry could be made public and a specialized bond styled "Chip Bonds" could be introduced to finance its potential growth.
Physical infrastructure remains another vital sector, which could be effectively privatized to gear up economic growth. The government does not have the resources to meet the investment needs. Financing these projects with commercial bank loans today would be hard in view of competing needs for liquidity in the economy. As a financial product, securitization has gained popularity for providing a method of issuing bonds that ensures maximum safety for investors. Most importantly, securitization addresses the fundamental asset-liability maturity mismatch problem by providing true long-term funds. The importance of securitization is immense especially in the area of infrastructure development in Bangladesh. By following existing asset backed securitization, the revenues of Jamuna Bridge for example, Bangladesh may be able to finance a large share of Padma Bridge. In this regard, removal of the existing stamp duty on issue and transfer of unlisted securities and standardizing the regulatory and accounting treatment of securitization along with a securitization law would be required to facilitate the process.
References:
Bangladesh Bank (2002-2003), Annual Report, Bangladesh Bank. Barro, R (1974), "Are Government Bonds Net Wealth", Journal of
Political Economy, 82: pp.1095-117. Chowdhury, A. R. (1994). “Statistical Properties of Daily Returns from Dhaka Stock Exchange,” The Bangladesh Development Studies: Volume 26, No. 4, pp. 61-76. Easterly, W. and K. Schmidt-Hebbel (1993),"Fiscal Deficits and
Macroeconomic Performance in Developing Countries", World Bank Research Observer, 8(2), 211-37.
Fisher, Irving (1907), “The Rate of Interest”, New York: MacMillan Company
GOB (2004), "The Economic Review," Ministry of Finance, Government of Bangladesh, 2004. Goodfriend, Marvin. “Interest Rate Policy and the Inflation Scare Problem: 1979–1992,” Federal Reserve Bank of Richmond Economic Quarterly, vol. 79 (Winter 1993), pp. 1–24. Hossain, Akhtar (1996), "Macroeconomic Issues and Policies: The case
of Bangladesh", SAGE Publications. Levine, R. (1997), “Financial development and economic growth: Views
and agenda,” Journal of Economic Literature: 35, 688-726. Levine, R. and Zervos, S., (1998), “Stock markets, banks, and economic growth,” American Economic Review: 88, 537-558. Mehra, Yash P. (1995), “A Federal Funds Rate Equation,” Working Paper 95-3. Richmond: Federal Reserve Bank of Richmond. Mishkin, S. Frederic (1990), “What Does the Term Structure Tell us about Future Inflation?” Working Paper No. 2626, NBER.

MPR_06_01
78
Chapter 3 (continued) Mishkin and Jorion, (1991), "A Multi-country Comparison of Term Structure, Journal of Monetary Economics, Elsevier, Vol. 25(1), pp.77-95. Prasad, J. and Khundrakpam (2000), "Government Budget Deficit and
Inflation in India", Reserve Bank of India's occasional paper. Roe, A and Peachey, S., (2005), Bangladesh: Reducing Interest Rate Spread: Scoping Report.

MPR_06_01
79
Chapter 457 Supply Side Developments58 4.1 Agriculture
59
The agriculture sector employs about 51.7 percent of country’s total labour force employment (Ministry of Finance, 2005, p. 67). Rice and rice products share the major dietary energy supply in Bangladesh. According to the Food and Agriculture Organization (FAO), about 72 percent of total dietary energy was supplied by rice and rice products followed by wheat and wheat products (9 percent), and oil and soybean (3 percent) during 2000-2002. The sector has the single largest contribution in explaining the quality of life of the majority of people.
(a) Agriculture -sector Contribution to GDP
The agriculture-sector accounted for about 23.08 percent of GDP in FY04 and about 21.91 percent (provisional) in FY05 (Table 4.1). Of the Agriculture sector contribution to GDP, crops alone contribute a major part. In FY05, about 12.10 percent of GDP was shared by crops followed by fisheries about 5.03 percent, animal farming about 2.97 percent and forest sub-sector about 1.81 percent of GDP in FY05 (Table 4.1). Major crops include three varieties of rice namely aus, aman and Boro along with others alike wheat, maize, vegetables, potato, sugarcane, masur, mustard, tobacco, tea, jute, cotton etc.
Table 4.1 Percentage Share of GDP
Industry Sector FY03 FY04 FY05(p) Agriculture 23.47 23.08 21.91 Agriculture and Forestry 18.22 17.97 16.88 Crops (including horticulture) 13.43 13.23 12.10 Animal Farming 2.93 2.91 2.97 Forest and Related Services 1.86 1.83 1.81 Fishing 5.25 5.11 5.03 Industry 27.24 27.69 28.44 Services 49.30 49.22 49.65
GDP at constant producer price (1995-96) 100 100 100
p=provisional Estimate Source: National Accounts Statistics, BBS, June 2005
(b) Crops Agriculture
The crops sub-sector is estimated to have declined by 0.73 percent (table 4.2) in FY05. This decline is mainly because of reduced production of cereal. Total amount of cereal (rice, wheat and maize) production in FY05 is estimated (revised) to have been 26.3 million metric tons, which is 4.18 percent lower than the previous year’s level. Production of aus is estimated to have been 1.5 million metric tons, aman 9.82 million metric tons, boro 14.0 million metric tons, wheat 0.98 million metric tons and maize 0.38 million metric tons in FY05. Production of crop production is
Chapter 4 (continued) 57 Contributed by Dr. Md. Aktharuzzaman, D r. Sayera Younus. Md. Shahiduzzaman and Mainul Islam Chowdhury. 58 Contributed by Dr. Md. Aktharuzzaman, Dr. Sayera Younus. Md. Shahiduzzaman and Mainul Islam Chowdhury. 59 Prepared by Md. Shahiduzzaman.

MPR_06_01
80
estimated to have decreased in FY05 due to the devastating flood during July- September’04. Table 4.3 reports the comparative position of the production of some crops including rice (aus and aman) and wheat. It shows that aus production decreased by 18.12 percent, aman by 14.76 percent and wheat by 22.11 percent.
(c) Non-Crops Agriculture
The growth rate of animal farming sub-sector is estimated to have increased by 7.82 percent in FY05 as compared to 4.98 percent rate in FY04 (Table 4.3). This increased growth was mostly due to growth of
Table 4.2
Sectoral and Sub-sectoral Growth Rates (FY03-05) Industry/
Sector FY03 FY04 FY05(p)
Agriculture 3.08 4.09 0.32 Agriculture and Forestry 3.29 4.38 -0.73
Crops (inc. horticulture) 2.88 4.27 -3.30 Animal Farming 4.51 4.98 7.82 Forest and Related Services 4.43 4.18 4.25 Fishing 2.33 3.09 4.02 Industry 7.26 7.60 8.55 Services 5.38 5.66 6.63 GDP at constant market price 5.26 6.27 5.38
p=provisional estimate Source: National Accounts Statistics, BBS, June 2005
the poultry industry (Bangladesh Bureau of Statistics, 2005, p. 4). The growth rate of forest and related services sub-sector is estimated to have increased by 4.25 percent in FY05 as compared to the 4.18 percent in FY04. It has been estimated that fish production has increased by 4.02 percent in FY05 in comparison to the 3.09 percent rate in FY04.
(d) Floods in 2004 and the Loss of Agricultural Production
The July-August’ 2004 flood inundated 38 percent area of Bangladesh and affected 36 million people across 39 districts. It severely damaged infrastructure, crop-lands and environment incurring losses of an estimated amount of D 2.2 billion or 3.9 percent of GDP. The loss comprised D1.3 billion in asset loss and D0.9 billion in output loss (ADB, September 2004, pp. 1-2). However, because of quick and extensive post-flood rehabilitation program, crop losses did not exacerbate much and showed a sign of recovery quickly. Boro production increased by 9.06 percent and the production of potato, mustard, onion and vegetables are estimated to have increased in FY05 (Table 4.3).
Overall agricultural growth in FY05 is estimated to have been only 0.3 percent against the 4.1 percent in FY04. This caused the overall GDP growth to be reduced to 5.4 percent, vis-à-vis the 6.3 percent growth in the preceding year. Figure 4.1 shows the steady trend of industry and service sector growth. Figure 4.2 clearly depicts that the low growth in agriculture is mainly due to the sharp decrease in the growth the crops sub-sector.
Chapter 4 (continued)

MPR_06_01
81
Table 4.3 Crop wise Agricultural Production in FY04 and FY05
Crops Production in
FY04 (in '000' MT)
Production in FY05 R
(in '000' MT)
% Change from the previous year
Aus 18.32 15.00 -18.12 Aman 115.20 98.20 -14.76 Boro 128.37 140.00 9.06 Wheat 12.53 9.76 -22.11 Maize 4.66 3.75 -19.53 Jute 7.87 5.58 -29.10 Potato 39.07 59.48 52.24 Masur 1.22 1.18 -3.28 Mustard 3.16 3.79 19.94 Sugarcane (exc. Mills ) 36.52 35.52 -2.74
Onion 5.30 7.54 42.26 R=revised
Source: Bangladesh Bureau of Statistics and Directorate of Agricultural Extension as reported in the Bangladesh Bank Quarterly, April-June'2005
Figure 4.1
Sectoral Growth of GDP
0 . 0 0
1 . 0 0
2 . 0 0
3 . 0 0
4 . 0 0
5 . 0 0
6 . 0 0
7 . 0 0
8 . 0 0
9 . 0 0
F Y 0 3 F Y 0 4 F Y 0 5 ( p )
F Y
Gr
ow
th r
ate
(%
)
Source: Bangladesh Bureau of Statistics, National Accounts Statistics. June
2005
Figure 4. 2 Sub-sectoral growth of Agriculture
- 4 . 0 0
- 2 . 0 0
0 . 0 0
2 . 0 0
4 . 0 0
6 . 0 0
8 . 0 0
1 0 . 0 0
F Y 0 3 F Y 0 4 F Y 0 5 ( p )
F Y
Gr
ow
th r
ate
(%
)
Data Source: Bangladesh Bureau of Statistics, National Accounts Statistics. June 2005
Chapter 4 (continued)
Agriculture
Industry
Service
GDP
Animal farming
Forest & Related
Fishing
Crops
Agriculture

MPR_06_01
82
(e) Export of Agricultural Commodities
Agricultural products constituted 4.95 percent60 (FY05) of total exports of the country (Ministry of Finance, 2005, p. 67). Major export items in agriculture include jute and jute products, vegetable, shrimp and tea. Figure 4.3 reports exports of selected agricultural items. According to the table, shrimp production increased by Tk.4190 million, vegetable Tk. 690 million, tea Tk.30 million while jute export decreased by only Tk. 440 million in FY04 than that in FY03. Bangladesh is now exporting vegetables and high value crops into the European Market. Diversification in agricultural exports may lead to higher agricultural exports and result in higher agriculture output in the future.
Table 4.4 Exports of Selected Agricultural Items
Million Tk. Item FY01 FY02 FY03 FY04
Jute and jute products 16040 17490 19670 19230 Shrimp 18850 14480 17200 21390 Tea 1160 1000 900 930 Vegetable 690 880 770 1460
Source: Export Promotion Bureau as reported in the B BS, 2005
(f) Agricultural Credit
Total disbursement of agricultural credit was 54.7 billion taka in FY05 (Bangladesh Bank, 2005, p. 31), which is 34.4 percent higher than that in the previous year. Crops alone constituted a majority of 43.7 percent of total disbursement followed by grain, storage, and marketing (12.8 percent), live stock (6.4 percent), and fisheries (2.6 percent). However, not all credit may have been utilized in production, and instead diverted to take care of flood losses. Total recovery of agriculture credit increased to BDT 34.4 billion; 9.5 percent increase from the previous year.
(g) Conclusion
While Bangladesh agriculture will remain dependent on the quality of the monsoon and the attendant flood regime, and hence an element of unpredictability would be inescapable, the outlook for FY06 looks positive. Given favourable climatic conditions and in view of record budgetary allocation in FY06, the expectation of a bumper rice production appears plausible and sectoral growth in the range of 3.8 to 4.3 percent is projected in this Review (see Box 4.1 for further details).
Chapter 4 (continued) 60 Export Promotion Bureau, up to July-March’05
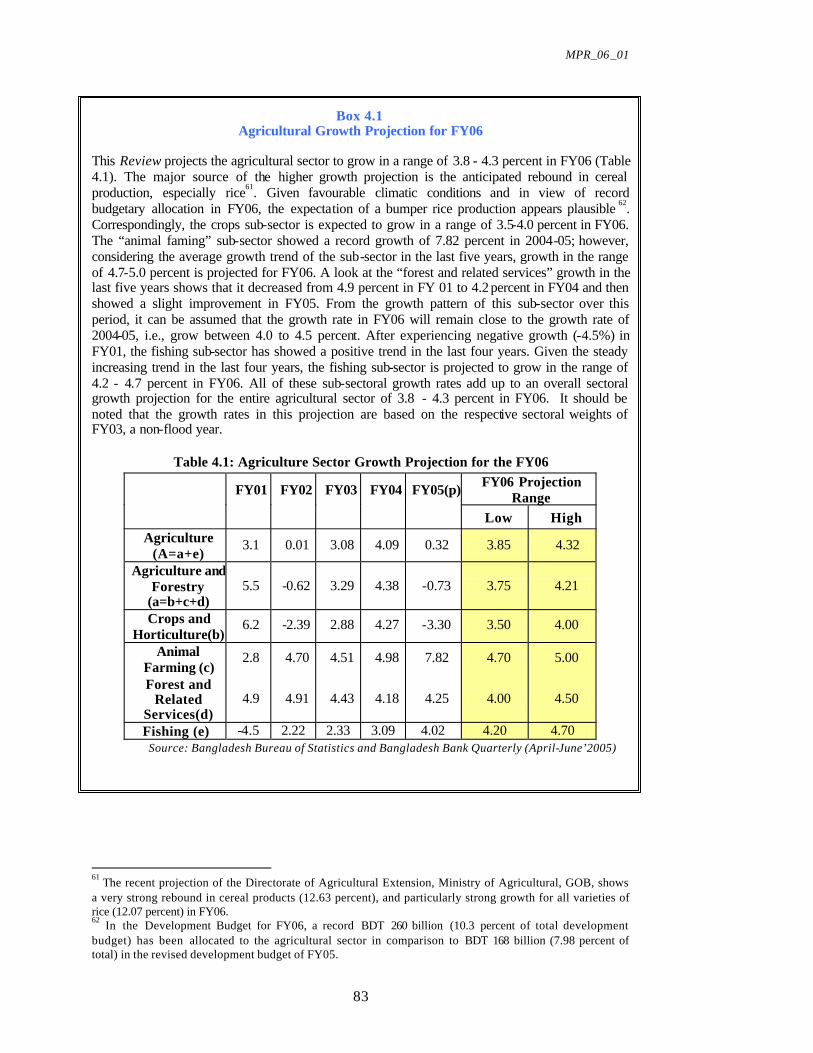
MPR_06_01
83
Box 4.1 Agricultural Growth Projection for FY06
This Review projects the agricultural sector to grow in a range of 3.8 - 4.3 percent in FY06 (Table 4.1). The major source of the higher growth projection is the anticipated rebound in cereal production, especially rice61. Given favourable climatic conditions and in view of record budgetary allocation in FY06, the expectation of a bumper rice production appears plausible 62. Correspondingly, the crops sub-sector is expected to grow in a range of 3.5-4.0 percent in FY06. The “animal faming” sub-sector showed a record growth of 7.82 percent in 2004-05; however, considering the average growth trend of the sub-sector in the last five years, growth in the range of 4.7-5.0 percent is projected for FY06. A look at the “forest and related services” growth in the last five years shows that it decreased from 4.9 percent in FY 01 to 4.2 percent in FY04 and then showed a slight improvement in FY05. From the growth pattern of this sub-sector over this period, it can be assumed that the growth rate in FY06 will remain close to the growth rate of 2004-05, i.e., grow between 4.0 to 4.5 percent. After experiencing negative growth (-4.5%) in FY01, the fishing sub-sector has showed a positive trend in the last four years. Given the steady increasing trend in the last four years, the fishing sub-sector is projected to grow in the range of 4.2 - 4.7 percent in FY06. All of these sub-sectoral growth rates add up to an overall sectoral growth projection for the entire agricultural sector of 3.8 - 4.3 percent in FY06. It should be noted that the growth rates in this projection are based on the respective sectoral weights of FY03, a non-flood year.
Table 4.1: Agriculture Sector Growth Projection for the FY06
Source: Bangladesh Bureau of Statistics and Bangladesh Bank Quarterly (April-June’2005)
61 The recent projection of the Directorate of Agricultural Extension, Ministry of Agricultural, GOB, shows a very strong rebound in cereal products (12.63 percent), and particularly strong growth for all varieties of rice (12.07 percent) in FY06. 62 In the Development Budget for FY06, a record BDT 260 billion (10.3 percent of total development budget) has been allocated to the agricultural sector in comparison to BDT 168 billion (7.98 percent of total) in the revised development budget of FY05.
FY01 FY02 FY03 FY04 FY05(p)FY06 Projection
Range
Low High
Agriculture (A=a+e)
3.1 0.01 3.08 4.09 0.32 3.85 4.32
Agriculture and Forestry
(a=b+c+d) 5.5 -0.62 3.29 4.38 -0.73 3.75 4.21
Crops and Horticulture(b)
6.2 -2.39 2.88 4.27 -3.30 3.50 4.00
Animal Farming (c)
2.8 4.70 4.51 4.98 7.82 4.70 5.00
Forest and Related
Services(d) 4.9 4.91 4.43 4.18 4.25 4.00 4.50
Fishing (e) -4.5 2.22 2.33 3.09 4.02 4.20 4.70

MPR_06_01
84
Chapter 4 (continued)
4.2 Investment in Productive Capacity63
Growth in gross fixed capital formation (GFCF) in constant price has grown steadily since FY01 from 5.4 percent per annum to as high as 9.4 percent in FY04 (Table -4.5). As a percentage of GDP the growth of GFCF is discernible that has also grown steadily since FY97 from 22.4 percent to as high as 27.0 percent annually. This accelerated growth rate of GFCF in FY04 can mainly be attributed to a strong increase in capital outlays in construction activities by both private and public sector. In the latter sector the construction outlays are realized by public agencies and corporations (under different ministries) mainly in infrastructural development. In fact, of the public sector investment, construction contributes around 66 percent in FY04. The growth of was further supported by continued growth in gross fixed capital formation by the private sector activities in residential and commercial housing and other construction. The provisional figure for FY05 is also showing positive growth rate of GFCF albeit relatively lower than the previous year (6.9 percent) though the growth of capital outlays in the principal component of GFCF i.e., construction (which accounts as much as 75 percent of GFCF) has accelerated from 6.5 percent in FY04 to 7.7 percent in FY05. The second largest component of GFCF is investment in plant and machinery that registered a substantial growth in FY04 (29.2 percent) but the growth rate has slowed down to a much lower rate at 5.7 percent. Private versus Public sector’s Share of Gross fixed capital formation in GDP: As a percentage of GDP the public sector investment (GFCF) represented 7.4 percent in FY97 and followed a falling trend that reached only 5.9 in FY05 whereas the opposite is happened for private sector investment. The latter’s share in GDP increased gradually and reached to 20.2 percent in FY05 from 13.9 percent in FY97. However, the total GFCF (investment) as percentage of GDP has been stable at around 26 percent in new millennium, FY00 to FY05 64. Private versus Public Sector Share in Total Investment: Share of private sector investment in total investment ranged from 65 percent to 75 percent during FY97-FY05. In fact, it has been regularly increasing during the period FY90-FY05 and consequently, the share of public investment in total investment reached only 25 percent in FY05 from 35 percent in FY98 during the same period under study. Gross fixed capital formation (GFCF) in public sector by sources of funding: Share of financing in public sector GFCF by budgetary allocation under Annual Development Program (ADP) ranged from 53 percent in FY98 to only 41 percent in FY05. The share of investment of state owned enterprises (SOEs) in the public sector GFCF ranged from 34 percent to 42 percent.
63 Prepared by Dr. Md. Akhtaruzzaman. 64 All the figures such as GFCF and its sectoral component, private and public GFCF, Investment-GDP ratio, Private Investment-GDP ratio, public Investment-GDP ratio, ADP share in public investment etc. are expressed in constant market price.

MPR_06_01
85
Chapter 4 (continued)
Table 4.5 Composition of Gross Fixed Capital Formation (GFCF) at constant price (base: 1995-96=100)
Year Construction
Plant and
Machinery Transport Equipment GFCF
GFCF as % of GDP
FY97 270.4 52 39.8 363.6 21.1 FY98 292.4 58.6 45 397.2 22.4
(8.1) (12.7) (13.1) (9.2) FY99 315.4 63.2 47.8 427.7 23.5
(7.9) (7.8) (6.2) (7.7) FY00 350.7 66.6 51.8 470.6 23.8
(11.2) (5.4) (8.4) (10.0) FY01 379.4 75.8 39.2 496.1 23.9
(8.2) (13.8) (-24.3) (5.4) FY02 406 77 38.5 522.6 24.8
(7.0) (1.6) (-1.8) (5.4) FY03 421.7 85 46.1 553.9 25.4
(3.9) (10.4) (19.7) (6.0) FY04 449.2 109.8 45.8 606.0 26.1
(6.5) (29.2) (-0.7) (9.4) FY05p 483.7 116.1 46.5 647.6 27.0 (7.7) (5.7) (1.5) (6.9)
Source: Bangladesh Bureau of Statistics; Note: The figures in the parentheses are year-to-year simple growth rate
Figure 4.3
Sector-Wise Gross Fixed Capital Formation in 1995-96 constant price
0.0
150.0
300.0
450.0
600.0
750.0
F Y 9 7 F Y 9 8 F Y 9 9 F Y 0 0 F Y 0 1 F Y 0 2 F Y 0 3 F Y 0 4 F Y 0 5
Cons t r u c t i on P lant and Mach inery Transport Equipment G F C F
Source: BBS (National Income Account, June 2005)
Sectoral Share of Investment: An analysis of Gross Fixed Capital Expenditure in the economy by type of economic activity in the FY05 indicated some decrease, albeit marginally than in the previous year (FY04), in capital outlays by the construction, plant and machinery and transportation equipment. In the previous fiscal year (FY04) investment in construction sector represented more than three fourth (about 75 percent) of total GFCF and its share has been steady during last eight years (during FY97-FY05). It is the single -most important growth sector in the economy today (Figure-4.3). The second highest component of investment is Plant and Machinery. Its contribution is 14 percent and the third highest category is transport equipment whose share is 11 percent.

MPR_06_01
86
Chapter 4 (continued) Investment in the Construction Sector: Real investment in residential housing and other construction activities recorded a steady growth of average 8-9 percent per annum during the period (FY99-FY02) but since FY03 the growth rate recorded a fluctuating trend that picked down to 3.9 percent in FY03. Again, in the previous fiscal year (FY04) the growth in this sector got momentum and picked up to 6.5 percent and it is likely to be somewhat higher in FY05 (7.7 percent) as shown in BBS’s figure for provisional estimates. The investment boom in this sector is caused by many factors of which steady growth of GDP, increasing rate of urbanization and increasing share of urban population, and industries expansion are the major ones. The substantial gains in Bangladesh’s final domestic demand in recent years have led to a marked rise in capital spending in this sector. The other important element is construction activities in infrastructure development sector such as roads and highways, bridges, school and hospital and administrative buildings etc. Construction activities in the industry sector is also one of the important sources of investment, for instances, construction of factory buildings in export oriented ready-made garments etc. Recent boom of service sector activities, as evident in its share in GDP (more than 50 percent in recent years) give further spurt on investment in construction work due to the fact that trade and other service oriented activities especially in health, education and recreation industries recorded a phenomenal growth in the last couple of years. The addition of retail space for domestic commercial and foreign trade activ ities in response to buoyant consumer demand lifted the growth momentum of gross fixed capital formation by the construction activities in commerce sector. All these developments show evidence of sustained investment growth in the construction sector.
The growing share of service sector as well as the growing share of industry in GDP has supported the fact that there is a growing investment in construction sector. Furthermore, the increasing trend of the share of clinker, steel and iron materials in total imports which are basically the raw material inputs in construction sector is indicative of booming activities in this sector. Furthermore, there is an increasing growth registered in Quantum Index of Cement, Iron and steel (see Figure 4.4) which are again directly used as the input in construction sector. All these indicators support the very fact that the level of capacity utilization in this booming sector has got momentum with the increasing share of investment realized in this sector. However, it is equally reasonable to guess that without huge utilization of the substantially enhanced capacity in the construction sector further investment in this sector would not be happened.
Investment in Plant and Machinery and Transport Equipment: There is a very fluctuating trend of average annual (simple) growth rate of real GFCF in plant and machinery ranged from 12.7 percent in FY97 to 5.7 percent in FY05. The growth rate was much higher (29.2 percent) in FY04 but for FY05, however, the provisional estimates indicate that the growth rate has substantially slowed to 5.7 percent. The main reason is probably the post-MFA effect on export earnings from ready-made garments (RMG) especially the woven garments and also on textiles and RMG accessories industries. Woven wear industry is 100 percent export oriented and it is one of the principal sectors of destination of investment for plant and machinery but during FY05 this sector recorded a

MPR_06_01
87
Chapter 4 (continued) substantially decelerated growth rate in terms of both export earnings and volume due to world-wide quota removal under WTO’s MFA phase-out.
Figure 4.4 Quantum Index of Major Industries (Large and Medium Scale)
Base: 1988-89= 100
0
200
400
600
800
1000
1200
FY02 FY03 FY04 FY04 FY05
Index
valu
e
J u t e T e x t i l e s
C o t t o n T e x t i l e s
R M G
F e r t i l i z e r
C e m e n t
I r o n a n d S t e e l
G e n e r a l I n d e x
Source: BBS; (Figures of FY04 and FY05 are for July-Dec. period)
Investment in transport equipment has registered a very high negative growth rate in FY01. Part of the reason was probably an overall slowdown of demand for transport equipments due to mainly high import duty on those items. The increasing trend of oil price would also give some pressure in slowing investment in this sector. However, after one year (in FY03) its growth is picked up substantially due to mainly huge import of environmental friendly (run by CNG energy) transport equipments.
The overall growth performance of RMG, cotton textile and jute textiles industry as evidenced in the upward movement of quantum index (Chart-4.2) is an indication of substantial utilization of newly enhanced capacity realized by increasing rate of gross fixed capital formation in capital and machinery in industry sector in FY05.
(a) Foreign Direct Investment (FDI)65
Investment is seen as constraint to economic development in the developing world. FDI provides opportunities to overcome domestic resource constraints and also brings other economic benefits as well. The components of FDI are equity capital, intra-company loans and/or reinvested earnings. It is argued that FDI enhances human capital and transfers technology, facilitates market access and integrates domestic economy into the global production chain. It bridges the financial gap between the quantum of funds needed to sustain a level of growth and the domestic availability of funds. It helps to transfer technology coupled with knowledge diffusion that leads to improvement in productivity. It can thus hasten the rate of technological progress through a contagion effect that permeates domestic firms. It facilitates transfer of better
65 FDI is defined as the category of international investment that reflects the objective of a resident entity in one economy obtaining a lasting interest in an enterprise resident in another economy (Balance of Payment Manual, fifth edition, IMF). This section is prepared by Md. Kabir Ahmed.

MPR_06_01
88
Chapter 4 (continued) organizational and management practices through the linkages between the investing foreign company and local suppliers and customers. Therefore, there is an increasing and intense competition among countries to maximize the quantity of FDI inflows. Bangladesh has also been making continuous efforts to attract FDI since the 1980s. From 1986-90, Bangladesh attracted only 2 million USD. In the 1990s, Bangladesh significantly liberalized its economy and undertook some measures to attract foreign investment. Subsequently FDI continued to grow, though fluctuated for some periods. However, trends in FDI inflows and their position in the context of developing world, South-East Asia and SAARC countries are further discussed below.
(b) Component-wise FDI inflows
Reviewing FDI inflows of last six fiscal years, it is observed that Bangladesh experienced remarkable growth in FDI inflow in FY 2000-01(see Figure 4.5). However, the economy continued to remain sluggish for the next three consecutive fiscal years. FDI inflows sharply declined from 564 million USD in FY 01 to 284.2 million USD in FY 04 before recovering in FY05. Component-wise analysis shows that both equity capital and intra-company loans declined considerably from 372.3 million USD and 110.8 million USD in FY 2000-01 to 111.2 million USD and 11.5 million USD in FY 2003-04 respectively. Despite declining trend of equity capital and intra-company loans, reinvested earnings grew moderately during that period. In FY 2002, inflow of reinvested earnings was 80.9 USD, which increased to 161.4 million USD in FY 2004. Reinvestment of earnings by foreign investors indicated economic prospects of their businesses in the Bangladesh economy. After three years of continuous declining flow, the economy again got momentum in FDI growth during July-December 2005. During this period, inflow of FDI was 460.4 million USD, which was, in fact, 176.2 million USD higher than the inflow of FDI in entire FY 04.
Figure 4.5 Trends in FDI inflows
0
100
200
300
400
500
600
1999-00 2000-01 2001-02 2002-03 2003-04 Ju-Dec 04
Mill
ion
USD
Equity Capital Reinvested earnings Intra-company Loans
Source: Based on data supplied by Statistics Department, Bangladesh Bank

MPR_06_01
89
Chapter 4 (continued) (c) FDI inflows in terms of EPZ and non-EPZ areas
It is argued (e.g., citing the example of China) that FDI may contribute to economic growth through its effect on exports. However, FDI in Bangladesh is yet to play a significant role in this direction. Inflow of FDI in EPZ is mainly associated with export-oriented industries. Though the economy experienced an upward movement of FDI inflow in EPZ in FY 03, it subsequently faced a decelerating trend. Indeed, inflow of FDI in EPZ in FY 03 was 86.7 million USD, which came down to 38.9 million USD in FY 04. During first half of FY 05 (July-December, 2004), inflow of FDI in EPZ was 27.2 million USD.
Figure 4.6: FDI inflows in EPZ and non-EPZ areas
Source: Based on data supplied by Statistics Department, Bangladesh Bank (d) Sectoral Decomposition of FDI Inflow The sectoral decomposition of FDI inflow shows that service sector attracted more FDI than any other sectors during FY 02 to FY 0566. In this sector, telecommunication, energy and power, oil, gas and coal and financial services sector were the major recipients of FDI flows.
Deregulation of the telecommunication sector created the scope for private operators as well as foreign investors to run mobile cellular phone systems and operate telephone exchanges. Consequently, inflow of FDI continued to grow in this sector. A good number of foreign/joint venture companies such as Grameen Phone, TM International, Sheba Telecom, Pacific Bangladesh and Bangla Link are presently operating in this sector and have created a competitive environment to put downward pressure on call charges. This trend is likely to continue, considering the fact that Bangladesh has one of the lowest telephone penetration rates (4.8 per thousand) in the region.
In the manufacturing sector, textile and chemical industries were major recipients of FDI. Under the chemical category, pharmaceuticals, fertilizer and cement industries attracted major FDI inflows. In the financial services sector, foreign banks and joint venture leasing companies were the major recipients of FDI. The above trend indicates that foreign investors are targeting those industries, which have either large domestic or foreign markets. Inflow of FDI in textile sector by Taiwan, France, Pakistan and Malaysia are mainly targeting the duty-free market access facility enjoyed by Bangladesh in most of the developed countries.
66 Fiscal year 05 covers only July-December period.
050
100150200250300350400
2 0 0 1 - 0 2 2 0 0 2 - 0 3 2 0 0 3 - 0 4 J u - D e c 0 4
Mil
lio
n U
SD
E P Z
N o n - E P Z
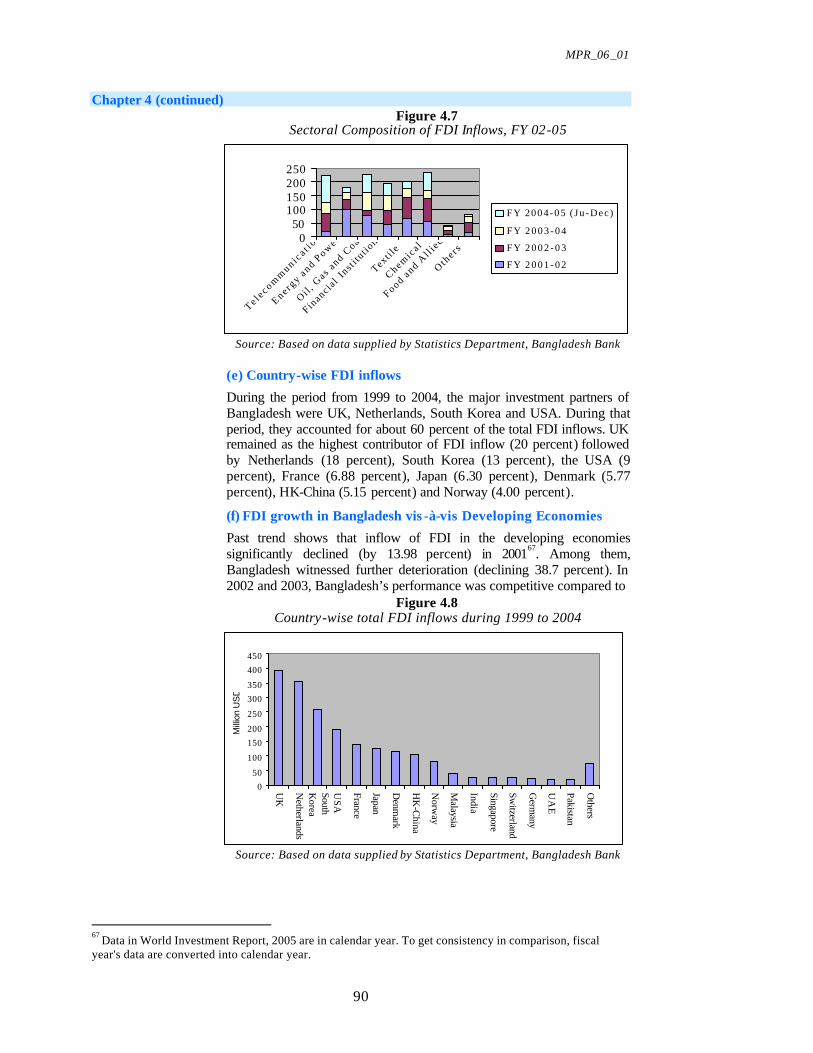
MPR_06_01
90
Chapter 4 (continued) Figure 4.7
Sectoral Composition of FDI Inflows, FY 02-05
Source: Based on data supplied by Statistics Department, Bangladesh Bank
(e) Country-wise FDI inflows
During the period from 1999 to 2004, the major investment partners of Bangladesh were UK, Netherlands, South Korea and USA. During that period, they accounted for about 60 percent of the total FDI inflows. UK remained as the highest contributor of FDI inflow (20 percent) followed by Netherlands (18 percent), South Korea (13 percent), the USA (9 percent), France (6.88 percent), Japan (6.30 percent), Denmark (5.77 percent), HK-China (5.15 percent) and Norway (4.00 percent).
(f) FDI growth in Bangladesh vis -à-vis Developing Economies
Past trend shows that inflow of FDI in the developing economies significantly declined (by 13.98 percent) in 200167. Among them, Bangladesh witnessed further deterioration (declining 38.7 percent). In 2002 and 2003, Bangladesh’s performance was competitive compared to
Figure 4.8 Country-wise total FDI inflows during 1999 to 2004
Source: Based on data supplied by Statistics Department, Bangladesh Bank
67 Data in World Investment Report, 2005 are in calendar year. To get consistency in comparison, fiscal year's data are converted into calendar year.
050
100150200250
Te l ec om
mun i c
a t i on
Ene rgy a
nd Pow
e r
Oi l , G
as and C
oal
Financia
l Inst
i tut io
ns
Texti le
Chemic
a l
Food and Al l i
ed
Oth
e r s
FY 2004-05 ( Ju -Dec )
F Y 2 0 0 3 - 0 4
F Y 2 0 0 2 - 0 3
F Y 2 0 0 1 - 0 2
0
50
100
150
200
250
300
350
400
450
UK
Netherlands
SouthK
orea
USA
France
Japan
Denm
ark
HK
-China
Norw
ay
Malaysia
India
Singapore
Switzerland
Germ
any
UA
E
Pakistan
Others
Milli
on U
SD

MPR_06_01
91
Chapter 4 (continued) other developing nations. However, developing world experienced robust growth in FDI inflow (about 40 percent) through the year 2004. At the same time, Asia’s developing economies attracted more FDI (46 percent) than the average of world’s developing economies. Bangladesh also witnessed, though less than the average of the world’s developing economies, commendable growth (about 31 percent) in FDI inflow. (g) FDI as a Percentage of Gross Fixed Capital Formation (GFCF)
FDI as a percentage of gross fixed capital formation (GFCF) grew substantially in the developing economies during 2002 to 2004. Asia and South-East Asia also showed similar trend during that period. However, South Asian economies witnessed much lower growth than those economies. Even Bangladesh economy faced significantly lower FDI growth than that of the South Asian economies. Another striking feature can be observed that when the average FDI/GFCF ratio of South Asian economies increased in 2004, the said ratio for Bangladesh economy declined moderately. It indicates that FDI in Bangladesh is yet to play a remarkable role in economic development.
Figure 4.9 Status of Bangladesh in terns of FDI growth in developing economies
Source: Based on data published in World Investment Report (WIR) 2005
Figure 4.10 FDI inflows as percent of Gross Fixed Investment
Source: Based on data published in World Investment Report (WIR) 2005
- 5 0
- 4 0
- 3 0
- 2 0
- 1 0
0
1 0
2 0
3 0
4 0
5 0
2 0 0 1 2 0 0 2 2 0 0 3 2 0 0 4
Gr
ow
th
ra
te
D e v . e c o n D e v e c o n , A s i a B a n g l a d e s h
0
2
4
6
8
1 0
1 2
1 4
1 6
Bangla
desh
Dev. e
conomies
Asia
South-
East A
sia
South
Asia
FDI i
nflo
w a
s %
of G
FI
2 0 0 2 2 0 0 3 2 0 0 4

MPR_06_01
92
Chapter 4 (continued) In terms of FDI/GFCF ratio, Bangladesh was far behind than the other SAARC economies during the period 2002 to 2004. While these economies, other than Bhutan and Nepal, achieved at least 3 percent of FDI inflows against their GFCF, Bangladesh attained maximum 0.83 percent in 2002.
Table 4.6 FDI inflows as a percent of Gross Fixed Capital Formation (GFCF)
2002 2003 2004 Bangladesh 0.8 0.7 0.5 India 3.0 3.2 3.4 Pakistan 7.2 4.3 6.2 Nepal -0.6 1.3 0.8 Sri Lanka 5.6 5.6 5.1 Maldives 7.6 5.8 5.0 Bhutan 0.1 0.3 0.2
Source: Based on data published in World Investment Report (WIR) 2005 (h) Status of Bangladesh in terms of Inward FDI Performance Index
According to UNCTAD’s Inward FDI Performance Index, Bangladesh was able to improve her position modestly over the years. Out of 140 economies, Bangladesh was ranked 122nd position in 2004 against its 127th position in 2001. The World Investment Report (2005) has documented that Bangladesh, in terms of inward FDI potential, is one of the under-performing countries. Though other SAARC countries such as India, Pakistan and Sri Lanka showed remarkable progress during the same period, further improvement of the investment climate is likely increase FDI inflows in Bangladesh.
Figure 4.11 Performance of Bangladesh and other SAARC
Countries in the World Economy in terms of FDI Inflows
Source: Based on from data published in World Investment Report (WIR) 2005
9 0
1 0 0
1 1 0
1 2 0
1 3 0
1 4 0
Ba n g l a d e s h
I n d i a
P a k i s t a n
Ne p a l
S r i La n k a
Inw
ard
FD
I P
erf
orm
an
ce
Ra
nk
ing
2 0 0 1
2 0 0 2
2 0 0 3
2 0 0 4

MPR_06_01
93
Chapter 4 (continued) 4.3 Employment, Labor Productivity & Wage Behaviour68
(a) Work Force and Employment
Domestic employment data is available up to FY03 from Labor Force Survey (LFS) 2002-03. Persons aged 15 years and above are included in the labor force. According to LFS 2002-03 44.3 million workers were employed in different occupations of which 34.5 million were male and 9.8 million were female. Female workers constituted 22 percent of the total labor force. Unemployment rate was measured to be 4.3 percent in 2002-03. Figure 4.12 shows that total unemployment rate increased from 3.5 percent in 1995-96 to 4.3 percent in 2002-03, male unemployment increased from 2.8 percent to 4.2 percent while female unemployment decreased from 7.8 percent to 4.9 percent during the same period. Labor force participation rate was measured to be 57.3 percent in 2002-03. Participation rate of male population was 87.4 percent while that of female population was 16.1 percent.
Figure 4.12 Unemployment Rate
Source: Report on Labor Force Survey 2002-2003, BBS.
Agricultural workers continued to dominate comprising 51.7 percent of the total work force. Employment in agriculture increased by 0.4 percentage points during LFS 2002-03 from 51.3 percent during LFS 1999-00. According to LFS 2002-03, service and industrial sectors employed 34.6 and 13.7 percent of the total labor force respectively. Figure 4.13 shows that share of agricultural employment increased from 48.9 percent of total employment in 1995-96 to 51.7 percent in 2002-03 and that of non-agricultural employment decreased from 51.1 percent to 48.3 percent. Figure 2.2 of section 2.1 shows that agriculture’s contribution to GDP is decreasing and that of non-agriculture sector is increasing over the years. This may be an indication of a falling productivity in the former sector relative to the trend in the productivity in the latter sector. Ratio of self employed, employer, employee, unpaid family worker and day labourers were 44.7, 0.45, 13.8, 18.3 and 20 percent of the total work force respectively during LFS 2002-03.
68 Prepared by Mainul Islam Chowdhury
0
2
4
6
8
10
1995-96 2000-01 2002-03
Fiscal Year
Une
mpl
oym
ent R
ate
Total Male Female
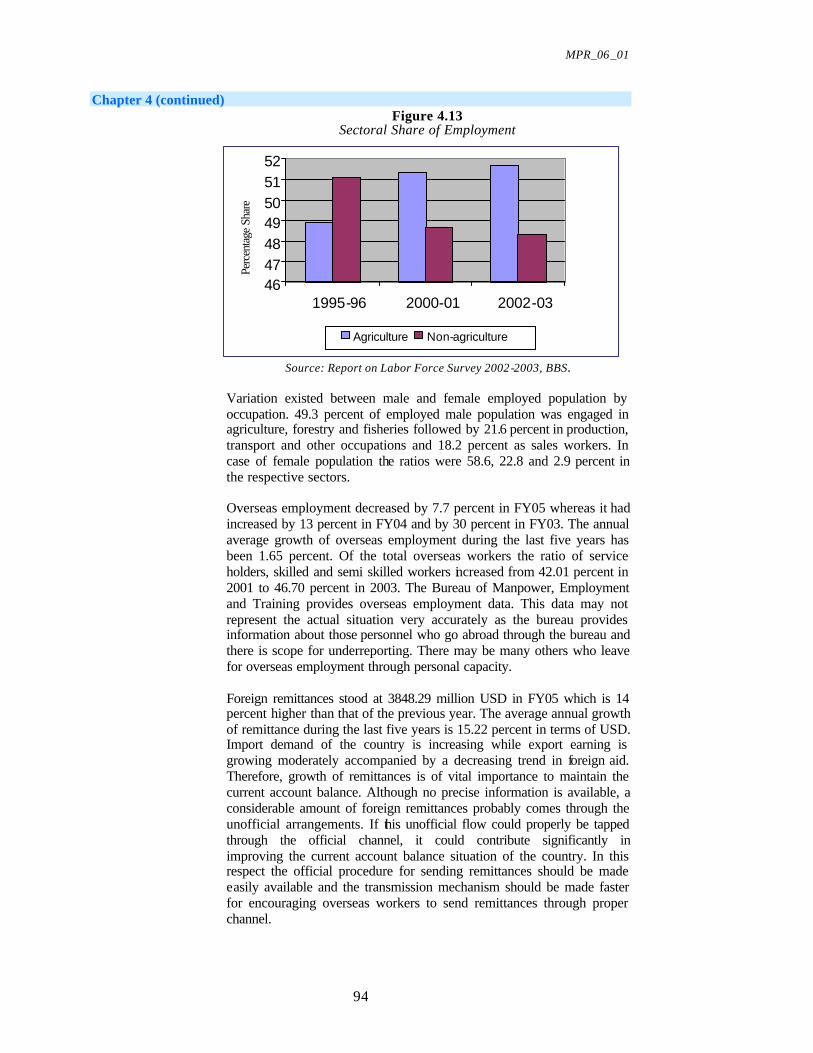
MPR_06_01
94
Chapter 4 (continued) Figure 4.13
Sectoral Share of Employment
Source: Report on Labor Force Survey 2002-2003, BBS. Variation existed between male and female employed population by occupation. 49.3 percent of employed male population was engaged in agriculture, forestry and fisheries followed by 21.6 percent in production, transport and other occupations and 18.2 percent as sales workers. In case of female population the ratios were 58.6, 22.8 and 2.9 percent in the respective sectors. Overseas employment decreased by 7.7 percent in FY05 whereas it had increased by 13 percent in FY04 and by 30 percent in FY03. The annual average growth of overseas employment during the last five years has been 1.65 percent. Of the total overseas workers the ratio of service holders, skilled and semi skilled workers increased from 42.01 percent in 2001 to 46.70 percent in 2003. The Bureau of Manpower, Employment and Training provides overseas employment data. This data may not represent the actual situation very accurately as the bureau provides information about those personnel who go abroad through the bureau and there is scope for underreporting. There may be many others who leave for overseas employment through personal capacity.
Foreign remittances stood at 3848.29 million USD in FY05 which is 14 percent higher than that of the previous year. The average annual growth of remittance during the last five years is 15.22 percent in terms of USD. Import demand of the country is increasing while export earning is growing moderately accompanied by a decreasing trend in foreign aid. Therefore, growth of remittances is of vital importance to maintain the current account balance. Although no precise information is available, a considerable amount of foreign remittances probably comes through the unofficial arrangements. If this unofficial flow could properly be tapped through the official channel, it could contribute significantly in improving the current account balance situation of the country. In this respect the official procedure for sending remittances should be made easily available and the transmission mechanism should be made faster for encouraging overseas workers to send remittances through proper channel.
46474849505152
1995-96 2000-01 2002-03
Perc
enta
ge S
hare
Agriculture Non-agriculture

MPR_06_01
95
Chapter 4 (continued) (b) Wage Behaviour As Shown in Figure 4.14, nominal general wage index stood at 3293 in FY05 which is 5.85 percent higher than the index value of 3111 of 2003-04. In FY04 nominal wage inflation was 6.32 percent.69 Average annual growth of nominal wage index from FY01 to FY04 was 6.84 percent. Nominal and real wage inflation (calculated by the percentage change in wage indices) follow similar trends increasing in FY03 having a value of 10.96 and 8.46 respectively and then falling sharply in FY04 to around 6 percent and a little lower than 4 percent respectively. As explained in section 2.1 above the plausible reasons include a fall in overseas employment along with an increase in labor supply and slow growth in productivity. Figure 4.15 explains sector wise nominal wage inflation. Nominal wage inflation in agriculture, fishery, manufacturing and construction were 5.31, 6.56, 6.64 and 3.33 percent respectively in FY05 and 5.69, 8.28, 7.55 and 1.69 percent respectively in FY 04. Average annual growths of nominal wage from FY01 to FY05 in the said sectors were 5.95, 5.91, 8.31 and 3.84 percent respectively.
Figure 4.14 Wage Growth
Source: Bangladesh Economic Review 2005 and Bangladesh Bank
Except for wage inflation in fishery, other sectors follow the pattern of general wage inflation, i.e. increasing up to FY03 and then having a decreasing trend, though in the construction sector wage inflation increased in FY05 after having fallen dramatically the year before. The average rates of wages in construction have in all likelihood kept down by the earnings of the "helpers" who are the least skilled and are more numerous than skilled ones. The low skill wages are predictably held down by the reserve army of the unemployed. Anecdotal evidence indicates a sharp rise over time of the skilled workers, be it in masonry, sanitation or electrical works. "Helpers" probably account between 60 to 75 percent of all workers; less so in carpentry (where the unskilled are the apprentices, as a result there is a continuum of skill distribution and hence wages may be more uniform). In case of fisheries wage inflation increased up to FY04 and then fell. It also does not have a sharp rise in FY03.
69 While changes in the wage rate are often described as “wage inflation”, this may well the misnomer. Wages must rise in a competitive market if there are productivity gains. Sectoral wages may also rise due to relative final good prices unrelated to the general CPI inflation.
0 . 0 0
2 . 0 0
4 . 0 0
6 . 0 0
8 . 0 0
1 0 . 0 0
1 2 . 0 0
2 0 0 1 2 0 0 2 2 0 0 3 2 0 0 4 2 0 0 5
F i s c a l Y e a r
Pe
rc
en
tag
e C
ha
ng
e
R e a l N o m i n a l
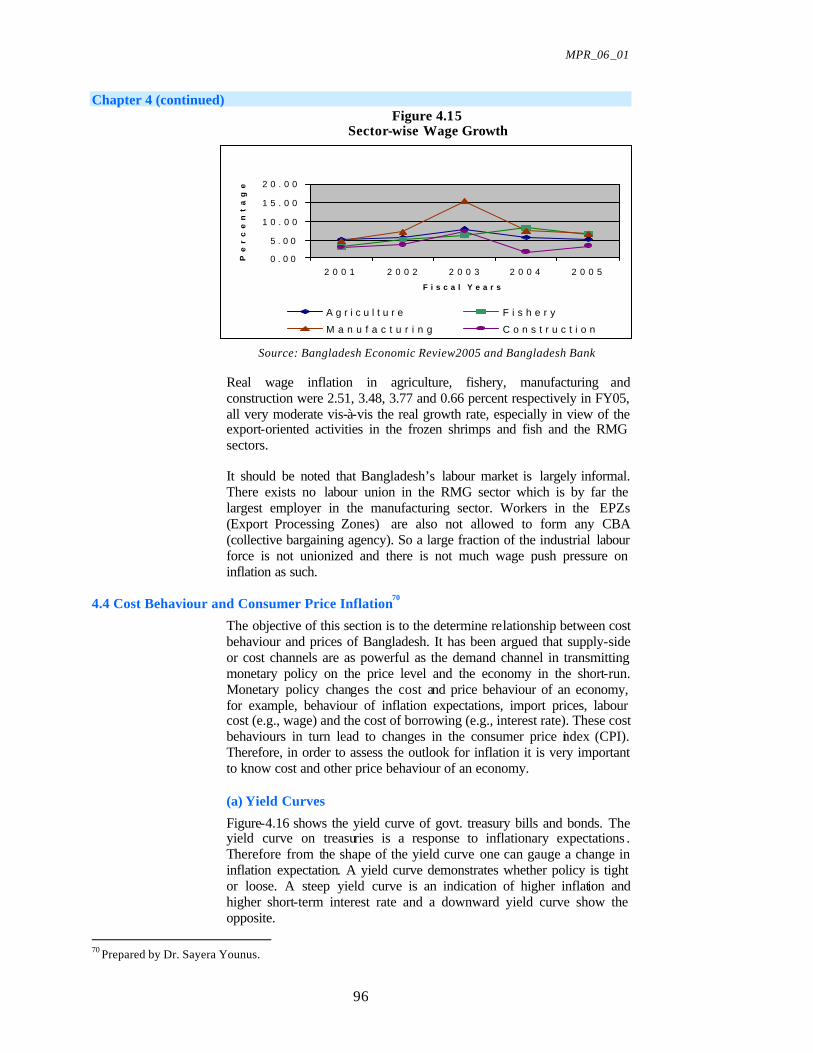
MPR_06_01
96
Chapter 4 (continued) Figure 4.15
Sector-wise Wage Growth
Source: Bangladesh Economic Review2005 and Bangladesh Bank Real wage inflation in agriculture, fishery, manufacturing and construction were 2.51, 3.48, 3.77 and 0.66 percent respectively in FY05, all very moderate vis-à-vis the real growth rate, especially in view of the export-oriented activities in the frozen shrimps and fish and the RMG sectors. It should be noted that Bangladesh’s labour market is largely informal. There exists no labour union in the RMG sector which is by far the largest employer in the manufacturing sector. Workers in the EPZs (Export Processing Zones) are also not allowed to form any CBA (collective bargaining agency). So a large fraction of the industrial labour force is not unionized and there is not much wage push pressure on inflation as such.
4.4 Cost Behaviour and Consumer Price Inflation70
The objective of this section is to the determine relationship between cost behaviour and prices of Bangladesh. It has been argued that supply-side or cost channels are as powerful as the demand channel in transmitting monetary policy on the price level and the economy in the short-run. Monetary policy changes the cost and price behaviour of an economy, for example, behaviour of inflation expectations, import prices, labour cost (e.g., wage) and the cost of borrowing (e.g., interest rate). These cost behaviours in turn lead to changes in the consumer price index (CPI). Therefore, in order to assess the outlook for inflation it is very important to know cost and other price behaviour of an economy. (a) Yield Curves
Figure-4.16 shows the yield curve of govt. treasury bills and bonds. The yield curve on treasuries is a response to inflationary expectations . Therefore from the shape of the yield curve one can gauge a change in inflation expectation. A yield curve demonstrates whether policy is tight or loose. A steep yield curve is an indication of higher inflation and higher short-term interest rate and a downward yield curve show the opposite.
70 Prepared by Dr. Sayera Younus.
0 . 0 0
5 . 0 0
1 0 . 0 0
1 5 . 0 0
2 0 . 0 0
2 0 0 1 2 0 0 2 2 0 0 3 2 0 0 4 2 0 0 5
F i s c a l Y e a r s
Pe
rc
en
ta
ge
Ch
an
ge
A g r i c u l t u r e F i s h e r y
M a n u f a c t u r i n g C o n s t r u c t i o n
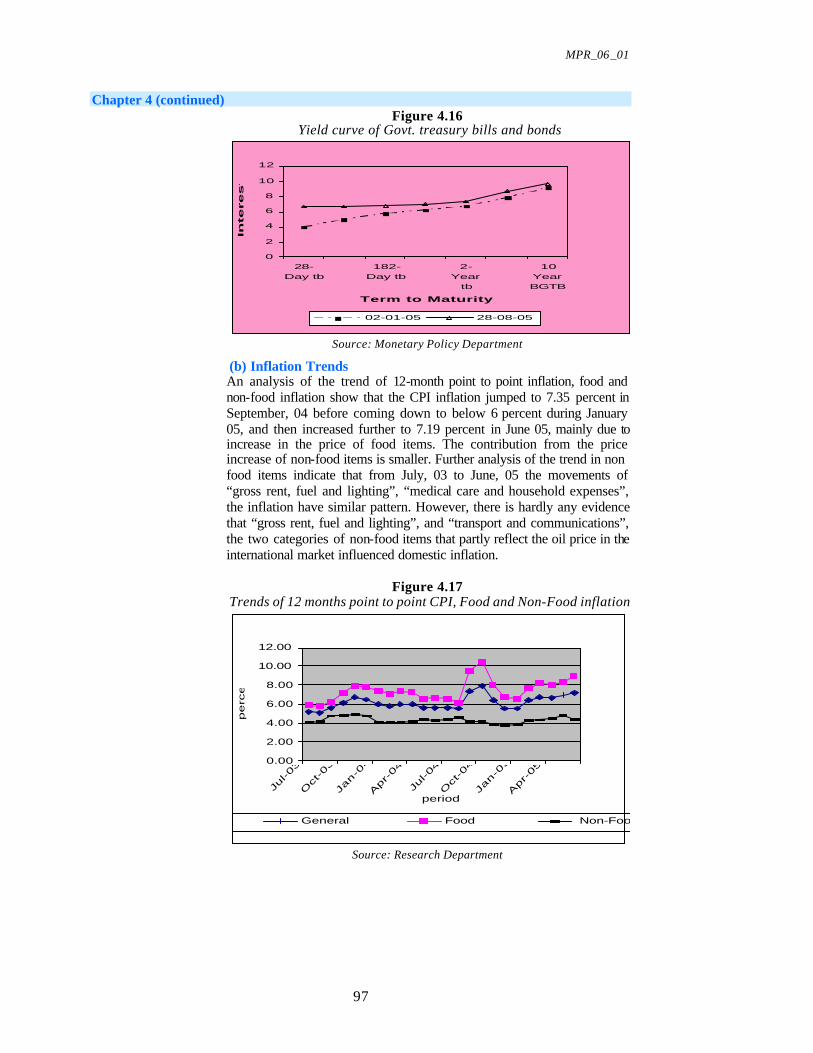
MPR_06_01
97
Chapter 4 (continued) Figure 4.16
Yield curve of Govt. treasury bills and bonds
0
2
4
6
8
10
12
28-Day tb
182-Day tb
2-Year
tb
10YearBGTB
Term to Maturity
Interest R
ate
02-01-05 28-08-05
Source: Monetary Policy Department
(b) Inflation Trends An analysis of the trend of 12-month point to point inflation, food and non-food inflation show that the CPI inflation jumped to 7.35 percent in September, 04 before coming down to below 6 percent during January 05, and then increased further to 7.19 percent in June 05, mainly due to increase in the price of food items. The contribution from the price increase of non-food items is smaller. Further analysis of the trend in non food items indicate that from July, 03 to June, 05 the movements of “gross rent, fuel and lighting”, “medical care and household expenses”, the inflation have similar pattern. However, there is hardly any evidence that “gross rent, fuel and lighting”, and “transport and communications”, the two categories of non-food items that partly reflect the oil price in the international market influenced domestic inflation.
Figure 4.17
Trends of 12 months point to point CPI, Food and Non-Food inflation
0.00
2.00
4.00
6.00
8.00
10.00
12.00
Jul-03
Oct
-03
Jan-0
4
Apr
-04
Jul-04
Oct
-04
Jan-0
5
Apr
-05
period
perc
ent
General Food Non-Food
Source: Research Department

MPR_06_01
98
Chapter 4 (continued) Figure 4.18
Trends of 12-month point to point CPI and components of Non-Food inflation
0.00
2.00
4.00
6.00
8.00
10.00
12.00
Jul-0
3
Oct-0
3
Jan-
04
Apr
-04
Jul-0
4
Oct-0
4
Jan-
05
Apr
-05
perc
ent
GeneralGross rent, fuel & lighting Medical care & H. expensesTransport & communications
Source: Research Department
(c) Labour Cost
Figure-4.19 shows the movements of Wage Rate Index (WRI) and 12-month point-to-point inflation. The growth rate of wage index broadly matches the price behaviour, though the drops in WRI in FY99 and FY03 do not appear intuitive. An increase in the wage rate, if not backed up by productivity gain or by increased external demand, may increase production cost and lead to inflation.
Figure 4.19 Trends of growth rate of wage rate Index and inflation
0.00
2.00
4.00
6.00
8.00
10.00
12.00
19
96
-97
19
97
-98
19
98
-99
19
99
-00
20
00
-01
20
01
-02
20
02
-03
20
03
-04
Perc
en
t
WRI CPI
Source: Bangladesh Economic Review2005, Ministry of Finance and
Bangladesh Bank (d) Lending Rate and Inflation
Figure-4.20 shows the movements of lending rate and inflation. It is evident from the Figure that the relationship between le nding rate and inflation is negative during the periods of 2000-01 to 2004-05. This suggests that this phase of expansionary monetary policy appear to have contributed to inflation via relative credit expansion on the demand side of the economy.

MPR_06_01
99
Chapter 4 (continued)
Figure 4.20 Trend of Lending rate and Inflation
02468
10121416
2000-01 2001-02 2002-03 2003-04 2004-05Period
Perc
ent
LR inf
Source: Economic Trends (f) Quantum Index of Manufacturing
Table-4.7 shows the quarterly and yearly growth rates of quantum Index of manufacturing (QIM) industries, index of “chemical petroleum & rubber” products and “base metal” products. The reason for constructing this table is to see whether industrial output and inflation bears any close pattern. This Table also shows the position of some components of industrial output particularly “chemical petroleum & rubber” products and “base metal” products that use oil as input. The quarterly position shows that during the first, second and third quarter of FY05 the output of these products increased substantially and so did inflation. Table 4.7
Growth in the Quantum Index of Manufacturing (QIM) Industries
QIM CPRI BMP INF FY04.Q1 4.20 - - 5.58 FY04.Q2 -8.00 -0.76 -1.57 6.50 FY04.Q3 6.70 3.93 -3.72 5.94 FY04.Q4 5.90 -2.54 9.68 5.64 FY05.Q1 6.50 4.00 1.05 7.35 FY05.Q2 -13.20 -0.38 4.44 5.50 FY05.Q3 12.60 8.62 6.03 6.72 FY05.Q4 8.80 0.53 6.91 7.19 FY02 1.70 - - 2.79 FY03 5.78 13.23 2.59 4.38 FY04 5.91 3.60 3.16 5.83 FY05 9.86 8.15 14.66 6.65
Source: Quarterly, Bangladesh Bank Note:
QIM: Quantum Index of Manufacturing Industries CPRI: Chemical, Petroleum & Rubber BMP: Basic Metal Products INF: 12 month point to point inflation
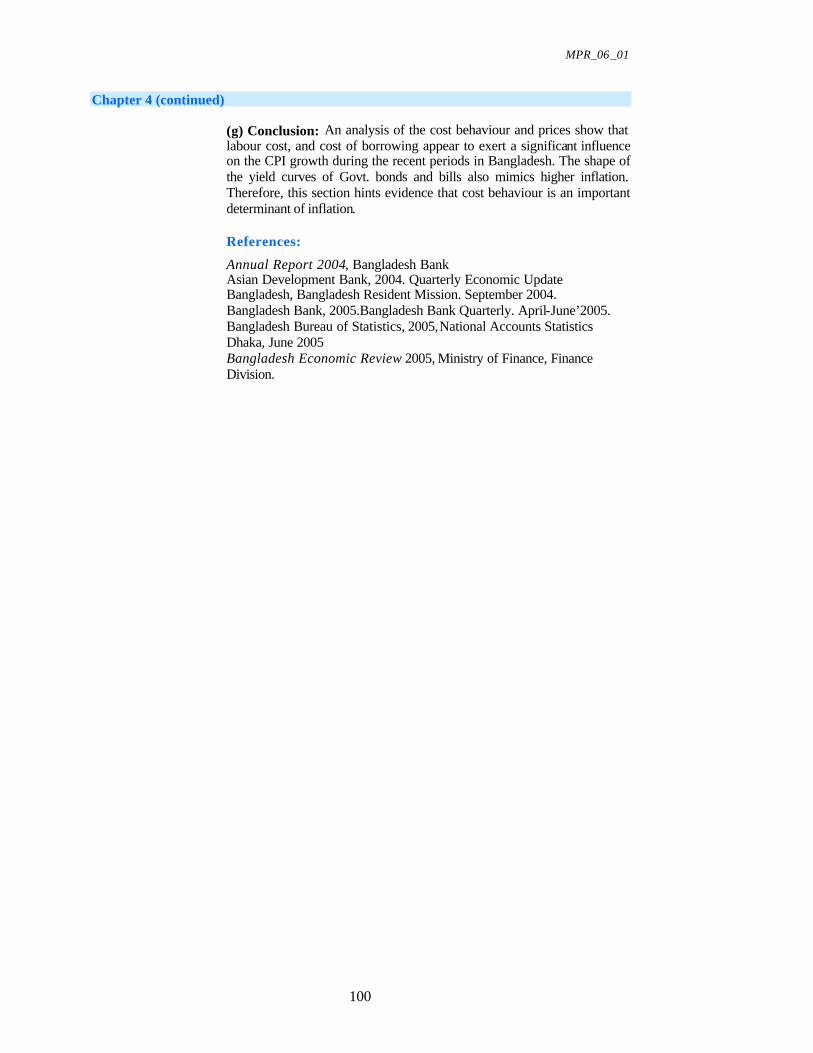
MPR_06_01
100
Chapter 4 (continued) (g) Conclusion: An analysis of the cost behaviour and prices show that labour cost, and cost of borrowing appear to exert a significant influence on the CPI growth during the recent periods in Bangladesh. The shape of the yield curves of Govt. bonds and bills also mimics higher inflation. Therefore, this section hints evidence that cost behaviour is an important determinant of inflation. References:
Annual Report 2004, Bangladesh Bank Asian Development Bank, 2004. Quarterly Economic Update Bangladesh, Bangladesh Resident Mission. September 2004. Bangladesh Bank, 2005.Bangladesh Bank Quarterly. April-June’2005. Bangladesh Bureau of Statistics, 2005, National Accounts Statistics Dhaka, June 2005 Bangladesh Economic Review 2005, Ministry of Finance, Finance Division.

MPR_06_01
101
Chapter 5 Macroeconomic Outlook for FY 0671
5.1 Domestic Demand72
The revised estimate of the real GDP growth (provisional) for FY05 has been put at 5.4 percent, which is significantly below the highest ever growth of 6.3 percent recorded in FY04. The shortfall is mainly attributed to the effects of the devastating flooding of July-September, 2004 on the agricultural output; indeed the total crop production fell by 3.3 percent in FY05 (against a positive growth of 4.3 percent in the previous fiscal year).73 The surge in the international price of oil is also believed to have contributed to the diminished GDP growth. The government’s latest revised projection of output growth for FY06 is, however, higher (6.0 percent) as discussed in the “Medium Term Macroeconomic Forecast (MTMF)” which was prepared within the context of the National Strategy for Accelerated Poverty Reduction, NSAPR (GOB, 2005).
The recent Asian Development Outlook , ADO, (ADB, 2005) however has lowered its earlier growth projection for FY06 from 6 percent to 5.5 percent on the basis of the anticipated pressures likely to be exerted by factors such as continued high oil price, weak export performance (especially on account of woven garments) together with higher import growth that may widen the already persisting current account deficit.74 Sustained high oil price is considered to be a substantial risk to domestic fiscal balance as it requires additional public borrowing and also to external balance due to the higher cost of imports.
(a) Assessment of future growth prospect in FY06
This Review’s outlook for growth projection for FY06 is somewhat higher than the ADO 2005 projection, in the range of 6.3 to 6.8 percent much in line with the MTMF expectation. This outlook for growth implies a modest rise in domestic demand which will be significantly aided by higher expected output growth in the agricultural and service sectors, and also by robust growth of remittances offsetting the deficit in trade balance. Historically, the trade balance has detracted from the GDP growth, especially during 1975-2005. The Review also takes into account the expected buoyant growth in private and public sector consumption spending, investment spending, and possible improvement in net trade. These elements are further analysed below.
(b) Prospects for Aggregate Spending: Demand-side Outlook
The initial months of the current fiscal year, FY06, shows signs of soft recovery for some important macro variables while for other variables
71 While this chapter was initially drafted by Dr. Md. Akhtaruzzaman, Dr. Md. Habibur Rahman and Md. Kabir Ahmed, it has been extensively debated within the PAU and BB, and all PAU members (including the REA) are in unanimity with the position taken here. 72 Prepared by Dr. Md. Akhtaruzzaman. 73 Note that “crops and horticulture” occupied 11.5 percent share of GDP in FY 05. 74 However, in FY06 the current account balance for the July-August period shows a smaller positive figure than in FY 05 on account of higher imports, though remittances grew by 29 percent over the corresponding period of FY05.

MPR_06_01
102
Chapter 5 (continued) the picture is far from obvious. Growth figures of exports for July- August, 2005 period showed significantly decelerated pattern in a month-to-month comparison with the preceding fiscal year while the figure of import payments (USD, C&F) for July-August period, 2005 registered a strong growth of 15.8 percent which is, however, still lower than the figure for the corresponding period of 2005 (25.1 percent). However, the commodity composition of imports appears to be moving away from consumer goods. The overall import figures for September, while very preliminary, appear to be much lower than for September last year. It is anticipated that the recent monetary policy stance will lead to a decline in the growth of imports to below the FY05 pace.
Remittance flows, which recorded a significant increase of 30.39 percent during July-August, 2005 over the corresponding period of the preceding year, are likely to be robust in FY06, both on account of technological advances and improved efforts by the formal channels to mediate transfer of funds from abroad. In comparison, the corresponding period of FY05 had only seen a 14.77 percent growth. Hence one may observe a narrowing of the current account deficit, and thus on the overall balance of payments (BOP) in FY06, and thus sustain GDP growth. The remittance growth is also expected to boost aggregate consumption in the economy.
Domestic credit recorded a strong growth of 17.7 percent during July-August, 2005 period over the preceding year which is supportive of higher import growth as well as higher investment. While looking at the growth picture of sectoral credit disbursement, agricultural credit disbursement registered a strong growth of 9.69 percent (provisional figure) during July-August in FY06 over the corresponding period of the preceding year. Given the current trend of domestic credit and also the agricultural credit disbursement growth, gross domestic investment is expected to grow steadily over the balance of FY06 both in absolute terms and as a percentage of GDP. Further, household consumption spending (private consumption) is estimated to have grown at the rate of 4.41 percent in FY05, which is consistent with the average growth trend for the period FY00-FY05. Although the growth of real wage index slowed down in FY05, but from the July-August FY06 experience, indications are that there will be a substantial growth of remittances which will outweigh any negative impact of decelerating growth of wages on private consumption spending.
Government revenue collection during the first quarter of FY06 recorded a strong growth of 14.8 percent over the corresponding period of the previous fiscal year which is very close to the yearly targeted growth rate of 16 percent. It is anticipated that the current trend will continue which would support higher public sector spending capacity as well as public outlays in gross fixed capital formation. The downside risk is additional public borrowing forced upon the government by exogenous shocks.
(c) Prospect for Sectoral Output Growth: Supply-side Outlook
Agriculture: The Medium Term Macroeconomic Forecast (MTMF) embedded in the NSAPR document expects that the buoyancy in the overall agricultural sector growth, especially aided by the crops sub-sector and the fishing and livestock sub-sectors, will experience further boost. The recent projection of the Directorate of Agricultural Extension,

MPR_06_01
103
Chapter 5 (continued) Ministry of Agricultural (MOA), GOB, indicates a very strong rebound in FY06 after a dismal record in FY05. MOA expects agricultural growth to be led by expected bumper production of cereal products (12.63 percent), and particularly strong growth for all varieties of rice (12.07 percent). The major assumptions behind the higher growth projection of cereal products including rice are the adequate rainfall recorded in the current monsoon, and also public support measures including higher public expenditure and higher credit disbursement for the agricultural sector. Statistics shows that the value of fertilizer imports recorded a phenomenal growth of more than 100 percent in FY05 over FY04 in nominal terms, though somewhat lower in real terms, which is also indicative of higher activities in the agricultural sector. Furthermore, the quantum index for domestic fertilizer output also shows steady growth which again supports the expectation of higher agricultural growth in FY06. The higher cost of diesel for irrigation during the dry season however remains a possible element of downside risk affecting the yield of the boro crops . A further issue relates to the rising domestic price of (imported) fertilizer emanating from the recent depreciation of BDT and its possible effect on agricultural production in FY06.
Based on a detailed analysis of sub-sectoral growth rates, Chapter 4 of this Review projects the overall growth for the agricultural sector to be in the 3.8 - 4.3 percent range in FY06.
Industry: Overall industrial output growth is estimated to have been 8.6 percent in FY05 which is 0.95 percentage points higher than that of FY04. This higher growth is partly due to the robust manufacturing activities in the fourth quarter of FY05. Available quantum index of industrial production (base=1988-89) shows that the large and medium size firms have recorded a growth of 9.6 percent during July-May in FY05, which is consistent with the overall industrial growth pattern. Evidently, industrial growth is intimately connected with the export potential, where of course woven and knitwear products make up nearly 80 percent of total exports. The first quarter update for exports suggest a growth in value (USD) terms of 6.1 percent. One positive sign is the growing market share of knitwear products which so far has more than offset the relative decline in the export of woven products.
The buoyant growth of gross fixed capital expenditure in the construction sector got momentum and rose to 6.5 percent in FY04 and it is likely to be somewhat higher in FY05 (7.7 percent) as shown in BBS’s figure for provisional estimates. The increasing trend of the share of clinker, steel and iron materials in total imports, which are basically the raw material inputs in the construction sector, is indicative of continuing growth momentum in this sector. Furthermore, one also observes solid growth in the quantum index of cement, iron and steel, which are again directly used as inputs in the construction sector.
Industrial credit utilisation appears to be growing at a slower pace than in FY05. However, overall private sector credit has grown by 3.43 percent during the first quarter of this fiscal year, which is actually slightly higher than the 3.25 percent growth registered in the corresponding period of FY05. A review of past behaviour indicates an element of seasonality in credit flows, which suggests a strong likelihood of faster growth later in the year. It may be noted however that while the first-

MPR_06_01
104
Chapter 5 (continued) quarter credit growth figure appears to be consistent with the revised FY06 monetary program of BB, given the high level of pubic borrowing from the banking system, concern arises about meeting the needs of the private production sectors. The issue is how to divert credit flows from the public as well as the household sector to the production sectors in agriculture, industry and services.75 The scope of the equity market is also of relevance here.
Overall taking the above considerations into account this Review would put the likely industrial growth for FY06 to lie in a range of 8.0 to 8.5 percent, which is a shade lower than the 8.6 percent figure realised in FY05, but well in excess of the average recorded over the past five years.
Services: While a good part of the service sector activities remain structured around agricultural and industrial sectors of the economy (e.g., transportation, port and warehouse services tied to foreign trade), the newer and fast-growing components appear to be quite detached from the above nexus. The latter examples would include telecommunication, computer and internet, education, financial intermediation, health care and the like. All of these sectors have grown faster than GDP over the past several years, and it is anticipated that this process will continue into FY06. Growth of investment in these sectors may be taken as indicative of future growth of the related service sub-sectors.
The expansion of the service sector share of GDP is also explained by the growth of urbanization as well as increasing activities in trade and commerce. The addition of retail space for domestic, commercial and foreign trade activities in response to buoyant demand is also indicative of continuing growth in these areas. All these developments show evidence of sustained activity in the growth points of the service sector in FY06, and collectively these units represents a major component of the service sector output.
This Review expects FY 06 service sector to build on the past year’s performance, and thus yield a growth rate of 6.5 to7.0 percent.
5.2 Net Trade76
As imports are expected to grow faster than exports, Bangladesh is likely to face trade deficit also in FY06. In fact, the first two months (July-August) of the current fiscal year compared with the corresponding period of the previous fiscal year were characterized by moderate growth (5.8 percent) in RMG exports accompanied by a modest rise in the traditional export items such as jute products, leather and leather manufactures, fish, shrimps, prawns and handicrafts. This period also experienced a marginal decline in the export of raw jute, tea, naphtha and furnace oil. Though knitwear products registered solid growth (10.6 percent), the declining trend (-0.04 percent) of woven exports conformed to the pattern first detected at the end of FY05. The total RMG exports therefore grew modestly in these two months. However, the revaluation
75 The high and unsustainable public borrowing behaviour of the recent months is cleary fuelled by the continuing high price of petroleum products as well as the delayed release of funds by the development partners, which are subject to some conditionalities. While the second of the two may well turn out to be a problem of cash-flow mismatch, the former is a structural one engendered by the current policy of the administered price regime. 76 Prepared by Dr. Md. Akhtaruzzaman and Md. Kabir Ahmed.
MPR_06_01
105
Chapter 5 (continued) of China’s currency (RMB) by 2.1 percent against USD on July 21, currency is likely to have a favourable effect on Bangladesh's RMG exports in FY 06. Indeed, the Chinese revaluation caused a depreciation of BDT by 4.93 percent against RMB, and has enabled the RMG sector to become more competitive against China, the giant rival of Bangladesh's RMG exports in the international market. The Chinese case has been further weakened by trade restrictions being enforced both by US and EU. Despite uncertainties due to the withdrawal of the quota facility under MFA and stiff global competition, growth in RMG exports, above all, is expected to remain healthy in FY06.
Growth in imports is expected to continue in FY06. The economy, during the July-August 2005 period, demonstrated such effect by experiencing robust growth (18 percent) in imports. The striking feature of this growth is that the items, which were heavily imported in FY05, were imported at even higher magnitude during the first two months of FY06. For example, food grain, POL, capital machinery, fertilizer, oil seeds, iron and steel grew by 67, 83.3, 36.5, 200, 336 and 52 percent, respectively. If weather conditions continue to be favourable, import of food grain is expected to moderate. Price of crude oil in the international market signals a downward trend, declining from D70.85 per barrel on September 4 to D59.56 per barrel on October 26, 2005.
Nonetheless, the rising domestic demand for POL may create pressure on the current account balance (as well as on the domestic fiscal balance) in FY06. High growth of capital machinery, particularly textile and garments related machinery may continue to rise in FY06 in order to enhance RMG sector’s productive capacity and possibly meet the price competitiveness via enhanced productivity. Continuity of strong domestic demand for fertilizer accompanied by low level of domestic production is likely to cause for higher import payments in FY06.
Continued fast growth in China and its haunting demand for construction material may keep the prices of iron, steel, concrete and other construction material at a lofty level throughout the current fiscal year.77 Consequently, the economy is expected to experience another year of steady import growth, possibly in the 10-12 percent range. Compared to the expected modest growth of exports (about 5 percent), trade deficit is unlikely to narrow significantly in the new fiscal year.
During FY06 Bangladesh is expected to suffer from the income account in the face of persistent outflow of investment income and interest expense on external debt stock. However, during July-August period of the current fiscal year, growth of remittances registered a record, about 39 percent higher than that of the same period in previous fiscal year. The strong growth of remittances may be due to, among other, the incentives given to non-resident Bangladeshis to take part in equity market through IPO under the NRB quota facility. However, noting that a major part of the workers’ remittances in Bangladesh flow from the Gulf States, it is expected that the recent increase in the oil price may lead to greater economic activities in these oil-producing countries resulting in both higher income growth per capita as well as increased
77 Though the international price of steel has fallen recently, the local market appears not to take any note of this.

MPR_06_01
106
Chapter 5 (continued) demand for workers from Bangladesh in the current fiscal year. Consequently, the strong growth of remittances is likely to continue throughout the new fiscal year.
Though the economy experienced a modest deficit in the current account balance in FY 05, flow data show that it continues to demonstrate surplus in current account since May’05. Since the current account balance is greatly influenced by inward remittances, strong growth in the latter is expected to narrow the deficit in FY06, even though the net trade deficit is not expected to narrow significantly vis-à-vis the FY05 level.
The World Investment Report (2005) has documented that the improved investment environment and the privatization of assets in Bangladesh contributed to higher FDI inflows in 2004, which is still well below the 1-percent mark of GDP. In terms of inward FDI potential, Bangladesh is one of the under-performing countries. Efforts must continue to attract FDI through various policy reforms, and thus improve the investment climate, which may lead to an increase in the inflow.
To sum up the outlook for aggregate demand over FY06, note that in view of strong consumer demand, stable industrial growth, and robust service sector growth, this Review expects the FY06 real GDP growth to come in at the 6.3 to 6.8 percent range (Table 5.1). The chief elements explaining this prediction include a strong rebound of agricultural output (mainly the crop sub-sector), steady RMG (particularly knitwear) exports and a robust growth of remittances allowing the trade balance to remain of manageable proportion. However, it ought to be stressed that this forward looking analysis takes for granted that the Central Bank will succeed in running an appropriate cautionary (i.e., tight) monetary policy stance in light of inflationary pressures currently at play without unduly depriving the private sector of the credit support it would need in order to meet the output target.
Table 5.1
FY06 GDP Projection
FY06 Growth Projection Range
Sector GDP Share in FY05 (%)
Average Growth
FY00-04(%)
FY05 Growth
(%) Low High
Agriculture 21.9 2.12 0.3 3.8 (0.83)*
4.3 (0.94)*
Industry 28.4 7.48 8.6 8.0 (2.27)*
8.5 (2.41)*
Services 49.7 5.72 6.6 6.5 (3.23)*
7.0 (3.48)*
Overall GDP
100.0 5.34 5.4 6.33 6.83
Source: PAU. *Numbers in the parenthesis indicate sectoral contribution to overall GDP
growth.
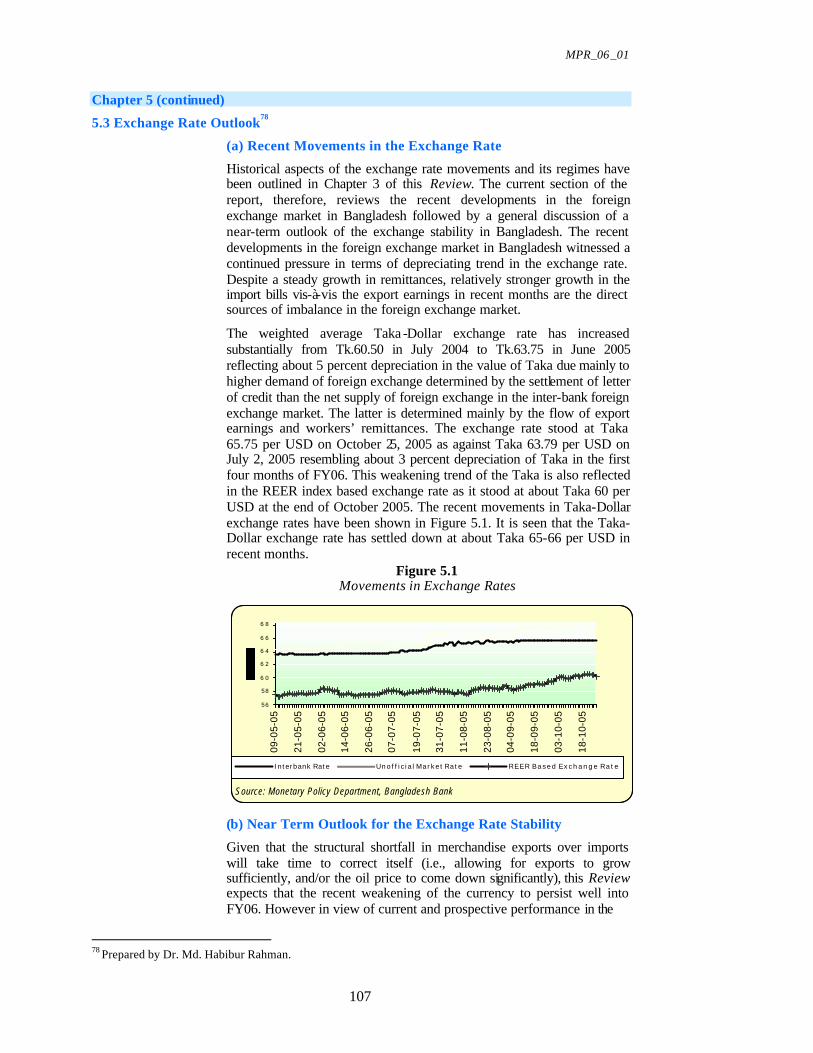
MPR_06_01
107
Chapter 5 (continued)
5.3 Exchange Rate Outlook78
(a) Recent Movements in the Exchange Rate
Historical aspects of the exchange rate movements and its regimes have been outlined in Chapter 3 of this Review. The current section of the report, therefore, reviews the recent developments in the foreign exchange market in Bangladesh followed by a general discussion of a near-term outlook of the exchange stability in Bangladesh. The recent developments in the foreign exchange market in Bangladesh witnessed a continued pressure in terms of depreciating trend in the exchange rate. Despite a steady growth in remittances, relatively stronger growth in the import bills vis-à-vis the export earnings in recent months are the direct sources of imbalance in the foreign exchange market.
The weighted average Taka -Dollar exchange rate has increased substantially from Tk.60.50 in July 2004 to Tk.63.75 in June 2005 reflecting about 5 percent depreciation in the value of Taka due mainly to higher demand of foreign exchange determined by the settlement of letter of credit than the net supply of foreign exchange in the inter-bank foreign exchange market. The latter is determined mainly by the flow of export earnings and workers’ remittances. The exchange rate stood at Taka 65.75 per USD on October 25, 2005 as against Taka 63.79 per USD on July 2, 2005 resembling about 3 percent depreciation of Taka in the first four months of FY06. This weakening trend of the Taka is also reflected in the REER index based exchange rate as it stood at about Taka 60 per USD at the end of October 2005. The recent movements in Taka-Dollar exchange rates have been shown in Figure 5.1. It is seen that the Taka-Dollar exchange rate has settled down at about Taka 65-66 per USD in recent months.
Figure 5.1 Movements in Exchange Rates
56
58
6 0
6 2
6 4
6 6
6 8
09-0
5-05
21-0
5-05
02-0
6-05
14-0
6-05
26-0
6-05
07-0
7-05
19-0
7-05
31-0
7-05
11-0
8-05
23-0
8-05
04-0
9-05
18-0
9-05
03-1
0-05
18-1
0-05
Source: Monetary Policy Department, Bangladesh Bank
Interbank Rate Uno f f i c i a l Ma r k e t R a t e R E E R B a s e d E x c h a n g e R a t e
(b) Near Term Outlook for the Exchange Rate Stability
Given that the structural shortfall in merchandise exports over imports will take time to correct itself (i.e., allowing for exports to grow sufficiently, and/or the oil price to come down significantly), this Review expects that the recent weakening of the currency to persist well into FY06. However in view of current and prospective performance in the
78 Prepared by Dr. Md. Habibur Rahman.
MPR_06_01
108
Chapter 5 (continued) leading export sectors along with the visibly healthy flow of workers’ remittances, it is anticipated that any further weakening of the currency to be both orderly and well-contained within the band of 65 to 67 (i.e., in the inter-bank US Dollar market).
5.4 Price Stability79
(a) Inflation Trend: History, 1951-2004
Historically Bangladesh experienced a more or less stable price situation during 1951-2004 with the exception of the early 1970s. Inflationary upswing first appeared in the midst of the war of independence, which began in March 1971. The inflation rate went up to about 42.8 percent during the 1971-75 period. The factors contributing to the soaring prices have been identified as the disruption of economic activity due to war and the decline of food crop production ensuing from the floods and draughts of early 1970s. After the independence, the Government of Bangladesh undertook rehabilitation and reconstruction programs for the war-ravaged economy. It led to large -scale deficit financing in 1973 through money creation.
Directed bank credit to the government owned enterprises also called for excess money supply. Reserve build-up played a key role in the expansion of money supply leading to high and unstable inflation in the early 70s. In addition to expansionary monetary policy, several other factors namely wage hike and prolonged draught also contributed to the inflation situation in Bangladesh during 1972-74. During 1976-79, the inflation rates ranged from about 2 percent to 13 percent. In 1980, however, the inflation rate rose sharply to about 19 percent in response to policy measures following the severe drought in 1979. From the early 1980s, the price level has tended to stabilize. The inflation rate hovered around 10 percent per annum until 1985. During the late 1980s, several supply shocks translated into price level instability. Floods, political unrest, and disruption of transportation and distribution network caused the inflation rate to reach about 14 percent in 1987. Oil price hike following the Iraq-Kuwait conflict in 1990-91 also contributed to a high inflation rate of about 8 percent in 1991.
The rate of inflation remained below 5 percent from 1991 to 1994. Food grains shortages and political turmoil together triggered the rate to rise above 6 percent from 1995. Although severe floods occurred in 1998-99, the country managed to escape much of an inflationary shock due to bumper crops, an efficient distribution mechanism, and, pragmatic macroeconomic policies. The inflation rates fluctuated within the 2-5 percent range during the 2000 to 2004 period. The historical trend of inflation during FY83-FY05 is depicted in Figure 5.2.
(b) Recent Behaviour of Inflation
Consumer price inflation continued to show an increasing trend during FY05. While 12-month point to point CPI inflation increased from 5.6 percent in FY04 to 7.4 percent in FY05, average inflation measured by12-month average movements in the CPI index also indicated an increase from 5.8 percent in FY04 to 6.5 percent in FY05. The 12-month point-to-point CPI as well as average inflation increased respectively to
79 Prepared by Dr. Md. Habibur Rahman.

MPR_06_01
109
Chapter 5 (continued) Figure 5.2
Inflation Rate (12-month CPI average)
0
2
4
6
8
10
12
14
16
Q1
Q2
Q3
Q4
FY83 FY84 FY85 FY86 FY87 FY88 FY89 FY90 FY91 FY92 FY93 FY94 FY95 FY96 FY97 FY98 FY99 FY00 FY01 FY02 FY03 FY04 FY05
7.7 percent and 6.7 percent in July 2005. The increase in the inflation rate was mainly due to increase in the price of food items, petroleum and other imported products. The point to point food price inflation stood at 8.7 percent in June 2005 up from 6.6 percent in June 04, and reached 9.2 percent in July 2005. The non-food prices also increased from 4.3 percent in June 04 to 5.3 percent in June 05 and reached 5.5 percent in July 2005.
On the other hand, the 12-month average food prices increased by 7.9 percent in FY05 compared with the 6.9 percent increase in FY04, while the non-food component increased at a slower rate of 4.3 percent in FY05 compared with the 4.4 percent observed in FY04. The food and non-food indices stood respectively at 8.1 percent and 4.4 percent in July 2005. The recent movements in 12-month average and point-to-point CPI inflation have been shown respectively in Figures 5.3 and 5.4.
Figure 5.3 12-Month Average CPI Inflation
0123456789
June
02
Sep
02
Dec
02
Mar
03
June
03
Sep
03
Dec
03
Mar
04
June
04
Sep
04
Dec
04
Mar
05
June
05
July
05
Perc
ent
General Food Non-food
The inflationary behaviour noted above appears to be also shared by other developing countries in the South Asia region. Available data indicates that CPI inflation in India, Pakistan, Nepal and Sri Lanka also

MPR_06_01
110
Chapter 5 (continued) accelerated during FY05. One common reason behind the price inflation in all countries of South Asia is the rise in oil price in the international market.
Figure 5.4 12-Month Point-to-Point CPI Inflation
0.00
2.00
4.00
6.00
8.00
10.00
12.00
2002
:06
2002
:09
2002
:12
2003
:03
2003
:06
2003
:09
2003
:12
2004
:03
2004
:06
2004
:09
2004
:12
2005
:03
2005
:06
Per
cent
General Food Non-food
(c) Public Borrowing and inflation: The analysis of Chapter 3 (section 4) reveals that empirically there appears to be no discernible pattern between inflation (12-month average) and government debt as a percentage of GDP in Bangladesh. While inflation has increased steadily since FY01, public borrowing from internal sources has stabilised over the same period. On the other hand external financing (as a share of GDP) has actually fallen slightly over the same time span (from about 34 to 32 percent of GDP between FY97 and FY04).
(d) Near Term Outlook for Inflation
Globally inflation in 2005 has been showing an increasing tendency due mainly to higher energy prices in the international market. In Bangladesh, inflation has been in the single digit and has remained moderate during the last several years. Direct inflationary effects of the oil price increase have been limited due to the incomplete pass-through in view of the government’s policy on administered retail price of petroleum products in the domestic market. However, increased prices of imported goods combined with the rise in import prices due to the Taka depreciation also fuelled inflationary pressures in the economy. With no major disruption in domestic production and distribution, the MTMF document cited above projects the average inflation rate in Bangladesh to be 7.5 percent in FY06.80
The thrust of the analysis contained in this Review would also lead one to project a similar figure. Note that while the 12-month point-to-point inflation in August 2005 stood at 7.93 percent, the September figure shows a moderation in the rate to 7.01 percent. This apparent encouraging development holds an explanation that does not directly meet the eye. This decline is primarily due to a sharp rise in the price level in September 2004 (following the floods), and given the higher
80 This relates to the latest revisions of the MTMF economic indicators, Bangladesh Bank, Ministry of Finance, and the Bangladesh Bureau of Statistic s.

MPR_06_01
111
Chapter 5 (continued) base this resulted in the relatively low 12-month, September to September, increase. This price behaviour appears to be independent of the actual monetary policy stance. It is of concern however that the annualized figure of the month-to-month movement in the price index (especially on a point-to-point basis) has kept its upward move; the annualized monthly inflation rate in September shot up to 19.02 from 11.03 percent in August, 2005. It is worth noting that high food price in the pre-harvest season as well as the upward adjustment in the administered energy prices were mainly responsible for the latest bout of inflationary pressure.
The continuing risk elements include the possible consequences of excess public borrowing in view of the sustained historically high oil price and delays in the disbursement of donor fund component of ADP. This Review also assesses the currency markets to remain weak for the balance of FY 06, which adds another dimension to the inflation build-up. Then there arises the spectre of rising real interest rate in the global economy (led by the US) and the associated increase in the inflationary expectations in the industrial countries, which are the source of most of Bangladesh imports (and, indeed the destination of most of the exports too, but alas this latter aspect is not much of a comfort as Bangladesh is a net importer). In the domestic scene, the possibility of another round of upward revision in the set of administered energy tariffs cannot be ruled out. On the positive side, however, in view of the bumper aman harvest, the food component of CPI is unlikely to register much further growth over the balance of FY06. Taking the above factors into account, and on the assumption that the tightened monetary policy stance will be maintained, this Review predicts that the12-month average inflation in FY06 is unlikely to exceed 7.0 percent.
References:
ADB (2005), Asian Development Outlook , ADB, Manila
GOB (2005), “Unlocking the Potential: National Strategy for Accelerated Poverty Reduction,” (NSAPR), Planning Commission (General Economic Division), Government of the People’s Republic of Bangladesh: October 2005.

MPR_06_01
112
MPR_06_01
113
Chapter 6 Monetary Policy Stance Going Forward81
6.1 Monetary Policy Stance: Historical Aspects
Monetary targeting has a long tradition and has been adopted in many developed and developing countries. Bangladesh has been practicing monetary targeting since 1972 under different policy regimes. Prior to 1990, the policy was based on direct control over various instruments, such as the volume and direction of credit and interest rates. Since the adoption of Financial Sector Reform Program in 1989, the policy stance has been gradually shifted towards indirect control. Bangladesh remained under the fixed exchange rate system until 1979. Thereafter it switched over to a pegged exchange rate system experimenting with a variety of currency baskets along the way. The policy focus here was to maintain the country’s international competitiveness and thereby strengthen the current account position and improve the exchange rate stability. With a view to embracing the market-based exchange rate system, Bangladesh entered into a floating exchange rate regime effective from May 31, 2003. This is expected to bring about adjustments in the exchange rate to changing market conditions.
The switch of the exchange rate regime from the pegged to a floating one took place in an environment of balanced economic fundamentals. Despite some concern, the transition has turned out to be smooth and the par value of currency remained relatively stable in the aftermath of the flotation in 2003. Though exchange rate stability remains an objective, with the flotation of the currency, the monetary authorities can focus more fully on price stability and output growth. Consequently, BB has made greater efforts to use indirect but market based instruments to manage liquidity and bring about a realistic structure of interest rates. In this respect the introduction of repo in 2002 and reverse repo in 2003 are noteworthy developments.
6.2 Monetary Policy Stance during FY05
Bangladesh Bank conducted its FY 05 monetary policy under challenging economic conditions emanating from adverse shocks, domestic as well as external. As a result, the focus of monetary policy in FY05 was on the need to facilitate continuing growth momentum in one hand, while containing inflationary pressures and ensure currency stability on the other. At the beginning of the FY05, Bangladesh Bank pursued an accommodative monetary policy due to additional expenditures incurred by the government to pay for oil imports as well as to rebuild following the losses caused by two consecutive floods occurring within the quarter. Another reason for the accommodating monetary policy arose from the anticipation that the country’s major exporting sector i.e., the garments sector, might experience a jolt following the expiry of MFA by end-December 2005.
Chapter 6 (continued)
81 While this chapter was initially drafted by Dr. Md. Habibur Rahman, it has been extensively debated within PAU and the Bangladesh Bank, and all PAU members (including the REA) are in unanimity with the position taken here.

MPR_06_01
114
In the backdrop of accommodative monetary policy stance, the private sector credit growth combined with agricultural credit write-off following the floods, the high world price of many importables and the depreciation of Taka against major currencies started creating inflationary pressure in the economy. Further, there was the concern over an adverse trend in the current account balance; all these factors prompted the Bangladesh Bank towards a tighter monetary policy stance from the third quarter of FY05. Consequently, the Bangladesh Bank revised the Cash Reserve Requirement (CRR) for the scheduled banks from 4 to 4.5 percent of their demand and time liabilities effective March 1, 2005, but kept the SLR at the existing level of 16 percent.
Yield on short-term treasury bills and bonds, repo and reverse repo rates were also raised substantially (typically in excess of 50 percent) to mop up excess liquidity in the money market during the second half of FY05.82 Interest yield on government securities continued to rise in recent months, consistent with a moderately tight monetary policy being pursued by the Bangladesh Bank in the face of continued high credit demand by the private sector.
6.3 Monetary Policy Stance for FY06
As the monetary and credit policy of the Bangladesh Bank is primarily responsible in maintaining price and exchange rate stability underpinning broad based economic growth, monetary policy stance for FY06 must take due cognizance of several factors. First, one has to monitor the recent developments in money as well as foreign exchange markets which remained under pressure both from the increasing trend in the CPI inflation and the depreciating trend in the exchange rates. However, the recent energy saving strategies announced by the government (both a modest increase in the domestic energy prices as well as the curtailment of the work-week to 5 days) is expected to moderate the effects of high international oil price on public borrowing as well as on inflation. The same policy measures will exert a moderating influence on the exchange rate pressures too. Second, the outlook for real GDP growth in FY06 as envisioned in the Medium Term Macroeconomic Framework (MTMF) of the NSAPR document is higher than those of the recent years, and indeed this Review predicts that the real GDP growth in FY06 to come in somewhere in the vicinity of 6.5 percent (i.e., within the band of 6.3 to 6.8 percent). This level of growth is on the high side given the recent record, and will require adequate credit and capital market support to be feasible. Finally, the policy stance has to focus on the level of foreign exchange reserves build-up (determining the net foreign assets) and to monitor the expansion of private sector credit which is programmed to grow slower than in the immediate past.83
Chapter 6 (continued)
82 While the 28-day T-bill yield stood at 4.04 percent in December ’04, by June ’05 it had gone up by more than 50 percent to 6.6 percent. Correspondingly the reverse repo (1-2 day) rate rose from 2.53 percent in December ’04 to 4.50 percent in March ’05, and remained at about the same level to the end of the fiscal year. For the repo (1-2 day) auction, the rate rose from 4.5 percent in Nov ‘04 to 9.86 percent in Jan ’05, but had settled back to 8.0 percent in June ’05. 83 The revised monetary program sets the private sector credit growth at 13.9 percent in FY06 and 13.1 percent in FY07, GOB (2005).

MPR_06_01
115
How should the Bangladesh Bank fashion the monetary policy stance so that all these objectives may be achieved in a harmonious manner? The requirements of the fast pace of expected growth will have to be met without jeopardising the monetary stability (both the price level as well as the exchange rate). Thus credit must flow to the growth points of the economy.
While the SLR and CRR have been raised to 18 and 5 percent, respectively, with effect from October 1, 2005 in order to tame the inflationary pressures, in view of persisting inflationary pressures further measures would appear afoot.84 While the Bangladesh Bank has a good record in tracking the excess liquidity in the banking system on a daily basis via the open market as well as repo/reverse repo operations, additional steps may well be warranted at this juncture as financial system appears to be continuously characterised by excess liquidity.85 In this context, the SLR would appear to be too low.86 Given that the Islamic banking sector currently enjoys a lower SLR requirement of 10 percent, there appears to be room for rationalisation there too. Ensuring that the SLR continues to be at a prudent level would also add to the public perception of the soundness of the banking system.
In the recent history of the money markets in Bangladesh increases in the repo/reverse repo rates have not quite led to lock-step increases in the schedule of deposit and borrowing rates in the banking system.87 The deposit behaviour may be somewhat non-responsive to the market rates, since a lot of saving is done in the form of various government (including the postal savings) issued bonds which typically offer (high) non-market yields. The lack of secondary trading in these securities also works to distance this market from the deposit behaviour with the commercial banking system. In any event, attention needs to be given to the environment conducive to the continued availability of deposits for on-lending.
Even though the interest rate structure appears not to affect the investment behaviour in a significant way, higher borrowing costs will squeeze the operating margins, and hence affect future production plans. Here again the balance is tight; banks have to offer positive real return in the long run and also cover their intermediation costs in setting the lending rates. Given that the deposit-lending margin at the foreign banks is wider than for other segments, the remainder of the banking system has a large leeway to improve their operational efficiency and add to the market share. The Central Bank has a role to play here too insofar as it undertakes the treasury functions on behalf of the GOB in marketing the latter’s debt and bills. It can provide guidance as well as mediation so that the eventual rate structure on government bonds remains close to
Chapter 6 (continued) 84 As already noted in Chapter 5, the rise in the monthly CPI figures (on a point-to-point basis) has been at the annualized rate of 19.02 percent in September up from 11.03 percent in August, 2005. 85 Indeed the average level of excess liquidity appears to have steadily risen between FY01 to FY04 from about 25 to about 40 percent over the required level. 86 The relevant Indian figure has been at 25 percent for sometime. Although one may point out that the NPL figure there is much lower than in Bangladesh especially for NCBs, but then these are also the banks that are generally in greater need to enforce a disciplined asset structure. 87 While the short term repo/reverse rates moved up in excess of 50 percent over the last two quarters of FY05, the deposit and lending rates structure (for each segment of the market, i.e., NCBs, PCBs etc) remained totally unaffected over the same period.

MPR_06_01
116
the relevant risk-adjusted market rates of a comparable maturity. This latter task would be largely irrelevant were there a fully functioning bond market in public and private debt.
Given the above factors, the monetary policy stance for FY06 will have to be consistent with the monetary program; the broad money growth is projected to slow down to the rate of 14.3 percent in FY06 (and 13.4 percent in FY07) to bring about a reduction in inflation.88 These money growth figures are sharply lower than the broad money growth in FY 05 that stood at 16.1 percent. Correspondingly private sector credit flow has been programmed to grow at 13.9 percent in FY06 while it had grown at 17.0 percent in FY05. The provisional figures for the first quarter indicate high growth of public borrowing (at an annualized rate of 25.0 percent as against the modest growth of 13.72 percent in private sector credit). Hence, in order not to squeeze the production sector borrowing requirements unduly, growth of public borrowing would require careful monitoring.89 Insofar as the latter is propelled by the cost of imported petroleum and other energy products, the structure of administered prices would requite further rationalisation during FY06. There would appear to be persuasive arguments in favour of aligning the latter prices with those prevailing in the border states of India, which will prevent smuggling and thus put a stop to the this source of drain on the treasury.90
Taking the above factors into account, and on the assumption that the tightened monetary policy stance will be maintained, this Review predicts that the12-month average inflation in FY06 is unlikely to exceed 7.0 percent, which is largely consistent with the MTMF projections. It therefore recommends that the Bangladesh Bank remains vigilant as to the necessity of further monetary measures and be prepared to seek additional coordinating fiscal stance as may be warranted by developments in the monetary and the real sectors of the economy. The overall goal will be to contain inflationary expectations, maintain currency stability and ensure smooth credit flows to the growth points in the productive sectors of the economy in support of the targeted real output growth.
References:
Bangladesh Bank (2005), Major Economic Indicators: Monthly Updates, Monetary Policy Department, various issues.
GOB (2005), “Unlocking the Potential: National Strategy for Accelerated Poverty Reduction,” (NSAPR), Planning Commission (General Economic Division), Government of the People’s Republic of Bangladesh: October 2005.
88 This relates to the latest revisions of the monetary program compatible with the MTMF. 89 Given the current trend, the revenue goals can be expected to be realised thus allowing the planned revenue budget expenditure to be feasible within the borrowing target specified in the budget for FY06. 90 If the high diesel price were to be a deterrent for irrigation, it may be prudent to devise a scheme of cash subsidies to the affected growers. The latter scheme can be made self-financed via a careful design of the pricing-cum-subsidy program.

MPR_06_01
117
Appendix: Press Release
Policy Analysis Unit Bangladesh Bank
Monetary Policy Review
December 11, 2005
Background: The recently established Policy Analysis Unit (PAU) of the Bangladesh Bank is pleased to announce the launching of the Monetary Policy Review (MPR). The MPR is designed to present a brief but comprehensive view of the real and monetary developments during the immediate past several quarters, and project the expected developments in the immediate future. The present volume being the first of the series is somewhat lengthy because it incorporates a historical update of macroeconomic developments obtaining in the country over the recent past and it also deals in detail with sectors other than the financial sector. The future volumes to be published on a bi-annual basis (in October and April of each calendar year) will be shorter and in concise form incorporating the situation of the relevant period.
Monetary Policy Strategy: This being the first issue, the Monetary Policy Review has attempted to articulate the monetary policy framework (in terms of the goals, the instruments, and the analytic channels of transmission) for greater clarity and transparency benefiting both the policy makers as well as the stakeholders.
The appropriate monetary policy strategy in the Bangladesh context is to achieve the goals of (a) price stability, (b) sustained and stable output growth. While these goals overlap and there is a need for policy coordination in order to attain the goals, monetary policy must play its due role.
Growth Outlook: In view of strong consumer demand, agricultural growth, stable industrial growth, robust service sector growth, and the steady growth of remittances offsetting the deficit in the trade balance, this Review expects the FY06 real GDP growth to come in at the 6.3 to 6.8 percent range. However, it ought to be stressed that this forward looking analysis assumes a stable and predictable import regime (including the petroleum price behaviour), a stable exchange rate regime, adequate private sector credit flows, and the continuation of an appropriate cautionary (i.e., tight) monetary policy stance in light of inflationary pressures currently at play.
Sectoral Growth Outlook: Based on a detailed analysis of sub-sectoral growth rates, Chapter 4 of this Review projects the overall growth for the agricultural sector to be in the 3.8 - 4.3 percent range in FY06, the principal contribution coming from the crop sub-sector. It also suggests that the likely industrial growth for FY06 would lie in a range of 8.0 to 8.5 percent, which is a shade lower than the 8.6 percent figure realised in FY05, but well in excess of the average recorded over the past five years. Further, this Review expects FY06 service sector to build on the past year’s performance, and yield a growth rate of 6.5 to7.0 percent. These secoral growth projects are consistent with the overall growth predicted for FY06.
Inflation Outlook: On top of the risk elements cited above, there is the spectre of rising real interest rate in the global economy (led by the US) and the associated increase in the inflationary expectations in the industrial countries, the source of most of our imports. In the domestic scene, the possibility of another round of upward revision in the set of administered energy tariffs cannot be ruled out. On the positive side, however, in view of the bumper aman harvest, the food component of CPI is unlikely to register much further growth over the balance of FY06. Taking the above factors into account, and on the assumption that the

MPR_06_01
118
tightened monetary policy stance will be maintained, this Review predicts that the12-month average inflation in FY06 is unlikely to exceed 7.0 percent.
Policy Stance: In view of the persistent inflationary pressure, this Review recommends that the Bangladesh Bank remains vigilant as to the necessity of further monetary measures and be prepared to seek additional coordinating fiscal stance as may be warranted by developments in the monetary and the real sectors of the economy. The overall goal will be to contain inflationary expectations, maintain currency stability and ensure smooth credit flows to the growth points in the productive sectors of the economy in support of the targeted real output growth.
Note: The entire document as well as an Executive Summary can be downloaded from the BB sites as follows:
(a) Full Report http:// www.bangladesh-bank.org/research/pau/mpr_06_01 or, www.bangladeshbank.org.bd/research/pau/mpr_06_01
(b) Executive Summary http://www.bangladeshbank.org/research/pau/mpr/summary_06_01 or, www.bangladeshbank.org.bd/research/pau/mpr/summary_06_01