monetarytrends - federal reserve bank of st. louis 2003 monetarytrends views expressed do not...
TRANSCRIPT

December 2003
MonetaryTrends
Views expressed do not necessarily reflect official positions of the Federal Reserve System.
Does the TIPS SpreadOvershoot?
When making monetary policy decisions, the FederalReserve looks to financial markets for information aboutthe state of the economy and their expectations of monetarypolicy actions. For instance, the difference in yields betweennominal and inflation-indexed Treasury securities—theTIPS spread—tells the Federal Reserve about the averagerate of CPI-U inflation the markets expect for the time tomaturity of these securities. (CPI-U is the consumer priceindex for all urban consumers.) Similarly, the federal fundsfutures market offers the Federal Reserve a reading of themarkets’ expectations about the path of the federal fundsrate over the next few months. Clearly, through communi-cation, the Federal Reserve tries to offer the markets someguidance about its intentions. Yet, decisions on monetarypolicy actions are not finalized before the Federal OpenMarket Committee (FOMC) actually meets. It is thusalmost inevitable that, on occasion, the Federal Reservewill surprise the markets.
It is interesting to know how the TIPS spread—themarkets’ gauge of the expected rate of inflation—respondsto surprises in monetary policy actions and whether theseresponses are sensible in magnitude. The chart plots, forthe period January 1999 through September 2003, surprisesin monetary policy actions against changes in the TIPSspread. Surprises in monetary policy actions—that is, inthe federal funds rate target—are measured by the pricechange of near-expiration federal funds futures contractson days of scheduled FOMC meetings and on days ofunscheduled, intermeeting monetary policy actions. Theregression line in the chart, which was generated using atechnique that is robust to outliers, is downward sloping.This suggests that monetary policy actions influence mar-ket participants as follows: tighter-(easier)-than-expectedactions lead market participants to expect a lower (higher)average rate of inflation over the next 10 years, as reflectedin the TIPS spread. (The author confirmed the statisticalsignificance of this finding in a more comprehensive regres-sion approach and for alternative measures of the TIPSspread.)
Are changes in inflation expectations after monetarypolicy surprises of similar size as actual changes in therate of inflation? To answer this question we compareupdates of the rate of expected inflation with updates ofthe actual rate of inflation. For every month during theperiod January 1999 through September 2003, we measurethe logarithmic change in the average rate of inflation overthe previous 10 years and the logarithmic change in theconstant-maturity 10-year TIPS spread. Changes in theTIPS spread—and thus measured inflation expectations—are well aligned with actual changes in the rate of inflationwhen updates of the markets’ forecast of the future averagerate of inflation and updates of the past average rate ofinflation are of similar size. In fact, we find that the sumof the absolute values of logarithmic changes of theexpected rate of inflation is 7.4 times the sum of actuallogarithmic changes in the 10-year average rate of inflation.It seems then that inflation expectations, at least as judgedby the yield spread between nominal and inflation-indexedTreasury securities, tend to overshoot.
—Frank A. Schmid
Available on the web at research.stlouisfed.org
–0.4 –0.3 –0.2 –0.1 0.0 0.1
–0.10
–0.05
0.00
0.05
Ch
an
ge
in E
xpe
cte
d R
ate
of
Infla
tion
(P
erc
en
tag
e P
oin
ts)
Surprise Monetary Policy Action (Percentage Points)
NOTE: The surprise component of the FOMC decision on thefederal funds target rate is measured by the price change in the respective month’s federal funds futures contract, adjusted for the number of calendar days remaining for the month. If the FOMC policy action happened within the last seven days of the month, the price change of next month’s federal funds futures contract was used.

Contents
Page
3 Monetary and Financial Indicators at a Glance
4 Monetary Aggregates and Their Components
6 Monetary Aggregates: Monthly Growth
7 Reserves Markets and Short-Term Credit Flows
8 Measures of Expected Inflation
9 Interest Rates
10 Policy-Based Inflation Indicators
11 Implied Forward Rates, Futures Contracts, and Inflation-Indexed Securities
12 Velocity, Gross Domestic Product, and M2
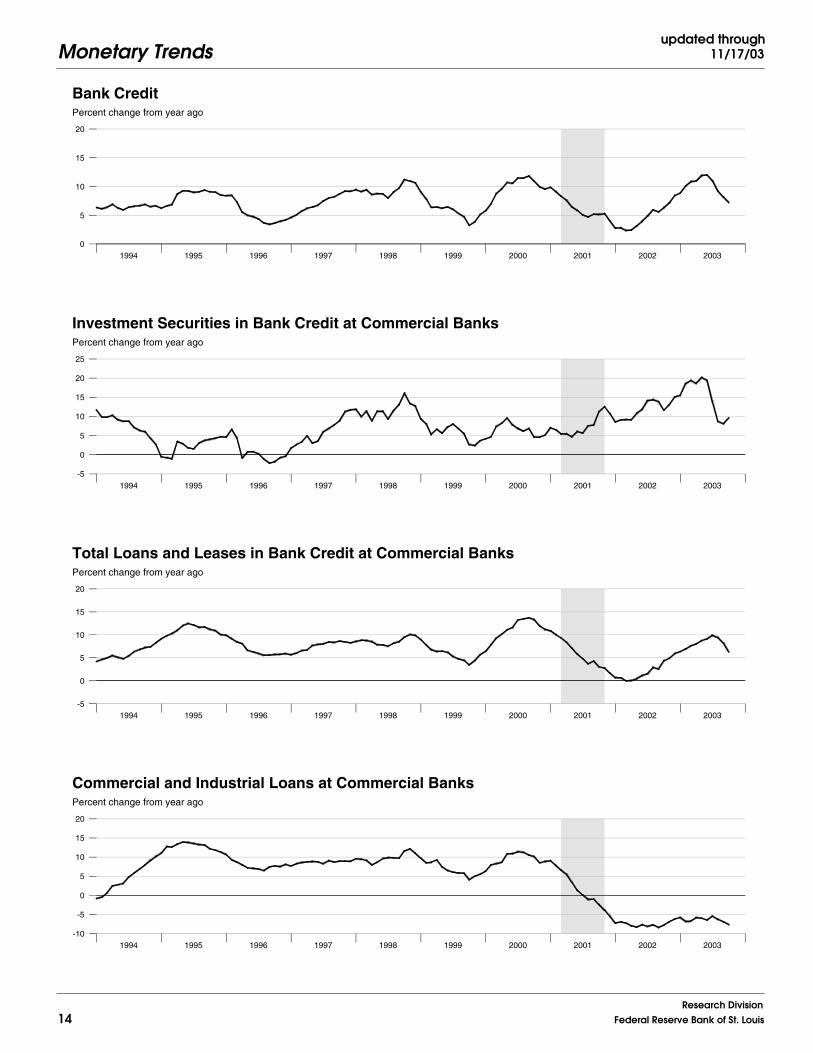
14 Bank Credit
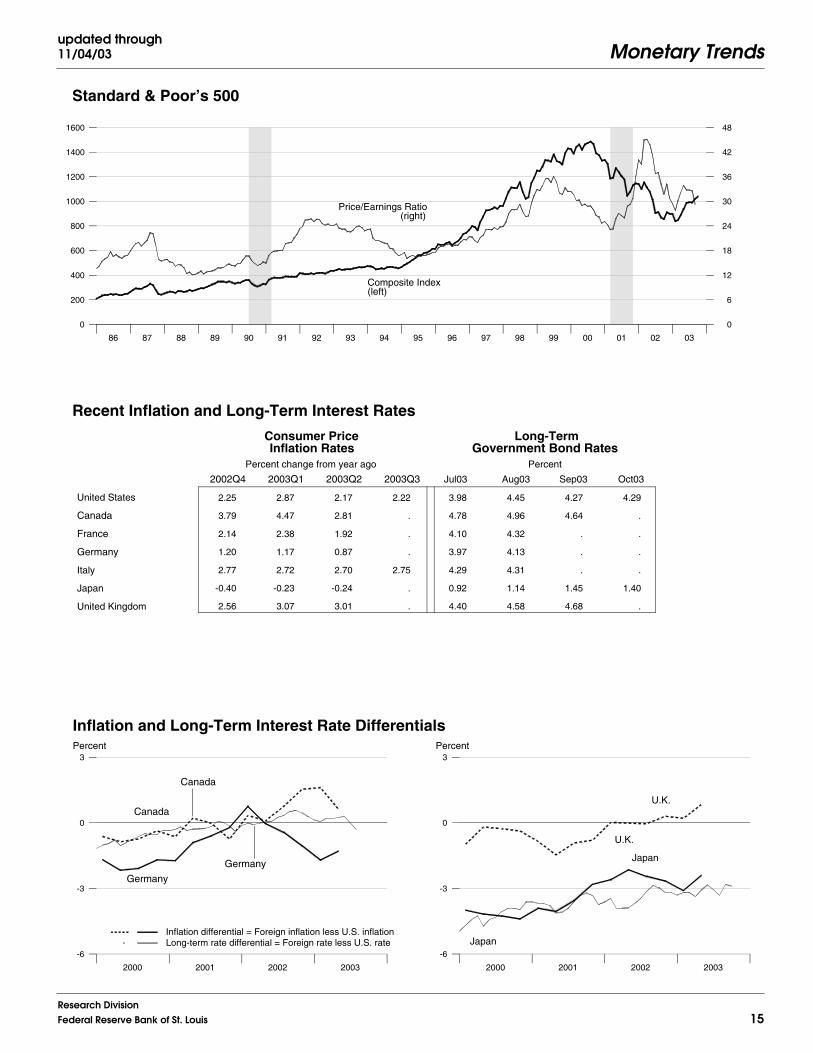
15 Stock Market Index and Foreign Inflation and Interest Rates
16 Reference Tables
18 Definitions, Notes, and Sources
Conventions used in this publication:
1. Unless otherwise indicated, data are monthly.
2. Shaded areas indicate recessions, as determined by the National Bureau of Economic Research.
3. Percent change at an annual rate is the simple, not compounded, monthly percent change multiplied by 12. Forexample, using consecutive months, the percent change at an annual rate in x between month t –1 and the currentmonth t is: [(xt /xt – 1)–1] × 1200. Note that this differs from National Economic Trends. In that publication, monthlypercent changes are compounded and expressed as annual growth rates.
4. The percent change from year ago refers to the percent change from the same period in the previous year. For example,the percent change from year ago in x between month t –12 and the current month t is: [(xt /xt – 12)–1] × 100.
We welcome your comments addressed to:
Editor, Monetary TrendsResearch DivisionFederal Reserve Bank of St. LouisP.O. Box 442St. Louis, MO 63166-0442
or to:
Monetary Trends is published monthly by the Research Division of the Federal Reserve Bank of St. Louis. Single-copy subscriptions are available free of charge by writing to the PublicAffairs Department, Federal Reserve Bank of St. Louis, P.O. Box 442, St. Louis, MO 63166-0442 or by calling (314) 444-8809. Subscription forms may also be completed online atresearch.stlouisfed.org/order/pubform.php. For more information on data in this publication, please visit research.stlouisfed.org/fred2 or call (314) 444-8590. The entire publication is alsoavailable on the Internet at research.stlouisfed.org/publications/mt.
Beginning this issue, 10-year and 30-year inflation-indexed government bond yields for France are included on page 11.

2000 2001 2002 2003 2000 2001 2002 2003
2000 2001 2002 20033m 1y 2y 3y 5y 7y 10y
2000 2001 2002 2003
Federal Funds Rate 1.03 1.01 1.01
Prime Rate 4.00 4.00 4.00
Primary Credit Rate 2.00 2.00 2.00
Conventional Mortgage Rate 6.26 6.15 5.95
. . .
Treasury Yields . . .
3-Month Constant Maturity 0.97 0.96 0.94
6-Month Constant Maturity 1.05 1.03 1.02
1-Year Constant Maturity 1.31 1.24 1.25
3-Year Constant Maturity 2.44 2.23 2.26
5-Year Constant Maturity 3.37 3.18 3.19
10-Year Constant Maturity 4.45 4.27 4.29
Billions of dollars
M2
MZM
M2 and MZM
4150
4400
4650
4900
5150
5400
5650
5900
6150
6400
6650
2000 2001 2002 2003 2004
Percent
Reserve Market Rates
0.50
1.00
1.50
2.00
2.50
3.00
3.50
4.00
4.50
5.00
5.50
6.00
6.50
7.00
2000 2001 2002 2003 2004
Percent change at an annual rate
Adjusted Monetary Base
-40
-30
-20
-10
0
10
20
30
40
50
2000 2001 2002 2003 2004
Percent
Treasury Yield Curve
0.5
1.0
1.5
2.0
2.5
3.0
3.5
4.0
4.5
5.0
5.5
6.0
Percent change at an annual rate
Total Bank Credit
-10
0
10
20
30
40
50
2000 2001 2002 2003 2004
Aug 03 Sep 03 Oct 03
Treasury Yields:
Interest Rates
Monetary Trendsupdated through11/17/03
3Research DivisionFederal Reserve Bank of St. Louis
Effective Federal Funds RateIntended Federal Funds Rate
Discount Rate
Primary Credit Rate
Week Ending:
11/14/0310/17/0311/15/02

86 87 88 89 90 91 92 93 94 95 96 97 98 99 00 01 02 03
86 87 88 89 90 91 92 93 94 95 96 97 98 99 00 01 02 03
86 87 88 89 90 91 92 93 94 95 96 97 98 99 00 01 02 03
86 87 88 89 90 91 92 93 94 95 96 97 98 99 00 01 02 03
Percent change from year ago
MZM
M1
MZM and M1
-10
-5
0
5
10
15
20
25
1986 1987 1988 1989 1990 1991 1992 1993 1994 1995 1996 1997 1998 1999 2000 2001 2002 2003 2004
Percent change from year ago
M2
-5
0
5
10
15
1986 1987 1988 1989 1990 1991 1992 1993 1994 1995 1996 1997 1998 1999 2000 2001 2002 2003 2004
Percent change from year ago
M3
-5
0
5
10
15
1986 1987 1988 1989 1990 1991 1992 1993 1994 1995 1996 1997 1998 1999 2000 2001 2002 2003 2004
Percent change from year ago
Monetary Services Index - M2
-5
0
5
10
15
1986 1987 1988 1989 1990 1991 1992 1993 1994 1995 1996 1997 1998 1999 2000 2001 2002 2003 2004
Monetary Trendsupdated through
11/17/03
4Research Division
Federal Reserve Bank of St. Louis
86 87 88 89 90 91 92 93 94 95 96 97 98 99 00 01 02 03
1996 1997 1998 1999 2000 2001 2002 2003 2000 2001 2002 2003
2000 2001 2002 2003 2000 2001 2002 2003
2000 2001 2002 2003 2000 2001 2002 2003
Percent change from year ago
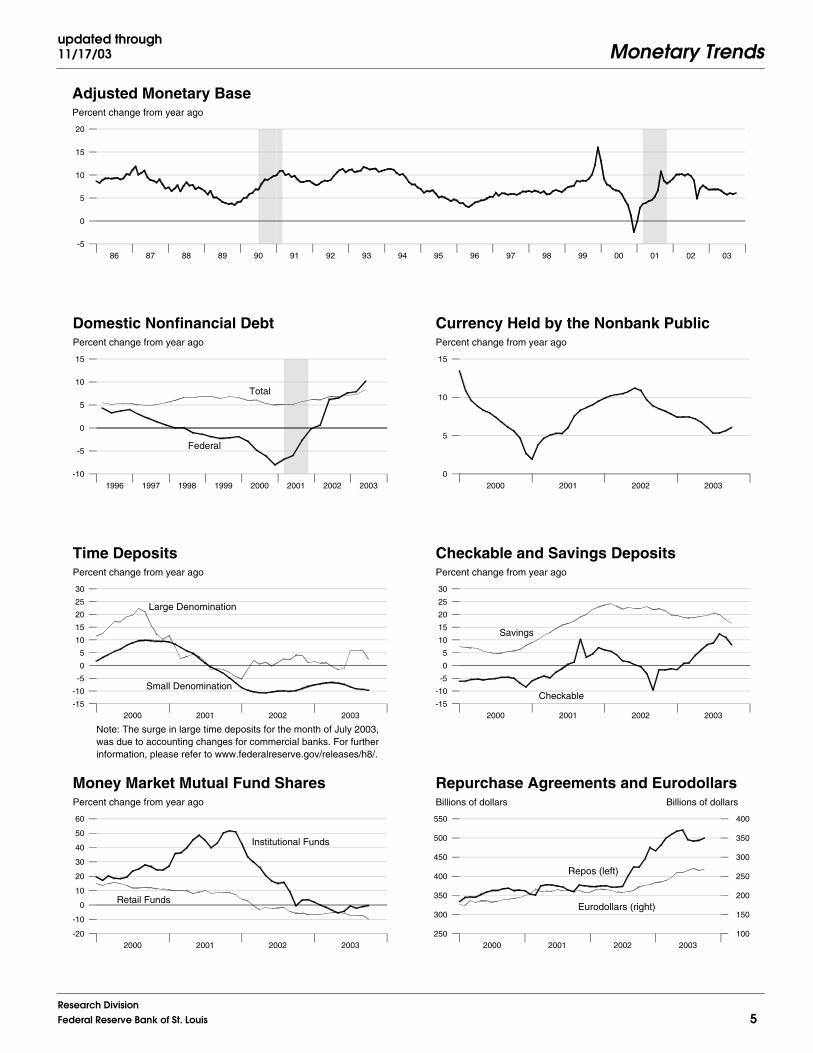
Adjusted Monetary Base
-5
0
5
10
15
20
1986 1987 1988 1989 1990 1991 1992 1993 1994 1995 1996 1997 1998 1999 2000 2001 2002 2003 2004
Percent change from year ago
Total
Federal
Domestic Nonfinancial Debt
-10
-5
0
5
10
15
1996 1997 1998 1999 2000 2001 2002 2003 2004
Percent change from year ago
Currency Held by the Nonbank Public
0
5
10
15
2000 2001 2002 2003 2004
Percent change from year ago
Large Denomination
Small Denomination
Time Deposits
Note: The surge in large time deposits for the month of July 2003, was due to accounting changes for commercial banks. For further information, please refer to www.federalreserve.gov/releases/h8/.
-15
-10
-5
0
5
10
15
20
25
30
2000 2001 2002 2003 2004
Percent change from year ago
Checkable
Savings
Checkable and Savings Deposits
-15
-10
-5
0
5
10
15
20
25
30
2000 2001 2002 2003 2004
Percent change from year ago
Institutional Funds
Retail Funds
Money Market Mutual Fund Shares
-20
-10
0
10
20
30
40
50
60
2000 2001 2002 2003 2004
Billions of dollars Billions of dollars
Eurodollars (right)
Repos (left)
Repurchase Agreements and Eurodollars
250
300
350
400
450
500
550
100
150
200
250
300
350
400
Monetary Trendsupdated through11/17/03
5Research DivisionFederal Reserve Bank of St. Louis
86 87 88 89 90 91 92 93 94 95 96 97 98 99 00 01 02 03
86 87 88 89 90 91 92 93 94 95 96 97 98 99 00 01 02 03
86 87 88 89 90 91 92 93 94 95 96 97 98 99 00 01 02 03
86 87 88 89 90 91 92 93 94 95 96 97 98 99 00 01 02 03
Percent change at an annual rate
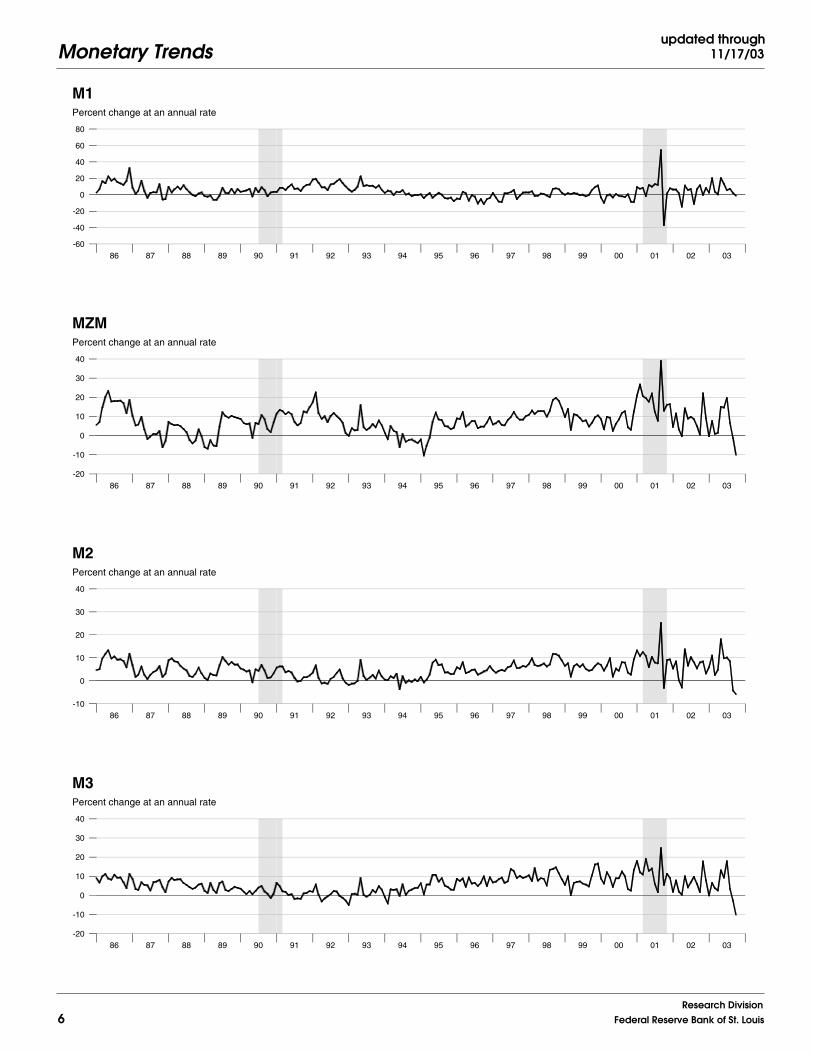
M1
-60
-40
-20
0
20
40
60
80
1986 1987 1988 1989 1990 1991 1992 1993 1994 1995 1996 1997 1998 1999 2000 2001 2002 2003 2004
Percent change at an annual rate
MZM
-20
-10
0
10
20
30
40
1986 1987 1988 1989 1990 1991 1992 1993 1994 1995 1996 1997 1998 1999 2000 2001 2002 2003 2004
Percent change at an annual rate
M2
-10
0
10
20
30
40
1986 1987 1988 1989 1990 1991 1992 1993 1994 1995 1996 1997 1998 1999 2000 2001 2002 2003 2004
Percent change at an annual rate
M3
-20
-10
0
10
20
30
40
1986 1987 1988 1989 1990 1991 1992 1993 1994 1995 1996 1997 1998 1999 2000 2001 2002 2003 2004
Monetary Trendsupdated through
11/17/03
6Research Division
Federal Reserve Bank of St. Louis

86 87 88 89 90 91 92 93 94 95 96 97 98 99 00 01 02 03
1996 1997 1998 1999 2000 2001 2002 2003 1996 1997 1998 1999 2000 2001 2002 2003
86 87 88 89 90 91 92 93 94 95 96 97 98 99 00 01 02 03
86 87 88 89 90 91 92 93 94 95 96 97 98 99 00 01 02 03
Billions of dollars
Adjusted
Required
Adjusted and Required Reserves
0
20
40
60
80
100
120
1986 1987 1988 1989 1990 1991 1992 1993 1994 1995 1996 1997 1998 1999 2000 2001 2002 2003 2004
Billions of dollars
Total Borrowings, nsa
0.0
0.5
1.0
1.5
2.0
2.5
3.0
3.5
1996 1997 1998 1999 2000 2001 2002 2003 2004
Billions of dollars
Excess Reserves plus RCB Contracts
4
8
12
16
20
24
28
1996 1997 1998 1999 2000 2001 2002 2003 2004
Percent change from year ago
Nonfinancial Commercial Paper
-40
-20
0
20
40
60
1986 1987 1988 1989 1990 1991 1992 1993 1994 1995 1996 1997 1998 1999 2000 2001 2002 2003 2004
Percent change from year ago
Consumer Credit
-10
-5
0
5
10
15
20
1986 1987 1988 1989 1990 1991 1992 1993 1994 1995 1996 1997 1998 1999 2000 2001 2002 2003 2004
Monetary Trendsupdated through11/17/03
7Research DivisionFederal Reserve Bank of St. Louis

86 87 88 89 90 91 92 93 94 95 96 97 98 99 00 01 02 03 04
86 87 88 89 90 91 92 93 94 95 96 97 98 99 00 01 02 03
86 87 88 89 90 91 92 93 94 95 96 97 98 99 00 01 02 03
University of Michigan
Humphrey-Hawkins CPI Inflation Range
Federal Reserve Bank of Philadelphia
CPI Inflation
Percent
Inflation and Inflation Expectations
The shaded region shows the Humphrey-Hawkins CPI inflation range. Beginning in January 2000, the Humphrey-Hawkins inflation range was reportedusing the PCE price index and therefore is not shown on this graph. See notes on page 19.
0
2
4
6
8
10
Yield to maturity
10-Year less 3-Month T-Bill
3-Year less 3-Month T-Bill10-Year less 3-Year T-Bill
Treasury Security Yield Spreads
-2
0
2
4
6
1986 1987 1988 1989 1990 1991 1992 1993 1994 1995 1996 1997 1998 1999 2000 2001 2002 2003 2004
Percent, Real rate = Nominal rate less CPI inflation
Federal Funds Rate
1-Year Treasury Yield
Real Interest Rates
-2
0
2
4
6
8
1986 1987 1988 1989 1990 1991 1992 1993 1994 1995 1996 1997 1998 1999 2000 2001 2002 2003 2004
Monetary Trendsupdated through
11/18/03
8Research Division
Federal Reserve Bank of St. Louis
86 87 88 89 90 91 92 93 94 95 96 97 98 99 00 01 02 03
86 87 88 89 90 91 92 93 94 95 96 97 98 99 00 01 02 03
2000 2001 2002 2003 2000 2001 2002 2003
86 87 88 89 90 91 92 93 94 95 96 97 98 99 00 01 02 03
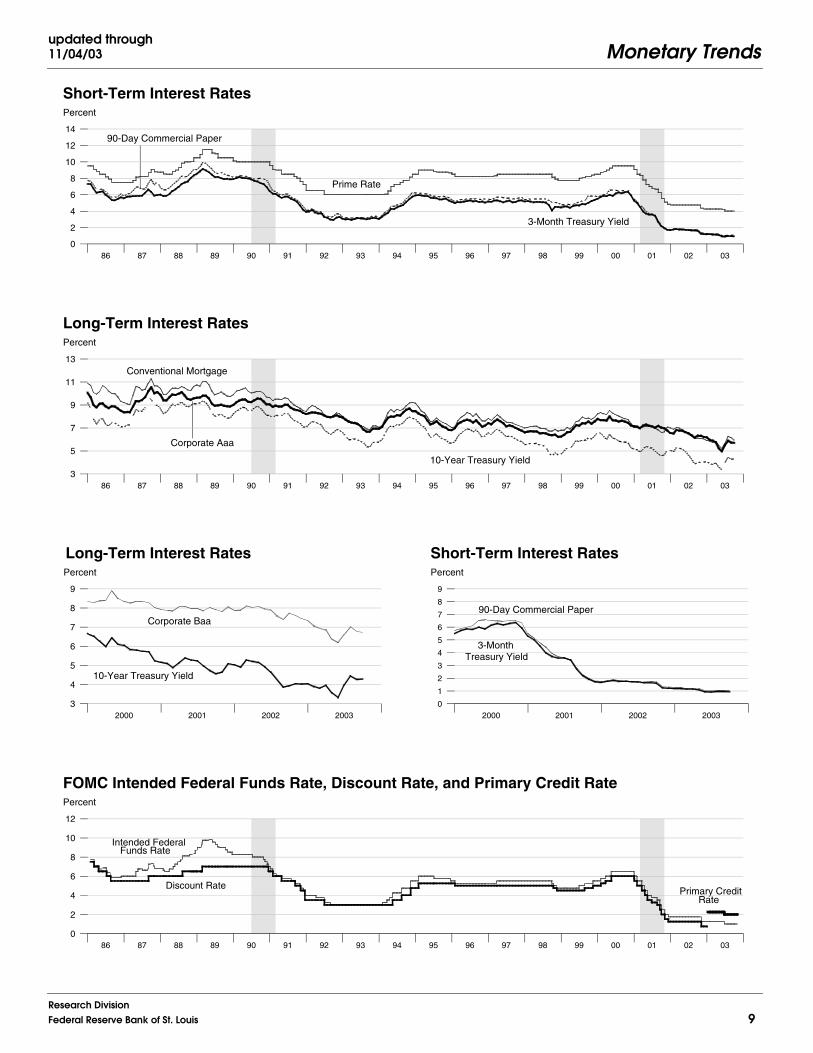
Percent
3-Month Treasury Yield
90-Day Commercial Paper
Prime Rate
Short-Term Interest Rates
0
2
4
6
8
10
12
14
1986 1987 1988 1989 1990 1991 1992 1993 1994 1995 1996 1997 1998 1999 2000 2001 2002 2003 2004
Percent
Conventional Mortgage
Corporate Aaa
10-Year Treasury Yield
Long-Term Interest Rates
3
5
7
9
11
13
1986 1987 1988 1989 1990 1991 1992 1993 1994 1995 1996 1997 1998 1999 2000 2001 2002 2003 2004
Long-Term Interest RatesPercent
Corporate Baa
10-Year Treasury Yield
3
4
5
6
7
8
9
2000 2001 2002 2003 2004
Percent
90-Day Commercial Paper
3-Month Treasury Yield
Short-Term Interest Rates
0
1
2
3
4
5
6
7
8
9
2000 2001 2002 2003 2004
Percent
Discount Rate
Intended Federal Funds Rate
Primary Credit Rate
FOMC Intended Federal Funds Rate, Discount Rate, and Primary Credit Rate
0
2
4
6
8
10
12
1986 1987 1988 1989 1990 1991 1992 1993 1994 1995 1996 1997 1998 1999 2000 2001 2002 2003 2004
Monetary Trendsupdated through11/04/03
9Research DivisionFederal Reserve Bank of St. Louis

1994 1995 1996 1997 1998 1999 2000 2001 2002 2003
1994 1995 1996 1997 1998 1999 2000 2001 2002 2003 1994 1995 1996 1997 1998 1999 2000 2001 2002 2003
1994 1995 1996 1997 1998 1999 2000 2001 2002 2003
1994 1995 1996 1997 1998 1999 2000 2001 2002 2003 1994 1995 1996 1997 1998 1999 2000 2001 2002 2003
Percent
Actual
Target Inflation Rates4% 3% 2% 1% 0%
Federal Funds Rate and Inflation Targets
Calculated federal funds rate is based on Taylor’s rule. See notes on page 19.
0
3
6
9
12
1994 1995 1996 1997 1998 1999 2000 2001 2002 2003 2004
Billions of chain-weighted 1996 dollars
Potential
Actual
Actual and Potential Real GDP
Components of Taylor’s Rule
7000
7500
8000
8500
9000
9500
10000
1994 1995 1996 1997 1998 1999 2000 2001 2002 2003 2004
Percent change from year ago
PCE Inflation and Projections
The shaded region shows the range of projections published in theMonetary Policy Report to the Congress.
0
1
2
3
4
5
6
1994 1995 1996 1997 1998 1999 2000 2001 2002 2003 2004
Percent
Actual
Target Inflation Rates 0% 1% 2% 3% 4%
Monetary Base Growth* and Inflation Targets
*Modified for the effects of sweeps programs on reserve demand.Calculated base growth is based on McCallum’s rule. Actual base growth is percent change from year ago. See notes on page 19.
0
3
6
9
12
94 95 96 97 98 99 00 01 02 03 04
Percent
4-YearMoving Average
1-YearMoving Average
Monetary Base Velocity Growth
Components of McCallum’s Rule
-8
-4
0
4
8
94 95 96 97 98 99 00 01 02 03 04
Percent
10-YearMoving Average
1-YearMoving Average
Real Output Growth
-4
0
4
8
94 95 96 97 98 99 00 01 02 03 04
Monetary Trendsupdated through
11/17/03
10Research Division
Federal Reserve Bank of St. Louis

2y 3y 5y 7y 10y
1999 2000 2001 2002 2003 1999 2000 2001 2002 2003
1999 2000 2001 2002 2003 1999 2000 2001 2002 2003
Percent
Implied One-Year Forward Rates
0
2
4
6
8
Percent, daily data
Jan 2004 Dec 2003
Nov 2003
|||||||
Rates on 3-Month Eurodollar Futures
1.1
1.2
1.3
1.4
09/15 09/22 09/29 10/06 10/13 10/20 10/27 11/03 11/10 11/17
Percent, daily data
Jan 2004
Dec 2003Nov 2003
Rates on SelectedFederal Funds Futures Contracts
|||||||
0.9
1
1.1
09/15 09/22 09/29 10/06 10/13 10/20 10/27 11/03 11/10 11/17
Percent
11/14/200310/17/2003
09/12/2003
Rates on Federal Funds Futureson Selected Dates
Contract Month
0.9
1.0
1.1
1.2
Nov Dec Jan Feb Mar Apr
Percent, weekly data
30-Year
10-Year
Inflation-Indexed Treasury Bonds
1.5
2
2.5
3
3.5
4
4.5
5
1999 2000 2001 2002 2003 2004
Percent, weekly data
30-Year
10-Year
Inflation-Indexed Treasury Yield Spreads
0
1
2
3
4
1999 2000 2001 2002 2003 2004
Percent, weekly data
Canada
U.K.
U.S.
France
Inflation-Indexed 30-Year Government Bonds
|||
1
2
3
4
5
01/01/1999 01/01/2000 01/01/2001 01/01/2002 01/01/2003 01/01/2004
Percent, weekly data
U.K.
U.S.
France
Inflation-Indexed 10-Year Government Bonds
1
2
3
4
5
01/01/1999 01/01/2000 01/01/2001 01/01/2002 01/01/2003 01/01/2004
Monetary Trendsupdated through11/18/03
11Research DivisionFederal Reserve Bank of St. Louis
Week Ending:
11/14/0310/17/0311/15/02
3.00
2.75
2.50
2.25
2.00
1.75
1.50
86 87 88 89 90 91 92 93 94 95 96 97 98 99 00 01 02 03
86 87 88 89 90 91 92 93 94 95 96 97 98 99 00 01 02 03
3.50
3.00
2.50
2.00
1.50
2.25
2.00
1.75
1.50
1.25
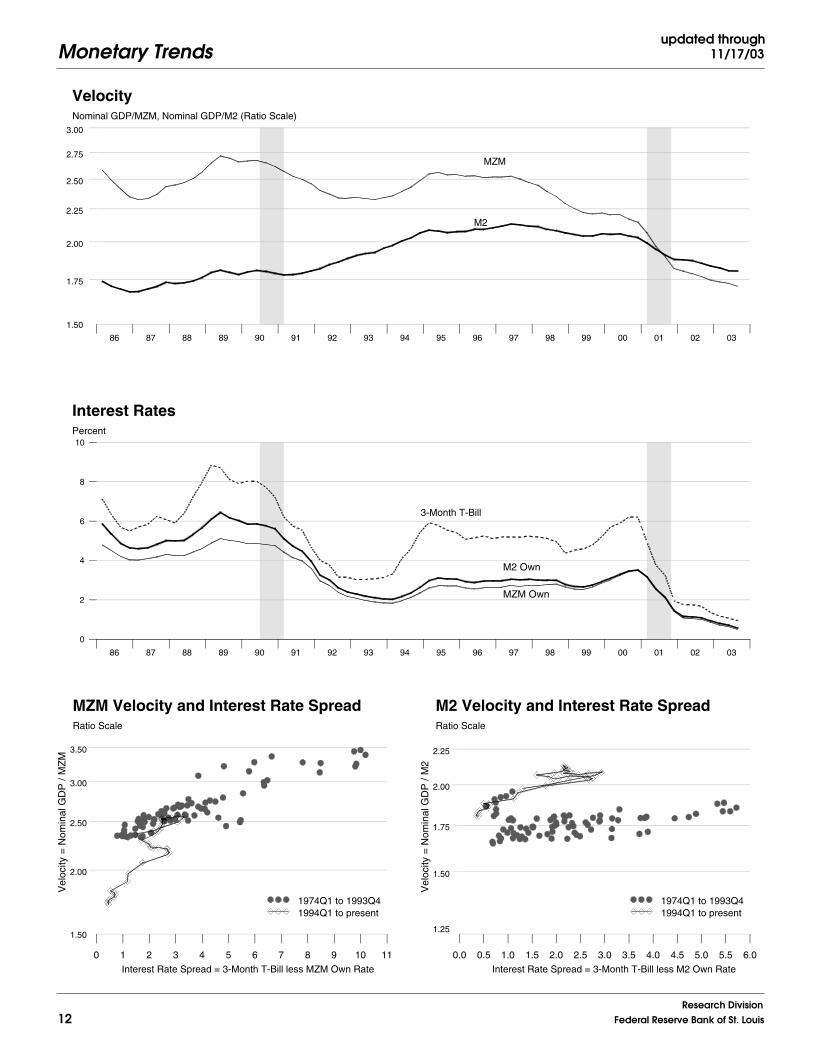
Nominal GDP/MZM, Nominal GDP/M2 (Ratio Scale)
MZM
M2
Velocity
9497 9862 10227 10593 10958 11323 11688 12054 12419 12784 13149 13515 13880 14245 14610 14976 15341 15706 16071
Percent
MZM Own
M2 Own
3-Month T-Bill
Interest Rates
0
2
4
6
8
10
9497 9862 10227 10593 10958 11323 11688 12054 12419 12784 13149 13515 13880 14245 14610 14976 15341 15706 16071
Vel
ocity
= N
omin
al G
DP
/ M
ZM
Ratio Scale
Interest Rate Spread = 3-Month T-Bill less MZM Own Rate
MZM Velocity and Interest Rate Spread
1974Q1 to 1993Q41994Q1 to present
0 1 2 3 4 5 6 7 8 9 10 11
Ratio Scale
Vel
ocity
= N
omin
al G
DP
/ M
2
Interest Rate Spread = 3-Month T-Bill less M2 Own Rate
M2 Velocity and Interest Rate Spread
1974Q1 to 1993Q41994Q1 to present
0.0 0.5 1.0 1.5 2.0 2.5 3.0 3.5 4.0 4.5 5.0 5.5 6.0
Monetary Trendsupdated through
11/17/03
12Research Division
Federal Reserve Bank of St. Louis

86 87 88 89 90 91 92 93 94 95 96 97 98 99 00 01 02 03
86 87 88 89 90 91 92 93 94 95 96 97 98 99 00 01 02 03
86 87 88 89 90 91 92 93 94 95 96 97 98 99 00 01 02 03
86 87 88 89 90 91 92 93 94 95 96 97 98 99 00 01 02 03
Percent change from year ago
Gross Domestic Product
Dashed lines indicate 10-year moving averages.
0
5
10
15
20
1986 1987 1988 1989 1990 1991 1992 1993 1994 1995 1996 1997 1998 1999 2000 2001 2002 2003 2004
Percent change from year ago
Real Gross Domestic Product
Dashed lines indicate 10-year moving averages.
-5
0
5
10
15
1986 1987 1988 1989 1990 1991 1992 1993 1994 1995 1996 1997 1998 1999 2000 2001 2002 2003 2004
Percent change from year ago
Gross Domestic Product Price Index
Dashed lines indicate 10-year moving averages.
0
5
10
15
20
1986 1987 1988 1989 1990 1991 1992 1993 1994 1995 1996 1997 1998 1999 2000 2001 2002 2003 2004
Percent change from year ago
M2
Dashed lines indicate 10-year moving averages.
0
5
10
15
20
1986 1987 1988 1989 1990 1991 1992 1993 1994 1995 1996 1997 1998 1999 2000 2001 2002 2003 2004
Monetary Trendsupdated through11/17/03
13Research DivisionFederal Reserve Bank of St. Louis
1994 1995 1996 1997 1998 1999 2000 2001 2002 2003
1994 1995 1996 1997 1998 1999 2000 2001 2002 2003
1994 1995 1996 1997 1998 1999 2000 2001 2002 2003
1994 1995 1996 1997 1998 1999 2000 2001 2002 2003
Percent change from year ago
Bank Credit
0
5
10
15
20
1994 1995 1996 1997 1998 1999 2000 2001 2002 2003 2004
Percent change from year ago
Investment Securities in Bank Credit at Commercial Banks
-5
0
5
10
15
20
25
1994 1995 1996 1997 1998 1999 2000 2001 2002 2003 2004
Percent change from year ago
Total Loans and Leases in Bank Credit at Commercial Banks
-5
0
5
10
15
20
1994 1995 1996 1997 1998 1999 2000 2001 2002 2003 2004
Percent change from year ago
Commercial and Industrial Loans at Commercial Banks
-10
-5
0
5
10
15
20
1994 1995 1996 1997 1998 1999 2000 2001 2002 2003 2004
Monetary Trendsupdated through
11/17/03
14Research Division
Federal Reserve Bank of St. Louis
86 87 88 89 90 91 92 93 94 95 96 97 98 99 00 01 02 03
2.25 2.87 2.17 2.22 3.98 4.45 4.27 4.29
3.79 4.47 2.81 . 4.78 4.96 4.64 .
2.14 2.38 1.92 . 4.10 4.32 . .
1.20 1.17 0.87 . 3.97 4.13 . .
2.77 2.72 2.70 2.75 4.29 4.31 . .
-0.40 -0.23 -0.24 . 0.92 1.14 1.45 1.40
2.56 3.07 3.01 . 4.40 4.58 4.68 .
2000 2001 2002 2003 2000 2001 2002 2003
Composite Index(left)
Price/Earnings Ratio(right)
Standard & Poor’s 500
0
200
400
600
800
1000
1200
1400
1600
0
6
12
18
24
30
36
42
48
Recent Inflation and Long-Term Interest Rates
Percent change from year ago Percent
Consumer PriceInflation Rates
Long-TermGovernment Bond Rates
United States
Canada
France
Germany
Italy
Japan
United Kingdom
2002Q4 2003Q1 2003Q2 2003Q3 Jul03 Aug03 Sep03 Oct03
Percent
Germany
Canada
Germany
Canada
Inflation differential = Foreign inflation less U.S. inflationLong-term rate differential = Foreign rate less U.S. rate
Inflation and Long-Term Interest Rate Differentials
-6
-3
0
3
14610 14976 15341 15706 16071
Percent
U.K.
U.K.
Japan
Japan
-6
-3
0
3
14610 14976 15341 15706 16071
Monetary Trendsupdated through11/04/03
15Research DivisionFederal Reserve Bank of St. Louis

1998. 1079.870 3709.650 4207.963 5749.858 4323.060 525.184 84.060 241.559
1999. 1101.495 4170.202 4525.937 6252.564 4575.872 574.181 88.664 257.905
2000. 1103.401 4507.769 4801.347 6841.181 5024.634 607.106 84.511 272.528
2001. 1136.611 5219.013 5221.918 7621.029 5342.672 641.167 85.931 296.260
2002. 1190.219 5886.055 5619.340 8229.864 5591.762 697.071 87.924 319.376
2001 1 1100.135 4855.491 5032.889 7275.980 5269.357 619.676 82.207 285.335
. 2 1116.115 5107.306 5160.151 7543.074 5310.771 629.484 82.722 292.821
. 3 1162.814 5327.181 5291.578 7725.858 5360.470 651.930 90.906 300.511
. 4 1167.377 5586.073 5403.055 7939.203 5430.091 663.578 87.887 306.373
2002 1 1183.762 5723.809 5494.301 8054.798 5408.607 680.264 88.157 311.581
. 2 1181.589 5809.724 5546.132 8137.171 5478.965 692.937 86.979 315.236
. 3 1190.469 5944.730 5668.793 8282.900 5652.919 702.753 86.820 322.269
. 4 1205.056 6065.955 5768.133 8444.589 5826.557 712.330 89.741 328.417
2003 1 1227.800 6158.533 5859.847 8562.316 5945.490 726.820 90.930 334.329
. 2 1255.955 6259.221 5984.808 8699.226 6115.741 738.230 91.800 341.932
. 3 1283.878 6460.387 6119.163 8915.350 6186.935 744.031 94.535 349.883
2001 Oct 1163.909 5511.453 5362.163 7869.673 5413.005 663.798 91.551 304.237
. Nov 1165.335 5585.259 5402.576 7943.600 5445.128 661.381 86.229 306.400
. Dec 1172.887 5661.508 5444.426 8004.336 5432.139 665.556 85.880 308.483
2002 Jan 1179.038 5682.466 5468.464 8015.988 5406.026 673.713 87.296 310.002
. Feb 1185.171 5736.941 5506.767 8067.665 5413.644 681.914 89.238 312.211
. Mar 1187.077 5752.020 5507.673 8080.741 5406.150 685.165 87.936 312.531
. Apr 1172.605 5750.150 5494.321 8082.845 5431.428 689.008 88.352 312.452
. May 1183.278 5818.160 5556.930 8150.116 5480.304 692.736 86.588 315.710
. Jun 1188.883 5860.862 5587.144 8178.551 5525.163 697.068 85.998 317.546
. Jul 1195.728 5908.530 5635.021 8224.726 5578.078 701.032 86.100 320.046
. Aug 1184.451 5950.530 5672.873 8291.246 5660.325 702.878 86.382 322.454
. Sep 1191.228 5975.129 5698.486 8332.727 5720.354 704.350 87.978 324.306
. Oct 1202.609 5977.579 5736.382 8344.143 5755.413 710.664 89.827 326.548
. Nov 1202.180 6087.291 5776.373 8467.070 5834.020 712.472 89.818 328.846
. Dec 1210.378 6132.996 5791.643 8522.553 5890.239 713.853 89.579 329.856
2003 Jan 1212.991 6130.904 5820.466 8522.414 5884.084 719.528 89.511 331.939
. Feb 1233.421 6170.179 5873.415 8568.984 5961.001 728.657 91.909 335.086
. Mar 1236.989 6174.517 5885.659 8595.550 5991.385 732.276 91.371 335.963
. Apr 1237.371 6182.109 5909.264 8614.188 6025.831 736.488 92.367 337.809
. May 1258.304 6259.687 5998.222 8708.079 6133.060 738.668 91.471 342.511
. Jun 1272.189 6335.868 6046.939 8775.410 6188.332 739.535 91.562 345.475
. Jul 1277.993 6439.198 6097.780 8905.594 6192.845 741.244 93.479 348.640
. Aug 1285.743 6474.566 6140.721 8930.762 6180.426 745.293 95.372 351.061
. Sep 1287.897 6467.397 6118.987 8909.693 6187.533 745.557 94.755 349.949
. Oct 1286.751 6413.424 6089.157 8835.401 6171.244 753.731 95.033 349.167
Money Stock
M1 MZM M2 M3
Bank
Credit
Adjusted
Monetary Base Reserves MSI M2
*All values are given in billions of dollars.
Monetary Trendsupdated through
11/17/03
16Research Division
Federal Reserve Bank of St. Louis

1998. 5.35 4.92 . 8.35 5.47 4.91 5.14 5.26 6.53 4.93 6.94
1999. 4.97 4.62 . 7.99 5.33 4.78 5.49 5.64 7.04 5.28 7.43
2000. 6.24 5.73 . 9.23 6.46 6.00 6.22 6.03 7.62 5.58 8.06
2001. 3.89 3.41 . 6.92 3.69 3.47 4.08 5.02 7.08 5.01 6.97
2002. 1.67 1.17 . 4.68 1.73 1.63 3.10 4.61 6.49 4.87 6.54
2001 1 5.59 5.11 . 8.62 5.26 4.95 4.64 5.05 7.08 5.03 7.01
. 2 4.33 3.83 . 7.34 4.10 3.75 4.43 5.27 7.22 5.11 7.13
. 3 3.50 3.06 . 6.57 3.34 3.24 3.93 4.98 7.11 4.95 6.97
. 4 2.13 1.64 . 5.16 2.06 1.94 3.33 4.77 6.92 4.97 6.78
2002 1 1.73 1.25 . 4.75 1.82 1.76 3.75 5.08 6.62 5.02 6.97
. 2 1.75 1.25 . 4.75 1.83 1.75 3.77 5.10 6.71 5.01 6.81
. 3 1.74 1.25 . 4.75 1.76 1.67 2.62 4.26 6.35 4.72 6.29
. 4 1.44 0.94 . 4.45 1.49 1.36 2.27 4.01 6.28 4.71 6.08
2003 1 1.25 . 2.25 4.25 1.26 1.18 2.07 3.92 6.00 4.60 5.83
. 2 1.25 . 2.23 4.24 1.17 1.06 1.77 3.62 5.31 4.28 5.51
. 3 1.02 . 2.00 4.00 1.07 0.95 2.20 4.23 5.70 4.68 6.01
2001 Oct 2.49 2.02 . 5.53 2.31 2.20 3.14 4.57 7.03 4.89 6.62
. Nov 2.09 1.58 . 5.10 2.03 1.91 3.22 4.65 6.97 4.85 6.66
. Dec 1.82 1.33 . 4.84 1.83 1.72 3.62 5.09 6.77 5.18 7.07
2002 Jan 1.73 1.25 . 4.75 1.74 1.68 3.56 5.04 6.55 5.05 7.00
. Feb 1.74 1.25 . 4.75 1.82 1.76 3.55 4.91 6.51 4.93 6.89
. Mar 1.73 1.25 . 4.75 1.91 1.83 4.14 5.28 6.81 5.09 7.01
. Apr 1.75 1.25 . 4.75 1.87 1.75 4.01 5.21 6.76 5.09 6.99
. May 1.75 1.25 . 4.75 1.82 1.76 3.80 5.16 6.75 5.03 6.81
. Jun 1.75 1.25 . 4.75 1.81 1.73 3.49 4.93 6.63 4.92 6.65
. Jul 1.73 1.25 . 4.75 1.79 1.71 3.01 4.65 6.53 4.81 6.49
. Aug 1.74 1.25 . 4.75 1.73 1.65 2.52 4.26 6.37 4.78 6.29
. Sep 1.75 1.25 . 4.75 1.76 1.66 2.32 3.87 6.15 4.58 6.09
. Oct 1.75 1.25 . 4.75 1.73 1.61 2.25 3.94 6.32 4.66 6.11
. Nov 1.34 0.83 . 4.35 1.39 1.25 2.32 4.05 6.31 4.77 6.07
. Dec 1.24 0.75 . 4.25 1.34 1.21 2.23 4.03 6.21 4.70 6.05
2003 Jan 1.24 . . 4.25 1.29 1.19 2.18 4.05 6.17 4.72 5.92
. Feb 1.26 . 2.25 4.25 1.27 1.19 2.05 3.90 5.95 4.57 5.84
. Mar 1.25 . 2.25 4.25 1.23 1.15 1.98 3.81 5.89 4.51 5.75
. Apr 1.26 . 2.25 4.25 1.24 1.15 2.06 3.96 5.74 4.60 5.81
. May 1.26 . 2.25 4.25 1.22 1.09 1.75 3.57 5.22 4.16 5.48
. Jun 1.22 . 2.20 4.22 1.04 0.94 1.51 3.33 4.97 4.07 5.23
. Jul 1.01 . 2.00 4.00 1.05 0.92 1.93 3.98 5.49 4.59 5.63
. Aug 1.03 . 2.00 4.00 1.08 0.97 2.44 4.45 5.88 4.82 6.26
. Sep 1.01 . 2.00 4.00 1.08 0.96 2.23 4.27 5.72 4.63 6.15
. Oct 1.01 . 2.00 4.00 1.10 0.94 2.26 4.29 5.70 4.64 5.95
Federal
Funds
Discount
Rate
Primary
Credit Rate
Prime
Rate
3-mo
CDs
Treasury Yields
3-mo 3-yr 10-yr
Corporate
Aaa Bonds
S & L
Aaa Bonds
Conventional
Mortgage
*All values are given as a percent at an annual rate.
Monetary Trendsupdated through11/17/03
17Research DivisionFederal Reserve Bank of St. Louis

1998. 0.99 11.66 7.29 10.35
1999. 2.00 12.41 7.56 8.74
2000. 0.17 8.09 6.09 9.41
2001. 3.01 15.78 8.76 11.40
2002. 4.72 12.78 7.61 7.99
2001 1 2.71 18.60 10.64 13.23
. 2 5.81 20.74 10.11 14.68
. 3 16.74 17.22 10.19 9.69
. 4 1.57 19.44 8.43 11.05
2002 1 5.61 9.86 6.76 5.82
. 2 -0.73 6.00 3.77 4.09
. 3 3.01 9.30 8.85 7.16
. 4 4.90 8.16 7.01 7.81
2003 1 7.55 6.10 6.36 5.58
. 2 9.17 6.54 8.53 6.40
. 3 8.89 12.86 8.98 9.94
2001 Oct -37.27 12.94 -3.15 5.36
. Nov 1.47 16.07 9.04 11.27
. Dec 7.78 16.38 9.30 9.18
2002 Jan 6.29 4.44 5.30 1.75
. Feb 6.24 11.50 8.41 7.74
. Mar 1.93 3.15 0.20 1.94
. Apr -14.63 -0.39 -2.91 0.31
. May 10.92 14.19 13.67 9.99
. Jun 5.68 8.81 6.52 4.19
. Jul 6.91 9.76 10.28 6.78
. Aug -11.32 8.53 8.06 9.71
. Sep 6.87 4.96 5.42 6.00
. Oct 11.46 0.49 7.98 1.64
. Nov -0.43 22.02 8.37 17.68
. Dec 8.18 9.01 3.17 7.86
2003 Jan 2.59 -0.41 5.97 -0.02
. Feb 20.21 7.69 10.92 6.56
. Mar 3.47 0.84 2.50 3.72
. Apr 0.37 1.48 4.81 2.60
. May 20.30 15.06 18.06 13.08
. Jun 13.24 14.60 9.75 9.28
. Jul 5.47 19.57 10.09 17.80
. Aug 7.28 6.59 8.45 3.39
. Sep 2.01 -1.33 -4.25 -2.83
. Oct -1.07 -10.01 -5.85 -10.01
Percent change at an annual rate
M1 MZM M2 M3
Monetary Trendsupdated through
11/17/03
18Research Division
Federal Reserve Bank of St. Louis
Definitions M1: The sum of currency held outside the vaults of depository institutions,Federal Reserve Banks, and the U.S. Treasury; travelers checks; and demandand other checkable deposits issued by financial institutions (except demanddeposits due to the Treasury and depository institutions), minus cash items inprocess of collection and Federal Reserve float.
MZM: M2 minus small-denomination time deposits, plus institutional moneymarket mutual funds. The label MZM was coined by William Poole (1991)for this aggregate, proposed earlier by Motley (1988).
M2: M1 plus savings deposits (including money market deposit accounts) andsmall-denomination (less than $100,000) time deposits issued by financialinstitutions; and shares in retail money market mutual funds (funds with initialinvestments of less than $50,000), net of retirement accounts.
M3: M2 plus large-denomination ($100,000 or more) time deposits; repurchaseagreements issued by depository institutions; Eurodollar deposits, specifically,dollar-denominated deposits due to nonbank U.S. addresses held at foreignoffices of U.S. banks worldwide and all banking offices in Canada and theUnited Kingdom; and institutional money market mutual funds (funds withinitial investments of $50,000 or more).
Bank Credit: All loans, leases, and securities held by commercial banks.
Domestic Nonfinancial Debt: Total credit market liabilities of the U.S.Treasury, federally sponsored agencies, state and local governments, households,and nonfinancial firms. End-of-period basis.
Adjusted Monetary Base: The sum of currency in circulation outside FederalReserve Banks and the U.S. Treasury, deposits of depository financial institu-tions at Federal Reserve Banks, and an adjustment for the effects of changesin statutory reserve requirements on the quantity of base money held bydepositories. This series is a spliced chain index; see Anderson and Rasche(1996a, 1996b, 2001).
Adjusted Reserves: The sum of vault cash and Federal Reserve Bank depositsheld by depository institutions and an adjustment for the effects of changesin statutory reserve requirements on the quantity of base money held bydepositories. This series, a spliced chain index, is numerically larger than theBoard of Governors’ measure, which excludes vault cash not used to satisfystatutory reserve requirements and Federal Reserve Bank deposits used tosatisfy required clearing balance contracts; see Anderson and Rasche (1996a,2001).
Monetary Services Index: An index that measures the flow of monetaryservices received by households and firms from their holdings of liquidassets; see Anderson, Jones, and Nesmith (1997). Indexes are shown for theassets included in M2; additional data are available atresearch.stlouisfed.org/msi/index.html.
Note: M1, M2, M3, Bank Credit, and Domestic Nonfinancial Debt are con-structed and published by the Board of Governors of the Federal ReserveSystem. For details, see Federal Reserve Bulletin, tables 1.21 and 1.26. MZM,Adjusted Monetary Base, Adjusted Reserves, and Monetary Services Indexare constructed and published by the Research Division of the Federal ReserveBank of St. Louis.
NotesPage 3: MZM, or “Money, Zero Maturity,” includes the zero maturity, orimmediately available, components of M3. MZM equals M2 minus small-denomination time deposits, plus institutional money market mutual funds(that is, the money market mutual funds included in M3 but excluded fromM2). Readers are cautioned that since early 1994 the level and growth of M1have been depressed by retail sweep programs that reclassify transactionsdeposits (demand deposits and other checkable deposits) as savings depositsovernight, thereby reducing banks’ required reserves; see Anderson and Rasche(2001) and research.stlouisfed.org/aggreg/swdata.html. Primary Credit Rate,Discount Rate, and Intended Federal Funds Rate shown in the chartReserve Market Rates are plotted as of the date of the change, while theEffective Federal Funds Rate is plotted as of the end of the month. Interest
rates in the table are monthly averages from the Board of Governors H.15Statistical Release. The Treasury Yield Curve shows constant maturity yieldscalculated by the U.S. Treasury Department for securities with 3 months and1, 2, 3, 5, 7, and 10 years to maturity. Daily data and descriptions are availableat research.stlouisfed.org/ fred/data/wkly.html. See also Federal ReserveBulletin, table 1.35. The 30-year constant maturity series was discontinuedby the Treasury Department as of February 18, 2002.
Page 5: Checkable Deposits is the sum of demand and other checkabledeposits. Savings Deposits is the sum of money market deposit accountsand passbook and statement savings. Time Deposits have a minimum initialmaturity of 7 days. Large Time Deposits are deposits of $100,000 or more.Retail and Institutional Money Market Mutual Funds are as included inM2 and the non-M2 component of M3, respectively.
Page 7: Excess Reserves plus RCB (Required Clearing Balance) Contractsequals the amount of deposits at Federal Reserve Banks held by depositoryinstitutions but not applied to satisfy statutory reserve requirements. (Thismeasure excludes the vault cash held by depository institutions that is notapplied to satisfy statutory reserve requirements.) Consumer Credit includesmost short- and intermediate-term credit extended to individuals. See FederalReserve Bulletin, table 1.55.
Page 8: Inflation Expectations measures include the quarterly Federal ReserveBank of Philadelphia Survey of Professional Forecasters, the monthly Universityof Michigan Survey Research Center’s Surveys of Consumers, and the annualFederal Open Market Committee (FOMC) range as reported to the Congressin the February Humphrey-Hawkins Act testimony each year. BeginningFebruary 2000, the FOMC began using the personal consumption expenditures(PCE) price index to report its inflation range and therefore is not shown onthis graph. CPI Inflation is the percentage change from a year ago in theconsumer price index for all urban consumers. Real Interest Rates are ex postmeasures, equal to nominal rates minus CPI inflation.
Page 9: FOMC Intended Federal Funds Rate is the level (or midpoint ofthe range, if applicable) of the federal funds rate that the staff of the FOMCexpected to be consistent with the desired degree of pressure on bank reservepositions. In recent years, the FOMC has set an explicit target for the federalfunds rate.
Page 10: Federal Funds Rate and Inflation Targets shows the observedfederal funds rate, quarterly, and the level of the funds rate implied by applyingTaylor’s (1993) equation
ft*= 2.5 + π t –1 + (π t –1 – π*)/2 + 100 × (yt –1 – yt –1
P)/2
to five alternative target inflation rates, π* = 0, 1, 2, 3, 4 percent, where ft* is
the implied federal funds rate, π t –1 is the previous period’s inflation rate (PCE)measured on a year-over-year basis, yt –1 is the log of the previous period’slevel of real gross domestic product (GDP), and yt –1
P is the log of an estimateof the previous period’s level of potential output. Potential Real GDP is asestimated by the Congressional Budget Office.
Monetary Base Growth and Inflation Targets shows the quarterly growthof the adjusted monetary base (modified to include an estimate of the effectof sweep programs) implied by applying McCallum’s (1988, 1993) equation
∆MBt* = π* + (10-year moving average growth of real GDP)
– (4-year moving average of base velocity growth)
to five alternative target inflation rates, π* = 0, 1, 2, 3, 4 percent, where ∆MBt*
is the implied growth rate of the adjusted monetary base. The 10-year movingaverage growth of real GDP for a quarter t is calculated as the averagequarterly growth during the previous 40 quarters, at an annual rate, by theformula ((yt – yt –40)/40) × 4 × 100, where yt is the log of real GDP. The four-year moving average of base velocity growth is calculated similarly. To adjustthe monetary base for the effect of retail-deposit sweep programs, we add tothe monetary base an amount equal to 10 percent of the total amount swept,as estimated by the Federal Reserve Board staff. These estimates are imprecise,at best. Sweep program data are available atresearch.stlouisfed.org/aggreg/swdata.html.
Monetary Trends
Research DivisionFederal Reserve Bank of St. Louis 19

Page 11: Implied One-Year Forward Rates are calculated by this Bank fromTreasury constant maturity yields. Yields to maturity, R(m), for securities withm = 1,... , 10 years to maturity are obtained by linear interpolation betweenreported yields. These yields are smoothed by fitting the regression suggestedby Nelson and Siegel (1987),
R(m) = a0 + (a1 + a2)(1 – e–m/50)/(m/50) – a2 × e–m/50,
and forward rates are calculated from these smoothed yields using equation(a) in table 13.1 of Shiller (1990),
f(m) = [D(m)R(m) – D(m–1)] / [D(m) – D(m–1)],
where duration is approximated as D(m) = (1 – e–R(m) × m)/R(m). These ratesare linear approximations to the true instantaneous forward rates; see Shiller(1990). For a discussion of the use of forward rates as indicators of inflationexpectations, see Sharpe (1997). Rates on 3-Month Eurodollar Futures andRates on Selected Federal Funds Futures Contracts trace through time theyield on three specific contracts. Rates on Federal Funds Futures onSelected Dates displays a single day’s snapshot of yields for contracts expiringin the months shown on the horizontal axis. Inflation-Indexed TreasuryBonds are yields on the most recently issued inflation-indexed securities of10- and 30-year original maturities. Inflation-Indexed Treasury Yield Spreadsequal, for 10- and 30-year maturities, the difference between the yields onthe most recently issued inflation-indexed securities and the unadjusted bondyields of similar maturity. Inflation-Indexed 30-Year Government Bondsshows the yield of an inflation-indexed bond that is scheduled to mature inapproximately (but not greater than) 30 years. The current bond for Canadahas a maturity date of 12/01/2031, the current bond for France has a maturitydate of 7/25/2032, the current U.K. bond has a maturity date of 7/22/2030,and the current U.S. bond has a maturity date of 4/15/2032. Inflation-Indexed10-Year Government Bonds shows the yield of an inflation-indexed bond thatis scheduled to mature in approximately (but not greater than) 10 years. Thecurrent bond for France has a maturity date of 7/25/2013, the current U.K. bondhas a maturity date of 8/16/2013, and the current U.S. bond has a maturitydate of 7/15/2013.
Page 12: Velocity (for MZM and M2) equals the ratio of GDP, measured incurrent dollars, to the level of the monetary aggregate. MZM and M2 OwnRates are weighted averages of the rates received by households and firmson the assets included in the aggregates. Prior to 1982, the 3-month T-billrates are secondary market yields. From 1982 forward, rates are 3-monthconstant maturity yields.
Page 13: Real Gross Domestic Product is GDP as measured in chained 1996dollars. The Gross Domestic Product Price Index is the implicit price deflatorfor GDP, which is defined by the Bureau of Economic Analysis, U.S. Depart-ment of Commerce, as the ratio of GDP measured in current dollars to GDPmeasured in chained 1996 dollars.
Page 14: Investment Securities are all securities held by commercial banksin both investment and trading accounts.
Page 17: Treasury Yields are Treasury constant maturities as reported in theBoard of Governors of the Federal Reserve System’s H.15 release.
SourcesAgence France Trésor
French inflation-indexed bond yields.
Bank of CanadaCanadian inflation-indexed bond yields.
Bank of EnglandU.K. inflation-indexed bond yields.
Board of Governors of the Federal Reserve SystemMonetary aggregates and components: H.6 release. Bank credit and com-ponents: H.8 release. Consumer credit: G.19 release. Required reserves,excess reserves, clearing balance contracts, and discount window borrowing:H.4.1 and H.3 releases. Interest rates: H.15 release. Nonfinancial commer-cial paper: Board of Governors website. Nonfinancial debt: Z.1 release.M2 own rate.
Bureau of Economic AnalysisGDP.
Bureau of Labor StatisticsCPI.
Chicago Board of TradeFederal funds futures contract.
Chicago Mercantile ExchangeEurodollar futures.
Congressional Budget OfficePotential real GDP.
Federal Reserve Bank of PhiladelphiaSurvey of Professional Forecasters inflation expectations.
Federal Reserve Bank of St. LouisAdjusted monetary base and adjusted reserves, monetary services index,MZM own rate, one-year forward rates.
Organization for Economic Cooperation and DevelopmentInternational interest and inflation rates.
Standard & Poor’sStock price-earnings ratio, stock price composite index.
University of Michigan Survey Research CenterMedian expected price change.
U.S. Department of the TreasuryU.S. inflation-indexed security yields.
ReferencesAnderson, Richard G. and Robert H. Rasche (1996a). “A Revised Measure of
the St. Louis Adjusted Monetary Base,” Federal Reserve Bank of St. LouisReview, March/April, 78(2), pp. 3-13.
____ and ____(1996b). “Measuring the Adjusted Monetary Base in an Era ofFinancial Change,” Federal Reserve Bank of St. Louis Review, November/December, 78(6), pp. 3-37.
____ and ____(2001). “Retail Sweep Programs and Bank Reserves, 1994-1999,”Federal Reserve Bank of St. Louis Review, January/February, pp. 51-72.
____ , Barry E. Jones and Travis D. Nesmith (1997). “Special Report: TheMonetary Services Indexes Project of the Federal Reserve Bank of St.Louis,” Federal Reserve Bank of St. Louis Review, January/February,79(1), pp. 31-82.
McCallum, Bennett T. (1988). “Robustness Properties of a Monetary PolicyRule,” Carnegie-Rochester Conference Series on Public Policy, vol. 29,pp. 173-204.
____(1993). “Specification and Analysis of a Monetary Policy Rule for Japan,”Bank of Japan Monetary and Economic Studies, November, pp. 1-45.
Motley, Brian (1988). “Should M2 Be Redefined?” Federal Reserve Bank ofSan Francisco Economic Review, Winter, pp. 33-51.
Nelson, Charles R. and Andrew F. Siegel (1987). “Parsimonious Modeling ofYield Curves,” Journal of Business, October, pp. 473-89.
Poole, William (1991). Statement before the Subcommittee on DomesticMonetary Policy of the Committee on Banking, Finance and Urban Affairs,U.S. House of Representatives, November 6, 1991. Government PrintingOffice, Serial No. 102-82.
Sharpe, William F. (1997). Macro-Investment Analysis, on-line textbookavailable at www.stanford.edu/~wfsharpe/mia/mia.htm.
Shiller, Robert (1990). “The Term Structure of Interest Rates,” Handbook ofMonetary Economics, vol. 1, B. Friedman and F. Hahn, eds., pp. 627-722.
Taylor, John B. (1993). “Discretion versus Policy Rules in Practice,” Carnegie-Rochester Conference Series on Public Policy, vol. 39, pp. 195-214.
Note: Articles from this Bank’s Review are available on the Internet atresearch.stlouisfed.org/publications/review/.
Monetary Trends
Research Division20 Federal Reserve Bank of St. Louis