money marriageit ain't easy - canadian moneysaver · john mayo aurora [email protected]...
TRANSCRIPT

Canadian MoneySaver z https://www.canadianmoneysaver.ca z JUNE 2017 z 1
MONEYCANADIAN CANADIANMONEYSAVER.CA
SAVER
Can You Over Diversify? Allan Small P.26
$4.95
PM40
0354
85 R
0990
4
Independent Financial Advice For Everyday Use - Since 1981
DIVIDEND & COMPANY NEWS • ETFS • TOP FUNDS • DRIPS • ASK THE EXPERTS
JUNE 2017
Secrets And Lies: Why Hidden DebtCan Hurt More Than Your RelationshipLisa MacColl P.32
Money&Marriage
Ken Finkelstein Page23
IN THIS ISSUE:
5i Research Report
on K-Bro Linen Inc.
It Ain't Easy

T O R O N T OS e p t e m b e r 8 - 9 , 2 0 1 7M e t ro To ro n to C o n v e n t i o n C e n t r e
CANADA’S #1 EVENT FOR INVESTORS & TRADERS
JOIN US FOR A FREE SPECIAL EVENT AIMED TO SHOW YOU THE
MONEY-SAVING AND MONEY-MAKING OPPORTUNITIES YOU MAY BE MISSING.
SATURDAY, SEPTEMBER 9TH
9:00 am – 3:30 pm
REGISTER FREE AT: WWW.TORONTOMONEYSHOW.COM
2 EASY WAYS TO
REGISTER FREE:
TEL: 1-800-970-4355
WEB: WWW.TORONTOMONEYSHOW.COM Priority Code 043087
Canadian MoneySaver is pleased to bring together a select group of its expert columnists
for a special full-day event at The MoneyShow Toronto 2017 aimed at helping you
become a more informed, savvy, and profitable investor. From learning how to get the
highest returns for your RRSPs and RRIFs, to maximizing your gains from dividend
stocks and cutting your taxes to the bone, these experts will share their best money-saving
and money-making opportunities with you.
RYAN MODESTOManaging Partner5i Research, Inc.
PETER HODSONEditor
Canadian Moneysaver
KEITH RICHARDSPortfolio Manager
ValueTrend
BENJ GALLANDERPresident
Contra the Heard
DEREK FOSTERAuthor
The Idiot Millionaire
Powered byMedia PartnerETF Thought LeaderGold Sponsors
COLIN RITCHIELawyer and Financial
Planner, Colin S. Ritchie

JUNE 2017
EDITOR-IN-CHIEF: Lana SanicharEDITOR: Peter HodsonCONTRIBUTING EDITORS:Ed Arbuckle, Margot Bai, Robert Barney, Dan Bortolotti, Ian Burns, Bruce Cappon, John De Goey, Donald Dony, David Ensor, Ken Finkelstein, Derek Foster, Benj Gallander, Robert Gibb, Andrew Hepburn, Shelley Johnston, Robert Keats, Cynthia Kett, Ken Kivenko, Camillo Lento, Marie-Josée Loiselle, Alan MacDonald, Brenda MacDonald, Gina Macdonald, Robert MacKenzie, Ross McShane, Ryan Modesto, Caroline Nalbantoglu, Tim Parris, Peter Premachuk, John Prescott, Kyle Prevost, Brian Quinlan, Wynn Quon, Rino Racanelli, Colin Ritchie, Scott Ronalds, Norm Rothery, Stephane Ruah, Allan SmallDavid Stanley, John Stephenson, Brian Tang, Angelo Vicere, Becky Wong.
MEMBERSHIP RATES: All rates for Canadian residents are printed on the inside back cover. Non-residents of Canada may purchase the online edition only – at $26.95 for one year’s service.
Canadian MoneySaver (CMS) is published by The Canadian Money Saver Inc., 55 King Street West, Suite 700, Kitchener, ON N2G 4W1 Tel: 519-772-7632. Office hours: 9:30 am to 1:30 pm EST Website: http://www.canadianmoneysaver.ca E-mail: [email protected]
PRIVACY POLICY: CMS may make its members’ mailing list or e-mail addresses available to carefully screened compa-nies or organizations offering products or services that may be of interest to you. If you prefer not to receive these offers, send us your mailing label with “Do Not Rent” written on it. (Required statement. We do not rent addresses.)
Canadian MoneySaver publishes monthly with three double issues (July/Aug, Nov/Dec and March/April). Canadian MoneySaver is an independent, totally membership-funded magazine.
The information contained in Canadian MoneySaver is obtained from sources believed to be reliable. However, we cannot represent that it is accurate or complete. The views expressed are those of the writers and not necessarily those of The Canadian Money Saver Inc. Neither the information nor any opinion expressed constitutes a solicitation by us for the purchase or sale of any securities or commodities. Canadian MoneySaver is distributed with the explicit understanding that Canadian MoneySaver, its publisher or writers cannot be held responsible for errors or omissions. Shareholders of The Canadian Money Saver Inc, editors and contributors may at times have positions in mentioned investments/securities.
Copyright © 2017. All rights reserved.
No reproduction, transmission or publication of any of the contents of Canadian MoneySaver is permitted without the express prior consent of the copyright owner. To obtain permission to use any part of Canadian MoneySaver, contact Peter Hodson.
® – Canadian MoneySaver is a Registered Canadian Trade Mark of The Canadian Money Saver Inc. Printed in Canada ISSN: 0713-3286
We acknowledge the financial support of the Government of Canada.
Canada Post Publication No. 40035485
JUNE 2017, Volume 36, Number 8
REGULAR FEATURES Shareclubs 4
Sharing With You 4
Dividend & Company News 5
Model ETF Portfolio 5
Readers Write 12
Best Annuity Rates 25
Ask The Experts 36
Money Digest 38
Canadian DRIPs with SPPs 39
Top Funds 40
Canadian ETFs 42
SPECIAL FEATURES
It Pays To Listen To Wealthy People - Parkland's High P/E Ratio Means It's Only For Aggressive Investors Richard Morrison 6
Water Michael Patenaude 8
Negotiating The Operating Costs As Rent – For Independent Or Franchise Commercial Tenants JeffGrandfieldandDaleWillerton–TheLeaseCoach14
Private Equity Investments And Your Registered Savings And Income Accounts Bob Carter 15
Understanding Deductibility Calum Ross with Simon Giannini 17
Health Care Spending Accounts Colin Ritchie 19
Money And Marriage: It Ain’t Easy Ken Finkelstein 23
Can You Over Diversify? Allan Small 26
5i Research Report on K-Bro Linen Inc. 5i Research 27
Secrets And Lies: Why Hidden Debt Can Hurt More Than Your Relationship LisaMacColl32
Annuities: Good Income Option For Retirees Despite New Tax Rules Rino Racanelli 34
T O R O N T OS e p t e m b e r 8 - 9 , 2 0 1 7M e t ro To ro n to C o n v e n t i o n C e n t r e
CANADA’S #1 EVENT FOR INVESTORS & TRADERS
JOIN US FOR A FREE SPECIAL EVENT AIMED TO SHOW YOU THE
MONEY-SAVING AND MONEY-MAKING OPPORTUNITIES YOU MAY BE MISSING.
SATURDAY, SEPTEMBER 9TH
9:00 am – 3:30 pm
REGISTER FREE AT: WWW.TORONTOMONEYSHOW.COM
2 EASY WAYS TO
REGISTER FREE:
TEL: 1-800-970-4355
WEB: WWW.TORONTOMONEYSHOW.COM Priority Code 043087
Canadian MoneySaver is pleased to bring together a select group of its expert columnists
for a special full-day event at The MoneyShow Toronto 2017 aimed at helping you
become a more informed, savvy, and profitable investor. From learning how to get the
highest returns for your RRSPs and RRIFs, to maximizing your gains from dividend
stocks and cutting your taxes to the bone, these experts will share their best money-saving
and money-making opportunities with you.
RYAN MODESTOManaging Partner5i Research, Inc.
PETER HODSONEditor
Canadian Moneysaver
KEITH RICHARDSPortfolio Manager
ValueTrend
BENJ GALLANDERPresident
Contra the Heard
DEREK FOSTERAuthor
The Idiot Millionaire
Powered byMedia PartnerETF Thought LeaderGold Sponsors
COLIN RITCHIELawyer and Financial
Planner, Colin S. Ritchie

4 z Canadian MoneySaver z https://www.canadianmoneysaver.ca z JUNE 2017
Sharing With You ShareClubsJoin any of the listed ShareClubs by contacting your local volun-
teer. Like-minded members get together to share financial informa-tion. No cost. No obligation. Just an inquiring mind. The agenda for each group is shared by all group members, i.e. it is not just the responsibility of the contact person. ShareClubs are unlike invest-ment clubs because they are meant to share investing information only. Contact MoneySaver and volunteer to start a ShareClub in your area. When ShareClubs are filled, they are delisted.
VOLUNTEER REGION CONTACT
ONTARIO
Blake Hoo Ajax/Pickering [email protected] Mayo Aurora [email protected] Attobelli Bolton 905-857-6527James Bolen Caledon 416-617-7311Ken Kyer Cornwall [email protected] Piccoli Georgetown [email protected] Prescott Guelph [email protected] Thai Hamilton [email protected] Matthew Moore Kincardine/Port Elgin 519-371-6592Richard Gerson Kitchener-Waterloo [email protected] Gauld London 519-657-4393Dipen Parekh Milton 647-745-2420Paul Drummond Mitchell 519-348-9724Linda Sopoco Delfin Mississauga 905-858-5555Jim Ashley Newmarket [email protected] Matsdorf North York I [email protected] Pun North York II [email protected] Hogenhout Orangeville 519-942-0220Tom Loftus Oshawa 905-725-1979André Albert Ottawa [email protected] needed Peterborough [email protected] Mintha Port Hope 905-885-8659John Mills Scarborough 416-267-7993Jeff Danby St. George 519-753-7414Gary Poxleitner Sudbury [email protected] Zhang Toronto-Central [email protected] Closs Thunder Bay [email protected] Lamasz Unionville/Markham [email protected]
ALBERTA
William Wood Calgary SE [email protected] Tremblay Fort McMurray [email protected]
BRITISH COLUMBIA
Ron Beaton South Delta, BC www.tlshareclub.com
Don Sherman Kelowna/Okanagan [email protected] Hicks New Westminster, 778-875-2615Brian Pearson Prince George [email protected] Karefoe Queen Charlotte Is. [email protected] Lines Salmon Arm [email protected] & Vic Parks Salt Spring Island [email protected] Groom Sidney [email protected] Lee Ctrl. Vancouver [email protected] Gibb Victoria [email protected] Page Victoria/Sanich [email protected] Broatch White Rock [email protected]
NEW BRUNSWICK
John Richards Fredricton [email protected]
NOVA SCOTIA
Bill Macgregor Halifax 902-717-8153
PEI
Frank Driscoll Charlottetown 902-569-3601
There are so many things wrong with the inve s tment
industry. This was one of the main reasons for our big career change in 2011 from being a fund manager to owner of this magazine. We could list many ‘problems’ with the industry and how it is set up against the very customers it is supposed to serve—you, the investor. Let’s look though at the most recent example.
In early May, Merrill Lynch decided it would not ‘permit’ its clients to buy any new Exchange Traded Funds (ETFs) offered by Vanguard Group. Vanguard has been one of the leaders in driving ETF fund costs lower. Some of its funds charge fees of only 0.05%, and investors have responded by making Vanguard the fastest-growing fund company in the world. Money is pouring into Vanguard funds, as investors continue to shift to passively managed, low-cost funds.
But Merrill is having none of this. Merrill says it is cutting the number of funds offered in order to better research those remaining. But the ‘real’ reason is that Vanguard refuses to pay Merrill for access to its investment brokers. Most fund companies make millions, or more, in order to get ‘shelf ’ space at investment firms, as well as representation at conferences and so on. Vanguard refuses to pay these fees (bribes?) in order to keep its expenses as low as possible.
So, Merrill has said no, we are not going to let our clients buy the lowest cost and most popular ETFs in the world. How’s that for customer service? There are so many things wrong with this move, but we will let you make your own call here. Does this sound like an industry with your own interests in mind?
On a happier note, congratulations go to Lana Sanichar, Canadian MoneySaver’s new President and Editor-in-Chief. I will still be the main contact for investment content, but it was time to recognize that Lana does all the real work around here and the magazine could not run without her.
PeterPeter Hodson

Canadian MoneySaver z https://www.canadianmoneysaver.ca z JUNE 2017 z 5
MoneySaver DIVIDEND& COMPANY NEWSIn this column we list recent news, events, dividend income news and any other relevant information for
MoneySavers. News items are those received after our last publication date.
Canadian MoneySaver MODEL ETF PORTFOLIOETF SYMBOL CATEGORY PRICE # OF
UNITS TOTAL % OF PORTFOLIO
iShares 1-5 Year Laddered Corporate Bond CBO Fixed Income 19.02 506 9,624.12 7.2%
iShares DEX Universe Bond XBB Fixed Income 31.62 166 5,248.92 3.9%
iShares S&P/TSX Canadian Preferreds CPD Fixed Income 14.04 460 6,458.40 4.8%
iShares S&P/TSX Capped Composite XIC Equity: Canada 24.73 980 24,235.40 18.2%
iShares S&P/TSX Cdn. Div Aristocrats CDZ Equity: Canada Div. 27.06 562 15,207.72 11.4%
iShares U.S. High Yield Bond Index ETF XHY Fixed Income 20.10 350 7,035.00 5.3%
Vanguard FTSE Emerging Markets Index VEE Equity: Emerging 33.14 194 6,429.16 4.8%
Vanguard FTSE Developed Europe All Cap VE Equity: Interntional 28.76 194 5,579.44 4.2%
SPDR S&P 500 SPY Equity: U.S. 238.08 33 10,763.60 8.1%
Vanguard Div. Appreciation Index VIG Equity: U.S. Div. 91.49 116 14,539.59 10.9%
iShares Russell 2000 Growth IWO Equity: U.S. Growth 164.71 69 15,570.04 11.7%
BMO Covered Call Utilities ZWU Equity: N.A. Div 14.05 437 6,139.85 4.6%
Cash Cash Cash 6,658.72 5.0%
Total Portfolio 133,489.95
Exchange Rate 1.37 $ Gain/(Loss): 33,489.95
Inception value: 100,000.00 % Gain/(Loss): 33.49%
Inception date: October 18, 2013 % Annualized: 8.52%
Prices are at market close on April 30, 2017.
Individual prices are in USD$. Portfolio values, $Gain/(Loss), % Gain/(Loss), % Annualized all reflect USD$ values are converted to CAD$
CURRENT NOTES: None
OTHER NOTES: Keep in mind all investors are different. This portfolio is designed as a guide in setting up your own personal portfolio. Unique considerations and adjustments need to be made to reflect your personal situation. Please perform your own due diligence before making investment decisions. For use by Canadian MoneySaver subscribers only. Not for redistribution.
Please direct portfolio questions to [email protected]
• SunLife (SLF) raises dividend by 4%
• Keyera (KEY) raises dividend by 6%
• George Weston (WN) increases dividend by 3.4%
• Open Text (OTC), raises dividend by 15%
• Home Capital (HCG) suspends dividend
• Enbridge (ENB), boosts dividend by 5%
• Uni Select (UNS) boosts dividend by 9%
• Loblaw Cos. (L), boosts dividend by 3.8%
• Imperial Oil (IMO) raises dividend by 6.6%
• Jean Coutu (PJC.A) raises dividend by 8%
• Methanex (MX) boosts dividend by 9%

6 z Canadian MoneySaver z https://www.canadianmoneysaver.ca z JUNE 2017
Sector Focus
It Pays To Listen To Wealthy People Parkland's High P/E Ratio Means It's Only For Aggressive Investors
During a recent game of pool in the billiard room of his palatial home, my wealthy friend Jim said he was delighted that he’d invested in Parkland Fuel Corp. (PKI/TSX).
Parkland, based in Red Deer, Alta. sells gasoline and other petroleum products to businesses, households and wholesale customers in Canada and the United States. The company also owns gas stations under banners such as Pioneer in Ontario, FasGas Plus in western Canada and Race Trac in rural communities. The company was called Parkland Industries until it became Parkland Income Fund in 2002, then converted to a corporation at the end of 2010.
The day before Jim and I played pool, Parkland announced it had made the biggest acquisition in its history. The company reached a $1.46-billion deal with Chevron Corp. to buy Chevron Canada R&M, including its retail and commercial assets in western Canada.
The news sent Parkland’s shares up 10% the next morning, prompting Jim’s enthusiasm.
“Did you see Parkland this morning? I’ve owned it for years. It’s been very good to me,” he said.
Jim, 82, has been a buy-and-hold investor since the bear market of 1973-74.
“My biggest investment mistake? Those damned tulip bulbs,” he quipped, testing my knowledge of market history. (Tulipmania, popularized in Extraordinary Popular Delusions and the Madness of Crowds by Charles Mackay, occurred in 1637.)
Seriously, Jim said he had accumulated his position in what was then known as Parkland Industries in the 1990s, held it through the eight years it was an income trust, and still owns it. Though he would not tell me how much he’d invested, figures from longrundata.com show an investor who put $1,000 into Parkland 20 years ago in 1997 and reinvested the dividends would have about $250,000 today.
When I told Jim I might write something about Parkland, he turned cautious.
Richard Morrison
“I’m just happy with my investment,” he said. “I don’t follow it that closely and I’m not trying to recommend it to anybody. For all I know it’s overvalued.”
That said, when a wealthy investor tells you he has done very well over the years with one of his long-term holdings, you should at least pay attention, if only as a starting point for further research.
Since converting back to a corporation at the end of 2010, Parkland’s share price has grown to $29.70 from $11.50, a gain of 160%, while the S&P/TSX index is just 17.5% higher. Over the same period, shares of Canadian Tire Corp. (CTC/TSX), itself a solid investment in the gasoline and retail space, is up 150%, while Suncor Energy Inc.’s shares are up just 16%. The gains have not been smooth and steady. The plunge in the oil price kept western Canadian customers away from Parkland’s stations, crushing revenue and profits, and the stock slid in 2015.
Parkland is in a competitive industry, but its locations are often in rural communities where consumers have fewer choices, which allows for higher profit margins.
Parkland has a long history of making shrewd acquisitions that have benefited its shareholders.
“As the fuel distribution market remains significantly fragmented in North America, we believe that we are well-placed to be a leader in its consolidation,” the company says in its management discussion and analysis (MD&A), released March 2.
In addition to owning a refinery and three port terminals, the Chevron deal means Parkland will have 1,834 corporate and dealer gas stations, making it the largest Canadian retail fuel marketer and the second largest convenience store operator.
As a result of its most recent deal, Parkland now owns Chevron’s refinery in Burnaby, B.C., which should benefit once the capacity of the Trans Mountain pipeline is increased. Ottawa approved the $7.4-billion twinning of the pipeline last year despite opposition by environmental

Canadian MoneySaver z https://www.canadianmoneysaver.ca z JUNE 2017 z 7
groups, and once it’s finished, the pipeline will pump nearly three times as much oil and related products.
Along with the refinery and three fuel terminals, the deal will net Parkland 129 Chevron gas stations in the Vancouver area, 37 cardlock stations (unmanned stations for fleet vehicles) in B.C. and Alberta, three marine fuelling stations and a jet fuel business at Vancouver International Airport. The deal will add economies of scale and improve efficiency, linking the refinery and terminals to Parkland’s retail, commercial and wholesale businesses.
Parkland will finance the deal with $660-million in new shares, a $268-million draw on its credit facility, a $500-million bridge facility (later replaced with a debt issuance) and $40 million in cash flow from operations.
The deal will add more than 2.5 billion litres of annual volume and $230-million in earnings before interest, taxes, depreciation and amortization, or EBITDA, and increase its distributable cash flow by more than 30%, Parkland said in a news release.
The Chevron deal follows Parkland’s acquisition of most of the assets of CST Brands from gasoline and convenience store giant Alimentation Couche-Tard Inc. (ATD.B/TSX) last summer for $965-million. The move added Ultramar to Parkland’s brands and expanded Parkland into Quebec and Atlantic Canada, with 490 service stations, 72 commercial cardlock sites and 27 commercial and home heating sites.
Parkland’s dividend, which has been raised every February for the past four years, now pays $1.15 a year to yield about 3.9%. The company’s dividend reinvestment plan (DRIP) allows Canadian shareholders to use their dividend to buy more shares at a 5% discount to the stock’s volume-weighted average price. DRIP subscribers who bought Parkland when it converted to a corporation at the end of 2010 would have enjoyed an annualized return of about 23%, and a $1,000 investment made then would now be worth $3,687, figures from longrundata.com show.
The dividend payout ratio sits at 91%.
At $29.70, Parkland’s shares are certainly expensive, trading at about 60 times trailing earnings of 49 cents per share and 3.56 times book value per share but just 0.45 times sales per share, which many argue is a better indicator of value. The company has a market capitalization of $2.92-billion.
The company’s long-term debt has increased over the past few years and now sits at $538-million, still a modest 18% of its market capitalization. Parkland’s long-term debt to equity is 70%, while its debt to total equity is 1.04 and total debt/total capital sits at 51%. Though the debt seems high, Parkland operates in a capital-intensive industry that requires refineries, pipelines, trucks and gas stations and its debt levels are actually lower than other pipeline companies.
Even so, Parkland’s current ratio (current assets/current liabilities) of about 1.1 is reasonable.
Perhaps the most worrisome debt indicator is the fact that its corporate notes are tagged with speculative ratings from both Standard & Poors (BB-) and DBRS (BB).
Parkland had $25.6-million in net cash at the end of 2016.
In 2016, Parkland earned $47.2-million or 49 cents a share on revenue of $6.27-billion, up from profit of $39.5-million (45 cents) on revenue of $6.3-billion.
In the fourth quarter of 2016, the company’s adjusted EBITDA grew to a record $77.1-million, up 19% over the $64.8-million reported in the same quarter of 2015. The growth came in all its operating units, including 21% in supply and wholesale, 15% in retail fuels and 5% in commercial fuels, the company’s management, discussion and analysis (MD&A) says.
In the fourth quarter, Parkland delivered about 2.8 billion litres of fuel and petroleum products, up 6% from the 2.6 billion litres recorded in the same quarter of 2015. Sales and operating revenue rose to $1.74-billion from $1.66-billion, mainly thanks to increased fuel volumes.
Not all the news was good, however. Net earnings plunged to just $3-million from $15.6-million, largely because of a $14.2-million finance cost charge involving the fair value of some redemption options on its senior unsecured notes due to changing credit market conditions.
Despite its high P/E ratio, Parkland looks like a great growth stock but it has a number of risks that make it ill-suited to conservative investors. Since it’s based primarily in western Canada, fluctuations in the oil price affect the regional economy, which in turn changes the level of demand for its products. This risk is reflected in the “speculative” rating that both S&P and DBRS give to its corporate notes.
There is another reason investors might want to have a small stake in Parkland, though. When Jim mentioned Parkland, I immediately thought of Alimentation Couche-Tard, which I described in the March issue of Canadian MoneySaver. The acquisition-hungry gasoline and retail giant, with a market capitalization of $36.2-billion, is 12 times the size of Parkland and, providing the federal Competition Bureau allowed it, could easily make a takeover bid for the smaller company and award Parkland shareholders a premium in the process.
“I own Couche-Tard, too,” Jim said.
Richard Morrison, CIM, is a former editor and investment columnist at the Financial Post. [email protected]

8 z Canadian MoneySaver z https://www.canadianmoneysaver.ca z JUNE 2017
Secular Trends And Investing
Water
Michael Patenaude
The Trend
Hedge fund manager Michael Burry is one of the protagonists in the 2015 movie The Big Short. In 2005, he predicted the impending collapse of the US housing
bubble due to the instability of sub-prime loans. In the postlude to the movie it is mentioned that Burry still does some limited investing and it is “…all focused on one commodity: water.”
Water is often marked by its scarcity, sometimes even severe scarcity, in many locations on earth. This scarcity has far-reaching economic and geo-political implications.1 As a result, there are significant demands to improve water capture, use, treatment, transportation and technology. Growing water scarcity represents a secular trend of considerable importance to billions of people worldwide.
Some FactsFigures on water scarcity are stark and attention-
getting: “…two-thirds of the global population (4.0 billion people) live under conditions of severe water scarcity at least 1 month of the year. Nearly half of those people live in India and China. Half a billion people in the world face severe water scarcity all year round.”
We know that even developed countries face water scarcity such as the western part of the United States, Southern Europe and Australia.2
Causes include growing human populations with higher consumption demands, challenges with conservation, land degradation and pollution and changes in climate patterns.3 According to the International Food Policy Research Institute in 2016, there will be a 40% gap between water demand and supply over the next 15 years. Agriculture is the largest consumer of water (70%), followed by industry (20%) and individuals (10%). The three areas where investments may perform well are
expanding the water supply, increasing efficiency in the water cycle and improving water quality and treatment.4
As the global human population rises from 7.4 billion to close to 10 billion by the middle of the century, it is estimated that agricultural production will have to rise by 60% to satisfy agricultural demand alone. Power generation will also need to increase to satisfy the needs of the growing world population. Furthermore, global warming is expected to cause wet regions to get wetter, and dry regions to get drier. The increasing frequency of flash floods that do little to replenish aquifers and more frequent and protracted droughts will create ever more pressure on water supplies. The need to plug leaking pipes, improve sanitation, reduce pollution, build more reservoirs and expand water purification works is growing ever more obvious.5
Some are expecting massive new government spending on water in the near future: water infrastructure projects are projected to grow an average of 5%–8% annually and money already being spent in the area of improving water access and quality includes $110B per year in China and about $20B annually in California.6
RisksAs with any investment there are always risks. Yet I view
the water trend as good long-term hedge against shorter-term volatility and unpredictability in some sectors (e.g., consumer cyclicals, energy). Thematic investing in water, using a broad-based approach, can provide exposure to industrials, utilities, materials and healthcare sectors, somewhat independently of shorter-term market cycles and fluctuation.
The water theme has been seen from time to time to be a bit of a fad affecting short to medium-term sentiment, but longer-term dynamics should continue to drive the growth in value of businesses that help deal with water scarcity.

Canadian MoneySaver z https://www.canadianmoneysaver.ca z JUNE 2017 z 9
As noted, water scarcity is a global theme that represents an opportunity for diversification into broader global equity markets and currencies since many of the companies in this space are located outside of North America and/or are international in focus. Even if international stocks swoon, the underlying pressures driving global water scarcity will remain and this should help buoy investments in this space over a long timeframe.
Ideas For Further Research
I see two main ways to invest in the water theme. One is to buy an exchange traded fund (ETF) that focuses on the theme, and the other is to buy individual stocks in companies involved is some portion of the water value chain.
Table 1 shows some ETFs in Canada and the US that focus on water. Note they often use different indexes for their composition.
Table 2 on the next page shows some of the individual securities one could purchase. Note that this list includes many of the top holdings of the ETFs listed in Table 1. As can often be the case in specialized areas of investing, Canadian representation is minimal in the water theme, with only two companies noted. Forward price/earnings ratios can be a bit high for some water stocks so that is something to consider from a value perspective.
Another area of research would be to investigate what Alphabet (Google’s parent company) is doing in the water space. It has taken on several water-related projects7 and was recently granted a US patent for a water drone designed to harvest rainwater in the oceans.8 This exciting technology facilitates the capture of rainwater falling over the oceans into a huge pool in the middle of the drone and brings it back to shore for harvesting and consumption. Will it work? I don’t know, but it is an innovative development and one to watch. Ta
ble
1 –
Wat
er-t
hem
ed E
xcha
nge
Trad
ed F
unds
Secu
rity
Mar
ket
Cap
Top
Sect
ors
Top
Geo
grap
hies
of
Hol
ding
s
Inde
x5
Year
Pr
ice
Chan
ge
Div
iden
d Yi
eld
(TTM
)5
Year
B
eta
5 Ye
ar
Earn
ings
G
row
th
Fore
cast
Forw
ard
P/E
Rati
oEx
pens
e Ra
tio
iSha
res
Glob
al
Wat
er I
ndex
ETF
(T
SE:C
WW
)
$112
MIn
dust
rial
s 4
9%U
tilit
ies
33%
Mat
eria
ls 1
1%H
ealt
hcar
e 5%
N. A
mer
ica
46%
Euro
pe 4
2%As
ia 1
3%
S&P
Glob
al
Wat
er10
8%1.
34%
0.53
10.5
3%21
.12
0.67
%
Pow
erSh
ares
W
ater
Re
sour
ces
ETF
(NAS
DAQ:
PHO)
$797
M
(US)
Indu
stri
als
58%
Uti
litie
s 13
%H
ealt
hcar
e 16
%M
ater
ials
8%
N. A
mer
ica
98%
NAS
DAQ
OMX
US
Wat
er I
ndex
41%
0.44
%1.
056
10.5
8%22
.77
0.61
%
Gugg
enhe
im S
&P
Glob
al W
ater
ETF
(N
YSE:
CGW
)
$528
M
(US)
Indu
stri
als
50%
Uti
litie
s 34
%M
ater
ials
11%
Hea
lthc
are
5%
N. A
mer
ica
44%
Euro
pe 4
2%As
ia 1
3%
S&P
Glob
al
Wat
er50
%1.
46%
0.91
310
.53%
21.0
80.
64%
Firs
t Tr
ust
ISE
Wat
er I
ndex
Fun
d ET
F (N
YSE:
FIW
)
$236
M
(US)
Indu
stri
als
51%
Uti
litie
s 19
%H
ealt
hcar
e 14
%M
ater
ials
8%
N. A
mer
ica
96%
ISE
Wat
er
Inde
x78
%1.
06%
1.04
411
.60%
22.4
70.
57%
Pow
erSh
ares
Gl
obal
Wat
er
Port
folio
ETF
(N
ASDA
Q:PI
O)
$188
M
(US)
Indu
stri
als
46%
Uti
litie
s 23
%M
ater
ials
19%
Hea
lthc
are
11%
N. A
mer
ica
46%
Euro
pe 3
8%As
ia 1
3%
NAS
DAQ
OMX
Glob
al
Wat
er I
ndex
31%
1.30
%1.
107
13.4
2%20
.55
0.75
%
Sour
ce: Y
Char
ts (
as o
f Apr
il 28
, 201
7). N
ote:
CW
W a
nd C
GW b
oth
trac
k th
e S&
P 50
0 Gl
obal
Wat
er I
ndex
, but
the
form
er is
list
ed in
Can
adia
n do
llars
whi
le th
e la
tter
is
liste
d in
US
dolla
rs.
How To Invest In The Water TrendPersonally, for this investment theme, I am more
inclined towards investing in an ETF. The main reasons are I like the diversification, I don’t know which companies or parts of the value chain in water-related

10 z Canadian MoneySaver z https://www.canadianmoneysaver.ca z JUNE 2017
For a Canadian investor, I believe CWW represents a very good opportunity due to its Canadian dollar denominated listing with a high proportion of international
holdings . One of the US-denominated ETFs would be an alternative if one prefers to hold a fund in US dollars (e.g., CGW) or if one prefers more concentration in US companies (e.g., PHO). Holding CWW along with a US ETF could provide an additional currency hedge for a larger position in water.
For “growthier” options in Canada, I think both HEO and PUR are showing some potential. HEO is a micro-cap and trades on the Venture exchange so be very cautious. To me it is far too risky now but one to watch. PUR has a small market capitalization and can have lumpy revenues but it trades on the TSX. It is showing some good promise but its technology to examine pipelines can be used for oil or water infrastructure, so is not purely a water play.
Concluding Remarks
Water, and its growing scarcity, is a well-established secular trend. Investing in the theme requires a long-term perspective since the underlying drivers of the trend reflect long-term forces at play. I doubt anyone will “get rich quick” by investing in this theme, but for steady, extended performance (e.g., 5-10 years or more) I believe there is solid potential in this theme.
Table 2 – Companies Involved in Water-related Activities
Security Sub-industry Class
Market Cap Forward P/E Ratio
Debt /Capital
5 Year Price
Change
Dividend %
Pure Technologies Ltd. (TSE:PUR)
Electronic Equipment
$246M 45 0% -11% 2.7%
H2O Innovation Inc (CVE:HEO)
Industrial Machinery
$64M 29 15% 41% 0.0%
Danaher Corporation (NYSE:DHR)
Health Care Equipment
$57.8B (US)
21 27% 101% 0.7%
Ecolab Inc (NYSE:ECL)
Specialty Chemicals
$37.4B (US)
27 44% 102% 1.1%
Roper Technologies Inc (NYSE:ROP)
Industrial Conglomerates
$22.3B (US)
24 46% 219% 0.6%
Agilent Technologies Inc (NYSE:A)
Life Sciences Tools & Services
$17.7B (US)
26 28% 81% 1.0%
IDEXX Laboratories Inc (NASDAQ:IDXX)
Health Care Equipment
$14.8B (US)
56 49% 280% 0.0%
American Water Works Company Inc (NYSE:AWK)
Water Utilities $14.2B (US)
26 46% 131% 1.9%
Waters Corp (NYSE:WAT)
Life Sciences Tools & Services
$13.6B (US)
23 43% 103% 0.0%
Pentair plc. Ordinary Share (NYSE:PNR)
Industrial Machinery
$11.8B (US)
18 50% 49% 2.1%
Xylem Inc (NYSE:XYL)
Industrial Machinery
$9.2B (US) 22 46% 81% 1.4%
HD Supply Holdings Inc (NASDAQ:HDS)
Trading Cos & Distributors
$8.1B (US) 12 79% 116% 0.0%
Companhia de Saneamento Basico (ADR) (NYSE:SBS)
n/a $6.3B (US) 6 39% -30% 0.0%
Aqua America Inc (NYSE:WTR)
Water Utilities $5.9B (US) 24 46% 83% 2.3%
Mueller Water Products, Inc. (NYSE:MWA)
Industrial Machinery
$1.8B (US) 25 51% 199% 1.4%
California Water Service Group (NYSE:CWT)
Water Utilities $1.7B (US) 27 38% 96% 2.0%
Sources: YCharts and F.A.S.T. Graphs as of April 28, 2017.
businesses are going to be the biggest winners, and because it can be difficult to find “pure play” water companies (some water-themed companies also do things that are not water-related).

Canadian MoneySaver z https://www.canadianmoneysaver.ca z JUNE 2017 z 11
MoneyTip
Earnings per share (EPS) is the portion of a company's profit allocated to each outstanding share of common stock. Earnings per share serves as an indicator of a company's profitability.Calculated as:
= Net Income – Dividends on Preferred Stock
Average Outstanding Shares
When calculating, it is more accurate to use a weighted average number of shares outstanding over the reporting term, because the number of shares outstanding can change over time. However, data sources sometimes simplify the calculation by using the number of shares outstanding at the end of the period.
Breaking Down 'Earnings Per Share - EPS'Earnings per share is generally considered to be the single most important variable in determining a share's price. It is also a major component used to calculate the price-to-earnings valuation ratio.
For example, assume that a company has a net income of $25 million. If the company pays out $1 million in preferred dividends and has 10 million shares for half of the year and 15 million shares for the other half, the EPS would be $1.92
What is 'Earnings Per Share - EPS'?
Michael Patenaude, BA, MA, is an avid personal finance enthusiast living in Ottawa. money4retirement.ca, co-Creator of the McMurtry Investment Report. Email: mrpatenaude@ gmail.com. Disclaimer: this article is not intended as investment advice nor is it a solicitation to purchase securities. Disclosure: Michael owns shares in CWW and GOOG.
1 http://globalriskinsights.com/2016/12/economic-cost-global-water-scarcity/
2 http://advances.sciencemag.org/content/2/2/e1500323.full3 https://www.unesco-ihe.org/sites/default/files/wwdr_2015.pdf4 http://www.forbes.com/sites/toddmillay/2016/11/28/investing-
in-water/#2dae423a44f05 http://www.economist.com/node/217095306 http://www.forbes.com/sites/toddmillay/2016/11/28/investing-
in-water/#2dae423a44f07 http://www.valuewalk.com/2016/11/google-water-harvesting-
raft-save-water-scarcity-africa/8 https://patents.google.com/patent/US9469383B1/en
(24/12.5). First, the $1 million is deducted from the net income to get $24 million, then a weighted average is taken to find the number of shares outstanding (0.5 x 10M+ 0.5 x 15M = 12.5M).
An important aspect of EPS that's often ignored is the capital that is required to generate the earnings (net income) in the calculation. Two companies could generate the same EPS number, but one could do so with less equity (investment) - that company would be more efficient at using its capital to generate income and, all other things being equal, would be a "better" company. Investors also need to be aware of earnings manipulation that will affect the quality of the earnings number. It is important not to rely on any one financial measure, but to use it in conjunction with statement analysis and other measures.
Read more:
Earnings Per Share (EPS) http://www.investopedia.com/terms/e/eps.asp#ixzz4hAF6FSR4
Follow us: Investopedia on Facebook
Found at: http://www.investopedia.com/terms/e/eps.asp

12 z Canadian MoneySaver z https://www.canadianmoneysaver.ca z JUNE 2017
ReadersWriteLessons I’ve Learned 22 Years After Taking Early Retirement-Part 3
In 1994, under the Factor 80 early exit program,
I was forced to retire at an early age of 54 due to
downsizing in the Ontario Public Service (OPS).
I thought sharing how life has treated me and the
lessons I learned after early retirement might be of
interest to CMS readers. Lessons 1 through 6 were
published in the March/April 2017 edition of CMS.
Lessons 7 through 11 were published in the May 2017
edition. Lessons 12 to 14 below conclude the series.
12. It pays to purchase a cemetery lot and pre-
arranged funeral plan for less stress and cost when
death happens.
In January 1985, my wife and I purchased a
cemetery lot from Highland Memory Gardens, with
a good location, for $1,000 ($750 for lot + $250 for
perpetual care paid to a trust). Our lot contract
covers two traditional burials and two cremations,
or four cremations. A similar lot now costs $8,000
for few remaining unsold ones. We also purchased a
joint Eden Rose Memorial Bronze and Doric Granite
Base, already installed, showing our names and dates
of birth. The date of death will be added at the time of
our death. The memorial will definitely cost more at
the time of our death.
In April 1999, I purchased a Guaranteed Funeral
Services Contract (after specifying details of my
choice) with a funeral home near our place and
church, for $6,438. To fund my pre-arranged funeral,
I purchased Forethought Life Insurance Death Benefit
Policy, for the same amount of $6,438, designating
my wife as my beneficiary. The funeral home is the
designated beneficiary of my insurance policy. Upon
my death, my wife will turn over the policy to the
funeral home. The funeral
home will in turn submit
the policy to Forethought
together with proof of my
death. Any death benefits
paid by Forethought to the
funeral home over the total
charges entered into by me with the
funeral home ($6,438) will be paid to my wife or estate
at that time. As of Feb 7, 2017, the value of the Policy
was $8,128.00. The benefit amount continues to grow
and additional interest is applied daily.
13. My wife and I have been travelling a lot since our
early retirement (1994 and 2000) and after our two
sons moved out in 2000. We enjoy travelling because
to us, while it may be expensive, it’s the best form of an
education a person may have in his/her lifetime.
We enjoy cruising, the most popular mode of travel in
the last 20 years because it’s affordable, you pack only
once, and see interesting places while the ship is in
ports of call.
Taking organized or escorted tours also interests us.
In our experience, if you wanted to see a number of
attractions in different places, taking escorted tours is
the way to go, where almost everything is arranged. As
well, because of the economies of scale and negotiating
power of established tour operators, it would cost you
more and have more logistic problems if you make all
the travel arrangements yourself.
We also enjoy taking all-inclusive vacations in the
Caribbean, which is the most economical travel
alternative amongst the three travel modes. This is
Romeo R. FernandezA Canadian MoneySaver Reader

Canadian MoneySaver z https://www.canadianmoneysaver.ca z JUNE 2017 z 13
14. The most important lesson I learned after
retirement is health is wealth! My family doctor and
other health care providers are telling me that my wife
and I are doing the right thing—travelling as much as
we can while we are still able to do it, enjoy travelling
and still have each other. They told me they have
patients much richer than us but can’t travel because
of poor health.
In 2003, I had two life-threatening events. I had a total
thyroidectomy in March 2003, where both my thyroid
glands were removed because the nodules on them
were detected and tested to be cancerous. While I have
my cancer beaten, my voice became weak and raspy
after the surgery. In November
2003, I had an almost fatal heart
attack while under observation in
the hospital. I was in the ICU for 7
days, another 10 days to recuperate
before having an angioplasty
coronary stent procedure done on
November 14, 2003. Apart from my
12-month successful participation
in the Cardiac Rehabilitation &
Secondary Prevention Program
at the Toronto Rehabilitation
Institute (subsidized by the
government), the healing power
of the love and intimacy of my
family and close friends contributed to my speedy and
successful recovery in body and mind.
At this stage of my life, due to wear-and-tear, I have a
chronic low back and hip problems due to degenerative
disks and bursitis, chronic knee pain due to breakdown
of cartilage in the joints area, and ankle problem due
to Achilles tendonitis and osteoarthritis to contend
with. To be given a second lease on life, I consider these
musculoskeletal and arthritis problems just challenges
because with the use of braces and physiotherapy
exercises, I can still enjoy walking and hiking even in
the mountains. I don’t even feel the pain when I use
the beach in the Caribbean. My wife and I will continue
travelling, until my wife has to push me in a wheel
chair!
So my advice to you out there is to find time to also
invest in your health. Without it, you won’t be able to
enjoy your wealth!
because a one bottom, competitive price (especially
during off-season) includes return air, transfers
between the local airport and the resort, all what you
can eat and drink (although we don’t drink alcohol),
enjoy the day activities (especially the beach), and
night entertainment.
We’ve been kidding our two sons that we’re already
spending their inheritance. They told us they are not
expecting any inheritance from us, their main wish is
for my wife and me to enjoy our old age and retirement.
How sweet to hear that from them!
Modesty aside, in 2016 we took four different cruises
with large and luxurious ships
involving 52 days at sea, and an
escorted tour of 11 days.
But my wife and I travel smart. We
wait for the last minute deals or
special promotions from cruise lines
and tour operators. For cruising,
we enjoy loyalty discounts from
cruise lines for repeat guests. We
also look for interesting itineraries
with significant discounted fares
(up to 70% of the brochure price)
from Vacations-to-Go, the largest
wholesaler of unsold cabins for
various cruise lines. Apart from enjoying the significant
rates from VTG, we still enjoy the loyalty benefits of the
cruise lines we regularly sail with, e.g. priority check-in
and disembarkation, use of free internet, free laundry,
etc.
For escorted tours, our primary consideration is the
itinerary. And waiting for last minute deals and special
promos and discounts for past guests help even if we
pay in U.S. dollars with our Canadian dollar having a
low exchange rate. Some cruise lines and tour operators
now offer in Canadian fares at par.
For all-inclusive vacations in the Caribbean, I deal
directly with SunWing or Signature Vacations (under
one company) which offer very competitive prices,
lower than if I used a travel agency. We stick to staying
with a specific chain of resort hotels where we enjoy
their loyalty benefits like complimentary better room
location, even if we booked through a tour operator.
...find time to also
invest in your health.
Without it, you
won’t be able to
enjoy your wealth!

14 z Canadian MoneySaver z https://www.canadianmoneysaver.ca z JUNE 2017
Real Estate
Negotiating The Operating Costs As Rent – For Independent Or Franchise Commercial Tenants
R eaders of our new book, Negotiating Commercial Leases & Renewals For Dummies, will learn (in part) that there are aspects of the operating costs that can be changed to the tenant’s favor
(although most commercial real estate professionals may explain that operating costs are not negotiable). The landlord wants to make sure that the tenants pay for all the operating costs for the property. There’s nothing unusual about that. But when The Lease Coach does an operating cost analysis for groups of tenants in one building, we frequently find that the tenants are subsidizing capital improvements that the landlord is using to enhance or increase the building’s value or allocating costs in ways that are outside of industry norms.
The majority of commercial and retail lease agreements stipulate the specific components of the operating costs that the tenants need to pay for. Typical examples of valid operating costs (those which benefit all tenants leasing in a commercial property, rather than just one or two tenants) include general maintenance, painting, lawn cutting, snow removal, property insurance, and so on. Almost every lease agreement has an operating cost clause that typically defines these common area maintenance charges in a short- or long-form manner. From a commercial tenant’s perspective, longer is better than shorter as it creates certainty.
If a formal lease document uses sufficient detail to define what constitutes an operating cost, then the commercial tenant has a fighting chance to at least examine, question, and negotiate each item. We remember one Florida landlord charging an annual fee to all tenants to have a pool of money available for hurricane damage not fully covered by insurance. Upon closer inspection, we noticed there was no end to this billing or reserve fund – tenants were required to pay it forever. If a tenant moved out at the end of their lease term, they did not get any of the money back that they had paid – even if there had been no hurricane damage. The landlord simply created a slush fund that they could use as they pleased. Look at these types of odd clauses and scrutinize them carefully—after all, it’s your money.
Jeff Grandfield and Dale Willerton – The Lease Coach
If a commercial tenant occupies seven percent of a commercial property, they can typically be required to pay their proportionate share—seven percent—of the operating costs as additional rent. But not all tenants use operating costs proportionately. For example, would a hair salon or a bookstore use more water? Would a convenience store or a bank contribute more to parking lot trash collection? Would someone on the first floor or the 20th floor of a building use the elevator more frequently? Have your proportionate share of the operating costs (as a percentage number) actually stated in your lease agreement. Don’t be afraid to question these costs and your proportionate share.
You’ve likely heard the old cliché that nothing’s certain except death and taxes. Well, you can add ever-rising operating costs to that short list, too. Rarely do operating costs go down, and they most certainly rise over time. Many commercial tenants fall victim to landlords who abuse the operating cost budget and use the tenant’s money to polish their own jewel—their property.
In some cases, a slothful or cash-strapped landlord may have skimped on regular maintenance, but after the property is sold to a more reasonable landlord several years’ worth of deferred maintenance has to be caught up at the expense of the present tenants. With tenants trying to budget for the year, The Lease Coach often successfully negotiates for a fiveto ten percent cap on operating costs so that the landlord can raise them annually at that amount at a maximum.
For a copy of our free CD, Leasing Do’s & Don’ts for Commercial Tenants, email [email protected]
Dale Willerton and Jeff Grandfield are Commercial Lease Consultants who work exclusively for tenants. Got a leasing question? Need help with your new lease or renewal?
1-800-738-9202, [email protected] or visit www.TheLeaseCoach.com.

Canadian MoneySaver z https://www.canadianmoneysaver.ca z JUNE 2017 z 15
Alternative Strategies
Private Equity Investments And Your Registered Savings And Income AccountsBob Carter
The art and science of building your financial plan depend on facts, advice and having the conviction to make hard decisions. You also need the benefit of insight to perceive
market and economic change and courage to make hard decisions light of these conditions. Given all you have heard at how illiquid private investments are – should you hold them only in non-registered form or could they be included in your RRSP and or RRIF?
The Answer Is ComplexAccepting that readers of this column may currently
hold or are considering private equity investments, the question remains: what have you done up until now and have you considered your needs for income and exit if you have chosen to include them in a registered plan?
Your Investment PlanBasic investing tenets suggest investors and their
advisors build portfolios that hold a diversified collection of different asset classes. Cash and near-term liquid investments will ensure safety and available capital to take advantage of buying opportunities. Intermediate and long-term fixed income bonds provide income and possible capital gains as interest rates decline. Equities are included to provide dividends and total return growth. Your specific asset mix or allocation should reflect your age, investment goals and personal tolerance for risk.
Many investors today have grown wary of being concentrated only in these conventional market securities and now look to private equity (or exempt) markets seeking better returns and an alternative to the status quo. Loading up on these private and exempt market securities without the same standards of diversification and care in their selection – particularly inside RRSPs and RRIFs – invites potential disaster.
LiquidityStrong performance history and the allure of tax-
deferred growth provide the motivation to hold private equity and fixed income investments inside RRSP accounts. The fit seems obvious but you must take care to use sound portfolio management techniques – even though these are non-traditional securities.
In a conventional registered account – you can buy or sell investments to meet demands for income and or take advantage of changing market conditions. This may not be the case with exempt or private equities. While many private equity issuers are offering more enhanced liquidity options than ever before, they still have no formal secondary market and any liquidity provisions may be limited or subject to cost. This requires you take extra care to select only those investments you are willing to hold until maturity, realizing the risk that the results are by no means certain.
Structure:The structure of your portfolio must also consider the
need for income in retirement. This means ensuring a pre-determined amount of cash is available to meet the government-mandated minimum withdrawal amount. One possible technique would be to build a portfolio of investments with expected completion dates that mature according to a set schedule.
Bond ladders are portfolios in which equally allocated dollar amounts are held in either 5 or 10-year schedules. For example – a bond ladder with a 5-year schedule would see 20% of the allocated amount invested into a 1, 2, 3, 4 and 5-year security. Every year, one bond matures and the strategy requires the purchase of an additional bond at the end of the schedule, in effect a new 5-year holding.

16 z Canadian MoneySaver z https://www.canadianmoneysaver.ca z JUNE 2017
This structure removes the guesswork behind what an investor should buy and removes much of the market’s interest rate risk, exposing you to market volatility for only a 20% position. Extending the strategy to 10 years allocates only 10% portions in a similar structure.
Such a laddered structure can be applied to your holdings of private equities where equal amounts (or as close as possible) are invested in projects maturing each year over a 5 or 10-year horizon. This structure is far from perfect as delays happen. Your strategy must recognize that even the best of plans may be challenged if projects fail to meet their exit dates.
If this happens, investors must take care to hold back enough cash to meet their annual income distribution requirements before reinvesting any remaining capital.
Risk:Private equity investments are not risk-free. Monies
contributed to registered savings accounts are subject to risk – perhaps greater risk of loss than many other conventional securities and are not for the faint-of-heart. Investors must remember that catastrophic loss in registered accounts offer no financial buffers such as capital loss tax treatment and can only be made up by depositing new funds – which may or may not be available depending on their available contribution room, financial situation and time horizons.
It might not make sense for investors nearing the common conversion age from RRSP to RRIF to hold
too large a position in long-dated private equities. If possible, investors should shorten the duration profile of their holdings to provide the required income according to a liquid schedule.
Plan Ahead. Be Flexible, And Expect Challenges.
Finally, it might make sense to incorporate traditional investment securities (stocks, bonds, ETFs and mutual funds) with private equities in the same account in order to provide an additional buffer, income source and liquidity to meet your diversification and income requirements.
The allure of potentially higher private equity returns in registered savings and income accounts is unmistakable. Investors need to take care to structure these accounts with the end in mind and not simply “load up” on too much of a good thing.
Bob Carter, BA, GBA, CIM, is currently Regional Vice President of Sales with one of Canada’s leading life insurance companies. Bob is a recognized speaker, published author and contributing editor to Canadian MoneySaver Magazine and Benefits Canada online and can be contacted at [email protected].
The opinions expressed are those of the author and not necessarily those of Canadian MoneySaver (CMS), The National Exempt Market Dealers Association (NEMA), any Exempt Market Dealers or Issuers.
COMING EVENTSEVENT/TOPIC PRESENTER DATE/TIME/REGISTER
Toronto MoneyShow September 8, 9, 2017
Metro Toronto Convention Centre, Toronto, Ontario
Canadian Moneysaver SeminarSpeakers include
Keith Richards, Colin Ritchie, Benj Gallander, Derek Foster,
Ryan Modesto
Sept 9, 2017 • 9am to 3:30pmRegister FREE:
Tel: 1-800-970-4355Online:
www.torontomoneyshow.com

Canadian MoneySaver z https://www.canadianmoneysaver.ca z JUNE 2017 z 17
Book Excerpt
Understanding Deductibility
Calum Ross with Simon Giannini
P aying tax is unavoidable, but most Canadians don’t realize that they can dramatically reduce their tax bill while at the same time building a retirement investment portfolio.
Our American cousins are gifted with a powerful tool for wealth creation the moment they purchase a home. In the United States, mortgage interest is tax deductible (even on your personal-use home). The result is that, year after year, millions of Americans receive a tax refund courtesy of Uncle Sam.
Canadian tax law doesn’t allow for this. When we borrow money to purchase a principal residence, we pay interest on that money. Over the lifetime of the mortgage, the interest paid dramatically inflates the total amount paid back in addition to the principal of the loan. The interest kills us.
Imagine if we could deduct a large portion of that expense off our taxes every year. What kind of difference would it make over the lifetime of your mortgage? The answer is a lot. Imagine you have a $400,000 mortgage on your home residence at 3 percent. Even in the low-interest-rate environment of today, you’d still pay $169,053.58 in interest over the twenty-five year life of the loan.
Thinking in terms of the time value of money and the highest and best use of capital, that’s a simply enormous amount of money gone, never to return to you. But what can you do, right? It’s the price of owning a home.
Sort of. If you understand interest deductibility, you will do a few things differently, and in a roundabout way you will get some of the lost interest payments back in the form of a tax deduction.
As you know, borrowing to invest in real estate or other asset classes is one of the most important steps you can
take to ensure you have a stable and secure retirement. In a moment, we’ll discuss the proper steps for maximizing interest deductibility, but first let’s make sure we have a rudimentary understanding of interest deductibility.
But before launching into that, here would be a good place for another reminder to always seek professional advice from a licensed and proven tax accountant. Few things in the realm of personal finance more resemble a Pandora’s Box than the world of taxes. Nothing you read in this book should be considered tax advice. But it’s important to discuss basic deductibility, since it’s a key concept of borrowing to invest.
It comes down to this: Interest paid on money borrowed to invest can be deducted off your tax bill. Interest paid on money borrowed for other reasons cannot. The Income Tax Act allows you to deduct any interest expenses if the borrowed money is invested “to produce income.”19 Again, consult with your accountant for professional advice. The point remains, though, that we have found a way to minimize tax expense. All we have to do is borrow money for the purpose of investing.
This can help you (immediately) on your personal residence. You’ll never be able to deduct interest on the portion of the mortgage that is used to purchase your principal residence, but you can borrow additional funds against your home for the purpose of investing, thereby creating a tax-deductible interest expense.
Additionally, please be aware that the interest paid on money borrowed for personal reasons isn’t tax deductible. This includes those luxurious liabilities. Not only are expensive toys a terrible “investment,” but they’re also not beneficial toward an effective tax strategy. The only way to create a tax advantage through borrowing is to borrow for the purpose of investment. It’s the next best thing to having what our American neighbours have.

18 z Canadian MoneySaver z https://www.canadianmoneysaver.ca z JUNE 2017
So, what should you do now that you know about interest deductibility on funds borrowed for the purpose of investing? First, always be leveraged when it fits your financial and psychological profile. Leverage your personal residence and put that money to work in the marketplace.
Second, deduct the allowable interest expense from your taxes. Hire a great accountant who can help you with this. Third, don’t borrow money for toys. If you need to buy fun luxuries, please wait until you have the financial means to do so with cash. Fourth, always consider the
after-tax cost of borrowing and the after-tax rate of return when analyzing investment debts and returns. This final step is the topic of our next section and a step that financial wizards always take.
Excerpted from The Real Estate Retirement Plan (Page 115) by Calum Ross with Simon GianniniCopyright © Calum Ross, 2017All rights reserved.www.dundurn.com
Call for Contributors
Canadian MoneySaver is looking for more Contributing Editors to write for us!
CMS is an excellent forum for your dynamic and unique voice to offer up wisdom and share newsworthy facts, opinions and advice that will connect our readers to the world of finance, investment and money-conscious ideas.
Our philosophy is that individual investors should take charge of their financial life. As a Contributing Editor, you are an expert in your respective fields. Your editorial contribution will help teach investors how to properly diversify and position themselves for a prosperous, long-term investment life.
Help us spread the word!
■ An acclaimed investment advisory with a recognized reputation for providing a trustworthy and down-to-earth service since 1981.
■ An independent, conflict-free financial publication primarily funded by its members.
■ 18,000 active subscribers.
■ Recent studies suggest that we have over 40,000 readers including print and on-line magazine sharing.
■ Carried in most libraries, offices and Chapters/Indigo stores throughout Canada and publishes monthly with three double issues (July/Aug, Nov/Dec and March/April).
www.canadianmoneysaver.ca [email protected] Call 519-772-7632

Canadian MoneySaver z https://www.canadianmoneysaver.ca z JUNE 2017 z 19
Legal And Big Picture Planning
Health Care Spending Accounts
Colin Ritchie
Do you enjoy wrangling with insurance companies over which expenses are or are not covered under your extended benefits plan? Confused about why your dental plan
that promises 100% coverage is only paying $600 of a $1,00 dental bill? Ecstatic about wasting your and your doctor’s time getting a referral letter so that your insurer will pay for physio, massage or psychologist expenses? If you can answer “yes” to all the above, then please stop reading immediately and continue with your day
On the other hand, if these experiences resonate deep in your soul on a primal level and you work for yourself or own your own company, pour an extra coffee, put on your reading glasses and prepare to save money. There is a solution to the problems above that can reduce what you pay for medical expenses over time: a Health Spending Account. With the assistance of Adam Hussey of Blendables (formerly known as “Your HSA”), the next several pages will hopefully become your blueprint to savings.
The BasicsBefore providing more reasons why these plans can
be game changers, particularly for those of you with companies, let’s begin with basic principles. A Health Spending Account (“HSA”) is an arrangement between your company (or yourself if you are a sole proprietor) and the company that sells these plans (the “Plan Provider”) whereby your company agrees in advance to cover employees (including yourself ) medical expenses up to a set amount that your company and the Plan Provider agree is reasonable based on your budget and employee salaries. Your company either pays a monthly amount to the Plan Provider into a separate account for each employee or pays the Plan Provider on an as-needed basis, depending on the terms of the plan. For one- man bands,
LIND
A M
ACKI
E PH
OTOG
RAPH
Y
whether incorporated or otherwise, it is recommended to go with the pre-pay option, as the Canada Revenue Agency (CRA) might question whether your HSA is really insurance if you’re only paying for coverage after the fact rather than putting money into an account before expenses occur.
In any event, regardless of which funding option you choose, every time an employee (including the business owner) has a medical expense, he sends it to the Plan Provider, who either reimburses the employee from the money already in that employee’s account, or contacts your company to request payment. The Plan Provider then reimburses the employee for that medical expense.
(**Note... for our cost+ plan we still ask for monthly contributions based on the maximum however unused contributions can be used for the next year’s plan or be reimbursed back less the admin fees. Now other companies do pay as you go but they will also charge high start-up fees when an employee is added to a plan.)
How Does The Plan Provider Make Money?
Although the people running or working for HSA Plan Providers may be wonderful individuals, they do not provide their services for free. Most charge an administration fee on each receipt processed, plus taxes (GST always and PST in some provinces) that is typically 10%, although some plans do charge less. Some plans charge a set annual fee per employee, which can save money if there are a lot of expenses each year, although they may cap total yearly expenses per employee that can be processed. Some plans charge a set-up fee as well. It can be possible to set up a plan privately and find someone else to act as the plan administrator. These plans cost perhaps $1,500 to $2,000, plus whatever the person
20 z Canadian MoneySaver z https://www.canadianmoneysaver.ca z JUNE 2017
who acts as your administrator charges. On the other hand, this increases the chances of later problems with the CRA if the administrator is merely a rubber stamp; a good HSA provider also acts as a gatekeeper who vets submitted expenses along the way and disallows those that are offside. For most of us, it makes sense to go with a plan provider.
Tax ConsequencesIn addition to the numerous other advantages I’ll
itemize in a few paragraphs, the potential tax savings through a HSA are often substantial when compared to paying those expenses out of your own pocket as an individual. When paying for these expenses personally, you are only eligible to claim a tax credit on the portion of your medical expenses that exceed the lower of 3% of your taxable income or $2,237 (as of the date of this article). Moreover, even if you have enough expenses to qualify, since the eligible amount is only a credit rather than a deduction, this also means that you would receive a non-refundable tax credit equal to about 20% of the eligible amount. For a self-employed person living in B.C. for example, this means missing out on deducting 47.7% of the medical expenses starting with dollar one for those in the highest tax bracket. Remember, tax rates vary by province of residence.
On the other hand, if you are an incorporated business owner, you would have had to pay tax on the extra money you needed to flow out of your company to cover medical expenses. As a result, your tax savings are the tax avoided on this money. Although a traditional medical plan funded by your company would have also covered this expense, as you’ll see below, those plans may still require families to pay a substantial portion of medical expenses out of their own pockets. In contrast, a HSA may potentially eliminate the majority of extra costs.
Benefits Of An HSA Versus An Extended Benefits Plan
A. Cost Certainty
In talking to clients and advisors who work in the group insurance space, one of the biggest frustrations is the yearly squabble and uncertainty about the cost of next year’s extended health premiums. It usually isn’t a question if your premiums are going to increase, but by how much. Want to shop around for a new benefit provider? This may save money in the short-term but it is not uncommon for insurers to offer lower rates to attract
business and to boost costs later. Of course, even if you are willing to change insurance companies every few years to save dollars, this will cost you in time and frustration in continually adapting to the practices of new insurers and learning the different rules and coverage limits for each new plan.
By contrast, a HSA allows you to budget exactly how much you are willing to spend per employee each year so that your costs don’t increase unless you want them to.
B. Ability To Carry Forward Unused Benefits
If you don’t use a traditional benefits plan one year, the only winner is the insurance company, who still gets to keep all the premiums paid into the plan. By contrast, a HSA can be set up so that unused benefits in one year can be rolled over indefinitely so that there is a good chance that the employee will benefit from his employer’s generosity at some time. It also means less money thrown away and more rewards for employees with traditionally low medical expenses. In addition, employees have the option to “save up” for big ticket medical expenses coming their way in the future, such as braces for their children, laser eye surgery or fertility treatments, rather than feeling like they need to use up their benefits each calendar year on services they don’t really need just so they don’t miss out.
C. Flexible Coverage
A HSA provides an annual amount per employee that can be used for any qualifying medical expense, along with the unused balance from any previous years. That means less wastage as the employee can apply his HSA against his actual medical expenses that year rather than according to the rules and coverage limits of a traditional plan that may not provide full coverage and may also result in the employer paying for benefits that are not needed.
For example, if an employee’s spouse already has a good benefits plan, that employee really doesn’t benefit from his own extended benefit. On the other hand, even the best plans typically have coverage limits or won’t cover all medical expenses. If that employee had a HSA instead, he would be able to use this account to cover the amounts not reimbursed under his spouse’s plan and bank the unused portion for the future, such as if their children need braces in a few years.
By contrast, a traditional plan has rigid limits on the types of benefits provided, how much can be charged

Canadian MoneySaver z https://www.canadianmoneysaver.ca z JUNE 2017 z 21
per visit or how much can be spent in total each year on a certain category of expenses. It is far more likely that traditionally more expensive coverage may provide less benefit to that employee if the coverage he needs doesn’t mesh exactly with the coverage a traditional plan actually provides.
D. Elimination Of Deductibles And Coverage Limits / More Cost-Efficient Coverage
Since there are no coverage limits per visit or type of expense, other than how much money is left in that employee’s own HSA, employees are only out of pocket if their medical expenses that year exceed the account balance. That means full coverage for all drug, dental, chiro, physio, naturopath, etc. expenses each year if they stay under that amount with no out-of-pocket expenses to that employee.
By contrast, traditional plans have a variety of limits that ultimately mean more money out of employees’ pockets along the way, even if that employee only has modest medical expenses. Glasses are the best example, as many plans limit coverage to only $300 or less every two years, regardless of the employee’s actual needs or costs.
Consider the following as an additional example - even though an employee spends $1,500 at $175 per session on counselling services that year when going through a divorce and has no other medical expenses that year, coverage might be limited to $60 per visit and $600 per year. A HSA would cover the full $1,500 rather than just $600 as long as the employee had a large enough account balance. In other words, the employee would get the benefit of having no other medical expenses that year rather than the insurance company.
Furthermore, it is often the case that 80% or 100% coverage in a traditional benefit plan can still leave an employee with a rather large bill. How is this possible, you may ask? It is because they reimburse only 80 or 100% of the “covered amount”. For example, the insurer may decide that dentists should only charge $600 for certain types of covered services, while the going rate is really $1,000. As a result, an employee with 100% dental coverage will still have to pay $400. Again, a HSA eliminates this problem.
E. A Simpler, Easier Process
Once the HSA is in place, the employee only needs to submit receipts to the HSA provider and wait for a
cheque. There is no need to get doctor’s notes to claim reimbursement, to try to figure out coverage limits or to wrangle with insurance companies who may initially deny claims that are ultimately valid. As long as the expense is a qualifying medical expense and there is enough money in that employee’s HSA, the claim is covered and paid. Since HSA providers are usually paid per receipt reimbursed, they make more money by approving expenses, compared to insurance companies, who benefit from denying rather than paying claims! Moreover, like traditional extended benefits plans, most HSA’s now allow employees to submit claims online rather than mailing in receipts.
Finally, how many employees lose out on medical benefits because they don’t understand their coverage or because they can’t be bothered to get doctor’s notes prescribing massage, physio or similar treatments? Since HSA’s don’t have these issues, the chances of employees missing out on benefits because of the “hassle factor” are vastly reduced.
F. More Transparent, Tangible Value To Employees
Since the cost of most extended health plans is not broken down and explained to employees, how much do they really appreciate such plans? Moreover, if they are still paying for a lot of their medical expenses out of their own pockets due to the other issues mentioned previously, would they think it was money well spent on their behalf if they did know the price tag?
On the other hand, a HSA tells employees exactly how much their employer has contributed towards their family’s medical expenses. Because of this knowledge and HSA’s ease and flexibility of use, the average employee is both more likely to appreciate their employer’s largesse and more likely to benefit from it.
G. Coverage Of A Wider Range Of Expenses
HSAs cover expenses that traditional plans do not. In addition to not capping vision expenses, employees can even use their HSA’s to cover laser eye surgery, orthodontics and fertility treatments, to name a few.
H. Wider Potential Range Of Dependants
Most traditional benefits plans limit an employee’s dependants to spouse and dependant children 25 and younger. Under a HSA, this arbitrary age distinction

22 z Canadian MoneySaver z https://www.canadianmoneysaver.ca z JUNE 2017
can be eliminated. In fact, employees may even be able to claim expenses they incur on behalf of economically dependant parents. Although these types of plans may be best suited for the business owner and his own family and may not come about too often, this feature can be extremely valuable when it does.
I. Different Benefit Levels For Different Classes Of Employees
In some instances, it may be possible to set up a HSA plan so that there is a higher amount set aside for executives and the owners of the business than for more junior employees so that all employees can benefit but the business owner and executives might benefit more. On the other hand, it is important to discuss this issue carefully with the HSA provider when setting up the plan in order to ensure that you are not potentially running afoul of the CRA. Although there may be no hard and fast limits to what amount can be set aside for a business owner relative to his salary, it cannot be an open chequebook.
J. No Exclusions For Pre-Existing Conditions
Some traditional benefit plans may refuse to provide coverage for pre-existing conditions. A HSA has no such issues.
Potential Drawbacks
A. Insufficient Coverage For High Expense Employees
The most obvious downside to a HSA compared to a traditional benefits plan occurs when the employee has medical expenses well in excess of their HSA limit. In such cases, if the medical expenses are of a short duration, then perhaps the employee would still win in the long run through a HSA during more typical years. If the employee has chronically high expenses, then this is another story. Although the employer may still benefit by choosing a HSA, since coverage is capped at the amount contributed for that employee that year and the employer does not have to worry about increases to insurance premiums that come about when employees make a lot of claims under traditional plans, the employees would ultimately suffer. In the case of prescription drugs, provinces like B.C. and Ontario have a drug plan that subsidizes covered medication after the employee has paid a set amount per year towards these expenses out of their own pocket. In B.C., it is the “Fair Pharmacare” Program.
Unfortunately, that may not cover all potential medical expenses. Accordingly, it is possible for the employer to also provide a special type of extended benefits plan that only kicks in under extreme situations after the employee has already spent a predetermined amount towards medical expenses. In the end, this is something that needs to be discussed before proceeding with a HSA.
B. Travel Risk
One of the hidden benefits of traditional extended benefits packages is that they often include travel insurance, which can be a life saver for employees hurt while out of the country, even if only during that short trip across the border to get gas and groceries. Fortunately, most HSA providers also sell an “add on” travel insurance product that can cover this gap that is often extremely inexpensive. Accordingly, I strongly recommend exploring this option
C. Coverage Limits For Sole Proprietors And Unincorporated Business Owners.
If you work for yourself and are not incorporated, then there are hard limits to how much you can deduct under a HSA. First, this business must be your main source of employment and you must not receive more than $10,000 from other sources. If you are a sole proprietor, the limits are $1,500 for each of you and your spouse and $750 per dependent child. In other words, for a husband, wife and child, they can only deduct $3,750 per year. If you are not incorporated but have employees, the amount you can deduct will be limited to the coverage you provide to these employees.
ConclusionAlthough they have been around for some time, HSA’s
remain a secret to most business owners. Hopefully the information in this article change this reality and allow many more Canadians to provide cost-effective medical coverage for their families and employees so they have more money for the other things in life.
Colin S. Ritchie, BA.H. LL.B., CFP, CLU, TEP and FMA is a Vancouver-based fee-for-service lawyer and financial planner who does not sell investment or insurance, just advice. To find out more, visit his website at www.colinsritchie.com.

Canadian MoneySaver z https://www.canadianmoneysaver.ca z JUNE 2017 z 23
Investment Matters
Money And Marriage: It Ain’t Easy
T he leading cause of marital stress and the number one reason for divorce: Money.
Whether good or bad economic times, romantic partners argue about money.
Whether struggling to make ends meet, comfortably middle class, or fortunate to be among the 1%, money issues trigger conflict.
It’s Not Just About MoneyOn the surface, disagreements revolve around saving,
spending and investing money.
But dig below and you’ll find the root of contention isn’t money. It’s bigger and deeper than money. And it’s complicated and thorny and knotty and tricky and just plain tough.
The real issues sowing seeds of conflict? Let’s start with not understanding what money means to your partner. When you don’t understand each other, it’s awfully tough to find common ground.
To illustrate what I’m talking about, consider fictional Julie and Jake. Let’s say J & J agree to replace their ten-year-old clunker. But, try as they do, they’re unable to move forward, disagreeing on what kind of car to buy and how much money to spend. Jake prefers a sub-compact, gently used car with minimal maintenance costs whereas Julie wants all the bells, whistles and horsepower.
At first glance, this is a run of the mill money squabble. Lift the hood and you’ll see something else. You’ll see that, for both Julie and Jake, their spending decisions are informed by their personal relationship with money, a relationship shaped during childhood and adolescence.
For Julie, her parents were financially successful by any measure and didn’t hesitate to spend money, to indulge
Ken Finkelstein
in material comforts for themselves and their children. Julie’s takeaway from her formative years: if you have money, you deserve to reap material rewards.
Jake’s family was different. His parents too were financially successful. But they lived modestly, did not spend frivolously, did not spoil their kids, and placed a premium on lifelong independence and financial freedom. Jake’s takeaway: satisfy needs, temper wants, and plan for a financially stable future by maximizing savings.
With different family approaches, and different lessons learned, money friction between Julie and Jake are inevitable. And if neither J puts effort into understanding their own relationship with money and what’s driving their decisions, then peaceful compromises are not likely.
Reading The Money LeavesMoney has different meanings for different people. For
Jake, money is mostly about safety and control. For Julie, money represents freedom, success and love. Others may attach power, prestige or generosity to money.
Problems for J and J stem from not having insight into their money-related behavior. Once they step back, think about how they emulate their parents saving, spending, and investing patterns, then they’ll get a handle on what’s motivating their financial decisions. And once they understand their own behavior, and share this understanding with each other, then they’ll be much better equipped to compromise. Not least because of knowing that these kinds of arguments are not about money!
Self-knowledge alone isn’t a balm for all money-centred strife, although it’s good to know. Other issues exacerbate disagreements such as: whether or not you share significant money decisions with your partner;

24 z Canadian MoneySaver z https://www.canadianmoneysaver.ca z JUNE 2017
whether each of you has a fair and equal say and; when the partner earning less money feels as if their financial contribution is inadequate and, as a result, their self-esteem suffers. Unless these issues are discussed and fairly resolved, resentment will grow, arguments will escalate, and trust will break down.
As I said, it’s complicated and thorny and knotty and tricky and just plain tough, this whole money and relationships business!
Maximizing CompatibilitySo, you love each other. Maybe you’re even nuts about
each other, in a good way! But when it comes to finances, there is close to zero compatibility. What do you do?
You communicate. You talk to each other. Open up. Reveal your hopes and dreams and fears and debts and assets. In a relaxed, peaceful way replete with humour and warmth because, hey, this is your life partner and you love her/him, and there’s no place for anxiety or ill will where two healthy adults are discussing what is the best way forward.
You compromise. Instead of digging in, insisting on having things ‘your way’, you stay flexible. You take one or two or three or more for the team because that’s what partners do for each other. They understand that money management is a joint responsibility, accept the differences that each person brings to the relationship, recognize any pressure their partner is under, and help out where possible. The bonus of working together? Mutual caring and respect is reinforced while disharmony is kept to a minimum.
Budgets Are Not SexySexy, schmexy. So drafting a family budget is not your
idea of fun? Opinion noted. Now, forget about judging the process and understand that budgeting is THE most effective way to track your money.
And when you track your money, you are way more likely to reduce frivolous spending, contribute to savings, achieve your financial goals and (drum roll please) minimize money-related combat because … through the budgeting process you will have set financial ground rules and boundaries that keep you both on the same path.
I mean, if you both want to retire at, say, age 55, and move to Peru because you do not want to live another day without sipping ridiculously delicious Peruvian coffee then, budget-wise, what must be done to make
this happen? Likewise, if you want to buy a home, top up retirement savings accounts, save for the kids’ education costs, pay off the mortgage – again, structure the budget together to make goals a reality.
The alternative to drafting a budget, reviewing it semi-annually, and adjusting as necessary to account for life changes, is something called a hope and prayer. And this alternative is not recommended by nine out of ten financial experts.
A little bit of financial order goes a long way to making life more enjoyable or, at the least, less fraught.
Two Becomes OneIn a healthy relationship, there is no more ‘yours’ or
‘mine’ when it comes to money matters. You’re a team. And as a team, you’re building together for a common future. If you don’t accept this line of thinking, then money issues will definitely be an ongoing source of stress.
Because by not accepting the team concept, you’re going it alone and, last time I checked, partnership involves more than one person. And if you insist on ‘my way or the highway’, well, that’s a sign of deeper issues, starting with lack of respect and trust that will ultimately corrode your relationship.
Shhhh! It’s SecretReferring back to the ‘Marriage Is a Team Game’ line
of thinking, don’t hide money issues from your partner. Don’t keep a secret credit card or make large purchases without telling your partner. In the wider world, that kind of behavior is called deception and it’s not looked upon kindly. Because intentionally deceiving your partner indicates trust issues, and leads to you becoming another divorce statistic.
That said, no one cares to be micro-managed. In this regard, you may want to agree upon a dollar amount that would activate the I-should-tell-my-partner-about-this purchase-because-I-love-my-partner. For example, both of you agree to make a point of telling the other when a purchase costs more than $100, or whatever dollar amount suits you. This sort of behavior sets rules from the start. And these rules serve to eliminate surprises while reinforcing trust, respect, and peaceful relations.
Thrifty Couples Are HappierIf you value relationships, friends, giving effort, and
purpose, then you walk hand in hand with happiness.

Canadian MoneySaver z https://www.canadianmoneysaver.ca z JUNE 2017 z 25
And if you value loading up your existence with material stuff, then the worse off you’ll be as far as happiness goes.
Of course, this notion of value I’m spouting is from a bygone era. It doesn’t have to be but that seems to be the general direction of things. I know, we live in a society that elevates a corporate culture promoting product cycles lasting maybe six months, one where we consumers are encouraged to buy the latest model, the biggest home, the most luxurious car, and spare no expense because (hello banks and lending companies!) you have the option of borrowing money and going further into debt.
Stuff. It’s a powerful draw for most of us. The mere wanting of stuff is enough to turn some of us into bobbleheads; bouncing around excitedly, our mind shut off from any other thoughts, like the inevitable weight we’ll feel under the burden of credit card debt or home line of credit debt, and the gloomy pessimism we experience when not in control of our financial destiny. Oh yes, then there’s the relationship damage caused by runaway consumption and resulting debt.
The thing is, Living the Dream is not about having everything you want. Nope. It’s more about balancing saving and spending, achieving self-sufficiency, knowing that you do not have to rely on someone else for your livelihood. And the more you spend beyond your means, the less you save, the more debt you accrue, the less likely you will ever know this kind of freedom or happiness, the kind that thrifty couples know well.
Sidestepping The MinefieldSure, potentially, money and relationships
present a minefield of trouble. But it doesn’t have to be this way. And it won’t be this way if you’re willing to put in the effort to understand the source of your own feelings about money, and to respect, trust and engage in an ongoing, open dialogue with your partner.
Ken Finkelstein, LL.B. J.D., www.buddhamoney.com.
Best Annuity Rates
This will give the best annuity rates out there without the CMS reader having to shop for them and receive conflicting numbers from the various annuity sites.
Best Prescribed Annuity Rates: $250,000 10-year Guarantee
1. Male Single Life Prescribed Annuity ages 65,70,75 and 80
2. Female Single Life Prescribed Annuity ages 65,70,75, and 80
3. Joint Life Prescribed Annuity Male/Female ages 65,70,75, and 80.
Annuity income values were obtained from highly rated Canadian insurers and are for illustration purposes only.
Annuity rates change daily. Income and tax rate will depend when the annuity contract is issued.
Rino Racanelli independent annuity advisor.Phone 416-880-8552. Email [email protected]
Visit www.BackToBackAnnuities.com for your Free Quote
Male age at purchase
Annual income Annual Taxable Amount
65 $15,447 $3,120
70 $17,436 $2,694
75 $19,798 $2,295
80 $22,231 $1,948
Female age at purchase
Annual incomeAnnual Taxable
Amount
65 $14,036 $2,986
70 $15,932 $2,617
75 $18,224 $2,042
80 $21,077 $1,700
Joint age at purchase
Annual incomeAnnual Taxable
Amount
65 $12,762 $3,214
70 $14,280 $2,812
75 $16,301 $2,264
80 $18,947 $1,713
26 z Canadian MoneySaver z https://www.canadianmoneysaver.ca z JUNE 2017
Portfolio Management
Can You Over Diversify?
Allan Small
Some people can be surprised to learn one of the most effective ways to protect themselves from market uncertainty, swings and volatility is also one of the least expensive things to do –
diversify your portfolio, selecting good investments in a variety of different areas to protect yourself. Studies have shown that roughly 90 per cent of an investor’s return comes from effective asset allocation. Balancing fixed income investments with stocks (local and international) can lead to positive returns while managing risk.
Diversification protects investors if a segment of the market drops because the higher a market segment rises, the greater the risk that there could be a drop or pullback.
We certainly saw concern about a potential pullback start to play out in the markets in the spring of 2017, with considerable talk about the Trump effect, which saw a jump and continuing climb in the markets starting in November 2016 following President Trump’s U.S. election win. The markets were excited about the potential promise of deregulation and significant tax cuts. However, by April, some experts started to urge that investors be cautious, as markets appeared fully valued and the Trump administration faced challenges passing legislation.
While many would consider diversifying your portfolio to be one of the basics of investing, doing it right is not always the easiest thing to accomplish. I’ve met with a number of investors who’ve wanted their portfolios reviewed only to discover that they are over-diversified. Their portfolios weren’t large enough for the number of different kinds of investments they owned, which can work against them because they don’t have sufficient funds in any particular group of investments to really reap a return when investments are on the rise.
There are several components that investors need to think about when building a diversified portfolio:
• Portfolio size, goals and time horizon – Knowing how
much you can invest, your goals and the timeframe you have to reach those goals all are important considerations in determining where you should invest.
• Consider geography – Investors should not just restrict their thinking to Canadian markets. The TSX, for example, is heavily weighted towards financial, energy and resource equities. People wanting to invest in other segments may find better investment opportunities in American or international markets.
• Consider mutual funds – For portfolios of less than $100,000, holding baskets of investments, such as mutual funds and exchanged traded funds (ETFs), may make a good option and a good way to spread your wealth geographically and across various sectors.
• Active investing – Once you’ve built your portfolio, you will need to manage it. Come up with a plan and set targets to determine when to sell.
Whether it is the Trump effect or some other event, there are going to be ups and downs in the market that create uncertainty. One of the best ways to protect yourself is by having a diversified portfolio. With conditions constantly changing, it is important to periodically review the mix of your investments.
Allan Small is the Senior Investment Advisor with Allan Small Financial Group with HollisWealth, a Division of Scotia Capital Inc. (www.allansmall.com) as well as the author of How To Profit When Investors Are Scared. He can be reached at (416) 332-3863 or via email at [email protected]
This article was prepared solely by Allan Small, registered representative of HollisWealth ® (a division of Scotia Capital Inc., a member of the Canadian Investor Protection Fund and the Investment Industry Regulatory Organization of Canada). The views, including recommendations expressed in this article are those of Allan Small and not those of HollisWealth. ® Registered Trademark of The Bank of Nova Scotia, used under license. Allan Small Financial Group is a personal trade name of Allan Small.

Canadian MoneySaver z https://www.canadianmoneysaver.ca z JUNE 2017 z 27
5i Research
Canadian MoneySaver members have been asking what 5i Research is all about. We asked 5i Research to provide a FREE report to us so that you you can gain insight into what the service is all about. Interested members can get more information online at https://www.5iresearch.ca/research-reports.5i Research provides research on small to mid-capitalization Canadian stocks with zero conflicts. Employees of 5i Research cannot trade in Canadian securities to ensure members get their unbiased opinion. In addition to over 70 research reports, much like the one below, members also gain access to three model portfolios and a question and answer section where members can ask the founder of 5i research and owner of Canadian MoneySaver, Peter Hodson, their investment questions.
28 z Canadian MoneySaver z https://www.canadianmoneysaver.ca z JUNE 2017

Canadian MoneySaver z https://www.canadianmoneysaver.ca z JUNE 2017 z 29

30 z Canadian MoneySaver z https://www.canadianmoneysaver.ca z JUNE 2017

Canadian MoneySaver z https://www.canadianmoneysaver.ca z JUNE 2017 z 31

32 z Canadian MoneySaver z https://www.canadianmoneysaver.ca z JUNE 2017
Love And Money
Secrets And Lies: Why Hidden Debt Can Hurt More Than Your RelationshipLisa MacColl
A week after her husband died suddenly, the widow answered a knock at the door to find a business owner holding her husband’s bar tab. Already reeling from the
unexpected funeral expenses, the several-hundred-dollar bar tab was an added blow she knew nothing about.
After his wife left him on Christmas Eve, a husband found a bank statement for a credit account he knew nothing about. After further investigation, he found three more credit cards and debt in the amount of $60,000. One line of credit was secured by the family home and it was past due. It was all a surprise.
These scenarios are far more common than you might think. In by-gone days, it was rare for a wife to have credit of her own, which often caused problems for her if the husband died unexpectedly and all the household expenses were in his name only. The tradition roles of man as breadwinner and wife as caregiver have fallen by the wayside. It is not unusual for men and women to keep some, if not all their finances separate, and split expenses such as mortgage and utilities equally.
As long as it works, and everyone can meet their individual obligations, to each his own, right? But what if it stops working for one person? Unexpected or secret debt can put a real strain on the relationship and the family future.
Why It Matters
Regardless of how your personal family finances are split out, some obligations fall on both people in a relationship. For example, the title of the matrimonial home is normally expected to be in both names, as is the mortgage, regardless of who takes care of the costs
in practice. So, let’s say you get yourself into a financial mess, and want to do a debt consolidation loan without your partner’s knowledge. Even if your partner covers all the house expenses, if your name is on the deed, those expenses will be included in your debt ratio and will impact whether you qualify for the loan. If you work part-time or are self-employed, that inclusion can put your debt ratio over the acceptable limits.
If your name is on the title and the mortgage, and you try to do a solo consumer proposal to dig yourself out of debt, you will be required to include any equity in the home as part of the calculation of your repayment, even if you have no intention of selling the property to cover the debt. If one of your creditors balks, you could be forced to sell the home and that is not a surprise anyone wants for the person you share your life with.
Despite your best efforts, debt can accumulate quickly. Does this sound familiar: your paycheque goes to paying your credit cards, and you have nothing left for spending, so you charge items to the credit card and start again. Or you use one credit card to pay another and give yourself an interest double whammy. Consumer credit card rates average 15-23% (and more) and making the minimum payment barely makes a dent after the monthly interest is applied. If you carry a balance, most credit card companies give you an estimate of how long it will take you to repay the amount if you make only minimum payments. Multiply that by three or four cards, and the dollars can add up fast. A sudden job loss or illness, and you can go from managing to collection calls in a couple of months. A pattern of late or less than minimum payments can start to negatively impact your credit rating quickly. And if the other person also has debt that you don’t know about? Recipe for disaster.

Canadian MoneySaver z https://www.canadianmoneysaver.ca z JUNE 2017 z 33
What To Do
1. Add it up. If you’ve been tossing the bills in a pile unopened every month, and just making minimal payments as you can, it’s time to stage an intervention, open the bills and add them up. Time to own up.
2. Check your credit. It’s a good idea to check your credit report at least twice a year, especially since there have been many high-profile identity thefts. Check the report for inaccuracies, or for credit cards that you didn’t apply for or don’t recognize. You may find there are store credit cards that you opened to get an extra percentage off at the cash, and then forgot about. If you don’t use it, close it. If there are mistakes or discrepancies, call the credit reporting agency right away. Equifax Canada and TransUnion are the most well-known credit agencies, and there are many other online versions as well. Checking your credit score also gives you a better idea of what options might be available to you.
3. Have the conversation. This is where things can get awkward. Your partner may have no idea you have been struggling and this will come as a shock. Have some consideration about timing: dumping it as your partner is walking out the door to work is unfair. Before coffee is just mean, and late at night means no one gets to sleep that night. Make some time when you can talk and walk away if need be. If you have children, try to arrange for them to be away when the conversation takes place. This is not a problem the children need to help solve.
4. Try to stay objective. There may be yelling. There may be accusations. There may be silence. There may be anger. There may be walking away. Remember, you’ve been living with this situation for a while now, but your partner may not have an inkling of what has been going on, especially if you keep your finances separate. Getting defensive isn’t going to help anything. If things get too heated, take a time-out. No one likes to be blindsided.
5. Talk to a financial expert. While it can be excruciating to admit you aren’t a financial whiz and need some help, you are not unique. Talk to your financial advisor, or your banking
representative and see what options might be available to you. If things are serious, most insolvency trustees offer a free preliminary consultation to discuss other options with you. This is the time to be completely honest so you can start to find a path back to financial solvency.
6. Work together to come up with a plan. There are a variety of solutions available, from debt consolidation loans, a part-time job, selling some items or a consumer proposal or bankruptcy. Make sure you understand all the pros and cons and then work with your partner to make a decision that works best for you and your family.
Once you have a plan that works, it would be a good idea to sit down with a financial planner or a credit counseling agency and work out a family budget. They will look at not only family expenses and debt repayment but can point out areas where you can trim expenses to give you more disposable income so you don’t spiral backward. For example, when was the last time you reviewed your cable or phone plan? The major providers often change the plans, and you might be able to get a better rate with one of the new plans, but the provider won’t tell you unless you ask. How much would you save a month by skipping the morning latte once or twice a week, or bringing your own coffee or lunch? Small changes can add up quickly and help you back on the road to financial health.
Ask the bank or card issuer to lower your credit limits. Unless you are planning a home renovation, do you really need a $25,000 credit limit? Banks don’t like people who pay the full balance every month, they don’t make any money that way. And it’s easy to fall backwards if there is room on the credit card.
No one wants to disappoint the person you have chosen to spend your life with. Hidden debt can have a negative impact both on your health and well-being, and on your family’s security and financial future. Time to come clean.
Lisa MacColl is an Ontario-based writer who specializes in B2B and B2C communications, as well as investments, insurance and financial topics. She has also written general interest and parenting articles and her first novella, "Cannoli" is available on Amazon.

34 z Canadian MoneySaver z https://www.canadianmoneysaver.ca z JUNE 2017
Insurance Products
Annuities: Good Income Option For Retirees Despite New Tax RulesRino Racanelli
In the January 2016 Canadian Money Saver edition, I wrote an article titled An Easy Way to Save Money on a Prescribed Annuity. I discussed how the new tax legislation (Bill C-43 effective
January 2017), would change the exemption test on annuities. Bill C-43 will now use a new mortality table to calculate the taxable portion on prescribed annuities, resulting in a higher tax payable for non-registered prescribed annuities. Despite the recent tax changes, annuities continue to be an important part of a retirement plan?
Quick Recap
What Is A Prescribed Annuity?
An annuity is a guaranteed and steady stream of income payments you receive from a life insurance company in exchange for a lump sum of cash. A prescribed annuity is an annuity purchased with non-registered funds that has distinct tax advantages (an annuity can also be purchased with registered funds such as RRSPs, and RRIFs, but are fully taxable).
An annuity purchased with non-registered funds is taxed using either an accrual or prescribed methodology. The accrual method is based solely on interest earned. Since the principal is high in the early years, the interest portion of the annuity will also be high. This means higher taxes being paid in the early income years. Alternatively, non-registered annuities can be taxed on a prescribed basis where income payments are a blend of interest and principal over the life of the contract. This spreads out the tax payable evenly every year.
What Qualifies As A Prescribed Annuity?
An annuity contract must qualify for prescribed tax treatment and is defined in Regulation 304(1) of the
Income Tax Act. It can be exempt of accrual taxation if the following conditions are met:
• The policyholder must also be the annuitant. An annuitant is the person whose life the contract is based on.
• A joint life annuity is permitted subject to certain variables. Joint life usually refers to husband and wife to receive income payments, but there are other combinations available.
• The annuity must be non-commutable and non-transferable--this means it is a permanent contract for the life of the individual and can not be cashed in or transferred to another party, either as a gift or for consideration.
• Annuity payments must start by December 31 of the year following the purchase date.
• Annuity payments must be equal, made regularly, at least annually, and cannot be inflation protected (indexed).
• Annuity payments can be for life or a certain term (term certain) as long as the term does not exceed the annuitant's 91st birthday.
• The policyholder can also be a testamentary or spousal trust.
Now that the new law took effect, we can compare the difference in tax for a $100,000 10-year guarantee prescribed annuity with an income start date of April 2017. The two tables below show a higher amount of tax for both male and female under the new rules.

Canadian MoneySaver z https://www.canadianmoneysaver.ca z JUNE 2017 z 35
Male Age At Purchase
Annual Income
Annual Taxable Portion Prior 2017
Annual Taxable Portion Now
65 $6,090 $510 $1,164
70 $6,960 $349 $1,078
75 $7,800 $34 $806
80 $8,753 $0 $623
Female Age At Purchase
Annual Income
Annual Taxable Portion Prior 2017
Annual Taxable Portion Now
65 $5,530 $595 $1,105
70 $6,335 $359 $1,016
75 $7,184 $0 $691
80 $8,232 $0 $612
Annuity income values were obtained from highly rated Canadian insurers and are for illustration purposes only. The exact income and tax rate will apply when the annuity contract is issued. Different annuities will result in taxable portions that may not vary from old to new in the same proportion.
Annuity Tax Rates Last Year Versus Annuity Tax Rates This Year
How Safe Is An Annuity?
Annuities are among the safest investments around because they are financially backed by Canada's insurance companies, which in turn are backed by an organization called Assuris (www.assuris.ca). Assuris is the not for profit organization that protects Canadian policyholders in the event that their member life insurance company should fail.
Assuris' has a monthly income protection for annuities. If your life insurance company fails, your payout annuity policy will be transferred to a solvent company. On transfer, Assuris guarantees that you will retain up to $2,000 per month or 85% of the promised monthly income benefit, whichever is higher. Assuris is funded by the life insurance industry and endorsed by the Canadian government.
Rino Racanelli is an independent insurance advisor in Toronto, ON. He can be reached by phone 416-880-8552 and by email [email protected]. Or you can visit his website www.BackToBackAnnuities.com.
Are Annuities Still A Good Retirement Income Option?
Selecting retirement income options is one of the most important financial decisions a retiree or soon to be retiree will make. Government sources such as Canada Pension Plan, Old Age Security, and the Quebec Pension Plan may not provide adequate income to cover basic expenses. Some of the major challenges seniors face today include; outliving their retirement savings, market downturns, and low interest rate returns on GICs and other guaranteed investment products. Annuities can provide a higher income stream than most guaranteed products and continue to have a distinct tax advantage if purchased with non-registered money.
By purchasing an annuity you give up some liquidity and flexibility, therefore it should be an important component of a larger investment plan. Depending on your age (a good age range for an annuity is generally between age 60 to 80), and net worth, 25% to 30% of your assets can be used to purchase an annuity. You should always have enough cash on hand for emergencies and other investment opportunities. Annuity products have become more innovative with numerous options available and continue to be one of the safest investments around.

36 z Canadian MoneySaver z https://www.canadianmoneysaver.ca z JUNE 2017
Q A question about Income Trusts: Whether they are paying dividends and are eligible for the Dividend Tax Credit orwhethertheyarepayingincomethat’streatedasregularincome and taxed accordingly.
CMS Reader
A I am assuming that you are talking about income trusts you also mean real estate income trusts or "REITs", as the change in law in 2006 essentially makes it a bad idea for most companies to use the income trust format, other than those can squeeze into the narrow definition of a "REIT". My comments will be focused accordingly.
By way of history, prior to the rule change in 2006, many public companies were switching to an income trust format because it was a lot more tax-efficient for many investors, particularly those who owned income trusts in registered plans. That was because an income trust that made $100 pre-tax could pay it all to investors while a company making the same amount would have to pay tax on it first, thus only paying out perhaps $74. Although the dividend credit partially (but not completely) levelled the playing field by reducing how much tax investors receiving the $74 paid on it if owned in an open account, investors owning shares in a public company in their registered plans don’t qualify for the dividend tax credit, which meant they were receiving a lot less than an income trust that earned the same amount of profits that year and didn’t get any corresponding tax relief. Thus, the Feds tightened up the rules regarding income trusts as they were losing a lot of money in tax revenue, while also, around the same time, created the super-charged “eligible dividends” we enjoy today that reduce the tax bill when investors receive dividends from Canadian publicly-traded companies (and sometimes from private companies, too).
The same advantages that had company after company switching to an income trust format prior to 2006 still hold true for REITs today, which is why it can be
You must accompany your inquiry with your Membership Number (ID) and telephone number or e-mail to have your question reviewed. Inquiries are responded to directly and the Q&A may be published here later. Hundreds of Q&As are found on www.CanadianMoneySaver.ca
wonderful to hold REITs paying ROC inside your RRSP or RRIF instead of investments paying eligible dividends. On the other hand, they also offer superior tax treatment in open accounts for many investors as well, with the possible exception of investors in the lower tax-brackets receiving eligible dividends that aren’t worried about losing government income-related benefits. The big benefit is this: not only can REITs pay out 100% of their pre-tax profit; they can even pay some or all of it to you as a tax-free “return of capital” or “ROC”.
ROC is a wonderful thing because it is tax-free until you’ve received back all of your original investment, after which any additional ROC payments are taxed as capital gains. It means increasing cash flow without increasing your tax bill or pushing you into a higher tax bracket. It can also mean avoiding or minimizing the OAS claw-back, as ROC isn’t included when calculating how much needs to be repaid.
On the other hand, you are required to subtract all of the ROC payments from the adjusted cost base or “ACB” of your investment, which means that there will be a higher capital gains bill when you do eventually dispose of your units. However, you can apply unused capital losses against such gains and, for the charitably minded, publicly-traded REITs also qualify for capital gains relief if the shares are gifted directly to a registered charity. Thus donating units in a REIT in kind can mean paying no capital gains at all. Furthermore, investors owning REITs paying out only ROC can also save tax dollars by strategically selling units during years when they are in low tax brackets.
Unfortunately, not all REITs pay out 100% ROC. It is typical that any part of your yearly distributions that aren’t ROC are taxed as income, rather than dividends (although I suppose it may be theoretically possible to also get dividends from an income trust that might qualify for the dividend tax credit). When looking to invest in a REIT, you should look at how past distributions have been taxed as part of your decision of whether or

Canadian MoneySaver z https://www.canadianmoneysaver.ca z JUNE 2017 z 37
not to invest and in which account to own it, as a REIT paying mostly interest is probably best suited for a registered account. For tax purposes, investors owning REITs typically get their tax slips perhaps a month or more later than those owning investment shares, which can certainly be a hassle at tax time. Furthermore, you or your broker will need to track the changes to the ACB in your REIT each year if owned in an open account in order to calculate the eventual tax bill when the units are sold. Fortunately, there are actually websites that can help investors do this sort of thing.
I hope this helps and happy investing!
COLIN RITCHIE, BA.H. LL.B., CFP, CLU, TEP & FMAVancouver
Q Thank you for your reply. How do I differentiate betweendifferent“investments’(StocksversusTrusts)andtheir taxationmethods. I’m interested in putting incomefrom Trusts that are fully taxed as income in a Registered Account and dividend Income in a Cash Account. I am reluctant to put dividend stocks in a registered account and lose the Dividend Tax Credit benefit. I see Trusts that have a .UN following their Symbol on the TSX. Are these the Income Trusts that I would be interested in that any distributions are fully taxed as income and no “Dividend Tax Credit”.For example, Brookfield Infrastructure Partners (TSX: BIP.UN), H & R REIT (TSX: HR.UN), Blue Ribbon Income Fund (TSX: RBN.UN) or Ashton Hill VIP Income fund (TSX: VIP.UN).ComparethatwithPembinaPipelineCorp(TSX:PPL),Enbridge Income Fund Holdings (TSX: ENF) or Freehold Royalties (TSX: FRU). Are the “.UN” Symbols the onlyinvestments that are categorized as such for tax purposes?
CMS Reader
A I’m attaching a link to the TSM site where they provide both a formal definition of income trusts. http://www.tmxmoney.com/en/research/income_trusts/faq.html They even have a list of all the income trusts trading on the TSX, the vast majority of which are REITs, although there are a few exceptions, which are generally mature businesses that distribute all of their profit each year.
“Un” refers to “units”, as when you own part of an income trust, you don’t own shares, as these aren’t companies. You own units in the trust. Thus, all trusts on the tsx will have the .un symbol behind them. You will need to look at each individually to determine how they are taxed.
The businesses will probably pay mostly taxable income but the REITs can pay tax-free return of capital, which can be really useful in some cash accounts, particularly for investors who are in a high bracket now and will probably be in a lower bracket later when potentially selling.
Owning the income trusts that spit out only taxable income in your registered plans makes sense.
COLIN RITCHIE, BA.H. LL.B., CFP, CLU, TEP & FMAVancouver, BC
Q Our daughter (36) is planning a large cap dividend portfolio in her TFSA and RSP accounts with dividend reinvestment. She also has a non-registered account and is wondering if it is worth enrolling in a true DRIP, rather than a synthetic DRIP when investing in the long term. Can you advise please?
CMS Reader
A Yes we think it is worthwhile. While a synthetic drip adds some convenience to the process, brokers will not issue fractional shares like a true drip, so you need to own enough to get a full share from a dividend. In addition, most if not all brokers will not provide the discount that often comes with a true DRIP plan. Over a long period of time, these differences can add up to a material amount.
PETER HODSON, CFAHead of research at 5iResearch Inc, Kitchener, ON
Q If I buy a stock at a price and then buy more shares a year later at a different price and then later still I sell all my shares how will I report this on my income tax? It seems to me I would report it as two separate sales but perhaps there is a better way. If there is I would like to hear about it.
CMS Reader
A The adjusted cost base is the average price you paid for shares and your capital gain or loss is based on this.If you buy 100 shares at $10, then 100 more at $20, your total cost is $3000, or $15 per share.When you sell, the proceeds minus your cost base will determine your gain or loss.
PETER HODSON, CFAHead of research at 5iResearch Inc, Kitchener, ON
38 z Canadian MoneySaver z https://www.canadianmoneysaver.ca z JUNE 2017
This column offers excerpts from published and online sources to provide other viewpoints.
(CSH.UN-T) C$15.65
In Line Quarter; Retirement Residences Continue to Drive Growth EventCHARTWELL reported Q1/17 FFO/unit (f.d.) of $0.22, flat versus Q1/16 and in line with our estimate. Consensus was $0.23. AFFO/unit of $0.20 (our calculation) was a penny below our estimate.
Impact: NEUTRALQ1 SPNOI was +3.5%. Retirement Portfolio (91% of SPNOI) was +4.1% y/y, while the LTC portfolio reported a y/y decrease of 1.3%. The solid SPNOI growth did not translate to positive FFO/unit growth due to ~$1.4 million ($0.007/unit) in lease- up losses and higher y/y G&A of $2.2 million ($0.024/unit).
Developments. Chartwell's development pipeline now stands at ~2,925 suites (1,286 on its balance sheet for $319 million, and 1,639 with Batimo). Chartwell also disclosed that it has 35.7 acres of excess land with development potential for an additional 2,886 suites. We believe each $100 million of developments could add up to ~2% to our current NAV estimate (Exhibit 6).
Acquisitions/Disposition. During the quarter, Chartwell acquired two Ontario retirement residences aggregating 173 units for $28.9 million. Subsequent to Q1, the company completed the sale of the Castel Royale Retirement Residence for $23.5 million to CAPREIT. We note that there continues to be a strong market for retirement homes with Welltower (HCN-N, not rated) announcing the sale of a Victoria, B.C. property at a 4.8% cap rate this morning.
Estimates. Our FFO/unit and AFFO/unit estimates are ~3% lower on higher G&A assumptions. We are now forecasting 2017/18 AFFO/unit growth of 5.2%/8.9%.
TD Investment ConclusionIn Q1, strength in Chartwell's retirement portfolio continued to offset SPNOI declines in the LTC portfolio and drive mid-single-digit SPNOI growth. We continue to favour Chartwell's strategy of utilizing its development pipeline to both generate unitholder value and meet the increasing demands of Canada's growing seniors' population. As Canada's largest owner and operator of retirement homes, we continue to
believe that Chartwell is the best positioned among its publically-traded peers to take advantage of the prevailing demographic trends. With favourable near-term supply/ demand fundamentals, our 2017/18 forecast has high-single-digit AFFO/unit growth, which we expect to continue over the medium-to-long term. We are maintaining our BUY rating and $17.50 target price.
Source: TD Securities
CHARTWELL RETIREMENT RESIDENCES
(PPL-T,PBA-N)C$43.53|US$30.86
Strong Q1 Results Driven by NGL Margins and New Assets EventPEMBINA PIPELINE CORP. (PPL) reported Q1/17 AFFO/share of $0.77, above our estimate of $0.67, recent consensus of $0.69, and Q1/16 AFFO/share of $0.56.
Impact: POSITIVE• QA Strong Q1 Across All Segments: AFFO/share was
ahead of our estimates on higher-than-expected results in all segments, particularly in Midstream. Improved NGL market pricing and new assets placed into service helped drive the y/y increase.
• Increasing Forecasts and Target Price as Base Business Continues to Improve: We have updated our financial forecasts to reflect the quarterly results along with a number of other factors including higher Midstream contribution due to increased NGL volumes and pricing, refinements in Gas Services, and revised financing and tax assumptions. As a result of our higher forecasts, we are increasing our target by $1.00 to $51.00.
TD Investment ConclusionIn our view, the proposed acquisition of Veresen Inc. strengthens and extends Pembina's growth outlook while maintaining a strong balance sheet. In addition, it diversifies the company's geography, hydrocarbon mix, and counterparty exposure. This should improve Pembina's capacity to pursue increasingly large and complex new assets over time. We believe that this relatively strong competitive positioning and growth outlook supports a continuation of a premium valuation multiple.
Source: TD Securities
PEMBINA PIPELINE CORP.

Canadian MoneySaver z https://www.canadianmoneysaver.ca z JUNE 2017 z 39
CANADIAN MONEYSAVER SUGGESTED CANADIAN DIVIDEND REINVESTMENT PLANS (DRIPS) Ca
nadi
an M
oney
Save
r SU
GG
ESTE
D C
AN
AD
IAN
DIV
IDEN
D R
EIN
VEST
MEN
T PL
AN
S (D
RIPs
)
TSX
Com
pani
es S
ymbo
l52
-Wee
kCl
osin
gPr
ice
Div
Yiel
dEP
SP/
EPa
yout
Rati
o %
5-Yr
Div
iden
d G
row
thH
igh
Low
TSX
Com
pani
esSy
mbo
lH
igh
Low
Pric
eDi
vYi
eld
EPS
P/E
Payo
ut R
atio
5 Ye
ar D
iv
Grow
th
Agni
co E
agle
Min
esAE
M$7
8.35
$46.
91$6
6.33
$0.5
40.
81%
$0.7
786
.170
.1%
-5.5
%
Algo
nqui
n Po
wer
AQN
$13.
35$1
0.47
$13.
23$0
.64
4.84
%$0
.68
19.5
94.1
%16
.0%
Alta
Gas
ALA
$35.
55$2
9.26
$30.
92$2
.10
6.79
%$0
.92
33.6
228.
3%8.
9%
BCE
Inc
BCE
$63.
41$5
6.80
$61.
33$2
.87
4.68
%$3
.37
18.2
85.2
%5.
7%
Bk o
f Mon
trea
lBM
O$1
04.1
5$7
9.82
$94.
04$3
.52
3.74
%$8
.09
11.6
43.5
%3.
7%
Bk o
f Nov
a Sc
otia
BNS
$82.
30$6
2.11
$75.
30$3
.04
4.04
%$6
.42
11.7
47.4
%7.
1%
Cana
dian
Tir
eCT
C.A
$171
.91
$128
.12
$159
.35
$2.6
01.
63%
$10.
2315
.625
.4%
15.9
%
Cana
dian
Uti
litie
sCU
$40.
78$3
4.83
$39.
98$1
.43
3.58
%$2
.33
17.2
61.4
%10
.2%
Cdn
Impe
rial
Bk
(CIB
C)
CM$1
20.8
3$9
5.50
$107
.12
$5.0
84.
74%
$10.
7110
.047
.4%
6.5%
Cons
tella
tion
Sof
twar
eCS
U$6
99.9
8$4
88.9
9$6
77.3
3$5
.39
0.80
%$2
9.00
23.4
18.6
%22
.1%
Emer
aEM
A$5
0.19
$43.
76$4
7.01
$2.0
94.
45%
$2.6
717
.678
.3%
8.4%
Enbr
idge
EN
B$5
9.19
$50.
76$5
4.95
$2.4
44.
44%
$2.3
823
.09
102.
5%16
.8%
Exch
ange
Inc
ome
Corp
EIF
$45.
28$3
0.51
$34.
65$2
.10
6.06
%$2
.23
15.5
494
.2%
4.4%
Fort
is
FTS
$45.
13$3
9.50
$44.
51$1
.60
3.59
%$2
.48
17.9
564
.5%
5.1%
Hyd
ro O
neH
$26.
80$2
2.06
$23.
01$0
.88
3.82
%$1
.18
19.5
074
.6%
n/a
Impe
rial
Oil
IMO
$48.
72$3
8.41
$39.
76$0
.64
1.61
%$2
.09
19.0
230
.6%
5.3%
Inte
rPip
elin
eIP
L$3
0.07
$25.
40$2
7.19
$1.6
25.
96%
$1.4
618
.62
111.
0%10
.4%
Keye
ra C
orp
KEY
$43.
21$3
6.03
$40.
12$1
.68
4.19
%$1
.69
23.7
499
.4%
10.1
%
Man
ulif
e M
FC$2
5.57
$16.
43$2
3.60
$0.8
23.
47%
$2.2
010
.73
37.3
%8%
Nat
iona
l Ban
kN
A$5
9.12
$41.
80$5
2.60
$2.2
44.
26%
$5.2
210
.08
42.9
%10
.2%
Pem
bina
Pip
elin
esPP
L$4
4.65
$36.
23$4
3.70
$2.0
44.
67%
$1.7
325
.26
117.
9%3.
6%
Sun
Life
Fin
anci
alSL
F$5
3.75
$40.
00$4
6.18
$1.7
43.
77%
$3.9
611
.66
43.9
%1.
7%
Sunc
or E
nerg
ySU
$44.
90$3
3.49
$43.
45$1
.28
2.95
%$1
.91
22.7
567
.0%
23.1
%
Supe
rior
Plu
sSP
B$1
3.34
$10.
10$1
2.30
$0.7
25.
85%
$0.6
419
.22
112.
5%n/
a
TD B
ank
TD$7
1.31
$54.
20$6
3.10
$2.4
03.
80%
$5.2
512
.02
45.7
%10
.8%
Telu
s T
$46.
29$4
0.10
$45.
92$1
.96
4.27
%$2
.72
16.8
872
.1%
10.9
%
Tran
sCan
ada
Corp
TR
P$6
3.61
$51.
82$6
3.61
$2.5
03.
93%
$2.9
021
.93
86.2
%5.
8%
WSP
Gro
upW
SP$5
0.46
$37.
00$4
8.80
$1.5
03.
07%
$2.6
718
.28
56.2
%-6
.0%
CHA
RT N
OTE
- P
rice
s as
of
May
12,
201
7. S
ourc
e: T
D W
ater
hous
e/Bl
oom
berg
LP.
Sto
ck p
rice
s ch
ange
dai
ly.
Chec
k fo
r cu
rren
t pr
ices
. Th
ese
Cana
dian
com
pani
es l
iste
d on
the
TSX
are
our
rec
omm
ende
d co
mpa
nies
a D
RIP.
Wit
h th
e DR
IP, y
ou c
an re
inve
st a
ll yo
ur d
ivid
ends
to
purc
hase
add
itio
nal s
hare
s at
no
cost
. Som
e DR
IPS
offe
r a d
isco
unt
so t
hat
addi
tion
al s
hare
s ar
e bo
ught
at
a di
scou
nt t
o th
e av
erag
e m
arke
t pr
ice.
Som
e di
vide
nds
are
paid
in U
S do
llars
and
we
have
adj
uste
d nu
mbe
rs a
nd ra
tios
acc
ordi
ng t
o re
cent
exc
hang
e ra
tes.
Div.
5yr
gr:
We
have
add
ed t
he fi
ve-y
ear d
ivid
end
grow
th ra
te t
o ou
r cha
rt, i
nfor
mat
ion
obta
ined
from
Blo
ombe
rg L
P.Ea
rnin
gs a
re fo
rwar
d ea
rnin
gs e
stim
ates
. Sin
ce o
ur la
st u
pdat
e Ba
nk o
f Enb
ridg
e, S
unLi
fe, T
elus
, Im
peri
al O
Il, K
eyer
a an
d H
ydro
One
hav
e ra
ised
the
ir d
ivid
ends
.Yi
eld
= Di
vide
nd d
ivid
ed b
y cu
rren
t pr
ice.
Pay
out
rati
o =
divi
dend
div
ided
by
earn
ings
per
sha
re (
EPS)
. Th
e di
vide
nd p
ayou
t ra
tio
is s
impl
y ca
lcul
ated
by
divi
ding
the
com
pany
’s d
ivid
end
by i
ts f
orw
ard
(est
imat
ed)
earn
ings
. If
a c
ompa
ny w
ith
a lo
w p
aym
ent
rati
o ex
peri
ence
s an
ear
ning
s de
clin
e, i
t m
ay c
onti
nue
to p
ay t
he s
ame
divi
dend
. Or
, at
leas
t, it
may
wea
ther
the
dow
ntur
n w
itho
ut c
utti
ng t
he
divi
dend
. A h
igh
divi
dend
pay
out
rati
o of
100
% in
dica
tes
that
the
div
iden
d pa
yout
is e
qual
or a
bove
the
com
pany
’s e
arni
ngs.
The
refo
re, o
ne s
houl
d be
ver
y vi
gila
nt a
nd p
lace
the
sto
ck o
n yo
ur “
wat
ch”
list.
Calc
ulat
ion
for i
nter
est
equi
vale
nt o
f div
iden
d yi
eld
for e
ligib
le s
hare
s: (
100
- m
argi
nal r
ate
for d
ivid
ends
) di
vide
d by
(10
0 -
mar
gina
l tax
rate
on
regu
lar i
ncom
e). F
or e
xam
ple,
in 2
011
an O
ntar
io t
axpa
yer
wit
h or
dina
ry in
com
e of
$65
,514
use
s: (
100
– 11
.72)
div
ided
by
(100
– 3
1.15
) is
app
roxi
mat
ely
1.28
22. T
here
fore
, a s
tock
wit
h a
Cana
dian
div
iden
d yi
eld
of 5
.0%
has
an
equi
vale
nt in
tere
st re
turn
of 5
.0 x
1.
2822
, whi
ch is
app
roxi
mat
ely
6.41
%.

40 z Canadian MoneySaver z https://www.canadianmoneysaver.ca z JUNE 2017
TOP FUNDSTO
P FU
NDS
RAN
KED
BY F
IVE-
YEAR
RET
URN
AS
OF M
AY 1
1, 2
017
Fund
Nam
e1
Mon
th
Retu
rn
(mth
-end
)
3 M
onth
Re
turn
(m
th-e
nd)
6 M
onth
Re
turn
(m
th-e
nd)
YTD
Ret
urn
(mth
-end
)1
Year
Ret
urn
(mth
-end
)3
Year
Ret
urn
(mth
-end
)5
Year
Ret
urn
(mth
-end
)10
Yea
r Re
turn
(m
th-e
nd)
15 Y
ear
Retu
rn
(mth
-end
)
Yiel
d 12
M
oM
ERM
gmt
Fee
Tota
l Ass
ets
($M
il)
CAN
AD
IAN
FIX
ED I
NCO
ME
Cove
nant
Mor
tgag
e Po
ol I
0.71
2.17
4.42
2.90
7.60
9.29
9.26
--
7.33
--
98.4
2Ca
nso
Corp
orat
e Bo
nd C
lass
C1.
152.
301.
472.
583.
814.
425.
356.
29-
2.45
-0.
4011
36.4
5im
axx
Cana
dian
Bon
d Cl
ass
I1.
653.
751.
794.
115.
365.
114.
986.
08-
3.09
0.37
-61
.97
Scot
ia P
riva
te I
ncom
e Po
ol1.
102.
23-0
.61
2.07
2.43
3.27
4.86
7.84
9.33
2.43
0.03
-51
9.67
RBC
Priv
ate
Cana
dian
Cor
pora
te B
ond
Pool
1.55
3.02
1.96
3.34
5.25
4.72
4.80
5.53
-3.
450.
03-
2386
.10
Sun
Life
MFS
Can
adia
n Bo
nd I
1.53
2.94
0.65
2.91
4.36
4.97
4.76
--
3.20
0.05
-12
1.93
Dyna
mic
Aur
ion
Tota
l Ret
urn
Bd C
l Ser
IT
0.73
2.77
-0.5
62.
222.
245.
474.
75-
-0.
000.
130.
7529
0.25
Quad
rus
Corp
orat
e Bo
nd (
Port
ico)
N1.
492.
922.
113.
405.
274.
524.
65-
-3.
30-
-28
5.96
Rena
issa
nce
Corp
orat
e Bo
nd C
l F1.
433.
083.
013.
837.
424.
274.
58-
-4.
050.
800.
7545
42.2
8PH
&N
Enh
ance
d To
tal R
etur
n Bo
nd S
erie
s O
1.47
2.94
0.44
2.86
3.93
5.10
4.57
--
3.13
--
2347
.67
Uni
ted
Cana
dian
Fix
ed I
ncom
e Co
rp C
l W1.
292.
711.
292.
775.
744.
534.
43-
-0.
000.
19-
690.
21CI
Sig
natu
re C
anad
ian
Bond
Cor
p Cl
IT8
1.37
2.79
0.30
2.81
3.52
4.77
4.29
--
0.00
--
349.
77H
SBC
Cana
dian
Bon
d In
stit
utio
nal
1.29
2.99
0.66
2.97
3.99
4.47
4.26
5.23
-3.
390.
04-
844.
33Fr
ankl
in B
isse
tt C
orpo
rate
Bon
d F
1.70
3.07
2.55
3.53
7.35
4.22
4.22
4.66
-3.
460.
980.
7520
8.34
Fide
lity
Cana
dian
Bon
d Se
ries
O1.
482.
980.
583.
033.
914.
704.
195.
375.
993.
25-
-11
421.
66SE
I Ca
nadi
an F
ixed
Inc
ome
Clas
s O
1.56
3.20
0.81
3.29
4.12
4.52
4.18
5.27
5.78
3.00
0.11
-22
41.8
3Ca
noe
Bond
Adv
anta
ge F
1.84
4.08
2.27
4.62
5.54
4.58
4.18
--
2.56
1.10
0.85
325.
90Le
ith
Whe
eler
Cor
e Bo
nd A
1.44
2.84
0.14
2.73
3.33
4.68
4.16
4.82
-3.
11-
-20
4.39
Dyna
mic
Str
ateg
ic B
ond
Seri
es I
P0.
681.
510.
961.
762.
422.
754.
13-
-5.
100.
17-
134.
67Sy
mm
etry
Fix
ed I
nc P
ort
W1.
162.
561.
082.
584.
344.
204.
014.
63-
2.35
0.19
0.90
190.
96
CAN
AD
IAN
FIX
ED I
NCO
ME
BA
LAN
CED
Com
pass
Con
serv
ativ
e Ba
lanc
ed P
ort
Sr O
1.49
3.87
5.62
4.15
10.6
17.
168.
987.
32-
2.99
0.03
-43
17.0
2Fi
delit
y Ba
lanc
ed I
ncom
e Pr
iv P
ool F
2.49
5.08
3.65
4.53
10.0
06.
767.
87-
-0.
210.
840.
6029
43.8
0CI
BC B
alan
ced
Inde
x Pr
emiu
m1.
533.
925.
453.
9911
.59
6.42
7.82
--
3.18
0.37
0.75
394.
99SE
I In
com
e 40
/60
Cl O
1.93
4.47
4.63
4.50
10.2
76.
467.
775.
58-
2.43
0.22
-48
4.98
Quad
rus
Mod
erat
e Fo
lio N
1.89
4.52
4.63
4.16
9.91
6.21
7.53
--
1.40
--
247.
53Co
mpa
ss C
onse
rvat
ive
Bala
nced
Por
tfol
io1.
363.
474.
813.
618.
895.
497.
295.
64-
1.68
1.60
1.50
4317
.02
Rena
issa
nce
Opti
mal
Inc
ome
Port
folio
F1.
684.
734.
524.
6110
.34
5.90
7.27
--
3.76
0.92
0.75
3133
.53
Man
ulif
e Si
mpl
icit
y M
oder
ate
F1.
884.
584.
644.
6810
.20
6.31
7.07
--
2.15
1.35
1.00
296.
57Ax
iom
Bal
ance
d In
com
e Po
rtfo
lio C
lass
F1.
754.
304.
154.
389.
705.
776.
704.
76-
1.41
1.16
0.90
153.
66RB
C M
anag
ed P
ayou
t So
luti
on-E
nhan
c Sr
F1.
323.
474.
893.
4110
.95
5.56
6.68
--
2.87
0.80
0.65
2507
.34
Mer
itag
e M
oder
ate
Inve
stm
ent
Port
F1.
643.
743.
863.
829.
055.
686.
665.
17-
1.47
1.35
0.90
209.
72M
acke
nzie
Inc
ome
F1.
824.
324.
344.
249.
896.
146.
634.
926.
072.
331.
010.
7512
09.5
5TD
Adv
anta
ge B
alan
ced
Inco
me
Port
- F
1.82
4.05
3.03
3.80
7.48
5.61
6.54
--
1.85
0.84
0.85
157.
52N
BI J
aris
low
sky
Fras
er S
elec
t In
com
e E
1.13
2.89
3.22
2.96
7.74
5.10
6.40
--
2.38
0.79
0.65
235.
56N
atio
nal B
ank
Mod
erat
e St
rate
gic
Port
2.04
4.82
5.19
4.96
10.5
55.
236.
353.
904.
740.
00-
1.65
-Le
ith
Whe
eler
Inc
ome
Adva
ntag
e Se
ries
B0.
492.
305.
583.
0312
.82
5.38
6.28
--
2.40
0.85
1.00
72.0
3H
SBC
Wor
ld S
elec
tion
Dvr
s M
od C
nsrv
Inv
1.53
3.92
4.90
3.88
10.2
25.
196.
053.
79-
1.12
1.73
1.50
318.
96Sc
otia
Sel
ecte
d Ba
lanc
ed I
ncom
e A
1.66
4.09
3.81
4.17
7.32
5.17
5.94
3.95
-0.
691.
88-
1057
.53
Mer
itas
Inc
ome
& G
row
th P
ortf
olio
F1.
634.
023.
623.
787.
735.
525.
93-
-1.
971.
250.
8035
3.92
Desj
ardi
ns C
horu
s II
Mod
erat
eLow
Vol P
2.03
4.93
4.12
4.50
8.87
4.50
5.78
--
0.93
1.82
1.43
1815
.57

Canadian MoneySaver z https://www.canadianmoneysaver.ca z JUNE 2017 z 41
TOP FUNDS
Fund
Nam
e1
Mon
th
Retu
rn
(mth
-end
)
3 M
onth
Re
turn
(m
th-e
nd)
6 M
onth
Re
turn
(m
th-e
nd)
YTD
Ret
urn
(mth
-end
)1
Year
Ret
urn
(mth
-end
)3
Year
Ret
urn
(mth
-end
)5
Year
Ret
urn
(mth
-end
)10
Yea
r Re
turn
(m
th-e
nd)
15 Y
ear
Retu
rn
(mth
-end
)
Yiel
d 12
M
oM
ERM
gmt
Fee
Tota
l Ass
ets
($M
il)
CAN
AD
IAN
SH
ORT
TER
M F
IXED
IN
COM
EAC
M C
omm
erci
al M
ortg
age
Seri
es F
0.69
1.61
1.28
1.85
3.87
4.64
5.02
--
3.62
0.97
0.60
1107
.85
PH&
N M
ortg
age
Pens
ion
Trus
t Sr
O0.
901.
751.
271.
963.
943.
783.
864.
875.
303.
190.
16-
3955
.12
SEI
Shor
t Te
rm B
ond
Clas
s O
0.18
1.03
1.16
1.49
2.99
2.75
3.15
3.94
-2.
740.
11-
414.
62Po
wer
Shar
es 1
-5 Y
r Lad
dere
d Co
rp B
ond
F0.
531.
040.
881.
462.
402.
492.
81-
-3.
340.
390.
2549
5.60
Fide
lity
Cana
dian
Sho
rt T
erm
Bon
d Sr
O0.
491.
100.
911.
412.
452.
542.
813.
874.
312.
79-
-10
47.9
0Ca
nso
Shor
t Te
rm &
Flo
atin
g Ra
te C
l C0.
100.
470.
690.
591.
671.
642.
743.
84-
1.16
-0.
3072
.34
HSB
C M
ortg
age
Inst
itut
iona
l0.
170.
411.
280.
623.
102.
672.
733.
82-
2.55
0.10
0.00
2615
.49
RBC
Cana
dian
Sho
rt-T
erm
Inc
ome
Seri
es O
0.44
0.94
0.63
1.19
2.08
2.31
2.58
3.65
-2.
490.
02-
5386
.52
PIM
CO C
anad
ian
Shor
t Te
rm B
ond
M0.
470.
991.
061.
232.
292.
332.
56-
-1.
930.
540.
4633
.60
Coun
sel S
hort
Ter
m B
ond
Seri
es I
0.44
0.98
0.71
1.21
2.07
2.29
2.47
--
2.48
0.17
0.75
102.
34Fr
ankl
in B
isse
tt C
dn S
hort
Ter
m B
d F
0.67
1.49
1.53
1.80
4.27
2.43
2.45
3.30
-2.
930.
780.
5547
3.32
Mac
kenz
ie C
anad
ian
ST I
nc F
0.63
1.64
1.86
1.90
4.57
2.53
2.43
3.37
-2.
070.
790.
5531
5.81
Scot
ia S
hort
Ter
m B
ond-
PF0.
370.
820.
510.
991.
591.
972.
19-
-1.
930.
11-
375.
25U
nite
d Sh
ort-
Term
Inc
ome
Corp
orat
e Cl
W0.
230.
600.
600.
761.
371.
792.
13-
-0.
000.
19-
16.8
1Sp
rott
Sho
rt-T
erm
Bon
d Se
ries
F0.
450.
990.
701.
292.
042.
102.
12-
-1.
390.
660.
5019
.81
TD S
hort
Ter
m B
ond
- F
0.43
0.81
0.39
1.01
1.40
1.80
2.02
3.25
-1.
780.
610.
7560
07.2
0Ed
ucat
ors
Mor
tgag
e &
Inc
ome
0.25
0.83
0.78
1.08
2.40
1.80
2.00
2.84
3.36
1.79
1.19
1.10
203.
16Be
utel
Goo
dman
Sho
rt T
erm
Bon
d Cl
ass
F0.
470.
970.
581.
221.
691.
741.
81-
-2.
060.
660.
5020
2.62
IA C
lari
ngto
n Sh
ort-
Term
Bon
d Se
ries
F0.
350.
970.
491.
151.
691.
801.
80-
-1.
670.
950.
6521
.66
MD
Shor
t-Te
rm B
ond
0.39
0.84
0.30
0.92
1.54
1.50
1.63
2.59
2.96
1.91
1.00
0.85
538.
26
TOP
FUN
DS R
ANKE
D BY
FIV
E-YE
AR R
ETU
RN A
S OF
MAY
11,
201
7
CH
ART
NO
TES
For
info
rmat
ion
on t
he c
ateg
ory
defi
niti
ons,
ple
ase
visi
t ht
tp:/
/ww
w.c
ifsc
.org
/en/
inde
x.ph
p. F
ront
loa
d fu
nds
(Frn
t) c
harg
e a
fee
to i
nves
tors
whe
n un
its
are
purc
hase
d; d
efer
red
load
fund
s (D
ef)
char
ge a
fee
whe
n un
its
are
rede
emed
. Fro
nt lo
ads
may
be
redu
ced
(in
per c
ent
term
s) a
s th
e si
ze o
f the
inve
stm
ent
incr
ease
s;
defe
rred
load
s m
ay d
ecre
ase
as t
he t
ime
elap
sed
betw
een
purc
hase
and
rede
mpt
ion
leng
then
s. S
ome
fund
s ha
ve e
ithe
r a fr
ont
load
or a
def
erre
d lo
ad (
FnDf
). O
ther
s
have
no
load
fee
(Non
e). D
efer
red
sale
s ch
arge
s al
so k
now
n as
a b
ack-
end
load
, the
se d
efer
red
char
ges
typi
cally
go
dow
n ea
ch y
ear y
ou h
old
the
fund
, unt
il ev
entu
ally
they
reac
h ze
ro. D
efer
red
sale
s ch
arge
s gi
ve in
vest
ors
an in
cent
ive
to b
uy a
nd h
old,
as
wel
l as
a w
ay t
o av
oid
som
e sa
les
char
ges.
n Y
ear R
etur
n -
The
aver
age
annu
al
com
poun
d (a
nnua
lized
) ra
te o
f ret
urn
the
fund
has
per
form
ed o
ver t
he la
st “
n” y
ears
. It
assu
mes
rein
vest
men
t of
any
div
iden
d or
inte
rest
inco
me.
1 Y
ear R
etur
n (Y
r
endi
ng D
ecYY
) -
An a
nnua
l ret
urn
is t
he fu
nd o
r por
tfol
io re
turn
, for
any
12-
mon
th p
erio
d, in
clud
ing
rein
vest
ed d
istr
ibut
ions
. Tax
Eff
icie
ncy
- Ca
lcul
ated
by
divi
ding
the
fund
’s t
ax-a
djus
ted
retu
rn (
pre-
liqui
dati
on)
by it
s pr
e-ta
x re
turn
, and
can
onl
y be
cal
cula
ted
whe
n bo
th p
re-t
ax r
etur
ns a
nd t
ax-a
djus
ted
retu
rns
are
posi
tive
.
Dist
ribu
tion
Fre
quen
cy -
The
inte
rval
at w
hich
regu
lar c
apit
al o
r inc
ome
divi
dend
s ar
e di
stri
bute
d to
fund
uni
thol
ders
. Yea
r end
Qua
rtile
s - T
he q
uart
iles
(1 to
4)
give
the
indi
vidu
al fu
nd it
s po
siti
on re
lati
ve t
o al
l oth
ers
in t
he fu
nd t
ype
cate
gory
. For
exa
mpl
e, if
the
fund
’s q
uart
ile v
alue
is “
1” fo
r the
Dec
201
0 ye
aren
d, t
his
mea
ns
the
fund
’s ra
te o
f ret
urn
for t
he 1
2 m
onth
s en
ding
Dec
31,
201
0 is
in t
he t
op 2
5% o
f all
fund
s in
its
fund
typ
e ca
tego
ry.
Sour
ce -
Mor
ning
star
Pal
Trak
, Mor
ning
star
Can
ada,
(80
0) 5
31-4
725,
htt
p://
ww
w.m
orni
ngst
ar.c
a.

42 z Canadian MoneySaver z https://www.canadianmoneysaver.ca z JUNE 2017
Specialty ETFsTOP EXCHANGE TRADED FUNDS RANKED BY FIVE-YEAR RETURNS AS OF MAY 11, 2017 Fund Name Ticker Mkt Tot Return
YTD(Current)
Mkt Tot Ret 1 Mo
(Current)
Mkt Tot Ret 3 Mo (Current)
Mkt Tot Ret 12 Mo
(Current)
Mkt Tot Ret 3 Yr
(Current)
Mkt Tot Ret 5 Yr
(Current)
Mkt Tot Ret urn Since Incept
(Current)
iShares S&P/TSX Capped Info Tech XIT 11.27 3.75 10.71 24.80 18.06 19.82 2.39
BetaPro Crude Oil -2x Daily Bear ETF HOD 23.53 6.78 17.63 -13.70 41.18 18.91 -
BMO Eq Wght US HlthCare Hdgd to CAD ETF ZUH 13.51 3.31 9.29 12.94 13.15 18.88 -
iShares US Fundamental Adv CLU.B 0.40 0.00 0.39 16.12 12.79 18.04 16.81
iShares MSCI World XWD 9.93 4.08 10.55 24.80 13.44 16.92 13.27
iShares Global Water Adv CWW.A 10.08 0.00 10.11 15.31 11.01 16.32 5.72
PowerShares QQQ ETF QQC.F 14.83 2.58 9.48 29.66 16.74 16.24 17.81
BMO Global Infrastructure ETF ZGI 9.12 3.05 10.92 25.14 12.89 15.91 16.41
BMO India Equity ETF ZID 22.25 5.24 21.32 31.81 17.59 15.90 7.33
BMO Low Volatility Canadian Equity ETF ZLB 7.78 2.85 7.44 15.56 14.26 15.83 16.06
iShares Global Healthcare (CAD-Hedged) XHC 9.11 1.31 7.79 9.21 8.98 15.49 14.92
iShares India XID 22.42 4.76 18.72 33.24 17.61 15.45 -
BMO Eq Weight US Banks Hedged to CAD ETF ZUB -0.84 -1.01 -1.49 37.08 10.19 15.03 -
First Asset TechGntsCovCall ETF CADHComm TXF 12.62 1.33 8.31 36.24 14.78 14.91 14.71
Horizons Active Global Dividend ETF Comm HAZ 8.65 2.90 10.71 20.04 13.55 14.61 -
First Asset Mstar NatlBk Québec ETF Comm QXM 3.59 1.87 3.65 10.45 10.71 14.40 14.43
First Asset Mstar NatlBk Québec ETF Adv QXM.A 3.55 2.40 2.86 9.38 11.14 14.14 13.56
iShares Equal Weight Banc & Lifeco Comm CEW 1.63 -1.89 -0.82 21.66 10.60 14.11 8.48
iShares Japan Fundamental (CAD-Hdg) Comm CJP 1.81 -2.02 0.86 25.19 10.40 14.08 -2.49
iShares Global Agriculture Comm COW 7.23 3.74 9.39 27.32 11.87 13.94 8.26
iShares Japan Fundamental (CAD-Hdg) Adv CJP.A -1.52 0.00 -1.00 13.01 9.86 13.79 -3.07
BMO China Equity ETF ZCH 19.30 4.91 15.08 24.90 13.91 13.79 7.94
iShares International Fundamental Comm CIE 10.51 7.72 10.09 24.51 7.06 13.54 2.24
iShares Global Real Estate Adv CGR.A 6.95 4.83 6.95 7.08 11.79 13.45 6.80
iShares Global Real Estate Comm CGR 6.02 3.99 8.25 11.05 12.29 13.40 7.62
iShares US Dividend Growers(CAD-Hdg)Comm CUD 4.10 0.25 3.20 12.46 10.13 13.37 14.63
iShares Equal Weight Banc & Lifeco Adv CEW.A 0.53 -2.05 -0.93 20.55 9.60 13.23 7.55
PowerShares FTSE RAFI US Fundamental ETF PXU.F 2.67 -0.25 2.43 13.72 7.70 13.14 13.38
iShares Global Agriculture Adv COW.A 5.06 3.09 8.89 25.58 10.59 12.92 7.33
iShares International Fundamental Adv CIE.A 9.95 7.06 9.04 23.59 6.59 12.73 1.38
BMO MSCI EAFE Hdgd to CAD ETF ZDM 6.43 1.14 6.21 20.08 7.70 11.67 6.86
First Asset Canadian REIT ETF Comm RIT 7.38 1.44 5.79 16.28 14.57 11.50 -
Vanguard FTSE Dev All Cap ex US ETF CADH VEF 6.93 1.52 6.06 19.51 7.45 11.33 11.45
iShares Jantzi Social XEN 2.88 0.72 2.18 16.98 5.92 9.28 3.85
First Asset MstarUSDivTgt50 ETF CADHComm UXM 4.13 0.60 3.25 7.15 4.94 9.20 9.07
First Asset CanBanc Income Class ETF CIC 0.73 -3.34 -2.13 23.24 8.87 9.01 -
First Asset Mstar Canada Value ETF Comm FXM 1.62 -1.70 -0.60 11.10 0.60 8.84 9.61
Horizons Seasonal Rotation ETF Comm HAC 3.14 0.00 1.63 9.59 8.65 8.62 8.68
iShares CAN Fincl Monthly Inc Adv FIE.A 1.44 -2.76 -0.63 15.10 6.27 8.49 3.94
Vanguard FTSE Canada ETF VCE 2.56 0.40 2.15 15.59 5.54 8.29 8.11
©2017 Morningstar. All Rights Reserved. The information, data, analyses and opinions contained herein (1) include the confidential and proprietary information of Morningstar, (2) may include, or be derived from, account information provided by your financial advisor which cannot be verified by Morningstar, (3) may not be copied or redistributed,(4) do not constitute investment advice offered by Morningstar, (5)are provided solely for informational purposes and therefore are not an offer to buy or sell a security, and (6) are not warranted to be correct, complete or accurate. Except as otherwise required by law, Morningstar shall not be responsible for any trading decisions, damages or other losses resulting from, or related to, this information, data, analyses or opinions or their use. This report is supple-mental sales literature. If applicable it must be preceded or accompanied by a prospectus, or equivalent,and disclosure statement.
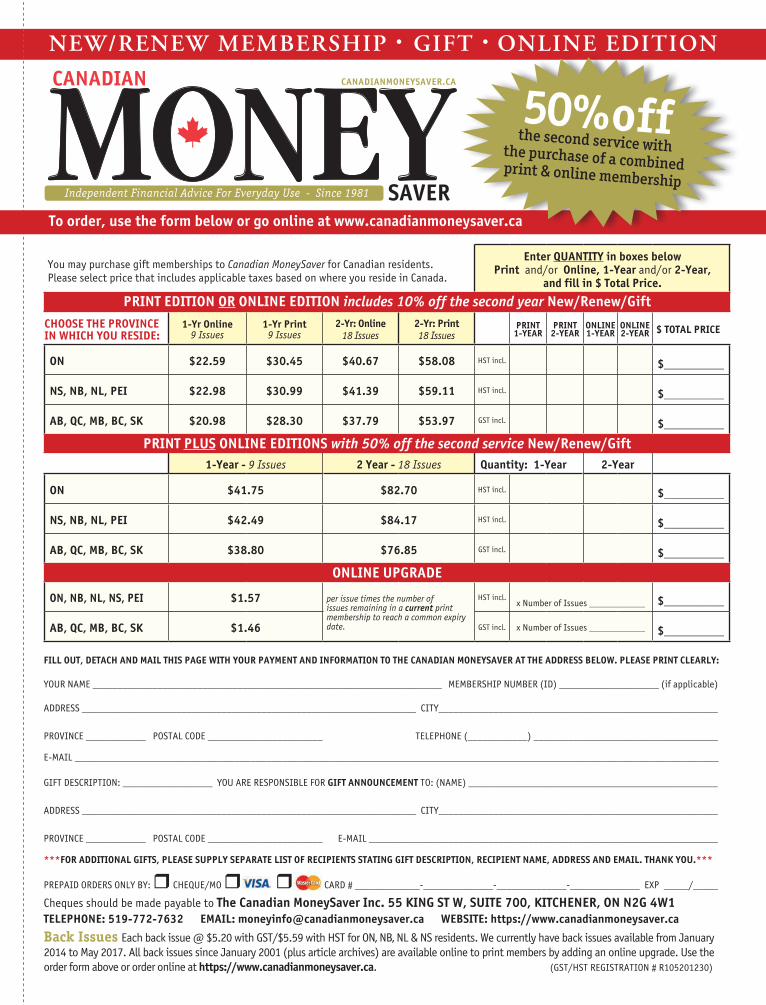
Back Issues Each back issue @ $5.20 with GST/$5.59 with HST for ON, NB, NL & NS residents. We currently have back issues available from January 2014 to May 2017. All back issues since January 2001 (plus article archives) are available online to print members by adding an online upgrade. Use the order form above or order online at https://www.canadianmoneysaver.ca. (GST/HST REGISTRATION # R105201230)
NEW/RENEW MEMBERSHIP • GIFT • ONLINE EDITION
MONEYCANADIAN CANADIANMONEYSAVER.CA
Independent Financial Advice For Everyday Use - Since 1981 SAVERTo order, use the form below or go online at www.canadianmoneysaver.ca
FILL OUT, DETACH AND MAIL THIS PAGE WITH YOUR PAYMENT AND INFORMATION TO THE CANADIAN MONEYSAVER AT THE ADDRESS BELOW. PLEASE PRINT CLEARLY:
YOUR NAME ______________________________________________________________________ MEMBERSHIP NUMBER (ID) ____________________ (if applicable)
ADDRESS ___________________________________________ ________________________ CITY________________________________________________________
PROVINCE ____________ POSTAL CODE _______________________ TELEPHONE (____________) _____________________________________
E-MAIL _________________________________________________________________________________________________________________________
GIFT DESCRIPTION: __________________ YOU ARE RESPONSIBLE FOR GIFT ANNOUNCEMENT TO: (NAME) __________________________________________________
ADDRESS ___________________________________________ ________________________ CITY________________________________________________________
PROVINCE ____________ POSTAL CODE _______________________ E-MAIL ______________________________________________________________________
***FOR ADDITIONAL GIFTS, PLEASE SUPPLY SEPARATE LIST OF RECIPIENTS STATING GIFT DESCRIPTION, RECIPIENT NAME, ADDRESS AND EMAIL. THANK YOU.***
PREPAID ORDERS ONLY BY: CHEQUE/MO CARD # _____________-______________-______________-______________ EXP _____/_____
Cheques should be made payable to The Canadian MoneySaver Inc. 55 KING ST W, SUITE 700, KITCHENER, ON N2G 4W1 TELEPHONE: 519-772-7632 EMAIL: [email protected] WEBSITE: https://www.canadianmoneysaver.ca
Enter QUANTITY in boxes belowPrint and/or Online, 1-Year and/or 2-Year,
and fill in $ Total Price.
PRINT EDITION OR ONLINE EDITION includes 10% off the second year New/Renew/Gift
CHOOSE THE PROVINCE IN WHICH YOU RESIDE:
1-Yr Online 9 Issues
1-Yr Print9 Issues
2-Yr: Online18 Issues
2-Yr: Print18 Issues
PRINT1-YEAR
PRINT2-YEAR
ONLINE1-YEAR
ONLINE2-YEAR $ TOTAL PRICE
ON $22.59 $30.45 $40.67 $58.08 HST incl. $__________
NS, NB, NL, PEI $22.98 $30.99 $41.39 $59.11 HST incl. $__________
AB, QC, MB, BC, SK $20.98 $28.30 $37.79 $53.97 GST incl. $__________
PRINT PLUS ONLINE EDITIONS with 50% off the second service New/Renew/Gift1-Year - 9 Issues 2 Year - 18 Issues Quantity: 1-Year 2-Year
ON $41.75 $82.70 HST incl. $__________
NS, NB, NL, PEI $42.49 $84.17 HST incl. $__________
AB, QC, MB, BC, SK $38.80 $76.85 GST incl. $__________
ONLINE UPGRADE
ON, NB, NL, NS, PEI $1.57 per issue times the number of issues remaining in a current print membership to reach a common expiry date.
HST incl.x Number of Issues ____________ $__________
AB, QC, MB, BC, SK $1.46 GST incl. x Number of Issues ____________ $__________
You may purchase gift memberships to Canadian MoneySaver for Canadian residents. Please select price that includes applicable taxes based on where you reside in Canada.
50%off the second service with the purchase of a combined print & online membership

Choose Your Funds With Confidence
Time to Renew?
Give as a Gift?If your mailing address is printed BELOW this box,
your membership is about to expire. Renew today and assure continuous service.
Use the form on the reverse side or the renewal envelope bound inside this issue to renew.
No other renewal notice is sent.
Give as a gift and share the wealth of financial knowledge and expert advice
with a friend or family member.
You can also renew or order online at www.canadianmoneysaver.ca
Don't miss a single issue!
MONEYCANADIAN CANADIANMONEYSAVER.CA
Independent Financial Advice For Everyday Use - Since 1981 SAVER
Bringing You The Best ETFs And Mutual Funds
*Provided in digital formats only. OFFER EXPIRES AUGUST 31, 2017. All prices are subject to applicable taxes.
ADD VALUE TO YOUR PORTFOLIOETF & Mutual Fund UpdateThe ETF and Mutual Fund Update letter helps guide investors through an overwhelming array of fund choices to help find the investment product that is best for you. On a monthly basis, our letter will discuss which funds might make you money, are worth the fees and which ones should simply be avoided.
1 Year of Newsletters $79.952 Years of Newsletters $142.95 (10% off)
Contact us by e-mail at [email protected]
NOW SAVE
25%VISIT LINK BELOW
Monthly IssuesSubscribers receive 12-monthly issues of the ETF and Mu-tual Fund Update as well as access to all past letters.
Recommended ListsPick top-quality funds with confidence from one of our ETF or Mutual Fund Recommended lists, updated quartely.
Q & A ServiceRead what other fund investors are asking via our Question & Answer service, courtesy of our partner, 5i Research.
Diversify Your PortfolioUse ETFs to build a low-cost and diversified portfolio using either the Canadian MoneySaver or Couch Potato portfolios.
Fund SpotlightLearn about new funds and how they can add value to your portfolio in our monthly Fund Spotlight.
Stay CurrentStay up to date with topical articles covering anything from the fund industry to sector trends to global market news.
For more details visit https://etffundupdate.ca/?ecdsc=CMS