money under 35 - navient€¦ · money under 35. navient’s 2015 national study designed to...
TRANSCRIPT

Money Under 35Navient’s 2015 national study designed to measure the financial health of young adults between the ages of 22 and 35
Conducted byIpsos Public Affairs
Navient | Money Under 35 2
About Navient
As the nation’s leading loan management, servicing and asset recovery company, Navient (Nasdaq:NAVI) helps customers navigate the path to financial success. Servicing more than $300 billion in student loans, the company supports the educational and economic achievements of more than 12 million Americans. A growing number of public- and private-sector clients rely on Navient for proven solutions to meet their financial goals. Learn more at Navient.com.
Navient123 Justison StreetWilmington, DE 19801Navient.com
About Ipsos Public Affairs
Ipsos is a global independent market research company ranking third worldwide in revenue among research firms. At Ipsos, we are passionately curious about people, markets, brands and society. We make our changing world easier and faster to navigate, and inspire clients to make smarter decisions. We deliver research with security, speed, simplicity and substance.
Ipsos is excited in 2015 to be celebrating our 40th anniversary. Driving the industry with innovative, best-in-class research techniques that are meaningful in today’s connected society is our commitment and our primary goal.
Ipsos Public Affairs2020 K Street NW, Suite 410Washington, DC 20006ipsos-na.com/research/public-affairs
About This Study
This is the first release of Money Under 35, a Navient
national study conducted by Ipsos and designed
to measure the financial well-being of young adults
ages 22 to 35.
The respondents were young adults at all levels
of educational attainment, including those with a
high school education or less, those who attended
some college without earning a degree, and those
who have earned associate, bachelor’s or advanced
(master’s, professional or doctoral) degrees.
Money Under 35 depicts the average income, savings
and debt of the “typical” young adult. This typical
young adult is an aggregate representation of the
responses to the survey questions. The survey
questions included concrete items such as income,
amounts in savings, amounts in debt/loans; more
subjective items, such as satisfaction with life, job,
income and prospects for the future; and finally,
questions about attitudes and beliefs about finances.
To provide a more holistic evaluation of financial
health, Money Under 35 created an index of financial
health that incorporates a number of objective and
behavioral elements. These items were subjected
to reliability testing to ensure they are measuring
the same underlying concept (financial health) and
were then combined into a summated index that was
rescaled to a 0–100 scale for ease of interpretation.
Ipsos conducted 3,006 online interviews using a
nationally representative sample between July 16 and
August 5, 2015. Five in-depth follow-up interviews
were conducted with respondents from the original
survey between September 17 and 19, 2015.
Navient | Money Under 35 3
Money Under 35:Executive summaryAt its core, financial health is both an objective and a perceptual matter. To assess financial health it is important to consider factual evidence like income and debt, along with more subjective issues such as self-assessment, attitudes and beliefs. Young adults between the ages of 22 and 35 go through many transitional periods in their lives: leaving high school or college, starting their first job, going back to school, getting married, buying a home and starting their family. They are often making choices that will affect the rest of their lives.
The Great Recession (2007–09) directly affected many in this age group, especially as they left school and entered the workforce. The goal of this study is to examine the financial health of this age cohort in the context of an economy recovering from recession — assessing not only their overall standing but also the extent to which educational attainment has provided these young Americans the resiliency to counter recessionary effects.
Money Under 35 finds that young adults are not only financially healthy but also actively focused on saving and managing their credit. In fact, young adults are generally doing well — most of them are rated in “good” financial health, according to the Money Under 35 index. Many are starting families, saving money and managing their finances. Financial health increases over time as young adults gain education, build incomes and repay student loans.
Financial Health Index: Financial health improves with age and education, and 65 percent of young adults see their education as a worthwhile investment.
• Sixty-three percent of young adults score in the “good” financial health range, while 20 percent are in “excellent” financial health and 17 percent are in “poor” financial health.
º Age 30 is a break point in moving from “good” to “excellent” financial health.
• Financial health increases with education, with 32 percent of advanced degree holders1 achieving “excellent” financial health. This is compared to 22 percent for bachelor’s degree holders and 20 percent for individuals with a high school or less education2.
º Individuals with a high school education score in “excellent” financial health at a higher rate than do those who attended some college but did not earn a degree (20% versus 16%).
º Achieving at least a bachelor’s degree significantly reduces the likelihood of scoring in the “poor” financial health range; fewer than one in 10 with a bachelor’s or advanced degree is in “poor” financial health (8% bachelor’s, 5% advanced) compared to two in 10 of those who did not achieve a degree (20% high school or less, 21% some college, no degree).
• Individuals in “excellent” financial health are more likely to prioritize being debt-free over being happy. These individuals also put a higher priority on owning a home than do those in “good” or “poor” financial health.
• Young adults in “poor” and “excellent” financial health both tend to engage in cost-saving behaviors, such as eating at home and using a grocery list, more frequently than do those in “good” financial health.
• Agreement that education was a worthwhile investment rises with educational attainment. Seventy-eight percent of young adults with a degree (73% associate, 79% bachelor’s, 81% advanced) agree that their education was a worthwhile investment, versus 59 percent of those without a degree (56% high school or less, 63% some college, no degree).
Employment and income: Positively related to educational attainment.
• Among all young adults surveyed, seven in 103 are working at least part time, 8 percent are students, 11 percent are full-time at-home parents and 11 percent are unemployed.
1 Advanced degree holders are those with a master’s, professional or doctoral degree.2 High school or less education refers to those whose formal education was completed before or upon achievement of a high school diploma or GED.3 The national average employment rate for 25-to-34-year-olds is 76.7 percent. Source: Bureau of Labor and Statistics, September 2015 data.
Navient | Money Under 35 4
• Young adults with at least a bachelor’s degree are far more likely to be employed full time (77% bachelor’s, 85% advanced degree) than are those with a high school or less education (47%).
• Educational attainment provides a buffer against unemployment as well. Just 2 percent of those with an advanced degree, 5 percent of bachelor’s degree holders and 8 percent of associate degree holders are unemployed versus 18 percent unemployment among those with a high school education or less4.
• Median personal income for those with no college degree is $42,500 (including some college, no degree and high school or less), while individuals with a college degree average $62,500 in median personal income (associate degree $51,080, bachelor’s degree $62,500, advanced degree $95,000).
• The perception of being paid fairly actually decreases with higher levels of education, with 43 percent of associate degree holders feeling underpaid compared to 49 percent of advanced degree holders.
Savings: Almost unanimously, young adults are saving.
• Ninety-four percent of young adults are saving, either for long-term goals like retirement or purchasing a home, or for shorter-term items like vacations or weddings.
• The top priority across all age groups is an emergency fund (19%).
• After an emergency fund, the next four top saving priorities are:
º Home ownership (15%)
º Children’s education (12%)
º Personal education (11%)
º Retirement (11%)
Financial management: Young adults are aware of their finances and make conscious spending decisions.
• A large majority of young adults stay on top of their spending, with 80 percent reporting they check finances before making a purchase, 78 percent always knowing the amount in their bank account and 76 percent checking finances after making a purchase.
• Three out of five (61%) young adults know their current credit score.
• Forty percent of young adults use their bank’s website or mobile application to manage their finances, although 36 percent still balance their checkbook by hand.
º Those with the highest income levels are most likely to use technology in financial management.
• Among major forms of debt (student, mortgage, auto and credit card), student debt is the only one that tends to decrease with age.
º Twenty-seven percent of 22-to-24-year-olds have credit card debt, compared to 44 percent of 34-to-35-year-olds. Meanwhile, student debt falls from 37 percent to 32 percent for those groups, respectively.
Mortgage borrowing: Student loan borrowers who complete a degree are substantially more likely to have a mortgage than are young adults who completed a degree without student debt.
• The difference in mortgages between student loan borrowers and non-borrowers persists within degree types:
º Associate degree: 25 percent of borrowers versus 20 percent of non-borrowers have mortgages.
º Bachelor’s degree: 35 percent of borrowers versus 24 percent of non-borrowers.
º Advanced degree: 45 percent of borrowers versus 37 percent of non-borrowers.
4 The difference is explained partly by those acting as full-time at-home parents. Twice as many young adults with a high school education or less work as full-time at-home parents compared to those with a bachelor’s degree (13% and 6%, respectively).
Navient | Money Under 35 5
Household formation: Those with higher levels of education are more likely to get married; borrowing for college does not deter family formation.
• Young adults with an advanced degree are twice as likely as those with an associate degree to be married (67% versus 35%, respectively).
º Bachelor’s degree holders who borrowed for college are equally likely to have children as those who did not borrow for college (39% and 40% respectively) and to be married (52% for both groups).
º Advanced degree holders who did borrow for college are more likely to be married (70%) and have children (51%) than are advanced degree holders who did not borrow (62% and 42%, respectively).
Gender: Men and women continue to have different rates of full-time employment, and pay varies substantially within the same professional field.
• Sixty-four percent of young adult men are employed full time, compared to 47 percent of young adult women, a difference explained mostly by women’s choice to act as a full-time at-home parent (21% of women versus 1% of men).
• Income differences within the same field of study are often substantial: in engineering, women make 17 percent less than their male counterparts, while women make 53 percent less than men in social science fields (e.g., psychology, economics, political science). The narrowest income gap, 5 percent, is observed in math/science fields (e.g., biology, computer science).
• Women are more likely than men to have the most common types of debt except student loans: auto, mortgage and credit card debt, with a 10 percent lead over men for auto loans (34% to 24%).
º Student loans are the only type of debt that men are more likely to have, with 36 percent of men reporting student borrowing, versus 32 percent of women.
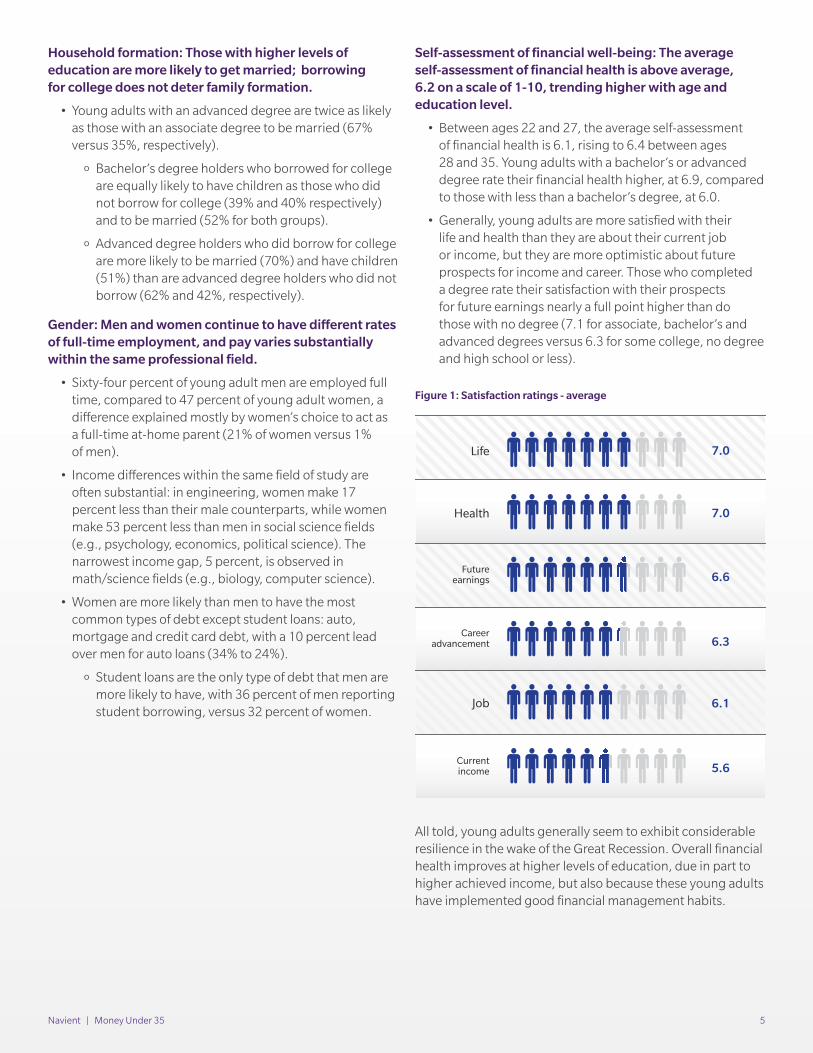
Self-assessment of financial well-being: The average self-assessment of financial health is above average, 6.2 on a scale of 1-10, trending higher with age and education level.
• Between ages 22 and 27, the average self-assessment of financial health is 6.1, rising to 6.4 between ages 28 and 35. Young adults with a bachelor’s or advanced degree rate their financial health higher, at 6.9, compared to those with less than a bachelor’s degree, at 6.0.
• Generally, young adults are more satisfied with their life and health than they are about their current job or income, but they are more optimistic about future prospects for income and career. Those who completed a degree rate their satisfaction with their prospects for future earnings nearly a full point higher than do those with no degree (7.1 for associate, bachelor’s and advanced degrees versus 6.3 for some college, no degree and high school or less).
All told, young adults generally seem to exhibit considerable resilience in the wake of the Great Recession. Overall financial health improves at higher levels of education, due in part to higher achieved income, but also because these young adults have implemented good financial management habits.
Life 7.0
7.0Health
6.1Job
6.3Career
advancement
5.6Currentincome
6.6Future
earnings
Figure 1: Satisfaction ratings - average
Navient | Money Under 35 6
Table of contents Page
About this study ............................................................. 2
Executive summary ........................................................ 3
Detailed findings ............................................................ 9
Income and employment ............................................... 9
Debt and other payments ............................................13
Borrowing for college ..................................................16
Value of educational attainment .................................22
Savings goals and habits .............................................24
Financial management ................................................26
Financial health index ..................................................27
Index findings ...............................................................28
Tables ............................................................................31
Technical notes .............................................................96
Figures Page
Figure 1: Satisfaction ratings – average ............................. 5
Figure 2: Employment status ............................................ 9
Figure 3: Benefits of education on employment .............. 10
Figure 4: Unemployed young adults ............................... 10
Figure 5: Personal income by educational attainment ....................................................... 10
Figure 6: Personal income by age ................................... 11
Figure 7: Mean personal income by field of study ........... 11
Figure 8: Employment by gender ................................... 11
Figure 9: Field of study by gender ................................... 12
Figure 10: Perception of pay fairness .............................. 12
Figure 11: Percentage with debt and average debt amount by debt type and gender ................... 13
Figure 12: Percentage with debt and average debt amount by debt type and age ......................... 14
Figure 13: Percentage with debt by debt type and income level group ........................................ 14
Figure 14: Average amount owed by debt type and income level group ........................................ 14
Figure 15: Percentage with mortgage by educational attainment .................................. 15
Figure 16: How individuals experiencing trouble paying their bills prioritize each bill............................ 16
Figure 17: Difficulties making payments by educational attainment ............................. 16
Figure 18: Percentage with student loan debt and average loan amount by educational attainment ..................................................... 17
Figure 19: Student loan pay-off rate by educational attainment ..................................................... 17
Figure 20: Percentage with student loan debt and average student loan debt by age group ........ 17
Figure 21: Percentage with mortgage by educational attainment and college borrowing ................. 18
Figure 22: Percentage married by educational attainment and college borrowing ................. 19
Figure 23: Percentage with children by educational attainment and college borrowing ................. 19
Figure 24: Ability to engage in spontaneous social activities by educational attainment and college borrowing .......................................... 19
Figure 25: Perception of being financially stable by educational attainment and college borrowing ...................................................... 20
Figure 26: Percentage worried about paying all bills each month by educational attainment and college borrowing ................................... 20
Figure 27: Percentage worried about debts by educational attainment and college borrowing ...................................................... 21
Figure 28: Average savings amount by educational attainment and college borrowing ................. 21
Figure 29: Percentage reporting trouble making payments by educational attainment and college borrowing ................................... 21
Figure 30: Belief in the value of education ....................... 22
Figure 31: Belief in the value of education by amount borrowed for college ......................... 22
Figure 32: Benefits of education on social development ................................................. 22
Figure 33: Currently attending school ............................. 23
Figure 34: Primary identity as student ............................ 23
Figure 35: Continued education goal by age ................... 23
Figure 36: Ability to put away money each month by educational attainment ............................. 24
Figure 37: Ability to put away money each month by income group ............................................ 24
Figure 38: Savings goals and top priority ........................ 25
Navient | Money Under 35 7
Figure 39: Savings vehicles used by age ......................... 25
Figure 40: Know credit score .......................................... 26
Figure 41: How credit score was obtained ....................... 26
Figure 42: Financial health index scores .......................... 28
Figure 43: Financial health scores by age ........................ 28
Figure 44: Financial health scores by educational attainment ..................................................... 29
Figure 45: “Excellent” financial health scores by educational attainment and college borrowing ...................................................... 29
Figure 46: “Excellent” financial health scores by field of study .................................................. 29
Figure 47: Percentage rating item as “most important” to them by financial health index score .................................................... 29
Figure 48: High participation in social activities for those with “excellent” financial health index scores ................................................... 30
Figure 49: Percentage participating in cost-saving strategies by financial health index score .............................................................. 30
Figure 50: Percentage rating item as “most important” to them .......................................................... 30
Figure 51: Self-assessment average satisfaction ratings by “most important” goal ................... 30
Personal profiles Page
Timothy .......................................................................... 12
Jenna .............................................................................. 20
Sarah .............................................................................. 23
Nicole ............................................................................. 26
Brody ............................................................................. 28
Tables Page
Table 1: Educational attainment ...................................... 31
Table 2: Employment status ............................................ 32
Table 3: Employed and attending school ........................ 33
Table 4: Goal of education .............................................. 34
Table 5: Attending school and employed ........................ 35
Table 6: Financial health self-assessment ........................ 36
Table 7: Satisfaction ratings: Top 3 box summary (10/9/8)............................................................. 37
Table 8: Satisfaction ratings: Mean summary .................. 38
Table 9: Life satisfaction rating ........................................ 39
Table 10: Health satisfaction rating ................................. 40
Table 11: Job satisfaction rating ...................................... 41
Table 12: Current income satisfaction rating ................... 42
Table 13: Prospect for career advancement satisfaction rating ............................................ 43
Table 14: Prospect for future earnings satisfaction rating ............................................................... 44
Table 15: Reasons for attending college .......................... 45
Table 16: Benefits of education: Mean agreement summary ......................................................... 47
Table 17: Personal income .............................................. 49
Table 18: Household income .......................................... 50
Table 19: Job versus career .............................................. 51
Table 20: Working in field of study .................................. 52
Table 21: Reason for not working in field of study ............ 53
Table 22: Field of study ................................................... 55
Table 23: Perception of pay fairness ................................ 56
Table 24: Perception of education level ........................... 57
Table 25: Career advancement ....................................... 58
Table 26: Looking for work .............................................. 59
Table 27: Why not looking for work ................................. 60
Table 28: Financial behaviors/attitudes: Mean agreement summary .............................. 61
Table 29: Debt frequency ................................................ 64
Table 30: Debt amounts: Mean summary ....................... 65
Table 31: Difficulty making payments ............................. 66
Table 32: Payment priority: Mean summary ................... 67
Table 33: Applied for mortgage....................................... 69
Table 34: Applied for mortgage: Time frame ................... 70
Table 35: Issues getting mortgage ................................. 71
Table 36: Mortgage issues faced ..................................... 72
Table 37: Reasons for not applying for mortgage ............ 73
Table 38: Savings goals ................................................... 74
Table 39: Amounts saved for goals: Mean summary ................................................ 76
Table 40: Savings top priority .......................................... 78
Table 41: Savings methods ............................................. 79
Table 42: 401(k) match ................................................... 80
Table 43: Borrowed for college ....................................... 81
Table 44: Amount borrowed for college: Mean summary ................................................ 82
Table 45: Tools used for managing finances ....................83
Navient | Money Under 35 8
Table 46: Financial management behaviors: Mean agreement summary ....................... 84
Table 47: Technology ............................................... 85
Table 48: Financial beliefs: Mean agreement summary .................................................. 86
Table 49: Aware of credit score ................................. 89
Table 50: How aware of credit score ......................... 90
Table 51: Most important ......................................... 91
Table 52: Living situation ......................................... 92
Table 53: Why living with parents ............................. 93
Table 54: Marital status ........................................... 95
Table 55: Sample targets for gender, age, region, race and educational attainment ............... 96
Table 56: Margin of error for different domain sizes ............................................. 97
© 2015 Navient Solutions, Inc. All rights reserved. Navient and the Navient logo are service marks of Navient Solutions, Inc. Navient Corporation and its subsidiaries, including Navient Solutions, Inc., are not sponsored by or agencies of the United States of America.
Money Under 35
Navient | Money Under 35 9
Money Under 35: Detailed findingsThe detailed findings are grouped by general topic area, such as income and employment, debt and other payments, financial management, and an in-depth look at college borrowing.
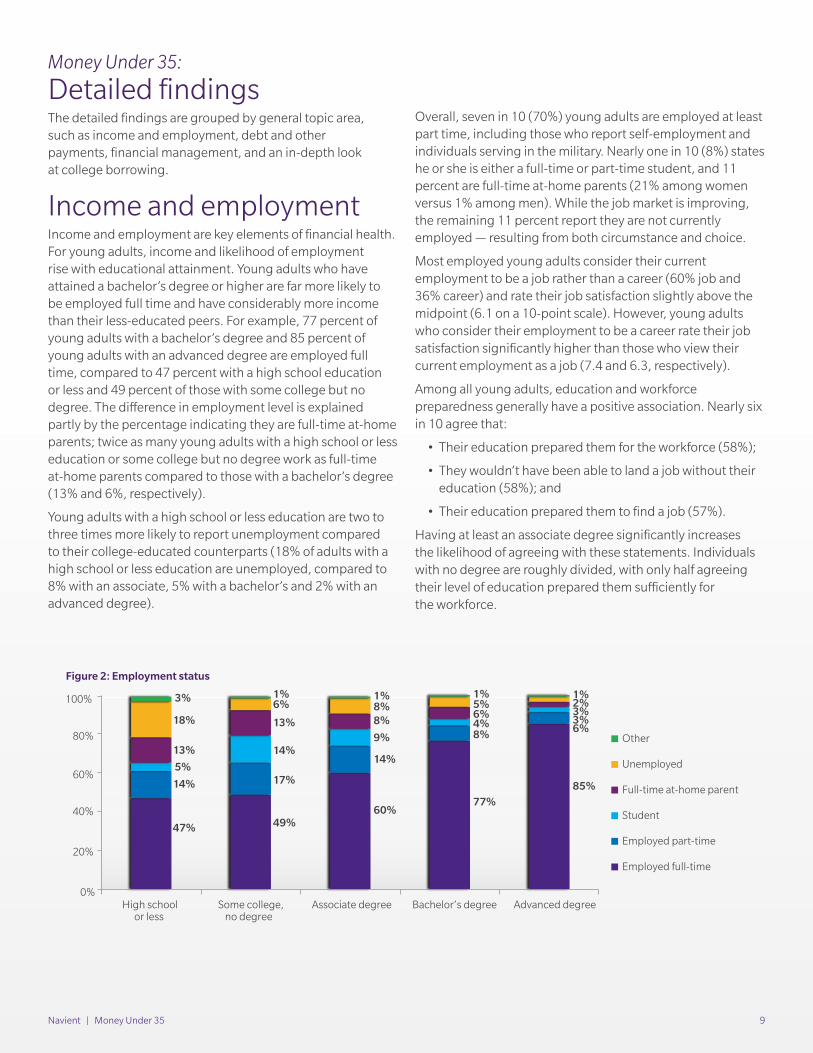
Income and employmentIncome and employment are key elements of financial health. For young adults, income and likelihood of employment rise with educational attainment. Young adults who have attained a bachelor’s degree or higher are far more likely to be employed full time and have considerably more income than their less-educated peers. For example, 77 percent of young adults with a bachelor’s degree and 85 percent of young adults with an advanced degree are employed full time, compared to 47 percent with a high school education or less and 49 percent of those with some college but no degree. The difference in employment level is explained partly by the percentage indicating they are full-time at-home parents; twice as many young adults with a high school or less education or some college but no degree work as full-time at-home parents compared to those with a bachelor’s degree (13% and 6%, respectively).
Young adults with a high school or less education are two to three times more likely to report unemployment compared to their college-educated counterparts (18% of adults with a high school or less education are unemployed, compared to 8% with an associate, 5% with a bachelor’s and 2% with an advanced degree).
Overall, seven in 10 (70%) young adults are employed at least part time, including those who report self-employment and individuals serving in the military. Nearly one in 10 (8%) states he or she is either a full-time or part-time student, and 11 percent are full-time at-home parents (21% among women versus 1% among men). While the job market is improving, the remaining 11 percent report they are not currently employed — resulting from both circumstance and choice.
Most employed young adults consider their current employment to be a job rather than a career (60% job and 36% career) and rate their job satisfaction slightly above the midpoint (6.1 on a 10-point scale). However, young adults who consider their employment to be a career rate their job satisfaction significantly higher than those who view their current employment as a job (7.4 and 6.3, respectively).
Among all young adults, education and workforce preparedness generally have a positive association. Nearly six in 10 agree that:
• Their education prepared them for the workforce (58%);
• They wouldn’t have been able to land a job without their education (58%); and
• Their education prepared them to find a job (57%).
Having at least an associate degree significantly increases the likelihood of agreeing with these statements. Individuals with no degree are roughly divided, with only half agreeing their level of education prepared them sufficiently for the workforce.
85%
6% 3% 3% 2%
47%
14%
5%
13%
18%
3%
49%
17%
14%
13%
6% 1%
60%
14%
9%
8% 8% 1%
77%
8% 4% 6% 5% 1% 1%
0%
20%
40%
60%
80%
100%
High schoolor less
Some college,no degree
Associate degree Bachelor’s degree Advanced degree
Other
Unemployed
Full-time at-home parent
Student
Employed part-time
Employed full-time
Figure 2: Employment status
Navient | Money Under 35 10
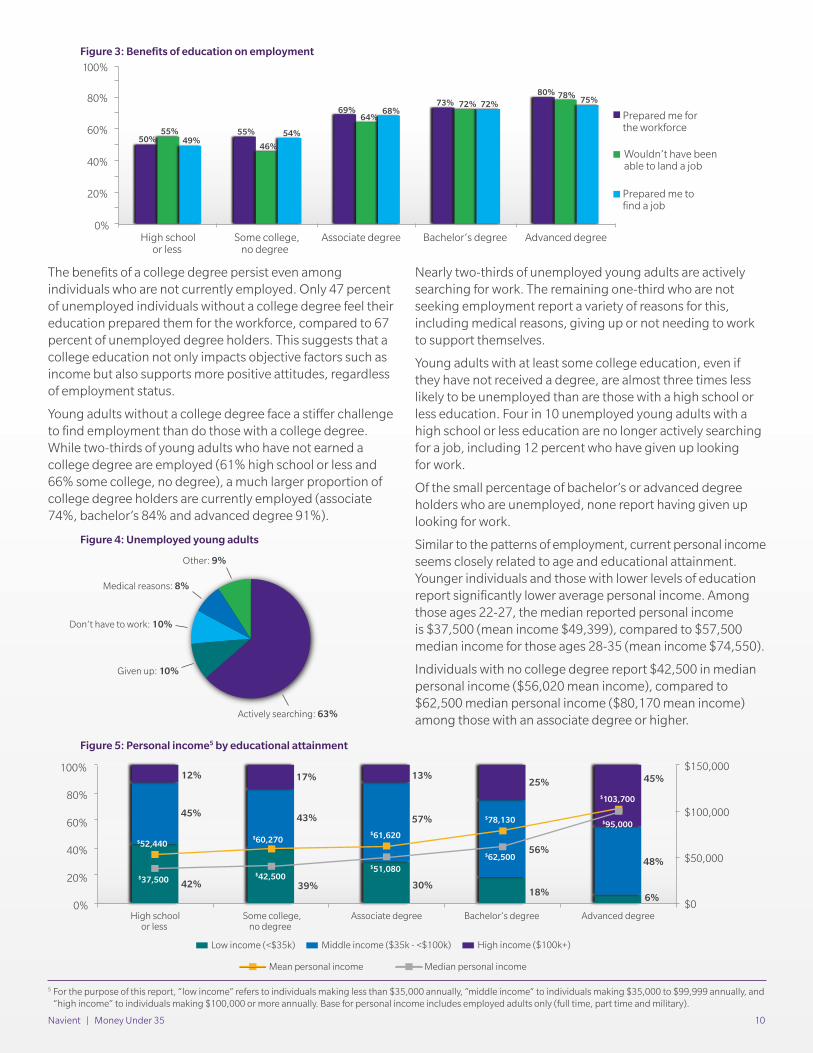
The benefits of a college degree persist even among individuals who are not currently employed. Only 47 percent of unemployed individuals without a college degree feel their education prepared them for the workforce, compared to 67 percent of unemployed degree holders. This suggests that a college education not only impacts objective factors such as income but also supports more positive attitudes, regardless of employment status.
Young adults without a college degree face a stiffer challenge to find employment than do those with a college degree. While two-thirds of young adults who have not earned a college degree are employed (61% high school or less and 66% some college, no degree), a much larger proportion of college degree holders are currently employed (associate 74%, bachelor’s 84% and advanced degree 91%).
Nearly two-thirds of unemployed young adults are actively searching for work. The remaining one-third who are not seeking employment report a variety of reasons for this, including medical reasons, giving up or not needing to work to support themselves.
Young adults with at least some college education, even if they have not received a degree, are almost three times less likely to be unemployed than are those with a high school or less education. Four in 10 unemployed young adults with a high school or less education are no longer actively searching for a job, including 12 percent who have given up looking for work.
Of the small percentage of bachelor’s or advanced degree holders who are unemployed, none report having given up looking for work.
Similar to the patterns of employment, current personal income seems closely related to age and educational attainment. Younger individuals and those with lower levels of education report significantly lower average personal income. Among those ages 22-27, the median reported personal income is $37,500 (mean income $49,399), compared to $57,500 median income for those ages 28-35 (mean income $74,550).
Individuals with no college degree report $42,500 in median personal income ($56,020 mean income), compared to $62,500 median personal income ($80,170 mean income)among those with an associate degree or higher.
50% 55%
69% 73%
80%
55%
46%
64%
72% 78%
49% 54%
68% 72% 75%
0%
20%
40%
60%
80%
100%
Prepared me forthe workforce
Wouldn’t have beenable to land a job
Prepared me tofind a job
High schoolor less
Some college,no degree
Associate degree Bachelor’s degree Advanced degree
Figure 3: Benefits of education
Figure 3: Benefits of education on employment
Actively searching: 63%
Medical reasons: 8%
Don’t have to work: 10%
Given up: 10%
Other: 9%
Figure 4: Unemployed young adults Figure 4: Unemployed young adults
39% 30% 18% 6%
45%
42%
43% 57%
56% 48%
12% 17% 13%25% 45%
$52,440
$37,500
$60,270
$42,500
$61,620
$51,080
$78,130
$62,500
$103,700
$95,000
$0
$50,000
$100,000
$150,000
0%
20%
40%
60%
80%
100%
Low income (<$35k) Middle income ($35k - <$100k) High income ($100k+)
Mean personal income Median personal income
Figure 5: Average Personal Income by Educational Attainment
High schoolor less
Some college,no degree
Associate degree Bachelor’s degree Advanced degree
5 For the purpose of this report, “low income” refers to individuals making less than $35,000 annually, “middle income” to individuals making $35,000 to $99,999 annually, and “high income” to individuals making $100,000 or more annually. Base for personal income includes employed adults only (full time, part time and military).
Figure 5: Personal income5 by educational attainment
Navient | Money Under 35 11
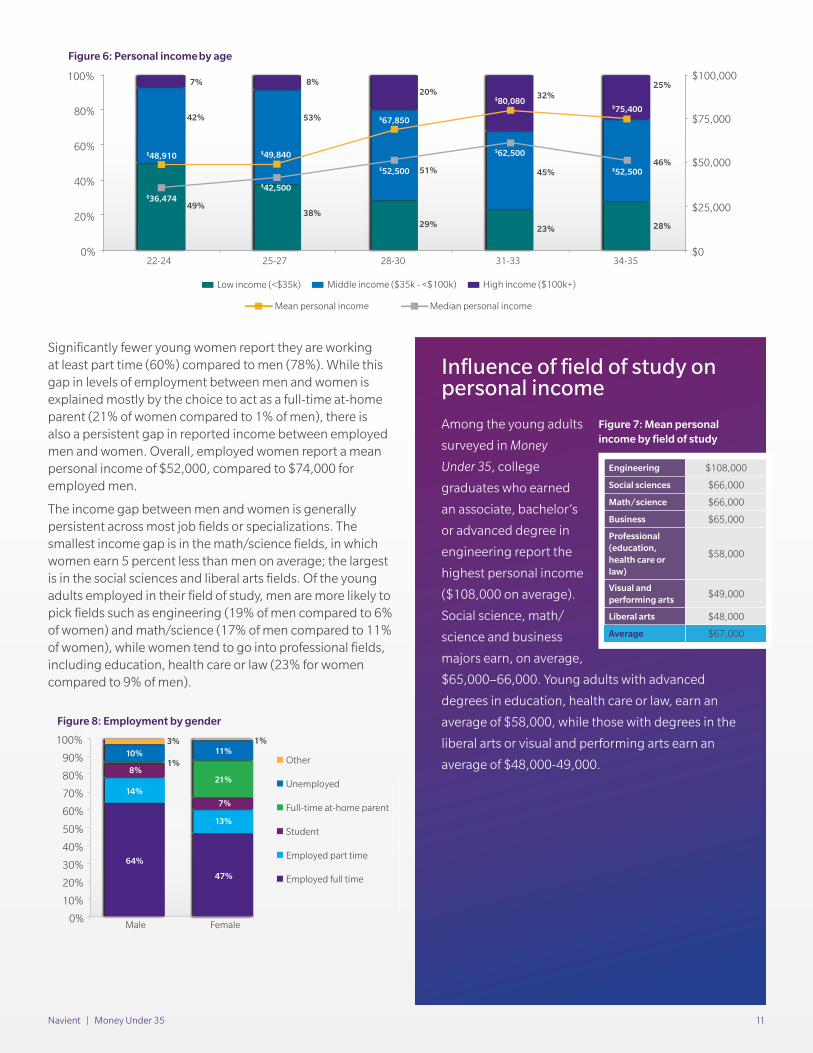
Significantly fewer young women report they are working at least part time (60%) compared to men (78%). While this gap in levels of employment between men and women is explained mostly by the choice to act as a full-time at-home parent (21% of women compared to 1% of men), there is also a persistent gap in reported income between employed men and women. Overall, employed women report a mean personal income of $52,000, compared to $74,000 for employed men.
The income gap between men and women is generally persistent across most job fields or specializations. The smallest income gap is in the math/science fields, in which women earn 5 percent less than men on average; the largest is in the social sciences and liberal arts fields. Of the young adults employed in their field of study, men are more likely to pick fields such as engineering (19% of men compared to 6% of women) and math/science (17% of men compared to 11% of women), while women tend to go into professional fields, including education, health care or law (23% for women compared to 9% of men).
Figure 6: Personal income by age
Influence of field of study on personal income
Among the young adults
surveyed in Money
Under 35, college
graduates who earned
an associate, bachelor’s
or advanced degree in
engineering report the
highest personal income
($108,000 on average).
Social science, math/
science and business
majors earn, on average,
$65,000–66,000. Young adults with advanced
degrees in education, health care or law, earn an
average of $58,000, while those with degrees in the
liberal arts or visual and performing arts earn an
average of $48,000-49,000.
Figure 7:Personal Income by Field of StudyEngineering $108,000
Social sciences $66,000
Math/science $66,000
Business $65,000
Professional (education, health care or law)
$58,000
Visual and performing arts
$49,000
Liberal arts $48,000
Average $67,000
49% 38%
29% 23% 28%
42% 53%
51% 45% 46%
25% 7% 8% 20% 32%
$48,910
$36,474
$49,840
$42,500
$67,850
$52,500
$80,080
$62,500
$75,400
$52,500
$0
$25,000
$50,000
$75,000
$100,000
0%
20%
40%
60%
80%
100%
22-24 25-27 28-30 31-33 34-35
Figure 6: Average personal income by age
Low income (<$35k) Middle income ($35k - <$100k) High income ($100k+)
Mean personal income Median personal income
Figure 8: Employment by gender
64%
47%
14%
13%
8%
7%
1%
21%
10% 11% 3%
0%
10%
20%
30%
40%
50%
60%
70%
80%
90%
100%
Male Female
Other
Unemployed
1%
Full-time at-home parent
Student
Employed part time
Employed full time
Figure 8: Employment by gender
Figure 7: Mean personal income by field of study
Navient | Money Under 35 12
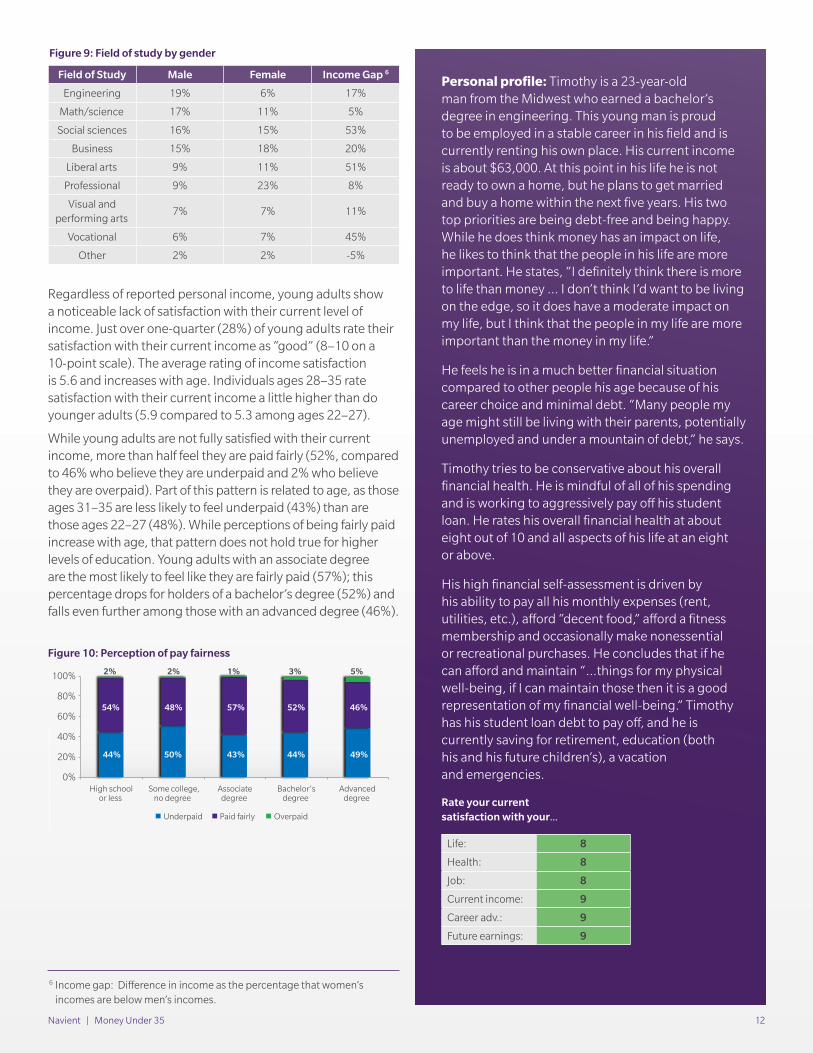
Regardless of reported personal income, young adults show a noticeable lack of satisfaction with their current level of income. Just over one-quarter (28%) of young adults rate their satisfaction with their current income as “good” (8–10 on a 10-point scale). The average rating of income satisfaction is 5.6 and increases with age. Individuals ages 28–35 rate satisfaction with their current income a little higher than do younger adults (5.9 compared to 5.3 among ages 22–27).
While young adults are not fully satisfied with their current income, more than half feel they are paid fairly (52%, compared to 46% who believe they are underpaid and 2% who believe they are overpaid). Part of this pattern is related to age, as those ages 31–35 are less likely to feel underpaid (43%) than are those ages 22–27 (48%). While perceptions of being fairly paid increase with age, that pattern does not hold true for higher levels of education. Young adults with an associate degree are the most likely to feel like they are fairly paid (57%); this percentage drops for holders of a bachelor’s degree (52%) and falls even further among those with an advanced degree (46%).
Personal profile: Timothy is a 23-year-old man from the Midwest who earned a bachelor’s degree in engineering. This young man is proud to be employed in a stable career in his field and is currently renting his own place. His current income is about $63,000. At this point in his life he is not ready to own a home, but he plans to get married and buy a home within the next five years. His two top priorities are being debt-free and being happy. While he does think money has an impact on life, he likes to think that the people in his life are more important. He states, “I definitely think there is more to life than money … I don’t think I’d want to be living on the edge, so it does have a moderate impact on my life, but I think that the people in my life are more important than the money in my life.”
He feels he is in a much better financial situation compared to other people his age because of his career choice and minimal debt. “Many people my age might still be living with their parents, potentially unemployed and under a mountain of debt,” he says.
Timothy tries to be conservative about his overall financial health. He is mindful of all of his spending and is working to aggressively pay off his student loan. He rates his overall financial health at about eight out of 10 and all aspects of his life at an eight or above.
His high financial self-assessment is driven by his ability to pay all his monthly expenses (rent, utilities, etc.), afford “decent food,” afford a fitness membership and occasionally make nonessential or recreational purchases. He concludes that if he can afford and maintain “…things for my physical well-being, if I can maintain those then it is a good representation of my financial well-being.” Timothy has his student loan debt to pay off, and he is currently saving for retirement, education (both his and his future children’s), a vacation and emergencies.
Figure 9: Field of study by gender
Field of Study Male Female Income Gap 6
Engineering 19% 6% 17%
Math/science 17% 11% 5%
Social sciences 16% 15% 53%
Business 15% 18% 20%
Liberal arts 9% 11% 51%
Professional 9% 23% 8%
Visual and performing arts
7% 7% 11%
Vocational 6% 7% 45%
Other 2% 2% -5%
Figure 9: Field of study by gender
Figure 10: Perception of pay fairness
6 Income gap: Difference in income as the percentage that women’s incomes are below men’s incomes.
Figure 10: Perception of pay fairness
44% 50% 43% 44% 49%
54% 48% 57% 52% 46%
2% 2% 1% 3% 5%
0%
20%
40%
60%
80%
100%
Overpaid Paid fairly Underpaid
High schoolor less
Some college,no degree
Associatedegree
Bachelor’sdegree
Advanceddegree Rate your current
satisfaction with your...
Life: 8
Health: 8
Job: 8
Current income: 9
Career adv.: 9
Future earnings: 9
Navient | Money Under 35 13
Overall, most young adults believe they have the right amount of education for the job they hold (59%). The remaining two-fifths of young adults are divided between feeling overeducated (15%), feeling they have the correct education but not the right skill set (13%) or feeling that they do not have enough education (13%). Young adults with a degree (associate or higher), in addition to feeling underpaid to a greater extent, are more likely to feel like they are overeducated (19%) than are those without a degree (12%). Similarly, those without a degree are more likely to believe they are undereducated (18% high school or less and 16% some college, no degree, compared to 7% with an associate degree or 5% of bachelor’s and advanced degree holders).
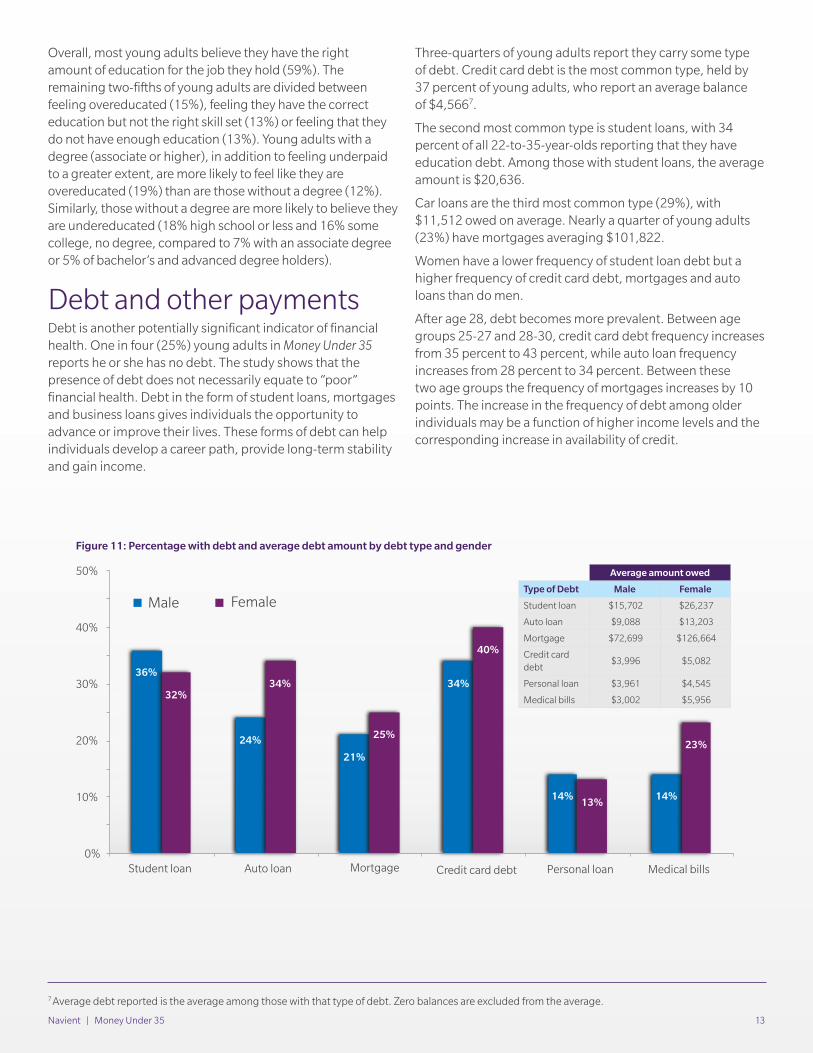
Debt and other paymentsDebt is another potentially significant indicator of financial health. One in four (25%) young adults in Money Under 35 reports he or she has no debt. The study shows that the presence of debt does not necessarily equate to “poor” financial health. Debt in the form of student loans, mortgages and business loans gives individuals the opportunity to advance or improve their lives. These forms of debt can help individuals develop a career path, provide long-term stability and gain income.
Three-quarters of young adults report they carry some type of debt. Credit card debt is the most common type, held by 37 percent of young adults, who report an average balance of $4,5667.
The second most common type is student loans, with 34 percent of all 22-to-35-year-olds reporting that they have education debt. Among those with student loans, the average amount is $20,636.
Car loans are the third most common type (29%), with $11,512 owed on average. Nearly a quarter of young adults (23%) have mortgages averaging $101,822.
Women have a lower frequency of student loan debt but a higher frequency of credit card debt, mortgages and auto loans than do men.
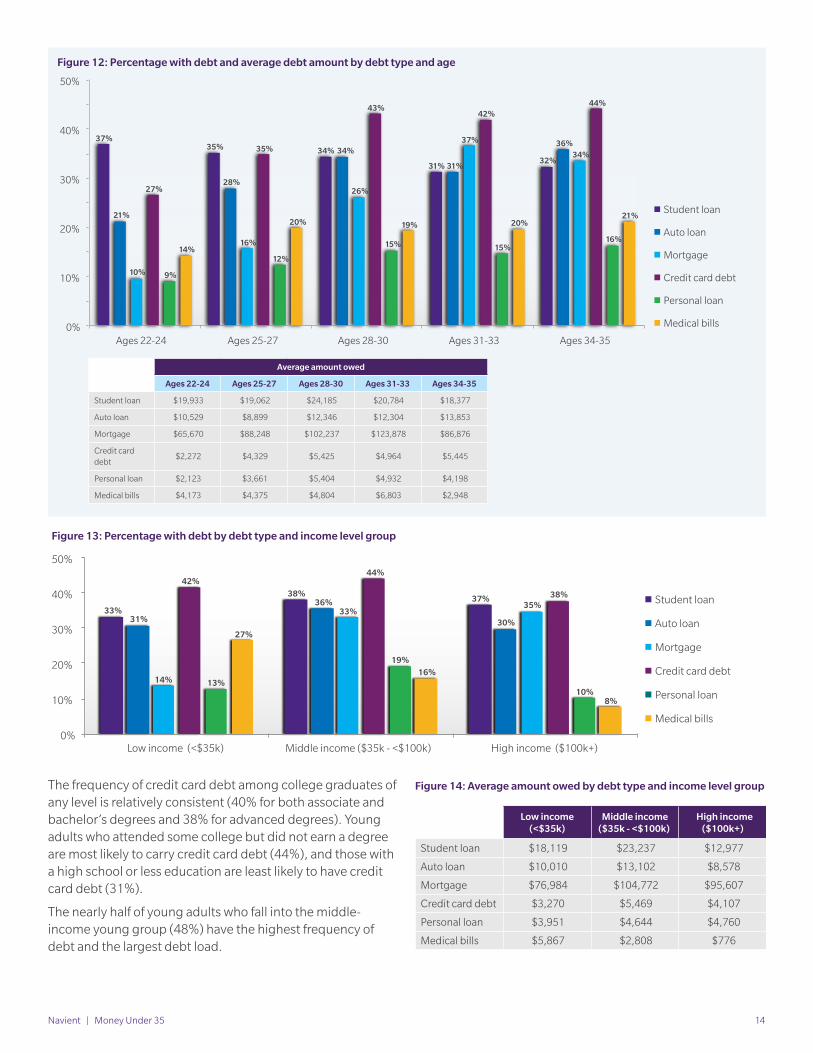
After age 28, debt becomes more prevalent. Between age groups 25-27 and 28-30, credit card debt frequency increases from 35 percent to 43 percent, while auto loan frequency increases from 28 percent to 34 percent. Between these two age groups the frequency of mortgages increases by 10 points. The increase in the frequency of debt among older individuals may be a function of higher income levels and the corresponding increase in availability of credit.
Student loan Auto loan Mortgage Credit card debt Medical bills Personal loan
Male Female
Figure 11:Percentage with debt and average debt amount by debt type and gender
36%
24%
21%
34%
14% 14%
32% 34%
25%
40%
13%
23%
0%
10%
20%
30%
40%
50% Average amount owed
Type of Debt Male Female
Student loan $15,702 $26,237
Auto loan $9,088 $13,203
Mortgage $72,699 $126,664
Credit card debt
$3,996 $5,082
Personal loan $3,961 $4,545
Medical bills $3,002 $5,956
Figure 11: Percentage with debt and average debt amount by debt type and gender
7 Average debt reported is the average among those with that type of debt. Zero balances are excluded from the average.
Navient | Money Under 35 14
The frequency of credit card debt among college graduates of any level is relatively consistent (40% for both associate and bachelor’s degrees and 38% for advanced degrees). Young adults who attended some college but did not earn a degree are most likely to carry credit card debt (44%), and those with a high school or less education are least likely to have credit card debt (31%).
The nearly half of young adults who fall into the middle-income young group (48%) have the highest frequency of debt and the largest debt load.
Student loan
Auto loan
Mortgage
Credit card debt
Personal loan
Medical bills
Figure 12: Percentage with debt and average debt amount by debt type and age
37% 35% 34% 34%
31% 31% 32%
21%
28%
36%
10%
16%
26%
37%
34%
27%
35%
43% 42%
44%
9%
12%
15% 15% 16%
14%
20% 19% 20% 21%
0%
10%
20%
30%
40%
50%
Ages 22-24 Ages 25-27 Ages 28-30 Ages 31-33 Ages 34-35
Average amount owed
Ages 22-24 Ages 25-27 Ages 28-30 Ages 31-33 Ages 34-35
Student loan $19,933 $19,062 $24,185 $20,784 $18,377
Auto loan $10,529 $8,899 $12,346 $12,304 $13,853
Mortgage $65,670 $88,248 $102,237 $123,878 $86,876
Credit card debt
$2,272 $4,329 $5,425 $4,964 $5,445
Personal loan $2,123 $3,661 $5,404 $4,932 $4,198
Medical bills $4,173 $4,375 $4,804 $6,803 $2,948
Figure 12: Percentage with debt and average debt amount by debt type and age
Figure 13: Percentage with debt by debt type and income level group
Figure 14: Average amount owed by debt type and income level group
33%
38% 37%
31%
36%
30%
14%
33% 35%
42% 44%
38%
13%
19%
10%
27%
16%
8%
0%
10%
20%
30%
40%
50%
Low income (<$35k) Middle income ($35k - <$100k) High income ($100k+)
Student loan
Auto loan
Mortgage
Credit card debt
Personal loan
Medical bills
Figure 13: Percentage with debt by debt type and income level group
Figure 14: Average amount of debt, by debt typeand income level group
Low income(<$35k)
Middle income($35k - <$100k)
High income($100k+)
Student loan $18,119 $23,237 $12,977
Auto loan $10,010 $13,102 $8,578
Mortgage $76,984 $104,772 $95,607
Credit card debt $3,270 $5,469 $4,107
Personal loan $3,951 $4,644 $4,760
Medical bills $5,867 $2,808 $776
Navient | Money Under 35 15
Three-quarters of young adults do not currently have a mortgage (77%). Of that group, 88 percent have not applied for one. The most common reason for not applying for a mortgage is not being ready to own a home (37%). The other most common reasons are related to finances, including not having enough funds for a down payment (21%) and not being able to afford monthly payments (21%). The most common obstacle faced by the small number of young adults who do not have a mortgage but who have applied for one was financial issues. Reported reasons include bad credit, a low credit score or outstanding debts (14%). One in three young adults who was turned down for a mortgage did not know why his or her application was rejected (35%).
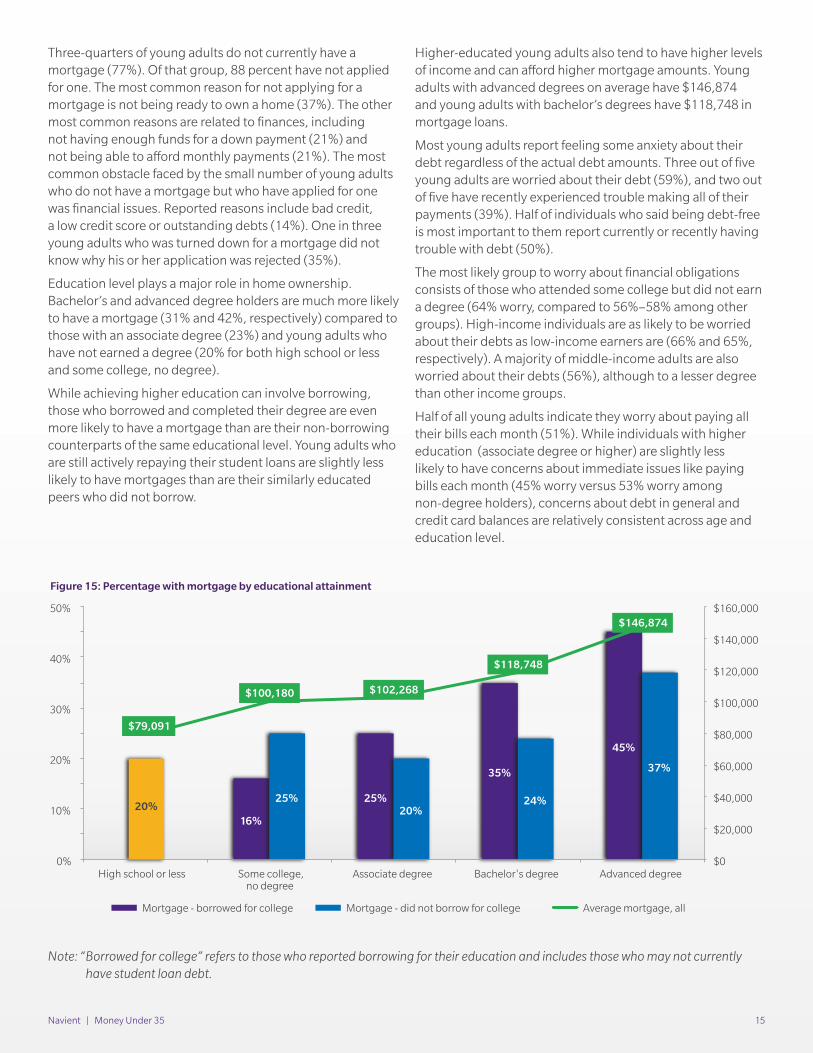
Education level plays a major role in home ownership. Bachelor’s and advanced degree holders are much more likely to have a mortgage (31% and 42%, respectively) compared to those with an associate degree (23%) and young adults who have not earned a degree (20% for both high school or less and some college, no degree).
While achieving higher education can involve borrowing, those who borrowed and completed their degree are even more likely to have a mortgage than are their non-borrowing counterparts of the same educational level. Young adults who are still actively repaying their student loans are slightly less likely to have mortgages than are their similarly educated peers who did not borrow.
Higher-educated young adults also tend to have higher levels of income and can afford higher mortgage amounts. Young adults with advanced degrees on average have $146,874 and young adults with bachelor’s degrees have $118,748 in mortgage loans.
Most young adults report feeling some anxiety about their debt regardless of the actual debt amounts. Three out of five young adults are worried about their debt (59%), and two out of five have recently experienced trouble making all of their payments (39%). Half of individuals who said being debt-free is most important to them report currently or recently having trouble with debt (50%).
The most likely group to worry about financial obligations consists of those who attended some college but did not earn a degree (64% worry, compared to 56%–58% among other groups). High-income individuals are as likely to be worried about their debts as low-income earners are (66% and 65%, respectively). A majority of middle-income adults are also worried about their debts (56%), although to a lesser degree than other income groups.
Half of all young adults indicate they worry about paying all their bills each month (51%). While individuals with higher education (associate degree or higher) are slightly less likely to have concerns about immediate issues like paying bills each month (45% worry versus 53% worry among non-degree holders), concerns about debt in general and credit card balances are relatively consistent across age and education level.
Figure 15: Percentage with mortgage by educational attainment and college borrowing
16% 20%
25%
35%
45%
25% 20%
24%
37%
$79,091
$100,180 $102,268
$118,748
$146,874
$0
$20,000
$40,000
$60,000
$80,000
$100,000
$120,000
$140,000
$160,000
0%
10%
20%
30%
40%
50%
High school or less Some college,no degree
Associate degree Bachelor's degree Advanced degree
Mortgage - borrowed for college Mortgage - did not borrow for college Average mortgage, all
Figure 15: Percentage with mortgage by educational attainment
Note: “ Borrowed for college” refers to those who reported borrowing for their education and includes those who may not currently have student loan debt.
Navient | Money Under 35 16
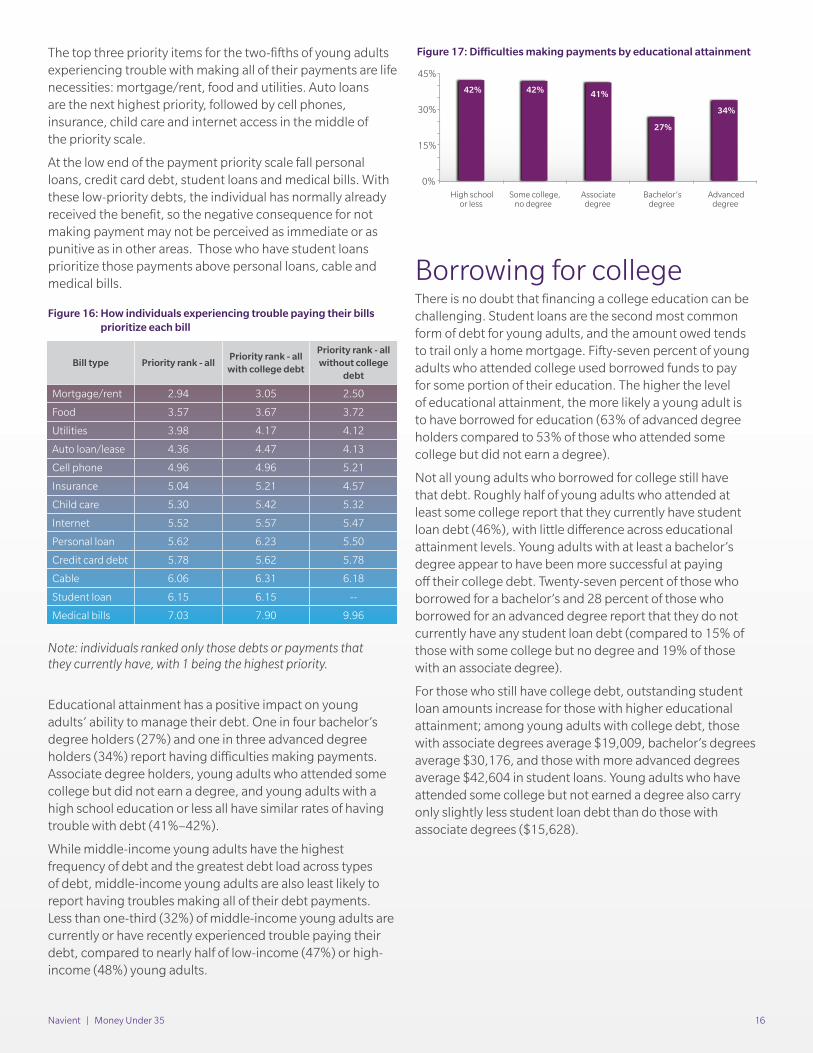
The top three priority items for the two-fifths of young adults experiencing trouble with making all of their payments are life necessities: mortgage/rent, food and utilities. Auto loans are the next highest priority, followed by cell phones, insurance, child care and internet access in the middle of the priority scale.
At the low end of the payment priority scale fall personal loans, credit card debt, student loans and medical bills. With these low-priority debts, the individual has normally already received the benefit, so the negative consequence for not making payment may not be perceived as immediate or as punitive as in other areas. Those who have student loans prioritize those payments above personal loans, cable and medical bills.
Note: individuals ranked only those debts or payments that they currently have, with 1 being the highest priority.
Educational attainment has a positive impact on young adults’ ability to manage their debt. One in four bachelor’s degree holders (27%) and one in three advanced degree holders (34%) report having difficulties making payments. Associate degree holders, young adults who attended some college but did not earn a degree, and young adults with a high school education or less all have similar rates of having trouble with debt (41%–42%).
While middle-income young adults have the highest frequency of debt and the greatest debt load across types of debt, middle-income young adults are also least likely to report having troubles making all of their debt payments. Less than one-third (32%) of middle-income young adults are currently or have recently experienced trouble paying their debt, compared to nearly half of low-income (47%) or high-income (48%) young adults.
Borrowing for college There is no doubt that financing a college education can be challenging. Student loans are the second most common form of debt for young adults, and the amount owed tends to trail only a home mortgage. Fifty-seven percent of young adults who attended college used borrowed funds to pay for some portion of their education. The higher the level of educational attainment, the more likely a young adult is to have borrowed for education (63% of advanced degree holders compared to 53% of those who attended some college but did not earn a degree).
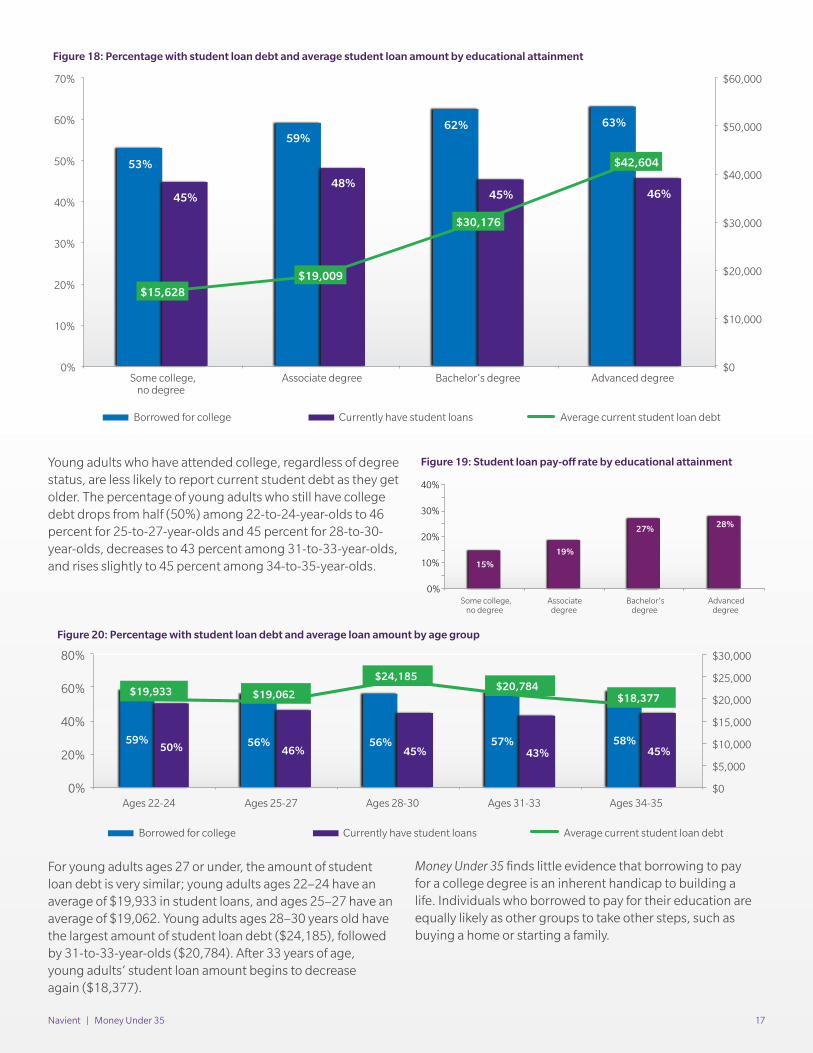
Not all young adults who borrowed for college still have that debt. Roughly half of young adults who attended at least some college report that they currently have student loan debt (46%), with little difference across educational attainment levels. Young adults with at least a bachelor’s degree appear to have been more successful at paying off their college debt. Twenty-seven percent of those who borrowed for a bachelor’s and 28 percent of those who borrowed for an advanced degree report that they do not currently have any student loan debt (compared to 15% of those with some college but no degree and 19% of those with an associate degree).
For those who still have college debt, outstanding student loan amounts increase for those with higher educational attainment; among young adults with college debt, those with associate degrees average $19,009, bachelor’s degrees average $30,176, and those with more advanced degrees average $42,604 in student loans. Young adults who have attended some college but not earned a degree also carry only slightly less student loan debt than do those with associate degrees ($15,628).
Figure 16:How individuals experiencing trouble payingtheir bills
Bill type Priority rank - allPriority rank - all
with college debt
Priority rank - all without college
debt
Mortgage/rent 2.94 3.05 2.50
Food 3.57 3.67 3.72
Utilities 3.98 4.17 4.12
Auto loan/lease 4.36 4.47 4.13
Cell phone 4.96 4.96 5.21
Insurance 5.04 5.21 4.57
Child care 5.30 5.42 5.32
Internet 5.52 5.57 5.47
Personal loan 5.62 6.23 5.50
Credit card debt 5.78 5.62 5.78
Cable 6.06 6.31 6.18
Student loan 6.15 6.15 --
Medical bills 7.03 7.90 9.96
Figure 17: Difficulties making payments by educational attainmentFigure 17: Di�culties making payments
High schoolor less
Some college,no degree
Associatedegree
Bachelor’sdegree
Advanceddegree
42% 42% 41%
27%
34%
0%
15%
30%
45%
Figure 16: How individuals experiencing trouble paying their bills prioritize each bill
Navient | Money Under 35 17
Young adults who have attended college, regardless of degree status, are less likely to report current student debt as they get older. The percentage of young adults who still have college debt drops from half (50%) among 22-to-24-year-olds to 46 percent for 25-to-27-year-olds and 45 percent for 28-to-30-year-olds, decreases to 43 percent among 31-to-33-year-olds, and rises slightly to 45 percent among 34-to-35-year-olds.
For young adults ages 27 or under, the amount of student loan debt is very similar; young adults ages 22–24 have an average of $19,933 in student loans, and ages 25–27 have an average of $19,062. Young adults ages 28–30 years old have the largest amount of student loan debt ($24,185), followed by 31-to-33-year-olds ($20,784). After 33 years of age, young adults’ student loan amount begins to decrease again ($18,377).
Money Under 35 finds little evidence that borrowing to pay for a college degree is an inherent handicap to building a life. Individuals who borrowed to pay for their education are equally likely as other groups to take other steps, such as buying a home or starting a family.
Figure 18: Percentage with student loan debt and average loan amount by educational attainment
Borrowed for college Currently have student loans Average current student loan debt
Some college,no degree
Associate degree Bachelor’s degree Advanced degree
53%
59% 62% 63%
45% 48%
45% 46%
$15,628 $19,009
$30,176
$42,604
$0
$10,000
$20,000
$30,000
$40,000
$50,000
$60,000
0%
10%
20%
30%
40%
50%
60%
70%
Figure 18: Percentage with student loan debt and average student loan amount by educational attainment
Figure 19: Student loan pay-off rate by educational attainment
Figure 20: Percentage with student loan debt and average loan amount by age group
Figure 19: Student loan pay-o� rateby educational attainment
Some college,no degree
Associatedegree
Bachelor’sdegree
Advanceddegree
15%
19%
27% 28%
0%
10%
20%
30%
40%
Figure 20: Percentage with student loan debt and average loan amount by age
Borrowed for college Currently have student loans Average current student loan debt
59% 56% 56% 57% 58% 50% 46% 45% 43% 45%
$19,933 $19,062
$24,185 $20,784
$18,377
$0
$5,000
$10,000
$15,000
$20,000
$25,000
$30,000
0%
20%
40%
60%
80%
Ages 22-24 Ages 25-27 Ages 28-30 Ages 31-33 Ages 34-35
Navient | Money Under 35 18
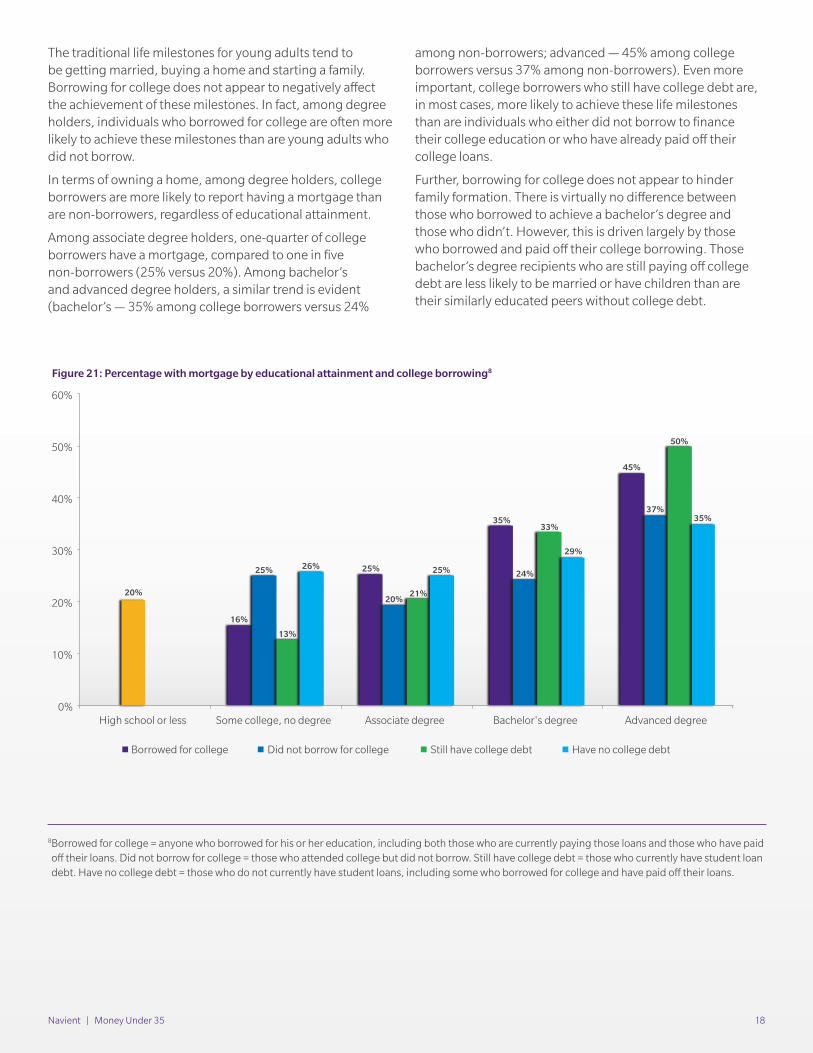
The traditional life milestones for young adults tend to be getting married, buying a home and starting a family. Borrowing for college does not appear to negatively affect the achievement of these milestones. In fact, among degree holders, individuals who borrowed for college are often more likely to achieve these milestones than are young adults who did not borrow.
In terms of owning a home, among degree holders, college borrowers are more likely to report having a mortgage than are non-borrowers, regardless of educational attainment.
Among associate degree holders, one-quarter of college borrowers have a mortgage, compared to one in five non-borrowers (25% versus 20%). Among bachelor’s and advanced degree holders, a similar trend is evident (bachelor’s — 35% among college borrowers versus 24%
among non-borrowers; advanced — 45% among college borrowers versus 37% among non-borrowers). Even more important, college borrowers who still have college debt are, in most cases, more likely to achieve these life milestones than are individuals who either did not borrow to finance their college education or who have already paid off their college loans.
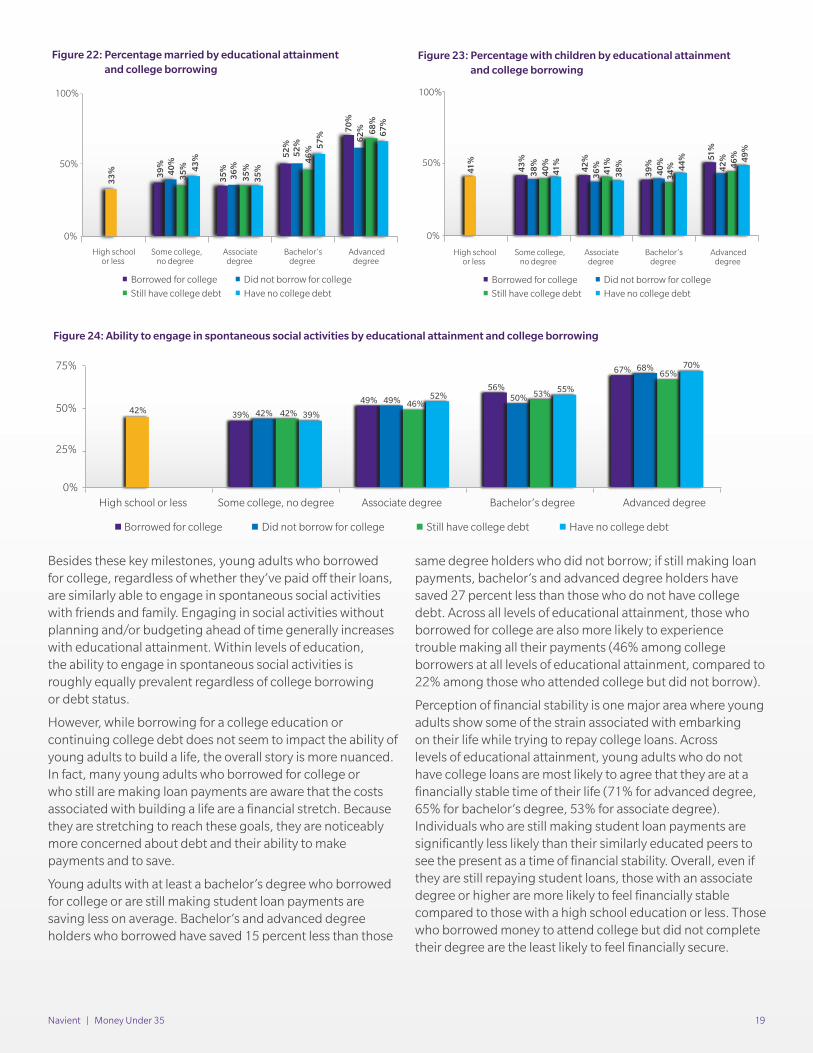
Further, borrowing for college does not appear to hinder family formation. There is virtually no difference between those who borrowed to achieve a bachelor’s degree and those who didn’t. However, this is driven largely by those who borrowed and paid off their college borrowing. Those bachelor’s degree recipients who are still paying off college debt are less likely to be married or have children than are their similarly educated peers without college debt.
Figure 21: Percentage with mortgage by educational attainment and college borrowing
16%
25%
35%
45%
20%
25%
20%
24%
37%
13%
21%
33%
50%
26% 25%
29%
35%
0%
10%
20%
30%
40%
50%
60%
High school or less Some college, no degree Associate degree Bachelor's degree Advanced degree
Borrowed for college Did not borrow for college Still have college debt Have no college debt
Figure 21: Percentage with mortgage by educational attainment and college borrowing8
8 Borrowed for college = anyone who borrowed for his or her education, including both those who are currently paying those loans and those who have paid off their loans. Did not borrow for college = those who attended college but did not borrow. Still have college debt = those who currently have student loan debt. Have no college debt = those who do not currently have student loans, including some who borrowed for college and have paid off their loans.
Navient | Money Under 35 19
Besides these key milestones, young adults who borrowed for college, regardless of whether they’ve paid off their loans, are similarly able to engage in spontaneous social activities with friends and family. Engaging in social activities without planning and/or budgeting ahead of time generally increases with educational attainment. Within levels of education, the ability to engage in spontaneous social activities is roughly equally prevalent regardless of college borrowing or debt status.
However, while borrowing for a college education or continuing college debt does not seem to impact the ability of young adults to build a life, the overall story is more nuanced. In fact, many young adults who borrowed for college or who still are making loan payments are aware that the costs associated with building a life are a financial stretch. Because they are stretching to reach these goals, they are noticeably more concerned about debt and their ability to make payments and to save.
Young adults with at least a bachelor’s degree who borrowed for college or are still making student loan payments are saving less on average. Bachelor’s and advanced degree holders who borrowed have saved 15 percent less than those
same degree holders who did not borrow; if still making loan payments, bachelor’s and advanced degree holders have saved 27 percent less than those who do not have college debt. Across all levels of educational attainment, those who borrowed for college are also more likely to experience trouble making all their payments (46% among college borrowers at all levels of educational attainment, compared to 22% among those who attended college but did not borrow).
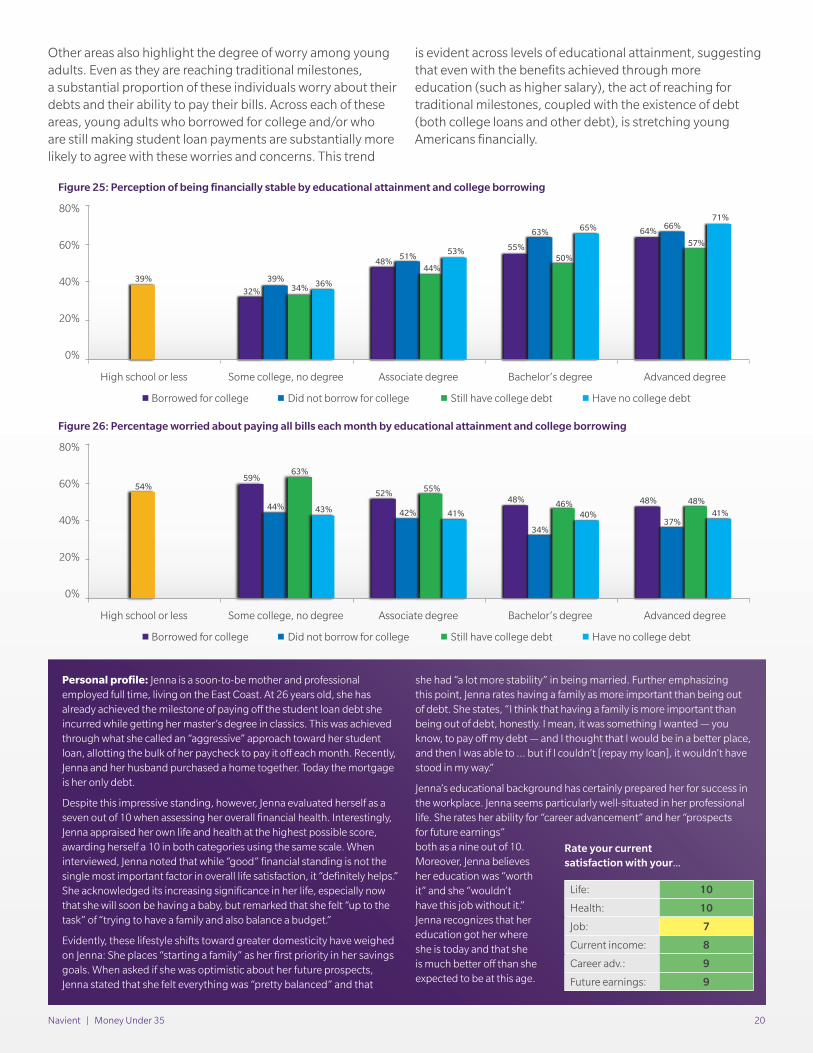
Perception of financial stability is one major area where young adults show some of the strain associated with embarking on their life while trying to repay college loans. Across levels of educational attainment, young adults who do not have college loans are most likely to agree that they are at a financially stable time of their life (71% for advanced degree, 65% for bachelor’s degree, 53% for associate degree). Individuals who are still making student loan payments are significantly less likely than their similarly educated peers to see the present as a time of financial stability. Overall, even if they are still repaying student loans, those with an associate degree or higher are more likely to feel financially stable compared to those with a high school education or less. Those who borrowed money to attend college but did not complete their degree are the least likely to feel financially secure.
Figure 22: Percentage married by educationalattainment and college borrowing
High schoolor less
Some college,no degree
Associatedegree
Bachelor’sdegree
Advanceddegree
39
%
35
%
35
%
35
%
52
%
52
%
70
%
33
%
40
%
36
%
62
%
35
% 4
6%
68
%
67
%
43
% 5
7%
0%
50%
100%
Borrowed for college Did not borrow for college
Still have college debt Have no college debt
Figure 23: Percentage with childrenby educational attainment and college borrowing
High schoolor less
Some college,no degree
Associatedegree
Bachelor’sdegree
Advanceddegree
43
%
42
%
41%
3
8%
39
%
40
% 51
%
41%
38
%
36
%
42
%
40
%
34
%
46
%
41%
44
%
49
%
Borrowed for college Did not borrow for college
Still have college debt Have no college debt
0%
50%
100%
Figure 22: Percentage married by educational attainment and college borrowing
Figure 23: Percentage with children by educational attainment and college borrowing
Figure 24: Ability to engage in spontaneous social activities by educational attainment
and college borrowing
High school or less Some college, no degree Associate degree Bachelor’s degree Advanced degree
Borrowed for college Did not borrow for college Still have college debt Have no college debt
39%
56%
67%
42% 49% 49% 50%
68%
42% 42% 46%
53%
65%
39%
52% 55%
70%
0%
25%
50%
75%
Figure 24: Ability to engage in spontaneous social activities by educational attainment and college borrowing
Navient | Money Under 35 20
Figure 26: Percentage worried about paying all bills each month by educational attainment
and college borrowing
High school or less Some college, no degree Associate degree Bachelor’s degree Advanced degree
Borrowed for college Did not borrow for college Still have college debt Have no college debt
59%
52% 48% 48%
54%
44% 42%
34% 37%
63%
55%
46% 48% 43% 41% 40% 41%
0%
20%
40%
60%
80%
Other areas also highlight the degree of worry among young adults. Even as they are reaching traditional milestones, a substantial proportion of these individuals worry about their debts and their ability to pay their bills. Across each of these areas, young adults who borrowed for college and/or who are still making student loan payments are substantially more likely to agree with these worries and concerns. This trend
is evident across levels of educational attainment, suggesting that even with the benefits achieved through more education (such as higher salary), the act of reaching for traditional milestones, coupled with the existence of debt (both college loans and other debt), is stretching young Americans financially.
Figure 25: Perception of being financially stable by educational attainment and college borrowing
Figure 26: Percentage worried about paying all bills each month by educational attainment and college borrowing
Figure 25: Perception of being financially stable by educational attainment and college borrowing
High school or less Some college, no degree Associate degree Bachelor’s degree Advanced degree
Borrowed for college Did not borrow for college Still have college debt Have no college debt
32%
48%
55%
64%
39% 39%
51%
63% 66%
34%
44% 50%
57%
36%
53%
65% 71%
0%
20%
40%
60%
80%
Personal profile: Jenna is a soon-to-be mother and professional employed full time, living on the East Coast. At 26 years old, she has already achieved the milestone of paying off the student loan debt she incurred while getting her master’s degree in classics. This was achieved through what she called an “aggressive” approach toward her student loan, allotting the bulk of her paycheck to pay it off each month. Recently, Jenna and her husband purchased a home together. Today the mortgage is her only debt.
Despite this impressive standing, however, Jenna evaluated herself as a seven out of 10 when assessing her overall financial health. Interestingly, Jenna appraised her own life and health at the highest possible score, awarding herself a 10 in both categories using the same scale. When interviewed, Jenna noted that while “good” financial standing is not the single most important factor in overall life satisfaction, it “definitely helps.” She acknowledged its increasing significance in her life, especially now that she will soon be having a baby, but remarked that she felt “up to the task” of “trying to have a family and also balance a budget.”
Evidently, these lifestyle shifts toward greater domesticity have weighed on Jenna: She places “starting a family” as her first priority in her savings goals. When asked if she was optimistic about her future prospects, Jenna stated that she felt everything was “pretty balanced” and that
she had “a lot more stability” in being married. Further emphasizing this point, Jenna rates having a family as more important than being out of debt. She states, “I think that having a family is more important than being out of debt, honestly. I mean, it was something I wanted — you know, to pay off my debt — and I thought that I would be in a better place, and then I was able to … but if I couldn’t [repay my loan], it wouldn’t have stood in my way.”
Jenna’s educational background has certainly prepared her for success in the workplace. Jenna seems particularly well-situated in her professional life. She rates her ability for “career advancement” and her “prospects for future earnings” both as a nine out of 10. Moreover, Jenna believes her education was “worth it” and she “wouldn’t have this job without it.” Jenna recognizes that her education got her where she is today and that she is much better off than she expected to be at this age.
Rate your current satisfaction with your...
Life: 10
Health: 10
Job: 7
Current income: 8
Career adv.: 9
Future earnings: 9
Navient | Money Under 35 21
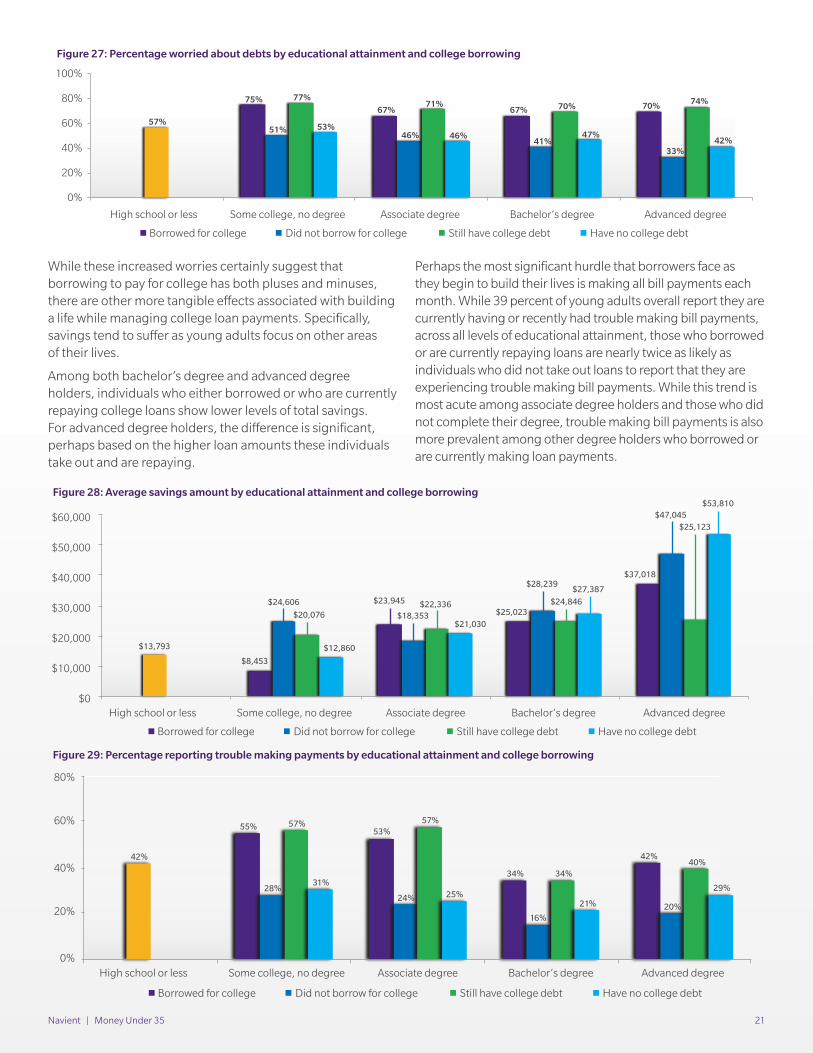
While these increased worries certainly suggest that borrowing to pay for college has both pluses and minuses, there are other more tangible effects associated with building a life while managing college loan payments. Specifically, savings tend to suffer as young adults focus on other areas of their lives.
Among both bachelor’s degree and advanced degree holders, individuals who either borrowed or who are currently repaying college loans show lower levels of total savings. For advanced degree holders, the difference is significant, perhaps based on the higher loan amounts these individuals take out and are repaying.
Perhaps the most significant hurdle that borrowers face as they begin to build their lives is making all bill payments each month. While 39 percent of young adults overall report they are currently having or recently had trouble making bill payments, across all levels of educational attainment, those who borrowed or are currently repaying loans are nearly twice as likely as individuals who did not take out loans to report that they are experiencing trouble making bill payments. While this trend is most acute among associate degree holders and those who did not complete their degree, trouble making bill payments is also more prevalent among other degree holders who borrowed or are currently making loan payments.
Figure 27: Percentage worried about debts by educational attainment and college borrowing
High school or less Some college, no degree Associate degree Bachelor’s degree Advanced degree
Borrowed for college Did not borrow for college Still have college debt Have no college debt
75% 67% 67% 70%
57% 51%
46% 41%
33%
77% 71% 70%
74%
53% 46% 47%
42%
0%
20%
40%
60%
80%
100%
Figure 27: Percentage worried about debts by educational attainment and college borrowing
Figure 28: Average savings amount by educational attainment and college borrowing
Figure 29: Percentage reporting trouble making payments by educational attainment and college borrowing
Figure 28: Average savings amount by educational attainment and college borrowing
High school or less Some college, no degree Associate degree Bachelor’s degree Advanced degree
Borrowed for college Did not borrow for college Still have college debt Have no college debt
$8,453
$23,945 $25,023
$37,018
$13,793
$24,606
$18,353
$28,239
$47,045
$20,076 $22,336 $24,846
$25,123
$12,860
$21,030
$27,387
$53,810
$0
$10,000
$20,000
$30,000
$40,000
$50,000
$60,000
Figure 29: Percentage reporting trouble making payments by educational attainment
and college borrowing
High school or less Some college, no degree Associate degree Bachelor’s degree Advanced degree
Borrowed for college Did not borrow for college Still have college debt Have no college debt
55% 53%
34%
42% 42%
28% 24%
20%
57% 57%
34% 40%
31% 25%
21%
16%
29%
0%
20%
40%
60%
80%
Navient | Money Under 35 22
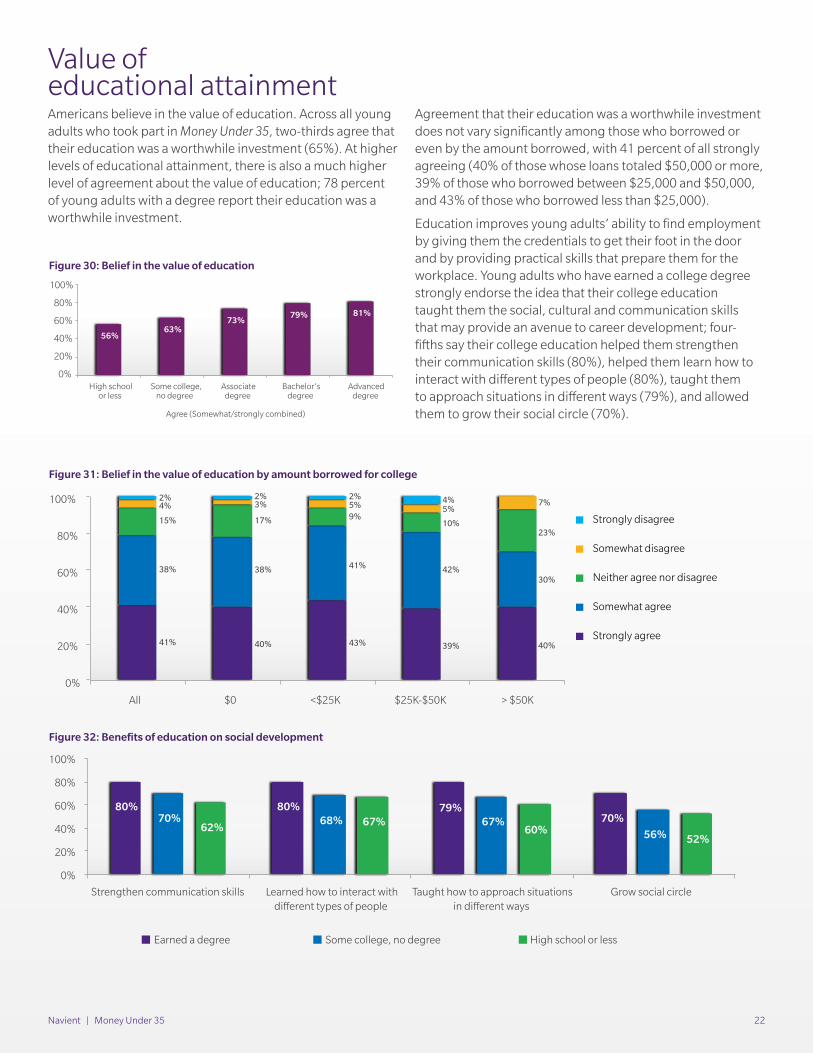
Value of educational attainmentAmericans believe in the value of education. Across all young adults who took part in Money Under 35, two-thirds agree that their education was a worthwhile investment (65%). At higher levels of educational attainment, there is also a much higher level of agreement about the value of education; 78 percent of young adults with a degree report their education was a worthwhile investment.
Agreement that their education was a worthwhile investment does not vary significantly among those who borrowed or even by the amount borrowed, with 41 percent of all strongly agreeing (40% of those whose loans totaled $50,000 or more, 39% of those who borrowed between $25,000 and $50,000, and 43% of those who borrowed less than $25,000).
Education improves young adults’ ability to find employment by giving them the credentials to get their foot in the door and by providing practical skills that prepare them for the workplace. Young adults who have earned a college degree strongly endorse the idea that their college education taught them the social, cultural and communication skills that may provide an avenue to career development; four-fifths say their college education helped them strengthen their communication skills (80%), helped them learn how to interact with different types of people (80%), taught them to approach situations in different ways (79%), and allowed them to grow their social circle (70%).
Figure 30: Belief in the value of education
High schoolor less
Some college,no degree
Associatedegree
Bachelor’sdegree
Advanceddegree
56% 63%
73% 79% 81%
0%
20%
40%
60%
80%
100%
Agree (Somewhat/strongly combined)
Figure 30: Belief in the value of education
Figure 31: Belief in the value of education by amount borrowed for college
Figure 32: Benefits of education on social development
Figure 31: Belief in the value of education by amount borrowed for college
40%
30%
23%
7%
41%
38%
15%
4% 2%
40%
38%
17%
3% 2%
43%
41%
9% 5% 2%
39%
42%
10%
5% 4%
0%
20%
40%
60%
80%
100%
All $0 <$25K $25K-$50K > $50K
Strongly disagree
Somewhat disagree
Neither agree nor disagree
Somewhat agree
Strongly agree
Figure 32: Benefits of education on social development
80% 80% 79% 70% 70% 68% 67%
56% 62% 67%
60% 52%
0%
20%
40%
60%
80%
100%
Strengthen communication skills Learned how to interact withdi�erent types of people
Taught how to approach situationsin di�erent ways
Grow social circle
Earned a degree Some college, no degree High school or less
Navient | Money Under 35 23
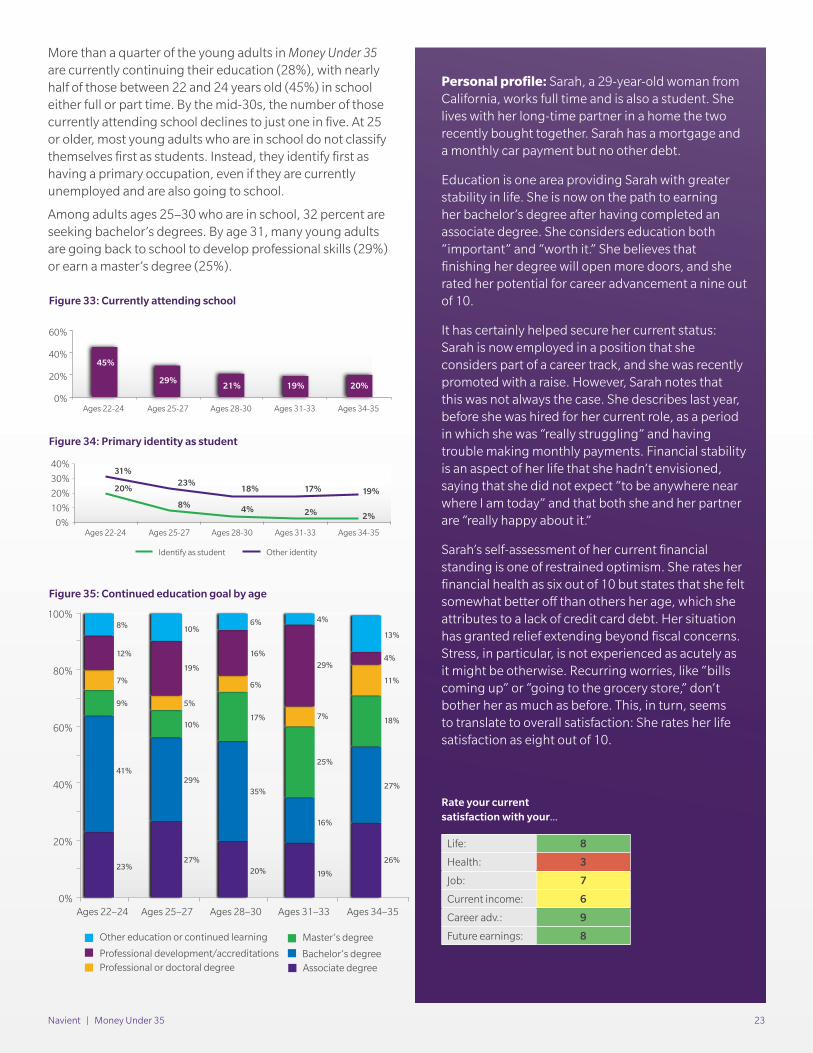
More than a quarter of the young adults in Money Under 35 are currently continuing their education (28%), with nearly half of those between 22 and 24 years old (45%) in school either full or part time. By the mid-30s, the number of those currently attending school declines to just one in five. At 25 or older, most young adults who are in school do not classify themselves first as students. Instead, they identify first as having a primary occupation, even if they are currently unemployed and are also going to school.
Among adults ages 25–30 who are in school, 32 percent are seeking bachelor’s degrees. By age 31, many young adults are going back to school to develop professional skills (29%) or earn a master’s degree (25%).
Personal profile: Sarah, a 29-year-old woman from California, works full time and is also a student. She lives with her long-time partner in a home the two recently bought together. Sarah has a mortgage and a monthly car payment but no other debt.
Education is one area providing Sarah with greater stability in life. She is now on the path to earning her bachelor’s degree after having completed an associate degree. She considers education both “important” and “worth it.” She believes that finishing her degree will open more doors, and she rated her potential for career advancement a nine out of 10.
It has certainly helped secure her current status: Sarah is now employed in a position that she considers part of a career track, and she was recently promoted with a raise. However, Sarah notes that this was not always the case. She describes last year, before she was hired for her current role, as a period in which she was “really struggling” and having trouble making monthly payments. Financial stability is an aspect of her life that she hadn’t envisioned, saying that she did not expect “to be anywhere near where I am today” and that both she and her partner are “really happy about it.”
Sarah’s self-assessment of her current financial standing is one of restrained optimism. She rates her financial health as six out of 10 but states that she felt somewhat better off than others her age, which she attributes to a lack of credit card debt. Her situation has granted relief extending beyond fiscal concerns. Stress, in particular, is not experienced as acutely as it might be otherwise. Recurring worries, like “bills coming up” or “going to the grocery store,” don’t bother her as much as before. This, in turn, seems to translate to overall satisfaction: She rates her life satisfaction as eight out of 10.
45%
29% 21% 19% 20%
0%
20%
40%
60%
Ages 22-24 Ages 25-27 Ages 28-30 Ages 31-33 Ages 34-35
31% 23%
18% 17% 19% 20%
8% 4% 2% 2% 0%
10%
20%
30%
40%
Ages 22-24 Ages 25-27 Ages 28-30 Ages 31-33 Ages 34-35
Identify as student Other identity
Figure 33: Currently attending school
Figure 34: Primary identity as student
Figure 35: Continued education goal by ageFigure 35: Continued education goal by age
23%
41%
9%
7%
12%
8%
27%
29%
10%
5%
19%
10%
20%
35%
17%
6%
16%
6%
19%
16%
25%
7%
29%
4%
26%
27%
18%
11%
4%
13%
0%
20%
40%
60%
80%
100%
Ages 22–24 Ages 25–27 Ages 28–30 Ages 31–33 Ages 34–35
Other education or continued learning
Professional development/accreditationsProfessional or doctoral degree
Master’s degree
Bachelor’s degree Associate degree
Rate your current satisfaction with your...
Life: 8
Health: 3
Job: 7
Current income: 6
Career adv.: 9
Future earnings: 8
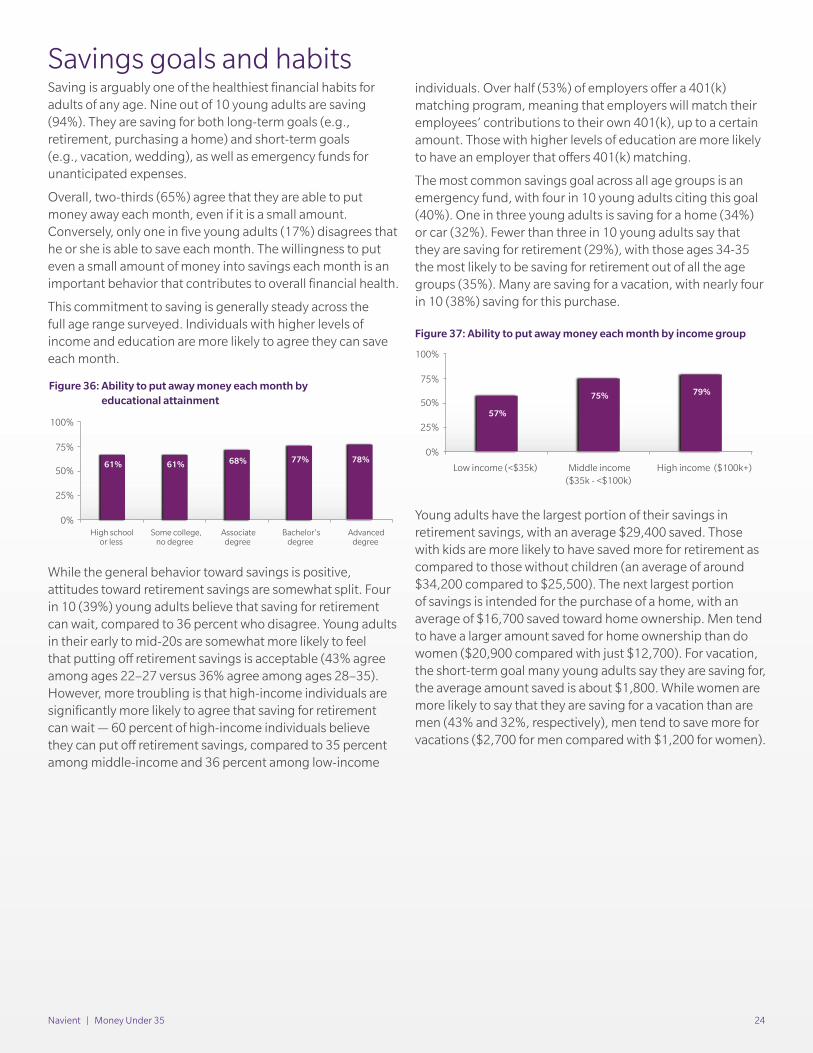
Navient | Money Under 35 24
Savings goals and habitsSaving is arguably one of the healthiest financial habits for adults of any age. Nine out of 10 young adults are saving (94%). They are saving for both long-term goals (e.g., retirement, purchasing a home) and short-term goals (e.g., vacation, wedding), as well as emergency funds for unanticipated expenses.
Overall, two-thirds (65%) agree that they are able to put money away each month, even if it is a small amount. Conversely, only one in five young adults (17%) disagrees that he or she is able to save each month. The willingness to put even a small amount of money into savings each month is an important behavior that contributes to overall financial health.
This commitment to saving is generally steady across the full age range surveyed. Individuals with higher levels of income and education are more likely to agree they can save each month.
While the general behavior toward savings is positive, attitudes toward retirement savings are somewhat split. Four in 10 (39%) young adults believe that saving for retirement can wait, compared to 36 percent who disagree. Young adults in their early to mid-20s are somewhat more likely to feel that putting off retirement savings is acceptable (43% agree among ages 22–27 versus 36% agree among ages 28–35). However, more troubling is that high-income individuals are significantly more likely to agree that saving for retirement can wait — 60 percent of high-income individuals believe they can put off retirement savings, compared to 35 percent among middle-income and 36 percent among low-income
individuals. Over half (53%) of employers offer a 401(k) matching program, meaning that employers will match their employees’ contributions to their own 401(k), up to a certain amount. Those with higher levels of education are more likely to have an employer that offers 401(k) matching.
The most common savings goal across all age groups is an emergency fund, with four in 10 young adults citing this goal (40%). One in three young adults is saving for a home (34%) or car (32%). Fewer than three in 10 young adults say that they are saving for retirement (29%), with those ages 34-35 the most likely to be saving for retirement out of all the age groups (35%). Many are saving for a vacation, with nearly four in 10 (38%) saving for this purchase.
Young adults have the largest portion of their savings in retirement savings, with an average $29,400 saved. Those with kids are more likely to have saved more for retirement as compared to those without children (an average of around $34,200 compared to $25,500). The next largest portion of savings is intended for the purchase of a home, with an average of $16,700 saved toward home ownership. Men tend to have a larger amount saved for home ownership than do women ($20,900 compared with just $12,700). For vacation, the short-term goal many young adults say they are saving for, the average amount saved is about $1,800. While women are more likely to say that they are saving for a vacation than are men (43% and 32%, respectively), men tend to save more for vacations ($2,700 for men compared with $1,200 for women).
Figure 36: Ability to put away money each monthby educational attainment
High schoolor less
Some college,no degree
Associatedegree
Bachelor’sdegree
Advanceddegree
78% 77% 68% 61% 61%
0%
25%
50%
75%
100%
Figure 36: Ability to put away money each month by educational attainment
Figure 37: Ability to put away money each month by income group
Figure 37: Ability to put away money each monthby income group
57%
75% 79%
0%
25%
50%
75%
100%
Low income (<$35k) Middle income($35k - <$100k)
High income ($100k+)
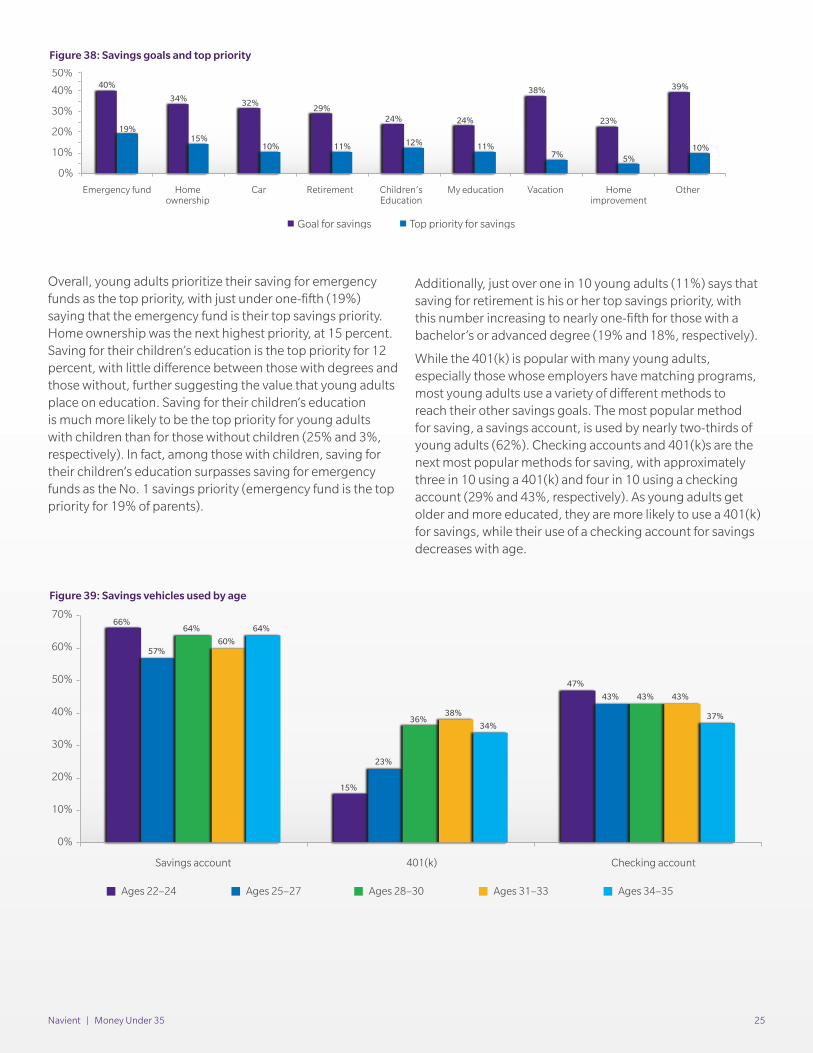
Navient | Money Under 35 25
Overall, young adults prioritize their saving for emergency funds as the top priority, with just under one-fifth (19%) saying that the emergency fund is their top savings priority. Home ownership was the next highest priority, at 15 percent. Saving for their children’s education is the top priority for 12 percent, with little difference between those with degrees and those without, further suggesting the value that young adults place on education. Saving for their children’s education is much more likely to be the top priority for young adults with children than for those without children (25% and 3%, respectively). In fact, among those with children, saving for their children’s education surpasses saving for emergency funds as the No. 1 savings priority (emergency fund is the top priority for 19% of parents).
Additionally, just over one in 10 young adults (11%) says that saving for retirement is his or her top savings priority, with this number increasing to nearly one-fifth for those with a bachelor’s or advanced degree (19% and 18%, respectively).
While the 401(k) is popular with many young adults, especially those whose employers have matching programs, most young adults use a variety of different methods to reach their other savings goals. The most popular method for saving, a savings account, is used by nearly two-thirds of young adults (62%). Checking accounts and 401(k)s are the next most popular methods for saving, with approximately three in 10 using a 401(k) and four in 10 using a checking account (29% and 43%, respectively). As young adults get older and more educated, they are more likely to use a 401(k) for savings, while their use of a checking account for savings decreases with age.
Figure 38: Savings goals and top priority
40%
34% 32% 29%
24% 24%
38%
23%
39%
19% 15%
10% 11% 12% 11% 7% 5%
10%
0%
10%
20%
30%
40%
50%
Goal for savings
Emergency fund Homeownership
Car Retirement Children’sEducation
My education Vacation Homeimprovement
Other
Top priority for savings
Figure 38: Savings goals and top priority
Figure 39: Savings vehicles used by ageFigure 39: Savings vehicles used by age
66%
15%
47%
57%
23%
43%
64%
36%
43%
60%
38%
43%
64%
34% 37%
0%
10%
20%
30%
40%
50%
60%
70%
Savings account 401(k) Checking account
Ages 22–24 Ages 25–27 Ages 28–30 Ages 31–33 Ages 34–35
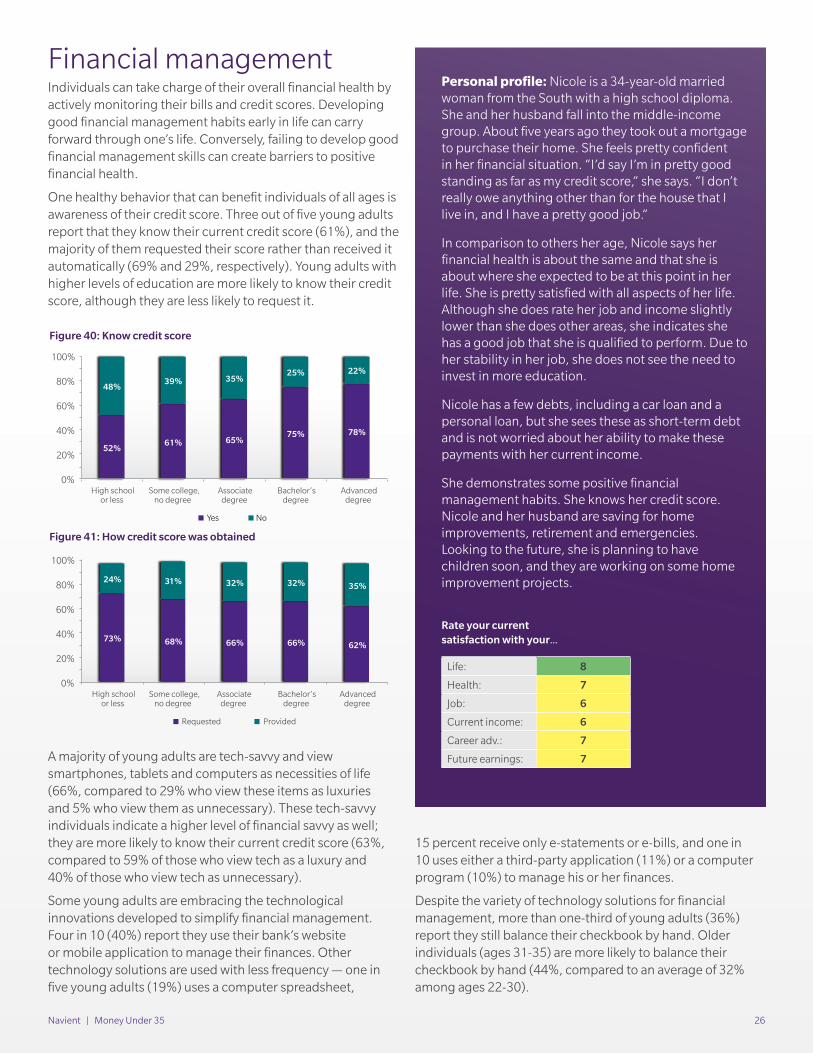
Navient | Money Under 35 26
Financial managementIndividuals can take charge of their overall financial health by actively monitoring their bills and credit scores. Developing good financial management habits early in life can carry forward through one’s life. Conversely, failing to develop good financial management skills can create barriers to positive financial health.
One healthy behavior that can benefit individuals of all ages is awareness of their credit score. Three out of five young adults report that they know their current credit score (61%), and the majority of them requested their score rather than received it automatically (69% and 29%, respectively). Young adults with higher levels of education are more likely to know their credit score, although they are less likely to request it.
A majority of young adults are tech-savvy and view smartphones, tablets and computers as necessities of life (66%, compared to 29% who view these items as luxuries and 5% who view them as unnecessary). These tech-savvy individuals indicate a higher level of financial savvy as well; they are more likely to know their current credit score (63%, compared to 59% of those who view tech as a luxury and 40% of those who view tech as unnecessary).
Some young adults are embracing the technological innovations developed to simplify financial management. Four in 10 (40%) report they use their bank’s website or mobile application to manage their finances. Other technology solutions are used with less frequency — one in five young adults (19%) uses a computer spreadsheet,
15 percent receive only e-statements or e-bills, and one in 10 uses either a third-party application (11%) or a computer program (10%) to manage his or her finances.
Despite the variety of technology solutions for financial management, more than one-third of young adults (36%) report they still balance their checkbook by hand. Older individuals (ages 31-35) are more likely to balance their checkbook by hand (44%, compared to an average of 32% among ages 22-30).
Personal profile: Nicole is a 34-year-old married woman from the South with a high school diploma. She and her husband fall into the middle-income group. About five years ago they took out a mortgage to purchase their home. She feels pretty confident in her financial situation. “I’d say I’m in pretty good standing as far as my credit score,” she says. “I don’t really owe anything other than for the house that I live in, and I have a pretty good job.”
In comparison to others her age, Nicole says her financial health is about the same and that she is about where she expected to be at this point in her life. She is pretty satisfied with all aspects of her life. Although she does rate her job and income slightly lower than she does other areas, she indicates she has a good job that she is qualified to perform. Due to her stability in her job, she does not see the need to invest in more education.
Nicole has a few debts, including a car loan and a personal loan, but she sees these as short-term debt and is not worried about her ability to make these payments with her current income.
She demonstrates some positive financial management habits. She knows her credit score. Nicole and her husband are saving for home improvements, retirement and emergencies. Looking to the future, she is planning to have children soon, and they are working on some home improvement projects.
Figure 40: Know credit score
High schoolor less
Some college,no degree
Associatedegree
Bachelor’sdegree
Advanceddegree
52% 61% 65%
75% 78%
48% 39% 35%
25% 22%
0%
20%
40%
60%
80%
100%
No Yes
Figure 40: Know credit score
Figure 41: How credit score was obtainedFigure 41: Know how credit score was obtained
High schoolor less
Some college,no degree
Associatedegree
Bachelor’sdegree
Advanceddegree
0%
20%
40%
60%
80%
100%
Provided Requested
73% 68% 66% 66% 62%
24% 31% 32% 32% 35%
Rate your current satisfaction with your...
Life: 8
Health: 7
Job: 6
Current income: 6
Career adv.: 7
Future earnings: 7
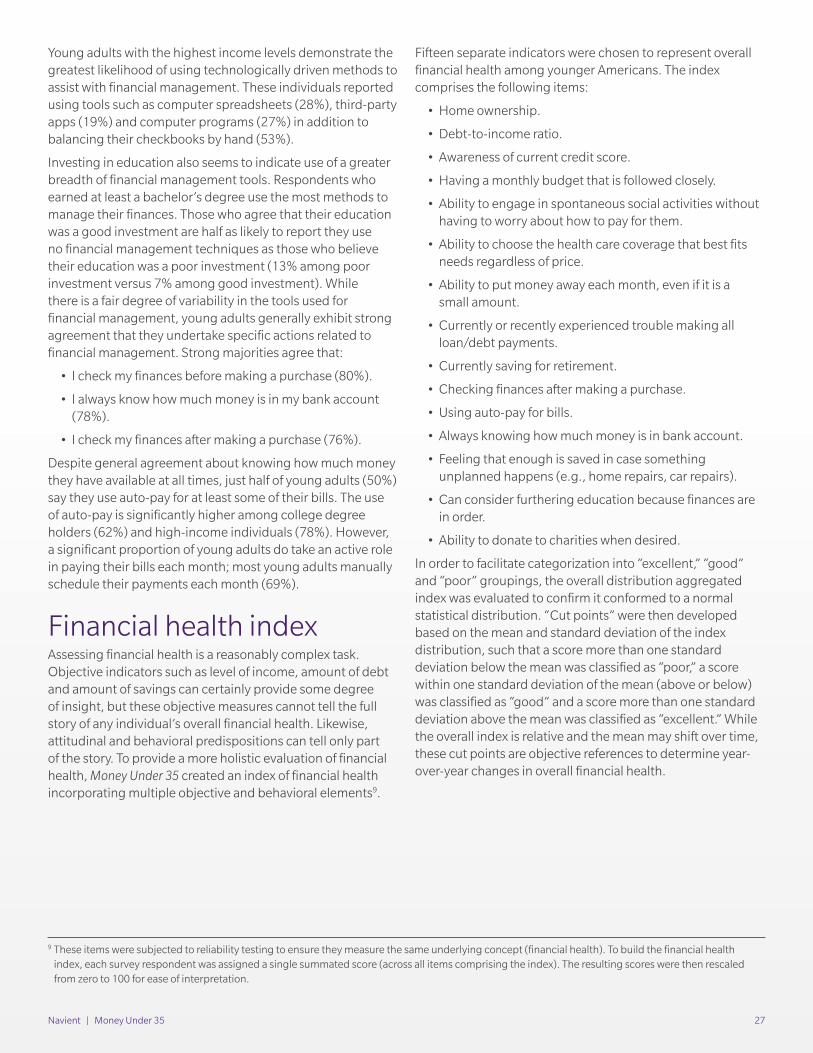
Navient | Money Under 35 27
Young adults with the highest income levels demonstrate the greatest likelihood of using technologically driven methods to assist with financial management. These individuals reported using tools such as computer spreadsheets (28%), third-party apps (19%) and computer programs (27%) in addition to balancing their checkbooks by hand (53%).
Investing in education also seems to indicate use of a greater breadth of financial management tools. Respondents who earned at least a bachelor’s degree use the most methods to manage their finances. Those who agree that their education was a good investment are half as likely to report they use no financial management techniques as those who believe their education was a poor investment (13% among poor investment versus 7% among good investment). While there is a fair degree of variability in the tools used for financial management, young adults generally exhibit strong agreement that they undertake specific actions related to financial management. Strong majorities agree that:
• I check my finances before making a purchase (80%).
• I always know how much money is in my bank account (78%).
• I check my finances after making a purchase (76%).
Despite general agreement about knowing how much money they have available at all times, just half of young adults (50%) say they use auto-pay for at least some of their bills. The use of auto-pay is significantly higher among college degree holders (62%) and high-income individuals (78%). However, a significant proportion of young adults do take an active role in paying their bills each month; most young adults manually schedule their payments each month (69%).
Financial health index
Assessing financial health is a reasonably complex task. Objective indicators such as level of income, amount of debt and amount of savings can certainly provide some degree of insight, but these objective measures cannot tell the full story of any individual’s overall financial health. Likewise, attitudinal and behavioral predispositions can tell only part of the story. To provide a more holistic evaluation of financial health, Money Under 35 created an index of financial health incorporating multiple objective and behavioral elements9.
Fifteen separate indicators were chosen to represent overall financial health among younger Americans. The index comprises the following items:
• Home ownership.
• Debt-to-income ratio.
• Awareness of current credit score.
• Having a monthly budget that is followed closely.
• Ability to engage in spontaneous social activities without having to worry about how to pay for them.
• Ability to choose the health care coverage that best fits needs regardless of price.
• Ability to put money away each month, even if it is a small amount.
• Currently or recently experienced trouble making all loan/debt payments.
• Currently saving for retirement.
• Checking finances after making a purchase.
• Using auto-pay for bills.
• Always knowing how much money is in bank account.
• Feeling that enough is saved in case something unplanned happens (e.g., home repairs, car repairs).
• Can consider furthering education because finances are in order.
• Ability to donate to charities when desired.
In order to facilitate categorization into “excellent,” “good” and “poor” groupings, the overall distribution aggregated index was evaluated to confirm it conformed to a normal statistical distribution. “Cut points” were then developed based on the mean and standard deviation of the index distribution, such that a score more than one standard deviation below the mean was classified as “poor,” a score within one standard deviation of the mean (above or below) was classified as “good” and a score more than one standard deviation above the mean was classified as “excellent.” While the overall index is relative and the mean may shift over time, these cut points are objective references to determine year-over-year changes in overall financial health.
9 These items were subjected to reliability testing to ensure they measure the same underlying concept (financial health). To build the financial health index, each survey respondent was assigned a single summated score (across all items comprising the index). The resulting scores were then rescaled from zero to 100 for ease of interpretation.
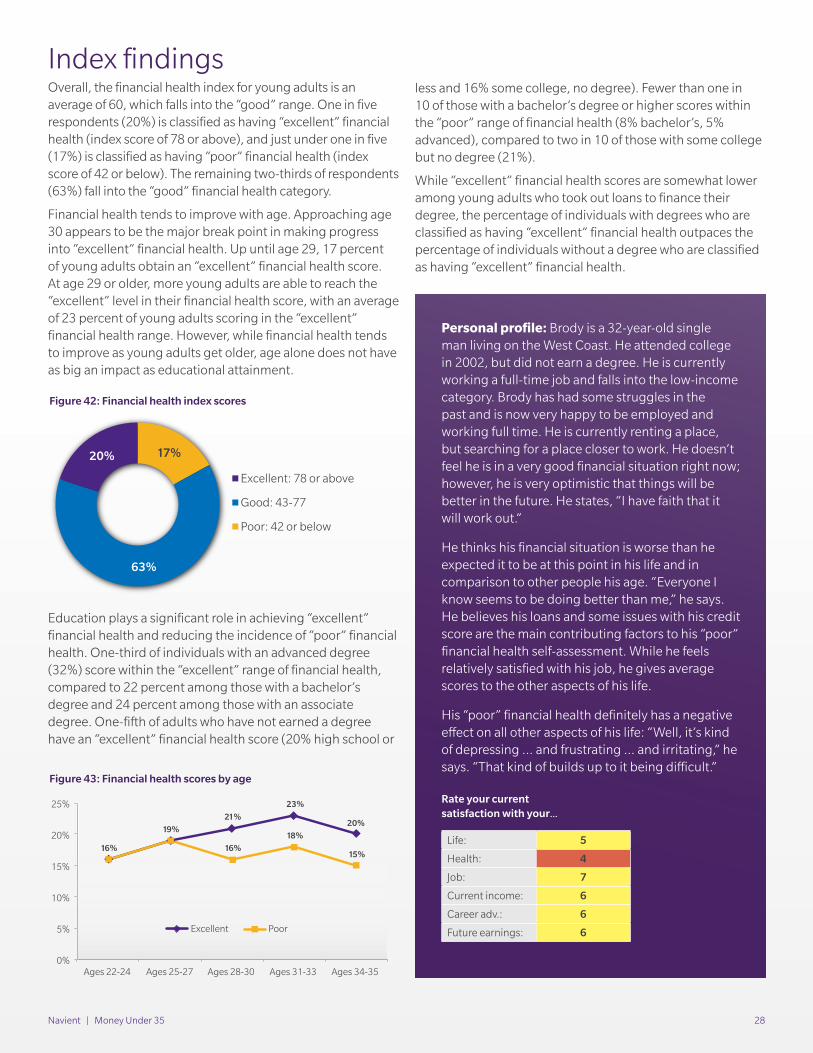
Navient | Money Under 35 28
Index findingsOverall, the financial health index for young adults is an average of 60, which falls into the “good” range. One in five respondents (20%) is classified as having “excellent” financial health (index score of 78 or above), and just under one in five (17%) is classified as having “poor” financial health (index score of 42 or below). The remaining two-thirds of respondents (63%) fall into the “good” financial health category.
Financial health tends to improve with age. Approaching age 30 appears to be the major break point in making progress into “excellent” financial health. Up until age 29, 17 percent of young adults obtain an “excellent” financial health score. At age 29 or older, more young adults are able to reach the “excellent” level in their financial health score, with an average of 23 percent of young adults scoring in the “excellent” financial health range. However, while financial health tends to improve as young adults get older, age alone does not have as big an impact as educational attainment.
Education plays a significant role in achieving “excellent” financial health and reducing the incidence of “poor” financial health. One-third of individuals with an advanced degree (32%) score within the “excellent” range of financial health, compared to 22 percent among those with a bachelor’s degree and 24 percent among those with an associate degree. One-fifth of adults who have not earned a degree have an “excellent” financial health score (20% high school or
less and 16% some college, no degree). Fewer than one in 10 of those with a bachelor’s degree or higher scores within the “poor” range of financial health (8% bachelor’s, 5% advanced), compared to two in 10 of those with some college but no degree (21%).
While “excellent” financial health scores are somewhat lower among young adults who took out loans to finance their degree, the percentage of individuals with degrees who are classified as having “excellent” financial health outpaces the percentage of individuals without a degree who are classified as having “excellent” financial health.
Personal profile: Brody is a 32-year-old single man living on the West Coast. He attended college in 2002, but did not earn a degree. He is currently working a full-time job and falls into the low-income category. Brody has had some struggles in the past and is now very happy to be employed and working full time. He is currently renting a place, but searching for a place closer to work. He doesn’t feel he is in a very good financial situation right now; however, he is very optimistic that things will be better in the future. He states, “I have faith that it will work out.”
He thinks his financial situation is worse than he expected it to be at this point in his life and in comparison to other people his age. “Everyone I know seems to be doing better than me,” he says. He believes his loans and some issues with his credit score are the main contributing factors to his “poor” financial health self-assessment. While he feels relatively satisfied with his job, he gives average scores to the other aspects of his life.
His “poor” financial health definitely has a negative effect on all other aspects of his life: “Well, it’s kind of depressing … and frustrating … and irritating,” he says. “That kind of builds up to it being difficult.”
Figure 42: Financial health index score
17%
63%
20%
Poor: 42 or below
Good: 43-77
Excellent: 78 or above
Figure 42: Financial health index scores
Figure 43: Financial health scores by ageFigure 43: Financial health scores by age
21%
23%
20%
16%
19%
16%
18%
15%
0%
5%
10%
15%
20%
25%
Ages 22-24 Ages 25-27 Ages 28-30 Ages 31-33 Ages 34-35
Excellent Poor
Rate your current satisfaction with your...
Life: 5
Health: 4
Job: 7
Current income: 6
Career adv.: 6
Future earnings: 6
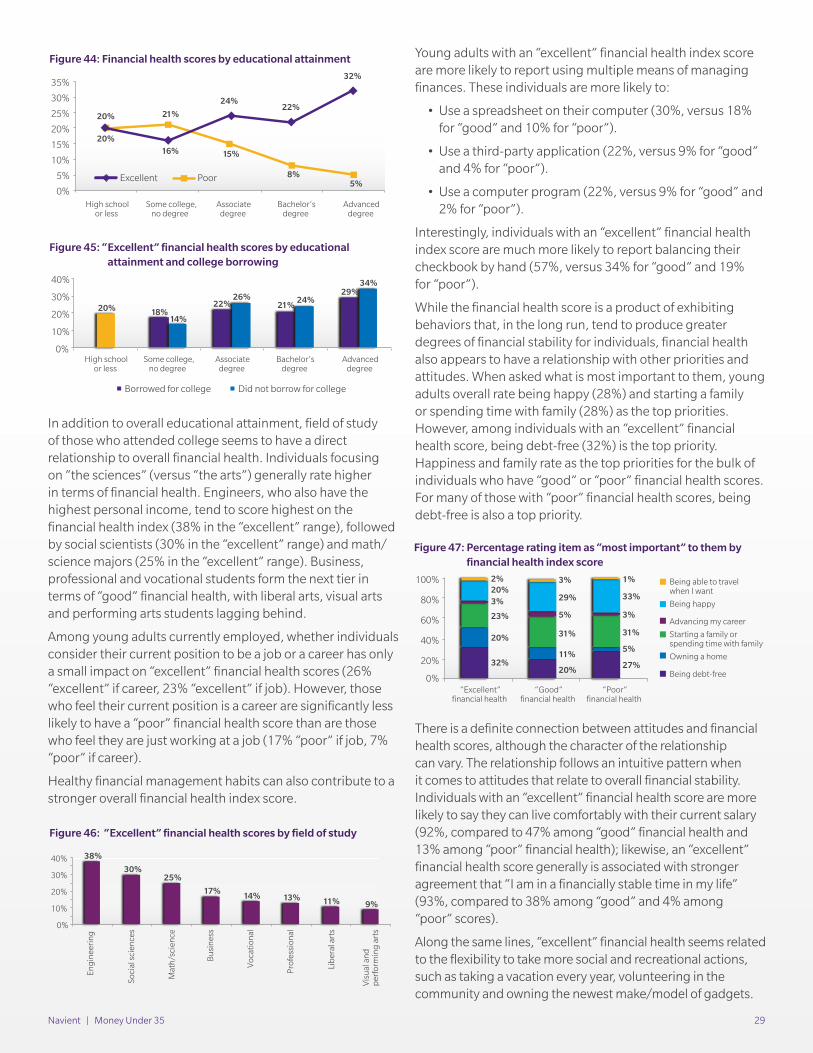
Navient | Money Under 35 29
In addition to overall educational attainment, field of study of those who attended college seems to have a direct relationship to overall financial health. Individuals focusing on “the sciences” (versus “the arts”) generally rate higher in terms of financial health. Engineers, who also have the highest personal income, tend to score highest on the financial health index (38% in the “excellent” range), followed by social scientists (30% in the “excellent” range) and math/science majors (25% in the “excellent” range). Business, professional and vocational students form the next tier in terms of “good” financial health, with liberal arts, visual arts and performing arts students lagging behind.
Among young adults currently employed, whether individuals consider their current position to be a job or a career has only a small impact on “excellent” financial health scores (26% “excellent” if career, 23% “excellent” if job). However, those who feel their current position is a career are significantly less likely to have a “poor” financial health score than are those who feel they are just working at a job (17% “poor” if job, 7% “poor” if career).
Healthy financial management habits can also contribute to a stronger overall financial health index score.
Young adults with an “excellent” financial health index score are more likely to report using multiple means of managing finances. These individuals are more likely to:
• Use a spreadsheet on their computer (30%, versus 18% for “good” and 10% for “poor”).
• Use a third-party application (22%, versus 9% for “good” and 4% for “poor”).
• Use a computer program (22%, versus 9% for “good” and 2% for “poor”).
Interestingly, individuals with an “excellent” financial health index score are much more likely to report balancing their checkbook by hand (57%, versus 34% for “good” and 19% for “poor”).
While the financial health score is a product of exhibiting behaviors that, in the long run, tend to produce greater degrees of financial stability for individuals, financial health also appears to have a relationship with other priorities and attitudes. When asked what is most important to them, young adults overall rate being happy (28%) and starting a family or spending time with family (28%) as the top priorities. However, among individuals with an “excellent” financial health score, being debt-free (32%) is the top priority. Happiness and family rate as the top priorities for the bulk of individuals who have “good” or “poor” financial health scores. For many of those with “poor” financial health scores, being debt-free is also a top priority.
There is a definite connection between attitudes and financial health scores, although the character of the relationship can vary. The relationship follows an intuitive pattern when it comes to attitudes that relate to overall financial stability. Individuals with an “excellent” financial health score are more likely to say they can live comfortably with their current salary (92%, compared to 47% among “good” financial health and 13% among “poor” financial health); likewise, an “excellent” financial health score generally is associated with stronger agreement that “I am in a financially stable time in my life” (93%, compared to 38% among “good” and 4% among “poor” scores).
Along the same lines, “excellent” financial health seems related to the flexibility to take more social and recreational actions, such as taking a vacation every year, volunteering in the community and owning the newest make/model of gadgets.
Figure 44: Financial health scores byeducational attainment
Excellent Poor
16%
24% 22%
32%
20% 21%
15%
8% 5%
0%
5%
10%
15%
20%
25%
30%
35%
High schoolor less
Some college,no degree
Associatedegree
Bachelor’sdegree
Advanceddegree
20%
Figure 44: Financial health scores by educational attainment
Figure 46: “Excellent” financial health scores by field of study
Figure 45: “ Excellent” financial health scores by educational attainment and college borrowing
Figure 47: Percentage rating item as “most important” to them by financial health index score
Figure 45: “Excellent” financial health scores byeducational attainment and college borrowing
High schoolor less
Some college,no degree
Associatedegree
Bachelor’sdegree
Advanceddegree
18% 22% 21%
29%
20% 14%
26% 24%
34%
0%
10%
20%
30%
40%
Borrowed for college Did not borrow for college
Figure 46: “Excellent” financial health scores byfield of study
38%
30% 25%
17% 14% 13% 11% 9%
0%
Eng
inee
rin
g
Soci
al s
cien
ces
Mat
h/s
cien
ce
Bus
ines
s
Voc
atio
nal
Pro
fess
ion
al
Lib
eral
art
s
Vis
ual a
nd
per
form
ing
art
s
10%
20%
30%
40%
Figure 47: Percentage rating item as“most important” to them by financialhealth index score
32% 20% 27%
20%
11% 5%
23%
31% 31%
3%
5% 3%
20% 29% 33%
2% 3% 1%
0%
20%
40%
60%
80%
100%
“Excellent”financial health
“Good”financial health
“Poor”financial health
Being able to travelwhen I want
Being happy
Advancing my career
Starting a family or spending time with family
Owning a home
Being debt-free
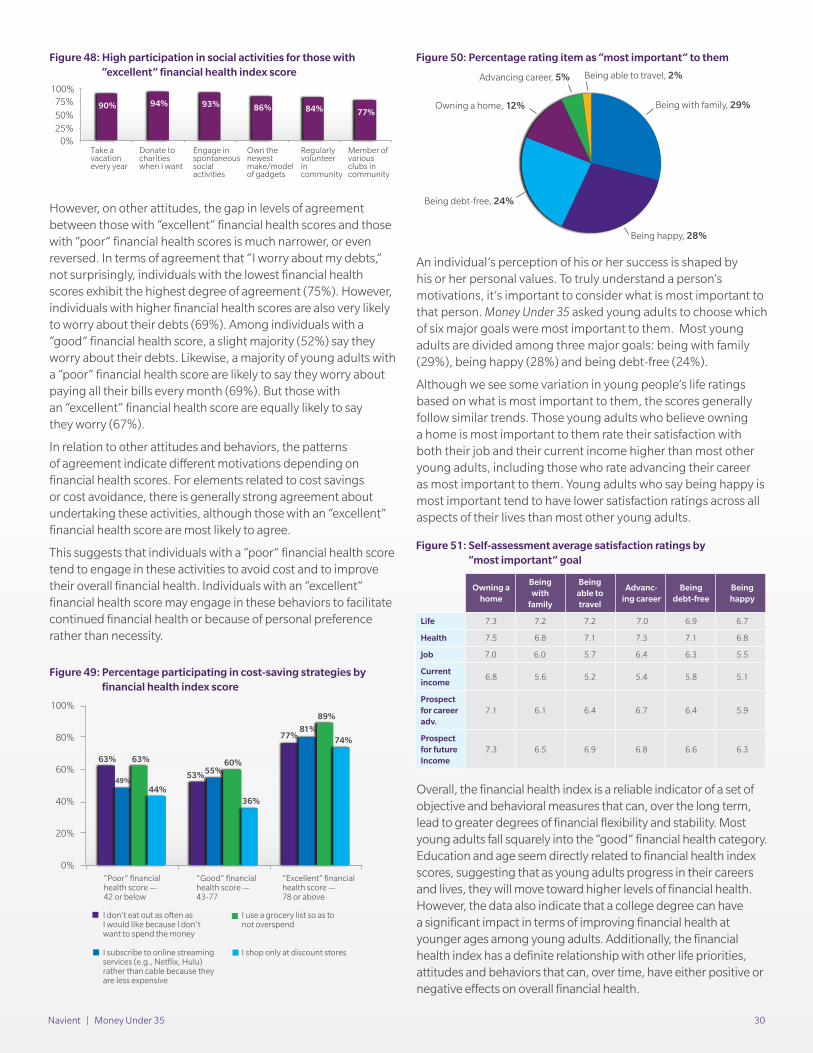
Navient | Money Under 35 30
However, on other attitudes, the gap in levels of agreement between those with “excellent” financial health scores and those with “poor” financial health scores is much narrower, or even reversed. In terms of agreement that “I worry about my debts,” not surprisingly, individuals with the lowest financial health scores exhibit the highest degree of agreement (75%). However, individuals with higher financial health scores are also very likely to worry about their debts (69%). Among individuals with a “good” financial health score, a slight majority (52%) say they worry about their debts. Likewise, a majority of young adults with a “poor” financial health score are likely to say they worry about paying all their bills every month (69%). But those with an “excellent” financial health score are equally likely to say they worry (67%).
In relation to other attitudes and behaviors, the patterns of agreement indicate different motivations depending on financial health scores. For elements related to cost savings or cost avoidance, there is generally strong agreement about undertaking these activities, although those with an “excellent” financial health score are most likely to agree.
This suggests that individuals with a “poor” financial health score tend to engage in these activities to avoid cost and to improve their overall financial health. Individuals with an “excellent” financial health score may engage in these behaviors to facilitate continued financial health or because of personal preference rather than necessity.
An individual’s perception of his or her success is shaped by his or her personal values. To truly understand a person’s motivations, it’s important to consider what is most important to that person. Money Under 35 asked young adults to choose which of six major goals were most important to them. Most young adults are divided among three major goals: being with family (29%), being happy (28%) and being debt-free (24%).
Although we see some variation in young people’s life ratings based on what is most important to them, the scores generally follow similar trends. Those young adults who believe owning a home is most important to them rate their satisfaction with both their job and their current income higher than most other young adults, including those who rate advancing their career as most important to them. Young adults who say being happy is most important tend to have lower satisfaction ratings across all aspects of their lives than most other young adults.
Overall, the financial health index is a reliable indicator of a set of objective and behavioral measures that can, over the long term, lead to greater degrees of financial flexibility and stability. Most young adults fall squarely into the “good” financial health category. Education and age seem directly related to financial health index scores, suggesting that as young adults progress in their careers and lives, they will move toward higher levels of financial health. However, the data also indicate that a college degree can have a significant impact in terms of improving financial health at younger ages among young adults. Additionally, the financial health index has a definite relationship with other life priorities, attitudes and behaviors that can, over time, have either positive or negative effects on overall financial health.
Figure 48: High participation in social activitiesfor those with "Excellent" financial healthindex scores
Take avacationevery year
Donate tocharitieswhen I want
Engage inspontaneoussocialactivities
Own thenewestmake/modelof gadgets
Regularlyvolunteerincommunity
Member ofvariousclubs incommunity
90% 94% 93% 86% 84% 77%
0% 25% 50% 75%
100%
Figure 48: High participation in social activities for those with “excellent” financial health index score
Figure 50: Percentage rating item as “most important” to them
Figure 51: Self-assessment average satisfaction ratings by “most important” goal
Figure 49: Percentage participating in cost-saving strategies by financial health index score
Figure 49: Percentage participating incost-saving strategies by financial healthindex score
63%
53%
77%
49% 55%
81%
63% 60%
89%
44% 36%
74%
0%
20%
40%
60%
80%
100%
“Poor” financialhealth score —42 or below
“Good” financialhealth score —43-77
“Excellent” financialhealth score — 78 or above
I don’t eat out as often asI would like because I don’twant to spend the money
I subscribe to online streamingservices (e.g., Netflix, Hulu)rather than cable because theyare less expensive
I use a grocery list so as tonot overspend
I shop only at discount stores
Figure 50: Percentage rating item as“most important” to them
Being with family, 29%
Being happy, 28%
Being debt-free, 24%
Owning a home, 12%
Advancing career, 5% Being able to travel, 2%
Figure 51:Self-assessment average satisfaction ratings by“most important” goal
-
Life
Health
Job
Current income
Prospect for career adv.
Prospect for future Income
Being debt-free
6.9
7.1
6.3
5.8
6.4
6.6
Owning a home
7.3
7.5
7.0
6.8
7.1
7.3
family
Being with
7.2
6.8
6.0
5.6
6.1
6.5
Advancing career
7.0
7.3
6.4
5.4
6.7
6.8
happyBeing
6.7
6.8
5.5
5.1
5.9
6.3
Being able to travel
7.2
7.1
5.7
5.2
6.4
6.9

Navient | Money Under 35 31
Table 1 - Educational attainment
Q: What is the highest degree or level of school you have completed?
NHigh school
or lessSome college,
no degreeAssociate
degreeBachelor’s
degreeAdvanced
degree
Total 3,006 40% 31% 7% 17% 6%
Gender
Male 1,518 44% 30% 7% 13% 6%
Female 1,488 36% 32% 7% 20% 6%
Age
22-24 689 48% 30% 7% 14% 2%
25-27 660 44% 29% 8% 16% 4%
28-30 629 30% 37% 7% 16% 9%
31-33 680 34% 31% 5% 22% 8%
34-35 347 48% 24% 7% 14% 7%
Income
<$35k 687 45% 35% 7% 11% 2%
$35-<$100k 996 33% 27% 9% 24% 8%
$100k+ 388 22% 27% 5% 27% 18%
Employment
Employedfull time
1,664 34% 27% 7% 23% 9%
Employedpart time
408 41% 39% 7% 9% 3%
Student full time 200 27% 57% 8% 7% 1%
Studentpart time
32* 33% 40% 7% 12% 9%
Military 15* 21% 61% 10% 7% 2%
Full-time at-home parent
328 47% 37% 5% 9% 2%
Unemployed and searching
201 65% 18% 6% 9% 1%
Unemployed and notsearching
119 73% 18% 4% 5% 1%
* Small base size
Tables
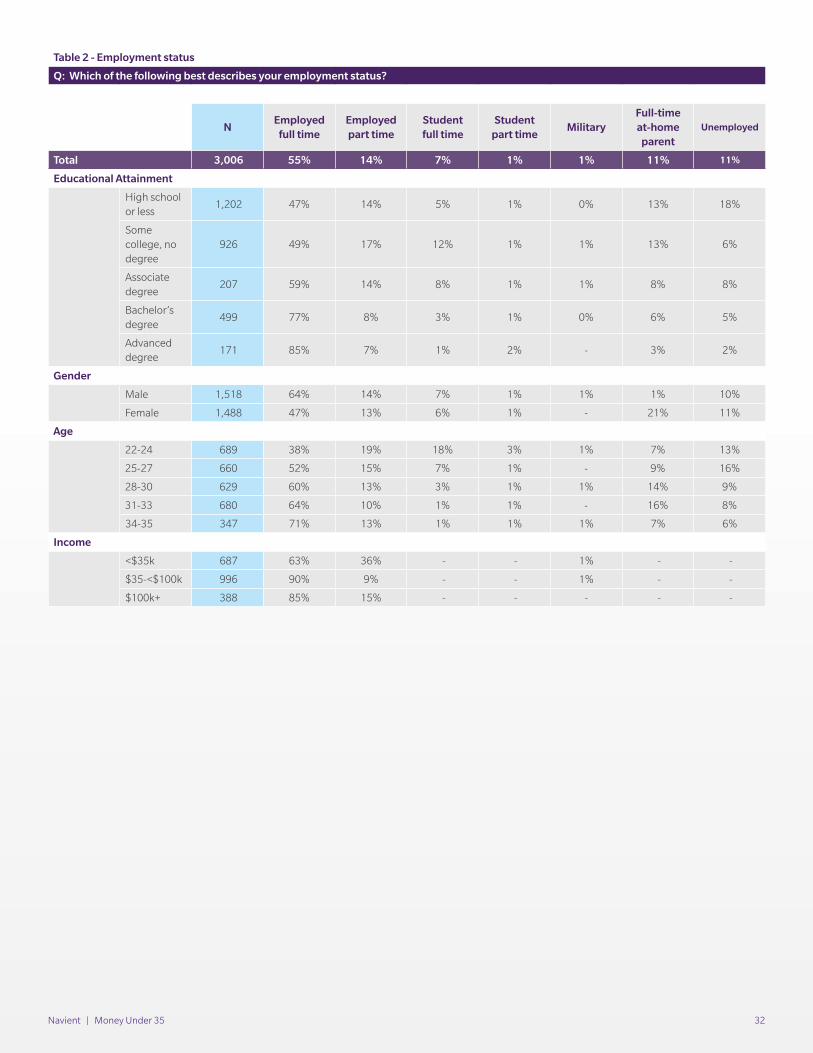
Navient | Money Under 35 32
Table 2 - Employment status
Q: Which of the following best describes your employment status?
NEmployed
full timeEmployed part time
Student full time
Student part time
MilitaryFull-time at-home
parentUnemployed
Total 3,006 55% 14% 7% 1% 1% 11% 11%
Educational Attainment
High school or less
1,202 47% 14% 5% 1% 0% 13% 18%
Some college, no degree
926 49% 17% 12% 1% 1% 13% 6%
Associate degree
207 59% 14% 8% 1% 1% 8% 8%
Bachelor’s degree
499 77% 8% 3% 1% 0% 6% 5%
Advanced degree
171 85% 7% 1% 2% - 3% 2%
Gender
Male 1,518 64% 14% 7% 1% 1% 1% 10%
Female 1,488 47% 13% 6% 1% - 21% 11%
Age
22-24 689 38% 19% 18% 3% 1% 7% 13%
25-27 660 52% 15% 7% 1% - 9% 16%
28-30 629 60% 13% 3% 1% 1% 14% 9%
31-33 680 64% 10% 1% 1% - 16% 8%
34-35 347 71% 13% 1% 1% 1% 7% 6%
Income
<$35k 687 63% 36% - - 1% - -
$35-<$100k 996 90% 9% - - 1% - -
$100k+ 388 85% 15% - - - - -
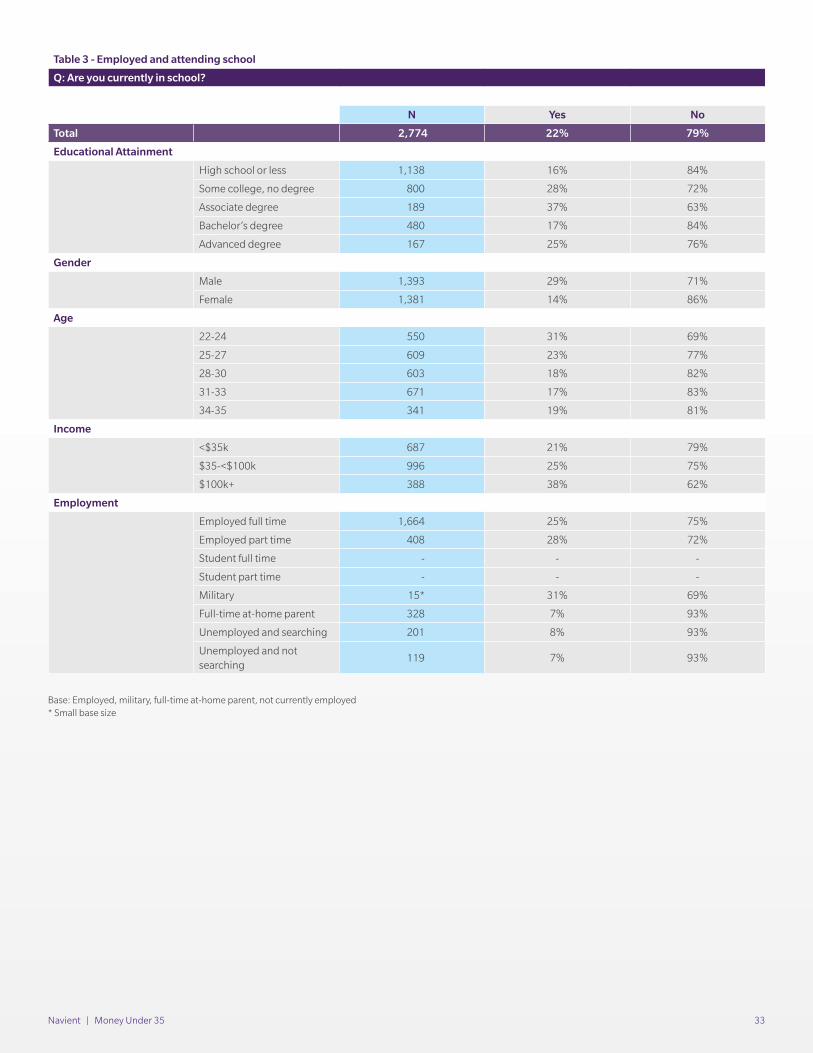
Navient | Money Under 35 33
Table 3 - Employed and attending school
Q: Are you currently in school?
N Yes No
Total 2,774 22% 79%
Educational Attainment
High school or less 1,138 16% 84%
Some college, no degree 800 28% 72%
Associate degree 189 37% 63%
Bachelor’s degree 480 17% 84%
Advanced degree 167 25% 76%
Gender
Male 1,393 29% 71%
Female 1,381 14% 86%
Age
22-24 550 31% 69%
25-27 609 23% 77%
28-30 603 18% 82%
31-33 671 17% 83%
34-35 341 19% 81%
Income
<$35k 687 21% 79%
$35-<$100k 996 25% 75%
$100k+ 388 38% 62%
Employment
Employed full time 1,664 25% 75%
Employed part time 408 28% 72%
Student full time - - -
Student part time - - -
Military 15* 31% 69%
Full-time at-home parent 328 7% 93%
Unemployed and searching 201 8% 93%
Unemployed and not searching
119 7% 93%
Base: Employed, military, full-time at-home parent, not currently employed* Small base size

Navient | Money Under 35 34
Table 4 - Goal of education
Q: What are you working toward in your education?
NProfessional
develop-ment
Continued learning
GEDWork ac-
creditationAssociate
degreeBachelor’s
degreeMaster’s degree
Professional degree
Doctoral degree
Total 828 11% 5% 3% 6% 23% 32% 14% 3% 4%
Educational Attainment
High school or less
246 21% 9% 9% 5% 22% 24% 9% 1% 1%
Some college, no degree
351 6% 4% 1% 7% 31% 38% 7% 2% 5%
Associate degree
88 4% 2% - 5% 21% 55% 10% 3% 1%
Bachelor’s degree
98 11% 1% - 6% 10% 26% 39% 6% 2%
Advanced degree
46* 7% 2% 2% 2% 1% 6% 43% 20% 18%
Gender
Male 531 14% 5% 4% 5% 21% 31% 14% 2% 4%
Female 297 5% 4% 2% 6% 26% 35% 13% 4% 4%
Age
22-24 308 9% 5% 3% 3% 23% 41% 9% 3% 4%
25-27 189 13% 6% 3% 6% 27% 29% 10% 2% 3%
28-30 135 11% 4% 2% 5% 20% 35% 17% 4% 2%
31-33 126 16% 2% 2% 14% 19% 16% 25% 1% 6%
34-35 70 2% 5% 7% 3% 26% 27% 18% 6% 6%
Income
<$35k 141 4% 2% 7% 6% 34% 38% 5% 1% 4%
$35-<$100k 245 17% 5% 4% 4% 26% 27% 14% 3% 1%
$100k+ 149 14% 4% 1% 6% 13% 18% 33% 4% 7%
Employment
Employed full time
416 16% 4% 4% 4% 23% 25% 19% 3% 3%
Employed part time
116 2% 5% 4% 9% 31% 34% 10% 1% 5%
Student full time
200 5% 4% 2% 6% 20% 46% 7% 4% 5%
Student part time
32* 4% 5% - 10% 24% 43% 11% 3% 1%
Military 5* - - - 21% 25% 49% - - 5%
Full-time at-home parent
24* 14% 11% - 11% 25% 35% 4% - 1%
Unemployedand searching
15* - 22% - 17% 17% 34% 2% 9% -
Unemployed and not searching
8* 13% - - - 49% - 38% - -
Base: Attending school* Small base size
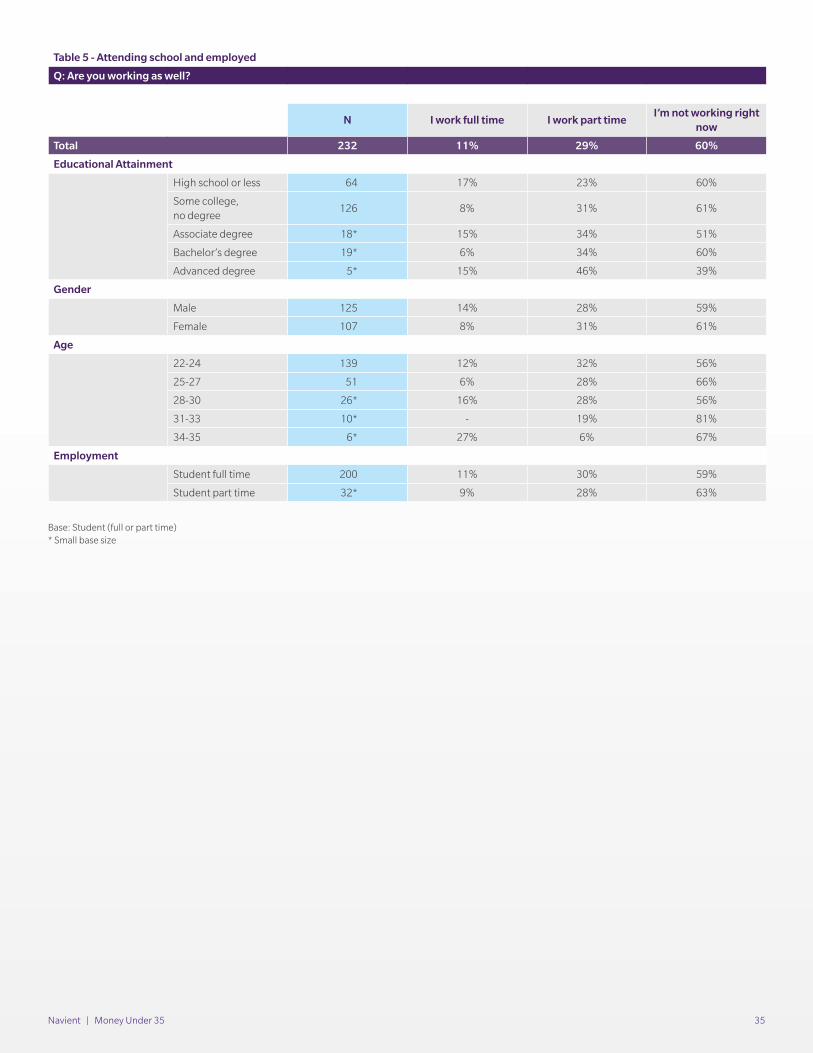
Navient | Money Under 35 35
Table 5 - Attending school and employed
Q: Are you working as well?
N I work full time I work part timeI’m not working right
now
Total 232 11% 29% 60%
Educational Attainment
High school or less 64 17% 23% 60%
Some college, no degree
126 8% 31% 61%
Associate degree 18* 15% 34% 51%
Bachelor’s degree 19* 6% 34% 60%
Advanced degree 5* 15% 46% 39%
Gender
Male 125 14% 28% 59%
Female 107 8% 31% 61%
Age
22-24 139 12% 32% 56%
25-27 51 6% 28% 66%
28-30 26* 16% 28% 56%
31-33 10* - 19% 81%
34-35 6* 27% 6% 67%
Employment
Student full time 200 11% 30% 59%
Student part time 32* 9% 28% 63%
Base: Student (full or part time)* Small base size
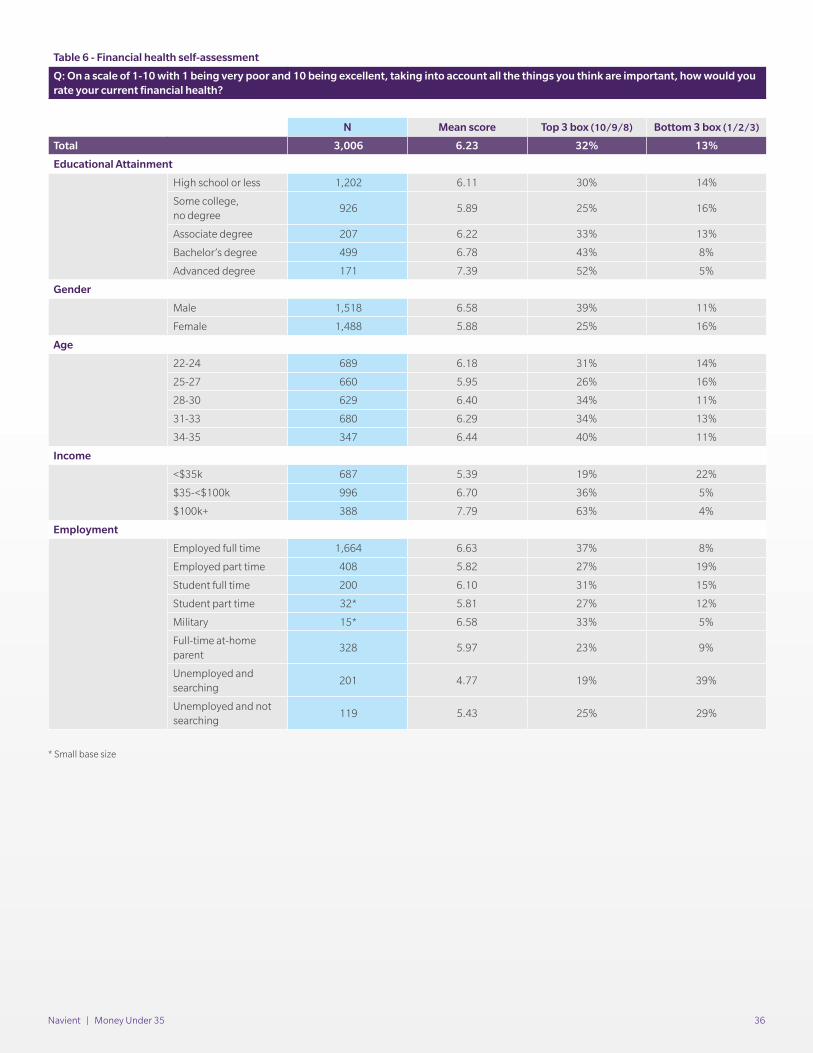
Navient | Money Under 35 36
Table 6 - Financial health self-assessment
Q: On a scale of 1-10 with 1 being very poor and 10 being excellent, taking into account all the things you think are important, how would you rate your current financial health?
N Mean score Top 3 box (10/9/8) Bottom 3 box (1/2/3)
Total 3,006 6.23 32% 13%
Educational Attainment
High school or less 1,202 6.11 30% 14%
Some college, no degree
926 5.89 25% 16%
Associate degree 207 6.22 33% 13%
Bachelor’s degree 499 6.78 43% 8%
Advanced degree 171 7.39 52% 5%
Gender
Male 1,518 6.58 39% 11%
Female 1,488 5.88 25% 16%
Age
22-24 689 6.18 31% 14%
25-27 660 5.95 26% 16%
28-30 629 6.40 34% 11%
31-33 680 6.29 34% 13%
34-35 347 6.44 40% 11%
Income
<$35k 687 5.39 19% 22%
$35-<$100k 996 6.70 36% 5%
$100k+ 388 7.79 63% 4%
Employment
Employed full time 1,664 6.63 37% 8%
Employed part time 408 5.82 27% 19%
Student full time 200 6.10 31% 15%
Student part time 32* 5.81 27% 12%
Military 15* 6.58 33% 5%
Full-time at-home parent
328 5.97 23% 9%
Unemployed and searching
201 4.77 19% 39%
Unemployed and not searching
119 5.43 25% 29%
* Small base size
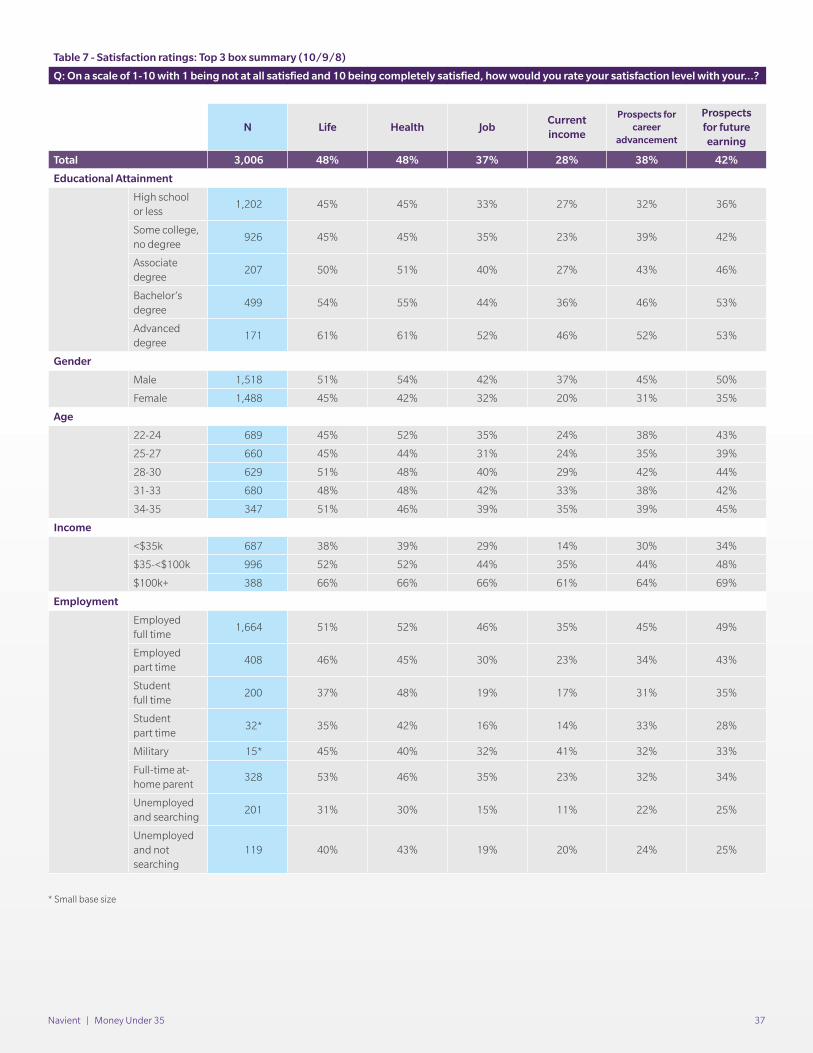
Navient | Money Under 35 37
Table 7 - Satisfaction ratings: Top 3 box summary (10/9/8)
Q: On a scale of 1-10 with 1 being not at all satisfied and 10 being completely satisfied, how would you rate your satisfaction level with your…?
N Life Health JobCurrent income
Prospects for career
advancement
Prospects for future earning
Total 3,006 48% 48% 37% 28% 38% 42%
Educational Attainment
High school or less
1,202 45% 45% 33% 27% 32% 36%
Some college, no degree
926 45% 45% 35% 23% 39% 42%
Associate degree
207 50% 51% 40% 27% 43% 46%
Bachelor’s degree
499 54% 55% 44% 36% 46% 53%
Advanced degree
171 61% 61% 52% 46% 52% 53%
Gender
Male 1,518 51% 54% 42% 37% 45% 50%
Female 1,488 45% 42% 32% 20% 31% 35%
Age
22-24 689 45% 52% 35% 24% 38% 43%
25-27 660 45% 44% 31% 24% 35% 39%
28-30 629 51% 48% 40% 29% 42% 44%
31-33 680 48% 48% 42% 33% 38% 42%
34-35 347 51% 46% 39% 35% 39% 45%
Income
<$35k 687 38% 39% 29% 14% 30% 34%
$35-<$100k 996 52% 52% 44% 35% 44% 48%
$100k+ 388 66% 66% 66% 61% 64% 69%
Employment
Employed full time
1,664 51% 52% 46% 35% 45% 49%
Employed part time
408 46% 45% 30% 23% 34% 43%
Student full time
200 37% 48% 19% 17% 31% 35%
Student part time
32* 35% 42% 16% 14% 33% 28%
Military 15* 45% 40% 32% 41% 32% 33%
Full-time at-home parent
328 53% 46% 35% 23% 32% 34%
Unemployed and searching
201 31% 30% 15% 11% 22% 25%
Unemployed and not searching
119 40% 43% 19% 20% 24% 25%
* Small base size
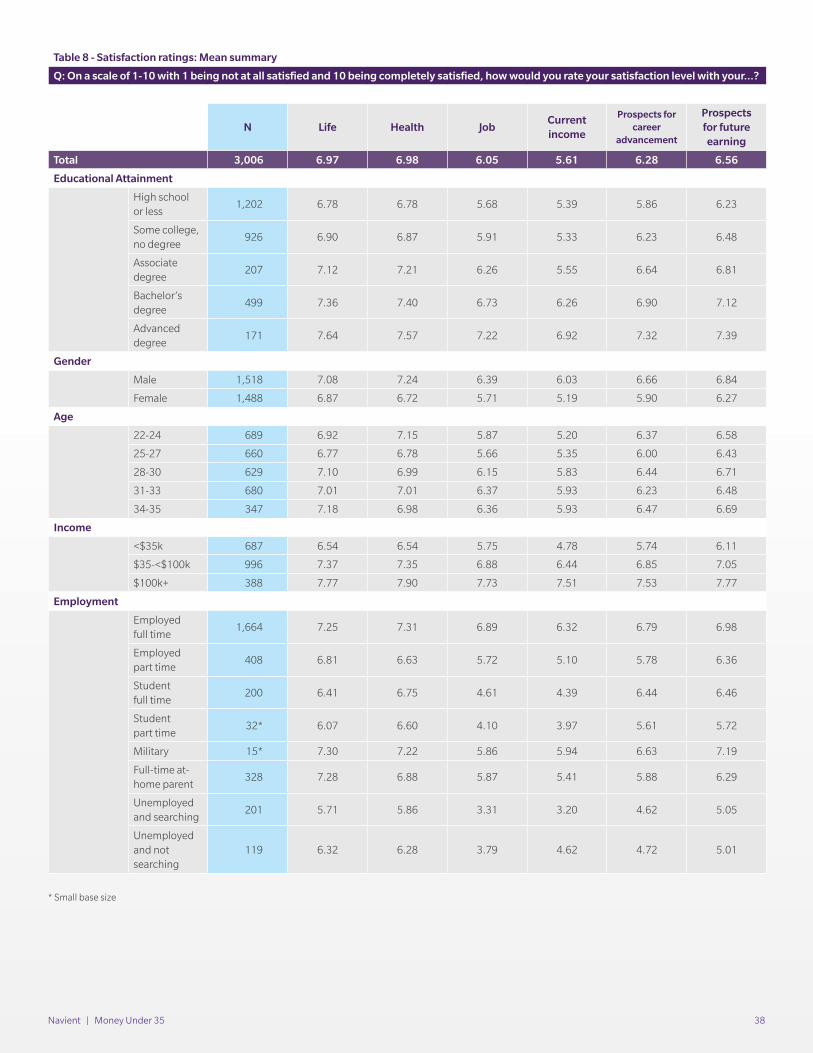
Navient | Money Under 35 38
Table 8 - Satisfaction ratings: Mean summary
Q: On a scale of 1-10 with 1 being not at all satisfied and 10 being completely satisfied, how would you rate your satisfaction level with your...?
N Life Health JobCurrent income
Prospects for career
advancement
Prospects for future earning
Total 3,006 6.97 6.98 6.05 5.61 6.28 6.56
Educational Attainment
High school or less
1,202 6.78 6.78 5.68 5.39 5.86 6.23
Some college, no degree
926 6.90 6.87 5.91 5.33 6.23 6.48
Associate degree
207 7.12 7.21 6.26 5.55 6.64 6.81
Bachelor’s degree
499 7.36 7.40 6.73 6.26 6.90 7.12
Advanced degree
171 7.64 7.57 7.22 6.92 7.32 7.39
Gender
Male 1,518 7.08 7.24 6.39 6.03 6.66 6.84
Female 1,488 6.87 6.72 5.71 5.19 5.90 6.27
Age
22-24 689 6.92 7.15 5.87 5.20 6.37 6.58
25-27 660 6.77 6.78 5.66 5.35 6.00 6.43
28-30 629 7.10 6.99 6.15 5.83 6.44 6.71
31-33 680 7.01 7.01 6.37 5.93 6.23 6.48
34-35 347 7.18 6.98 6.36 5.93 6.47 6.69
Income
<$35k 687 6.54 6.54 5.75 4.78 5.74 6.11
$35-<$100k 996 7.37 7.35 6.88 6.44 6.85 7.05
$100k+ 388 7.77 7.90 7.73 7.51 7.53 7.77
Employment
Employed full time
1,664 7.25 7.31 6.89 6.32 6.79 6.98
Employed part time
408 6.81 6.63 5.72 5.10 5.78 6.36
Student full time
200 6.41 6.75 4.61 4.39 6.44 6.46
Student part time
32* 6.07 6.60 4.10 3.97 5.61 5.72
Military 15* 7.30 7.22 5.86 5.94 6.63 7.19
Full-time at-home parent
328 7.28 6.88 5.87 5.41 5.88 6.29
Unemployed and searching
201 5.71 5.86 3.31 3.20 4.62 5.05
Unemployed and not searching
119 6.32 6.28 3.79 4.62 4.72 5.01
* Small base size
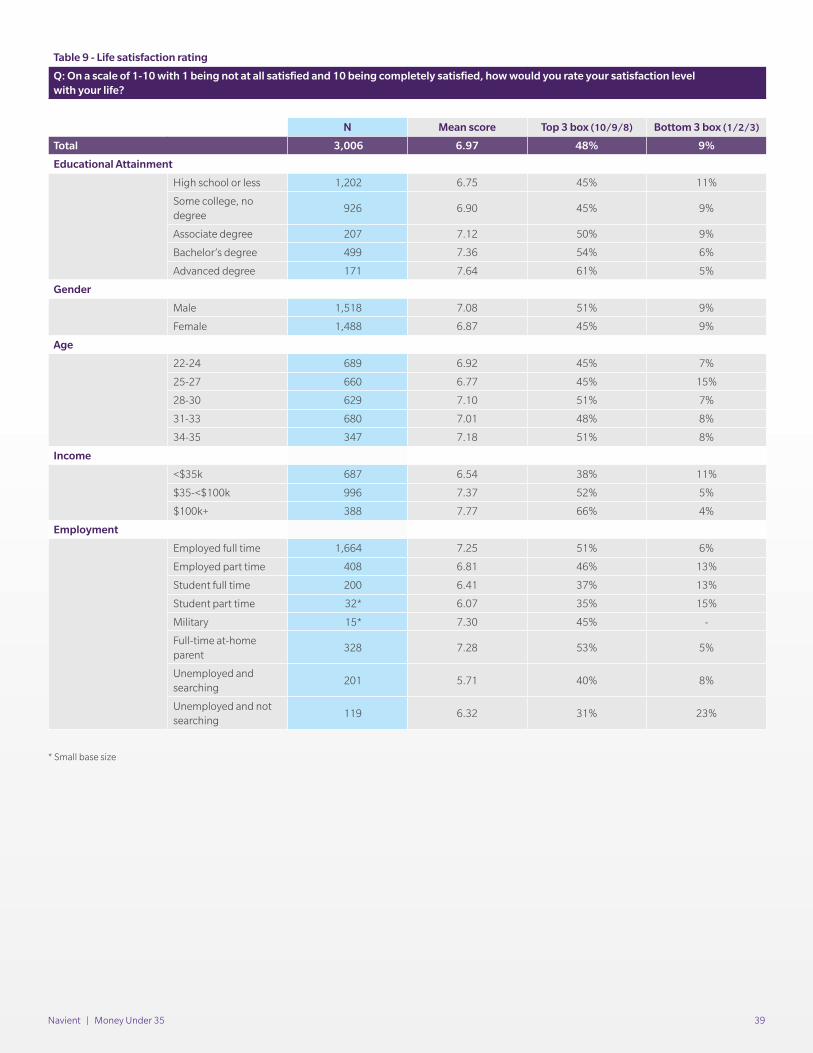
Navient | Money Under 35 39
Table 9 - Life satisfaction rating
Q: On a scale of 1-10 with 1 being not at all satisfied and 10 being completely satisfied, how would you rate your satisfaction level with your life?
N Mean score Top 3 box (10/9/8) Bottom 3 box (1/2/3)
Total 3,006 6.97 48% 9%
Educational Attainment
High school or less 1,202 6.75 45% 11%
Some college, no degree
926 6.90 45% 9%
Associate degree 207 7.12 50% 9%
Bachelor’s degree 499 7.36 54% 6%
Advanced degree 171 7.64 61% 5%
Gender
Male 1,518 7.08 51% 9%
Female 1,488 6.87 45% 9%
Age
22-24 689 6.92 45% 7%
25-27 660 6.77 45% 15%
28-30 629 7.10 51% 7%
31-33 680 7.01 48% 8%
34-35 347 7.18 51% 8%
Income
<$35k 687 6.54 38% 11%
$35-<$100k 996 7.37 52% 5%
$100k+ 388 7.77 66% 4%
Employment
Employed full time 1,664 7.25 51% 6%
Employed part time 408 6.81 46% 13%
Student full time 200 6.41 37% 13%
Student part time 32* 6.07 35% 15%
Military 15* 7.30 45% -
Full-time at-home parent
328 7.28 53% 5%
Unemployed and searching
201 5.71 40% 8%
Unemployed and not searching
119 6.32 31% 23%
* Small base size
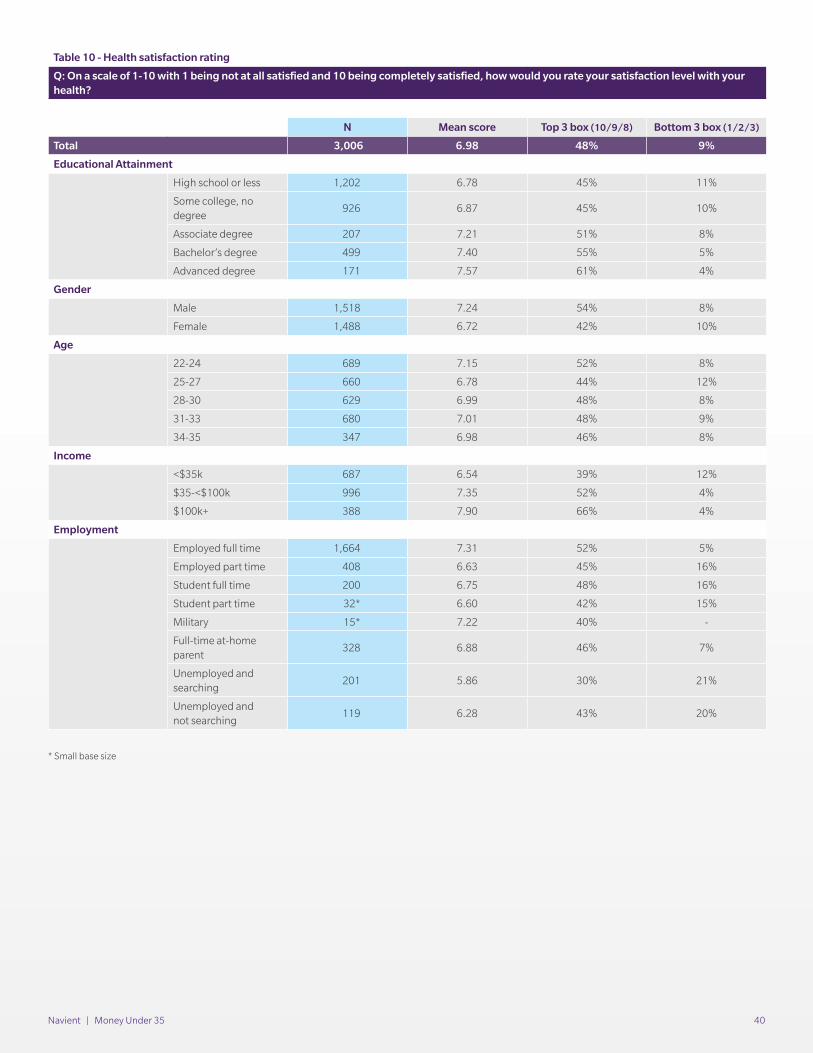
Navient | Money Under 35 40
Table 10 - Health satisfaction rating
Q: On a scale of 1-10 with 1 being not at all satisfied and 10 being completely satisfied, how would you rate your satisfaction level with your health?
N Mean score Top 3 box (10/9/8) Bottom 3 box (1/2/3)
Total 3,006 6.98 48% 9%
Educational Attainment
High school or less 1,202 6.78 45% 11%
Some college, no degree
926 6.87 45% 10%
Associate degree 207 7.21 51% 8%
Bachelor’s degree 499 7.40 55% 5%
Advanced degree 171 7.57 61% 4%
Gender
Male 1,518 7.24 54% 8%
Female 1,488 6.72 42% 10%
Age
22-24 689 7.15 52% 8%
25-27 660 6.78 44% 12%
28-30 629 6.99 48% 8%
31-33 680 7.01 48% 9%
34-35 347 6.98 46% 8%
Income
<$35k 687 6.54 39% 12%
$35-<$100k 996 7.35 52% 4%
$100k+ 388 7.90 66% 4%
Employment
Employed full time 1,664 7.31 52% 5%
Employed part time 408 6.63 45% 16%
Student full time 200 6.75 48% 16%
Student part time 32* 6.60 42% 15%
Military 15* 7.22 40% -
Full-time at-home parent
328 6.88 46% 7%
Unemployed and searching
201 5.86 30% 21%
Unemployed and not searching
119 6.28 43% 20%
* Small base size
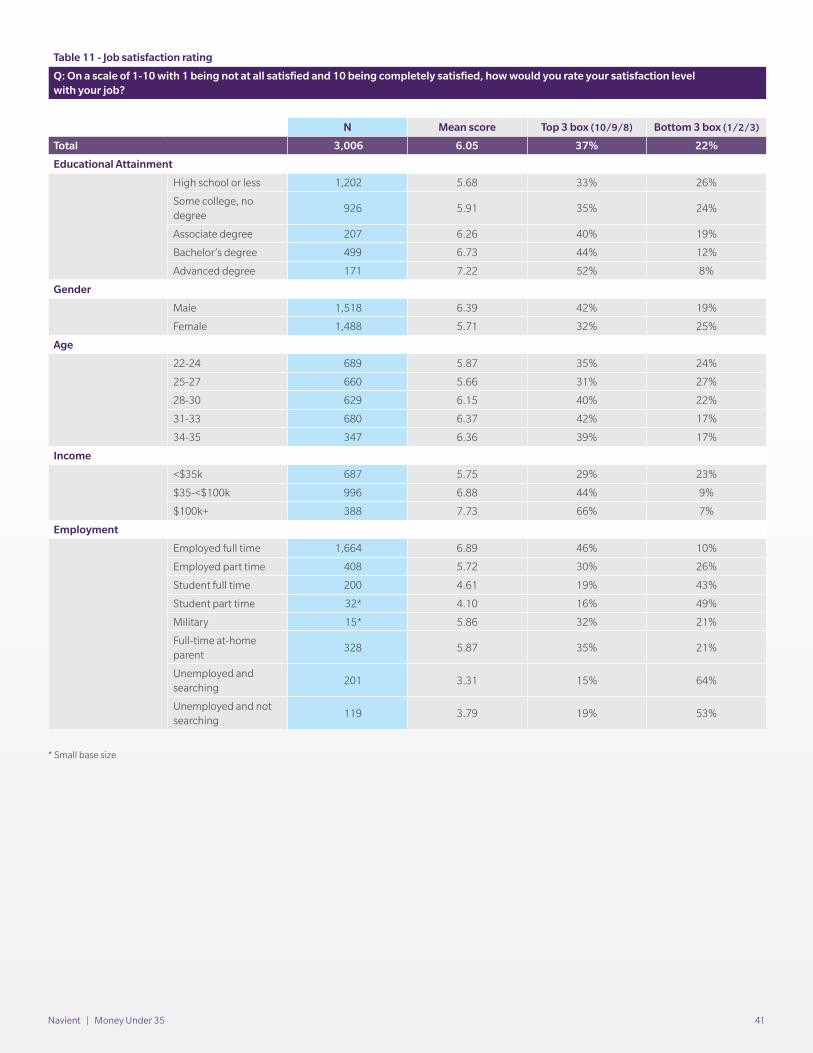
Navient | Money Under 35 41
Table 11 - Job satisfaction rating
Q: On a scale of 1-10 with 1 being not at all satisfied and 10 being completely satisfied, how would you rate your satisfaction level with your job?
N Mean score Top 3 box (10/9/8) Bottom 3 box (1/2/3)
Total 3,006 6.05 37% 22%
Educational Attainment
High school or less 1,202 5.68 33% 26%
Some college, no degree
926 5.91 35% 24%
Associate degree 207 6.26 40% 19%
Bachelor’s degree 499 6.73 44% 12%
Advanced degree 171 7.22 52% 8%
Gender
Male 1,518 6.39 42% 19%
Female 1,488 5.71 32% 25%
Age
22-24 689 5.87 35% 24%
25-27 660 5.66 31% 27%
28-30 629 6.15 40% 22%
31-33 680 6.37 42% 17%
34-35 347 6.36 39% 17%
Income
<$35k 687 5.75 29% 23%
$35-<$100k 996 6.88 44% 9%
$100k+ 388 7.73 66% 7%
Employment
Employed full time 1,664 6.89 46% 10%
Employed part time 408 5.72 30% 26%
Student full time 200 4.61 19% 43%
Student part time 32* 4.10 16% 49%
Military 15* 5.86 32% 21%
Full-time at-home parent
328 5.87 35% 21%
Unemployed and searching
201 3.31 15% 64%
Unemployed and not searching
119 3.79 19% 53%
* Small base size

Navient | Money Under 35 42
Table 12 - Current income satisfaction rating
Q: On a scale of 1-10 with 1 being not at all satisfied and 10 being completely satisfied, how would you rate your satisfaction level with your current income?
N Mean score Top 3 box (10/9/8) Bottom 3 box (1/2/3)
Total 3,006 5.61 28% 24%
Educational Attainment
High school or less 1,202 5.39 27% 27%
Some college, no degree
926 5.33 23% 29%
Associate degree 207 5.55 27% 26%
Bachelor’s degree 499 6.26 36% 14%
Advanced degree 171 6.92 46% 11%
Gender
Male 1,518 6.03 37% 22%
Female 1,488 5.19 20% 27%
Age
22-24 689 5.20 24% 31%
25-27 660 5.35 24% 28%
28-30 629 5.83 29% 20%
31-33 680 5.93 33% 21%
34-35 347 5.93 35% 19%
Income
<$35k 687 4.78 14% 34%
$35-<$100k 996 6.44 35% 11%
$100k+ 388 7.51 61% 6%
Employment
Employed full time 1,664 6.32 35% 14%
Employed part time 408 5.10 23% 34%
Student full time 200 4.39 17% 42%
Student part time 32* 3.97 14% 51%
Military 15* 5.94 41% 19%
Full-time at-home parent
328 5.41 23% 22%
Unemployed and searching
201 3.20 11% 64%
Unemployed and not searching
119 4.62 20% 41%
* Small base size
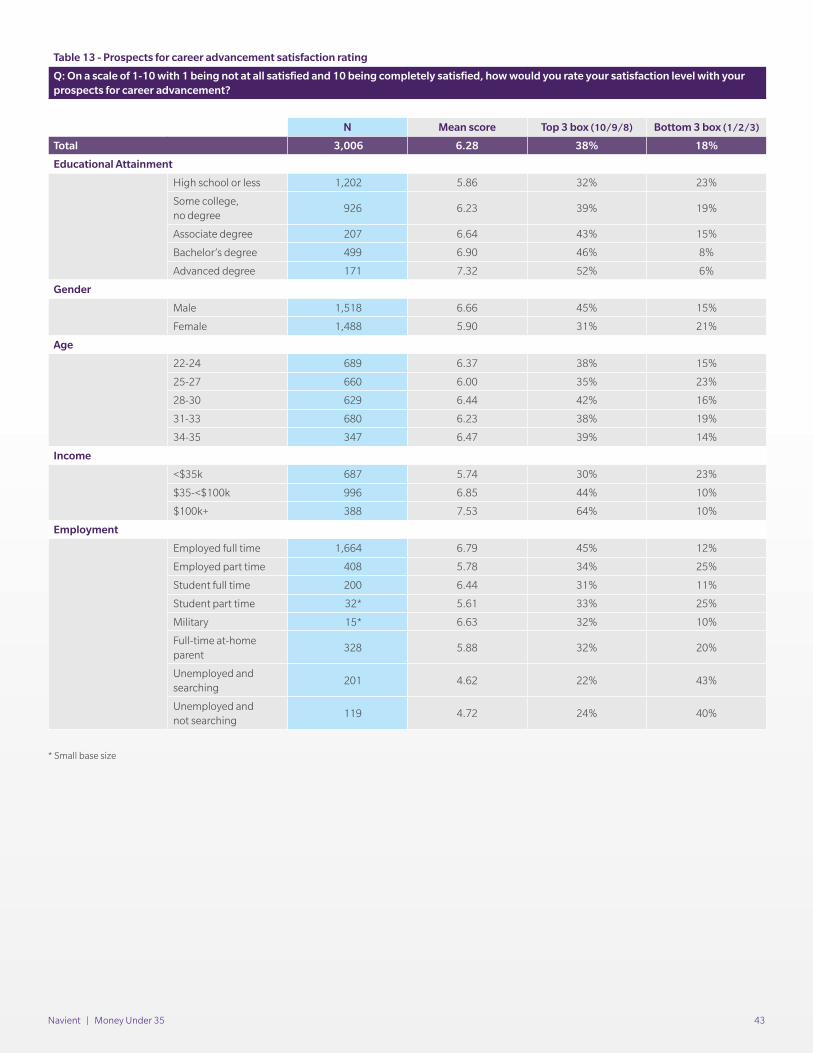
Navient | Money Under 35 43
Table 13 - Prospects for career advancement satisfaction rating
Q: On a scale of 1-10 with 1 being not at all satisfied and 10 being completely satisfied, how would you rate your satisfaction level with your prospects for career advancement?
N Mean score Top 3 box (10/9/8) Bottom 3 box (1/2/3)
Total 3,006 6.28 38% 18%
Educational Attainment
High school or less 1,202 5.86 32% 23%
Some college, no degree
926 6.23 39% 19%
Associate degree 207 6.64 43% 15%
Bachelor’s degree 499 6.90 46% 8%
Advanced degree 171 7.32 52% 6%
Gender
Male 1,518 6.66 45% 15%
Female 1,488 5.90 31% 21%
Age
22-24 689 6.37 38% 15%
25-27 660 6.00 35% 23%
28-30 629 6.44 42% 16%
31-33 680 6.23 38% 19%
34-35 347 6.47 39% 14%
Income
<$35k 687 5.74 30% 23%
$35-<$100k 996 6.85 44% 10%
$100k+ 388 7.53 64% 10%
Employment
Employed full time 1,664 6.79 45% 12%
Employed part time 408 5.78 34% 25%
Student full time 200 6.44 31% 11%
Student part time 32* 5.61 33% 25%
Military 15* 6.63 32% 10%
Full-time at-home parent
328 5.88 32% 20%
Unemployed and searching
201 4.62 22% 43%
Unemployed and not searching
119 4.72 24% 40%
* Small base size

Navient | Money Under 35 44
Table 14 - Prospects for future earnings satisfaction rating
Q: On a scale of 1-10, with 1 being not at all satisfied and 10 being completely satisfied, how would you rate your satisfaction level with your prospects for future earnings?
N Mean score Top 3 box (10/9/8) Bottom 3 box (1/2/3)
Total 3,006 6.56 42% 14%
Educational Attainment
High school or less 1,202 6.23 36% 17%
Some college, no degree
926 6.48 42% 16%
Associate degree 207 6.81 46% 13%
Bachelor’s degree 499 7.12 53% 6%
Advanced degree 171 7.39 53% 7%
Gender
Male 1,518 6.84 50% 13%
Female 1,488 6.27 35% 15%
Age
22-24 689 6.58 43% 13%
25-27 660 6.43 39% 17%
28-30 629 6.71 44% 10%
31-33 680 6.48 42% 16%
34-35 347 6.69 45% 12%
Income
<$35k 687 6.11 34% 17%
$35-<$100k 996 7.05 48% 9%
$100k+ 388 7.77 69% 5%
Employment
Employed full time 1,664 6.98 49% 9%
Employed part time 408 6.36 43% 18%
Student full time 200 6.46 35% 12%
Student part time 32* 5.72 28% 17%
Military 15* 7.19 33% -
Full-time at-home parent
328 6.29 34% 15%
Unemployed and searching
201 5.05 25% 34%
Unemployed and not searching
119 5.01 25% 33%
* Small base size
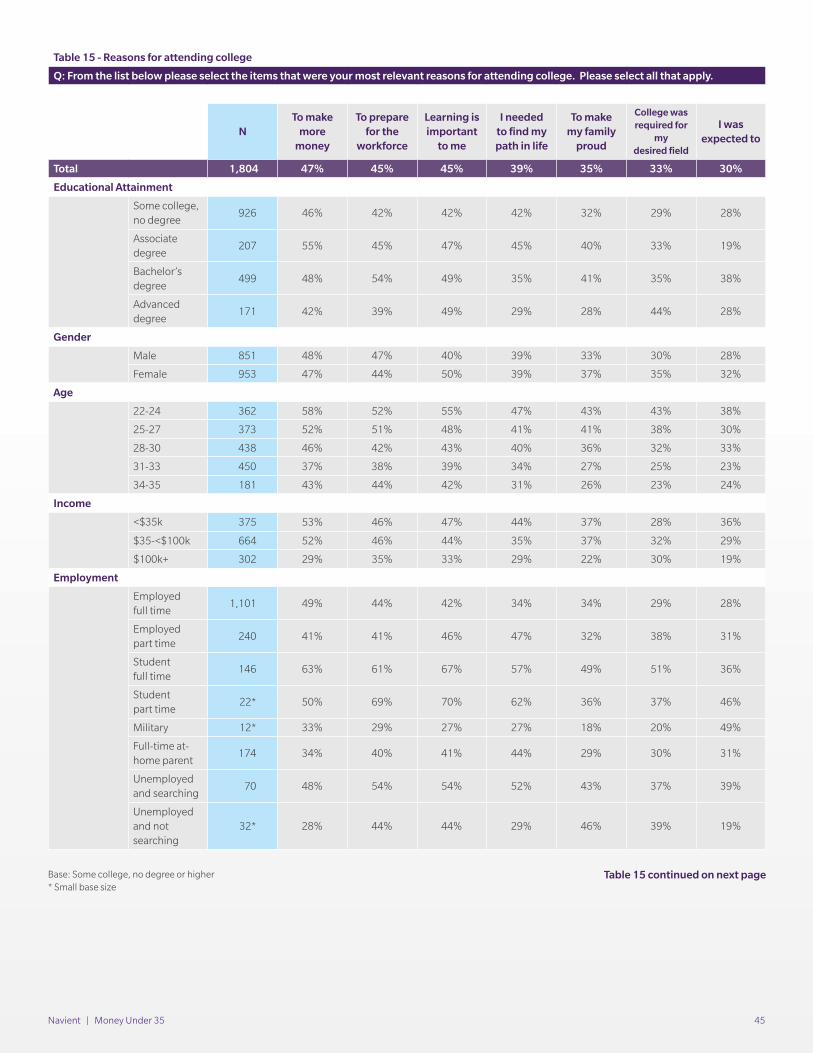
Navient | Money Under 35 45
Table 15 - Reasons for attending college
Q: From the list below please select the items that were your most relevant reasons for attending college. Please select all that apply.
NTo make
more money
To prepare for the
workforce
Learning is important
to me
I needed to find my path in life
To make my family
proud
College was required for
my desired field
I was expected to
Total 1,804 47% 45% 45% 39% 35% 33% 30%
Educational Attainment
Some college, no degree
926 46% 42% 42% 42% 32% 29% 28%
Associate degree
207 55% 45% 47% 45% 40% 33% 19%
Bachelor’s degree
499 48% 54% 49% 35% 41% 35% 38%
Advanced degree
171 42% 39% 49% 29% 28% 44% 28%
Gender
Male 851 48% 47% 40% 39% 33% 30% 28%
Female 953 47% 44% 50% 39% 37% 35% 32%
Age
22-24 362 58% 52% 55% 47% 43% 43% 38%
25-27 373 52% 51% 48% 41% 41% 38% 30%
28-30 438 46% 42% 43% 40% 36% 32% 33%
31-33 450 37% 38% 39% 34% 27% 25% 23%
34-35 181 43% 44% 42% 31% 26% 23% 24%
Income
<$35k 375 53% 46% 47% 44% 37% 28% 36%
$35-<$100k 664 52% 46% 44% 35% 37% 32% 29%
$100k+ 302 29% 35% 33% 29% 22% 30% 19%
Employment
Employed full time
1,101 49% 44% 42% 34% 34% 29% 28%
Employed part time
240 41% 41% 46% 47% 32% 38% 31%
Studentfull time
146 63% 61% 67% 57% 49% 51% 36%
Student part time
22* 50% 69% 70% 62% 36% 37% 46%
Military 12* 33% 29% 27% 27% 18% 20% 49%
Full-time at-home parent
174 34% 40% 41% 44% 29% 30% 31%
Unemployed and searching
70 48% 54% 54% 52% 43% 37% 39%
Unemployed and not searching
32* 28% 44% 44% 29% 46% 39% 19%
Base: Some college, no degree or higher* Small base size
Table 15 continued on next page
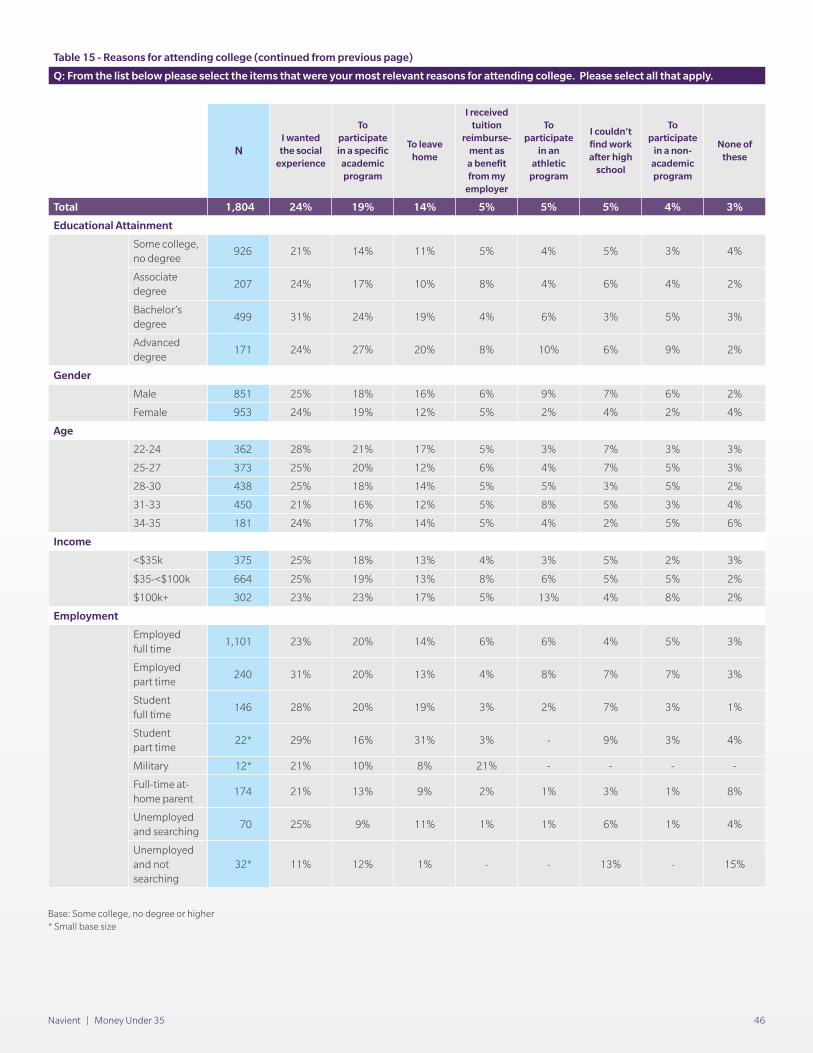
Navient | Money Under 35 46
Table 15 - Reasons for attending college (continued from previous page)
Q: From the list below please select the items that were your most relevant reasons for attending college. Please select all that apply.
NI wanted
the social experience
To participate in a specific
academic program
To leave home
I received tuition
reimburse-ment as
a benefit from my
employer
To participate
in an athletic
program
I couldn’t find work after high
school
To participate
in a non- academic program
None of these
Total 1,804 24% 19% 14% 5% 5% 5% 4% 3%
Educational Attainment
Some college, no degree
926 21% 14% 11% 5% 4% 5% 3% 4%
Associate degree
207 24% 17% 10% 8% 4% 6% 4% 2%
Bachelor’s degree
499 31% 24% 19% 4% 6% 3% 5% 3%
Advanced degree
171 24% 27% 20% 8% 10% 6% 9% 2%
Gender
Male 851 25% 18% 16% 6% 9% 7% 6% 2%
Female 953 24% 19% 12% 5% 2% 4% 2% 4%
Age
22-24 362 28% 21% 17% 5% 3% 7% 3% 3%
25-27 373 25% 20% 12% 6% 4% 7% 5% 3%
28-30 438 25% 18% 14% 5% 5% 3% 5% 2%
31-33 450 21% 16% 12% 5% 8% 5% 3% 4%
34-35 181 24% 17% 14% 5% 4% 2% 5% 6%
Income
<$35k 375 25% 18% 13% 4% 3% 5% 2% 3%
$35-<$100k 664 25% 19% 13% 8% 6% 5% 5% 2%
$100k+ 302 23% 23% 17% 5% 13% 4% 8% 2%
Employment
Employed full time
1,101 23% 20% 14% 6% 6% 4% 5% 3%
Employed part time
240 31% 20% 13% 4% 8% 7% 7% 3%
Studentfull time
146 28% 20% 19% 3% 2% 7% 3% 1%
Student part time
22* 29% 16% 31% 3% - 9% 3% 4%
Military 12* 21% 10% 8% 21% - - - -
Full-time at-home parent
174 21% 13% 9% 2% 1% 3% 1% 8%
Unemployed and searching
70 25% 9% 11% 1% 1% 6% 1% 4%
Unemployed and not searching
32* 11% 12% 1% - - 13% - 15%
Base: Some college, no degree or higher * Small base size
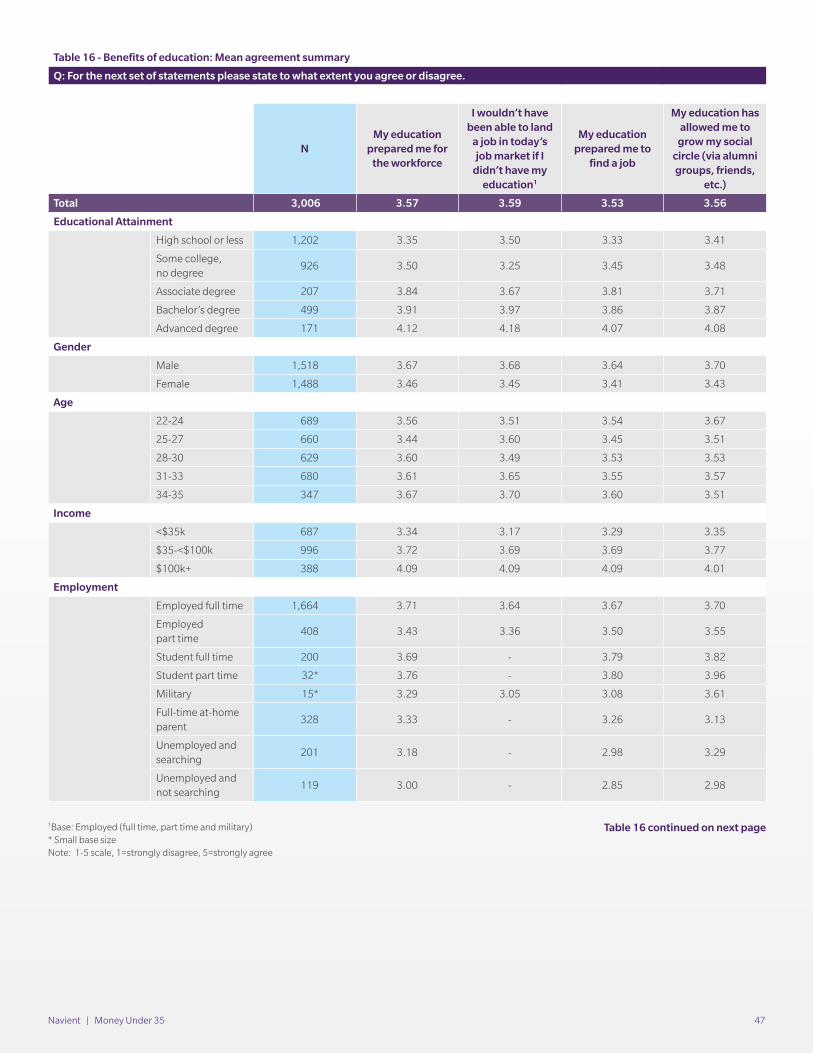
Navient | Money Under 35 47
Table 16 - Benefits of education: Mean agreement summary
Q: For the next set of statements please state to what extent you agree or disagree.
NMy education
prepared me for the workforce
I wouldn’t have been able to land
a job in today’s job market if I
didn’t have my education1
My education prepared me to
find a job
My education has allowed me to
grow my social circle (via alumni groups, friends,
etc.)
Total 3,006 3.57 3.59 3.53 3.56
Educational Attainment
High school or less 1,202 3.35 3.50 3.33 3.41
Some college, no degree
926 3.50 3.25 3.45 3.48
Associate degree 207 3.84 3.67 3.81 3.71
Bachelor’s degree 499 3.91 3.97 3.86 3.87
Advanced degree 171 4.12 4.18 4.07 4.08
Gender
Male 1,518 3.67 3.68 3.64 3.70
Female 1,488 3.46 3.45 3.41 3.43
Age
22-24 689 3.56 3.51 3.54 3.67
25-27 660 3.44 3.60 3.45 3.51
28-30 629 3.60 3.49 3.53 3.53
31-33 680 3.61 3.65 3.55 3.57
34-35 347 3.67 3.70 3.60 3.51
Income
<$35k 687 3.34 3.17 3.29 3.35
$35-<$100k 996 3.72 3.69 3.69 3.77
$100k+ 388 4.09 4.09 4.09 4.01
Employment
Employed full time 1,664 3.71 3.64 3.67 3.70
Employed part time
408 3.43 3.36 3.50 3.55
Student full time 200 3.69 - 3.79 3.82
Student part time 32* 3.76 - 3.80 3.96
Military 15* 3.29 3.05 3.08 3.61
Full-time at-home parent
328 3.33 - 3.26 3.13
Unemployed and searching
201 3.18 - 2.98 3.29
Unemployed and not searching
119 3.00 - 2.85 2.98
1Base: Employed (full time, part time and military)* Small base sizeNote: 1-5 scale, 1=strongly disagree, 5=strongly agree
Table 16 continued on next page
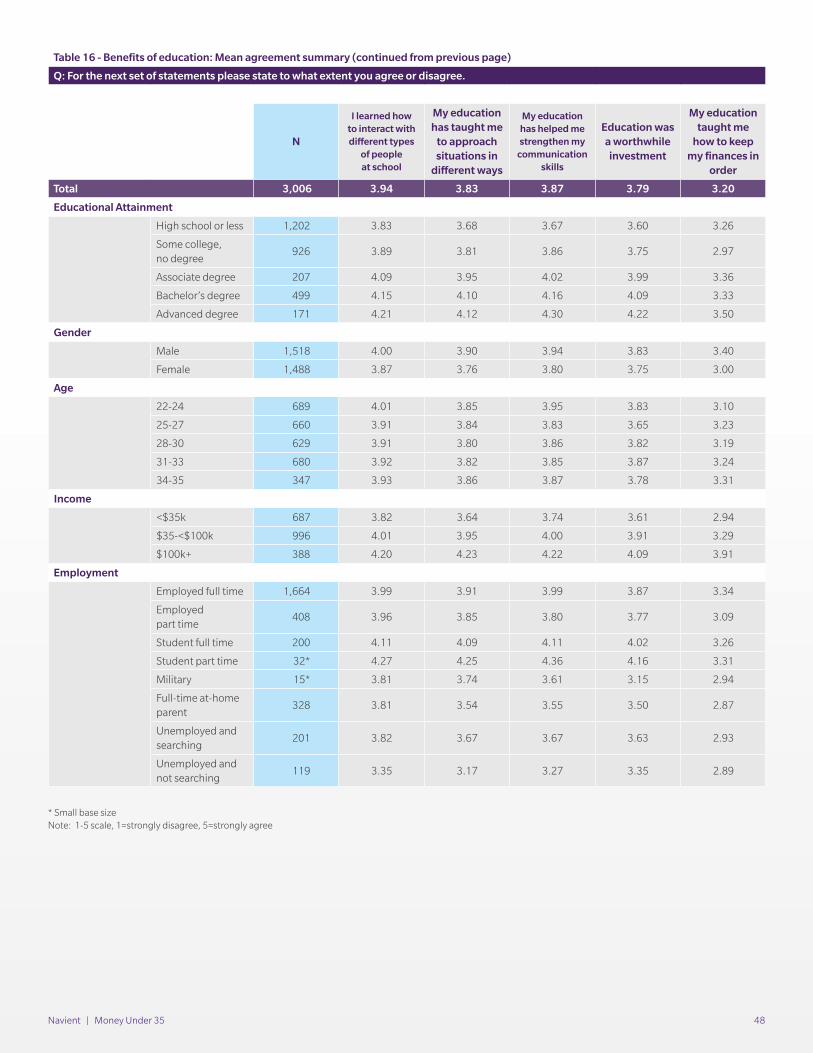
Navient | Money Under 35 48
Table 16 - Benefits of education: Mean agreement summary (continued from previous page)
Q: For the next set of statements please state to what extent you agree or disagree.
N
I learned how to interact with different types
of people at school
My education has taught me
to approach situations in
different ways
My education has helped me strengthen my
communication skills
Education was a worthwhile
investment
My education taught me
how to keep my finances in
order
Total 3,006 3.94 3.83 3.87 3.79 3.20
Educational Attainment
High school or less 1,202 3.83 3.68 3.67 3.60 3.26
Some college, no degree
926 3.89 3.81 3.86 3.75 2.97
Associate degree 207 4.09 3.95 4.02 3.99 3.36
Bachelor’s degree 499 4.15 4.10 4.16 4.09 3.33
Advanced degree 171 4.21 4.12 4.30 4.22 3.50
Gender
Male 1,518 4.00 3.90 3.94 3.83 3.40
Female 1,488 3.87 3.76 3.80 3.75 3.00
Age
22-24 689 4.01 3.85 3.95 3.83 3.10
25-27 660 3.91 3.84 3.83 3.65 3.23
28-30 629 3.91 3.80 3.86 3.82 3.19
31-33 680 3.92 3.82 3.85 3.87 3.24
34-35 347 3.93 3.86 3.87 3.78 3.31
Income
<$35k 687 3.82 3.64 3.74 3.61 2.94
$35-<$100k 996 4.01 3.95 4.00 3.91 3.29
$100k+ 388 4.20 4.23 4.22 4.09 3.91
Employment
Employed full time 1,664 3.99 3.91 3.99 3.87 3.34
Employed part time
408 3.96 3.85 3.80 3.77 3.09
Student full time 200 4.11 4.09 4.11 4.02 3.26
Student part time 32* 4.27 4.25 4.36 4.16 3.31
Military 15* 3.81 3.74 3.61 3.15 2.94
Full-time at-home parent
328 3.81 3.54 3.55 3.50 2.87
Unemployed and searching
201 3.82 3.67 3.67 3.63 2.93
Unemployed and not searching
119 3.35 3.17 3.27 3.35 2.89
* Small base sizeNote: 1-5 scale, 1=strongly disagree, 5=strongly agree
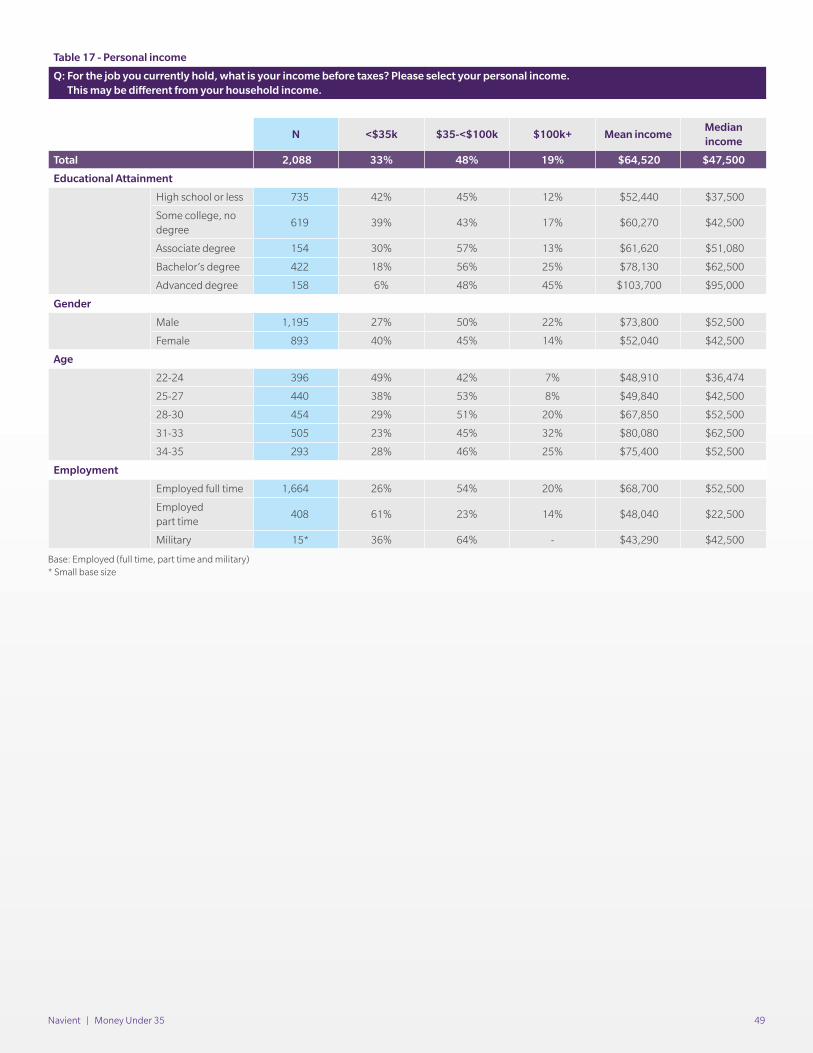
Navient | Money Under 35 49
Table 17 - Personal income
Q: For the job you currently hold, what is your income before taxes? Please select your personal income. This may be different from your household income.
N <$35k $35-<$100k $100k+ Mean incomeMedian income
Total 2,088 33% 48% 19% $64,520 $47,500
Educational Attainment
High school or less 735 42% 45% 12% $52,440 $37,500
Some college, no degree
619 39% 43% 17% $60,270 $42,500
Associate degree 154 30% 57% 13% $61,620 $51,080
Bachelor’s degree 422 18% 56% 25% $78,130 $62,500
Advanced degree 158 6% 48% 45% $103,700 $95,000
Gender
Male 1,195 27% 50% 22% $73,800 $52,500
Female 893 40% 45% 14% $52,040 $42,500
Age
22-24 396 49% 42% 7% $48,910 $36,474
25-27 440 38% 53% 8% $49,840 $42,500
28-30 454 29% 51% 20% $67,850 $52,500
31-33 505 23% 45% 32% $80,080 $62,500
34-35 293 28% 46% 25% $75,400 $52,500
Employment
Employed full time 1,664 26% 54% 20% $68,700 $52,500
Employed part time
408 61% 23% 14% $48,040 $22,500
Military 15* 36% 64% - $43,290 $42,500
Base: Employed (full time, part time and military)* Small base size
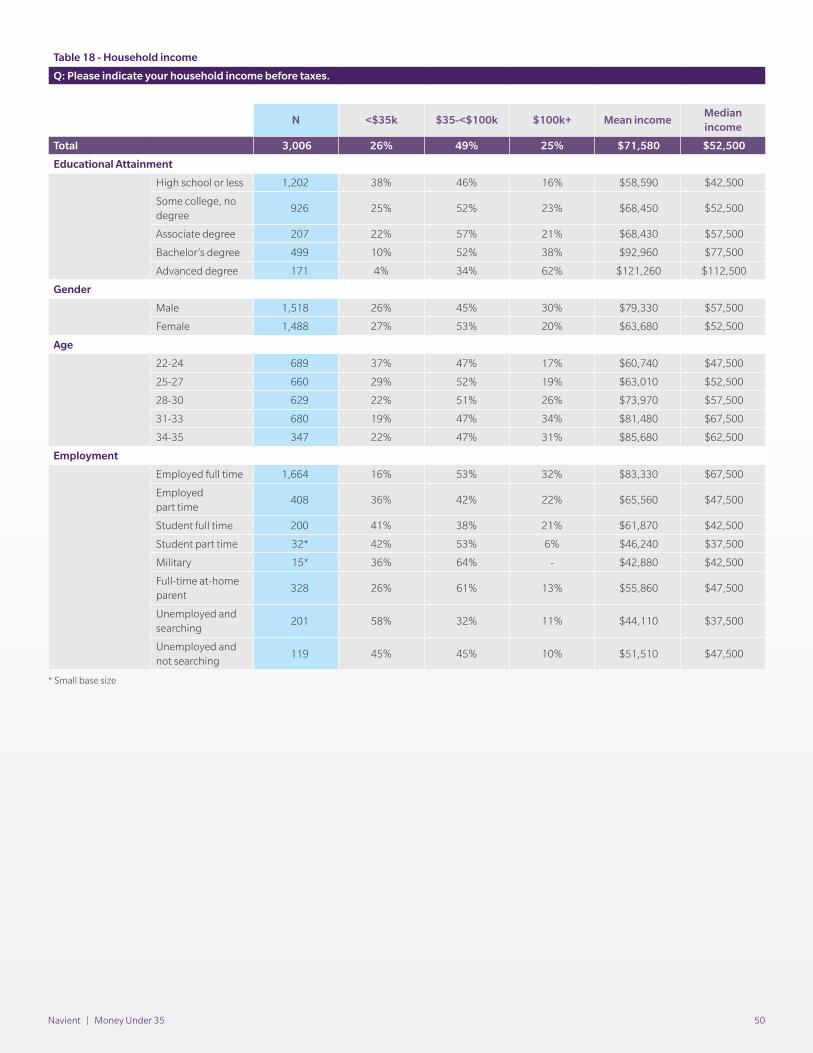
Navient | Money Under 35 50
Table 18 - Household income
Q: Please indicate your household income before taxes.
N <$35k $35-<$100k $100k+ Mean incomeMedian income
Total 3,006 26% 49% 25% $71,580 $52,500
Educational Attainment
High school or less 1,202 38% 46% 16% $58,590 $42,500
Some college, no degree
926 25% 52% 23% $68,450 $52,500
Associate degree 207 22% 57% 21% $68,430 $57,500
Bachelor’s degree 499 10% 52% 38% $92,960 $77,500
Advanced degree 171 4% 34% 62% $121,260 $112,500
Gender
Male 1,518 26% 45% 30% $79,330 $57,500
Female 1,488 27% 53% 20% $63,680 $52,500
Age
22-24 689 37% 47% 17% $60,740 $47,500
25-27 660 29% 52% 19% $63,010 $52,500
28-30 629 22% 51% 26% $73,970 $57,500
31-33 680 19% 47% 34% $81,480 $67,500
34-35 347 22% 47% 31% $85,680 $62,500
Employment
Employed full time 1,664 16% 53% 32% $83,330 $67,500
Employed part time
408 36% 42% 22% $65,560 $47,500
Student full time 200 41% 38% 21% $61,870 $42,500
Student part time 32* 42% 53% 6% $46,240 $37,500
Military 15* 36% 64% - $42,880 $42,500
Full-time at-home parent
328 26% 61% 13% $55,860 $47,500
Unemployed and searching
201 58% 32% 11% $44,110 $37,500
Unemployed and not searching
119 45% 45% 10% $51,510 $47,500
* Small base size
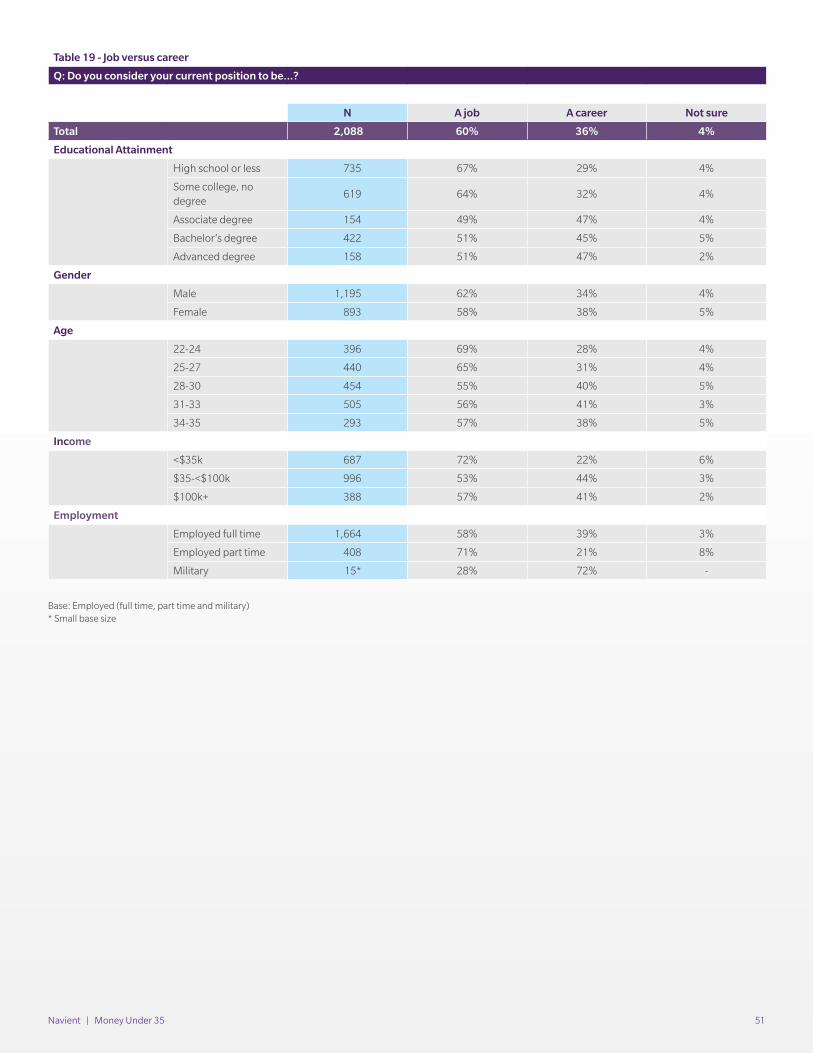
Navient | Money Under 35 51
Table 19 - Job versus career
Q: Do you consider your current position to be...?
N A job A career Not sure
Total 2,088 60% 36% 4%
Educational Attainment
High school or less 735 67% 29% 4%
Some college, no degree
619 64% 32% 4%
Associate degree 154 49% 47% 4%
Bachelor’s degree 422 51% 45% 5%
Advanced degree 158 51% 47% 2%
Gender
Male 1,195 62% 34% 4%
Female 893 58% 38% 5%
Age
22-24 396 69% 28% 4%
25-27 440 65% 31% 4%
28-30 454 55% 40% 5%
31-33 505 56% 41% 3%
34-35 293 57% 38% 5%
Income
<$35k 687 72% 22% 6%
$35-<$100k 996 53% 44% 3%
$100k+ 388 57% 41% 2%
Employment
Employed full time 1,664 58% 39% 3%
Employed part time 408 71% 21% 8%
Military 15* 28% 72% -
Base: Employed (full time, part time and military)* Small base size

Navient | Money Under 35 52
Table 20 - Working in field of study
Q: Is your job in the field studied in school?
N Yes No
Total 2,088 45% 55%
Educational Attainment
High school or less 735 29% 71%
Some college, no degree
619 38% 62%
Associate degree 154 58% 43%
Bachelor’s degree 422 64% 36%
Advanced degree 158 79% 21%
Gender
Male 1,195 47% 53%
Female 893 41% 59%
Age
22-24 396 39% 61%
25-27 440 46% 54%
28-30 454 46% 55%
31-33 505 49% 51%
34-35 293 42% 58%
Income
<$35k 687 24% 76%
$35-<$100k 996 51% 49%
$100k+ 388 66% 34%
Employment
Employed full time 1,664 47% 53%
Employed part time 408 35% 65%
Military 15* 24% 76%
Base: Employed (full time, part time and military)* Small base size
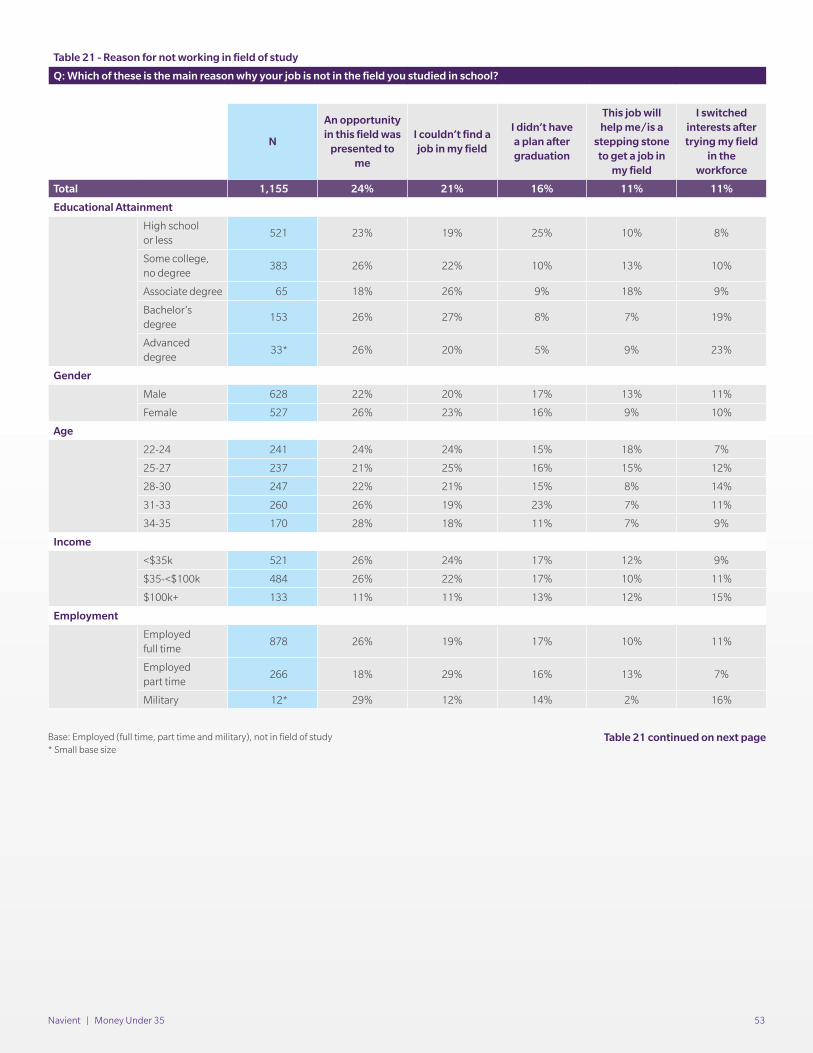
Navient | Money Under 35 53
Table 21 - Reason for not working in field of study
Q: Which of these is the main reason why your job is not in the field you studied in school?
N
An opportunity in this field was
presented to me
I couldn’t find a job in my field
I didn’t have a plan after graduation
This job will help me/is a
stepping stone to get a job in
my field
I switched interests after trying my field
in the workforce
Total 1,155 24% 21% 16% 11% 11%
Educational Attainment
High school or less
521 23% 19% 25% 10% 8%
Some college, no degree
383 26% 22% 10% 13% 10%
Associate degree 65 18% 26% 9% 18% 9%
Bachelor’s degree
153 26% 27% 8% 7% 19%
Advanced degree
33* 26% 20% 5% 9% 23%
Gender
Male 628 22% 20% 17% 13% 11%
Female 527 26% 23% 16% 9% 10%
Age
22-24 241 24% 24% 15% 18% 7%
25-27 237 21% 25% 16% 15% 12%
28-30 247 22% 21% 15% 8% 14%
31-33 260 26% 19% 23% 7% 11%
34-35 170 28% 18% 11% 7% 9%
Income
<$35k 521 26% 24% 17% 12% 9%
$35-<$100k 484 26% 22% 17% 10% 11%
$100k+ 133 11% 11% 13% 12% 15%
Employment
Employed full time
878 26% 19% 17% 10% 11%
Employed part time
266 18% 29% 16% 13% 7%
Military 12* 29% 12% 14% 2% 16%
Base: Employed (full time, part time and military), not in field of study* Small base size
Table 21 continued on next page
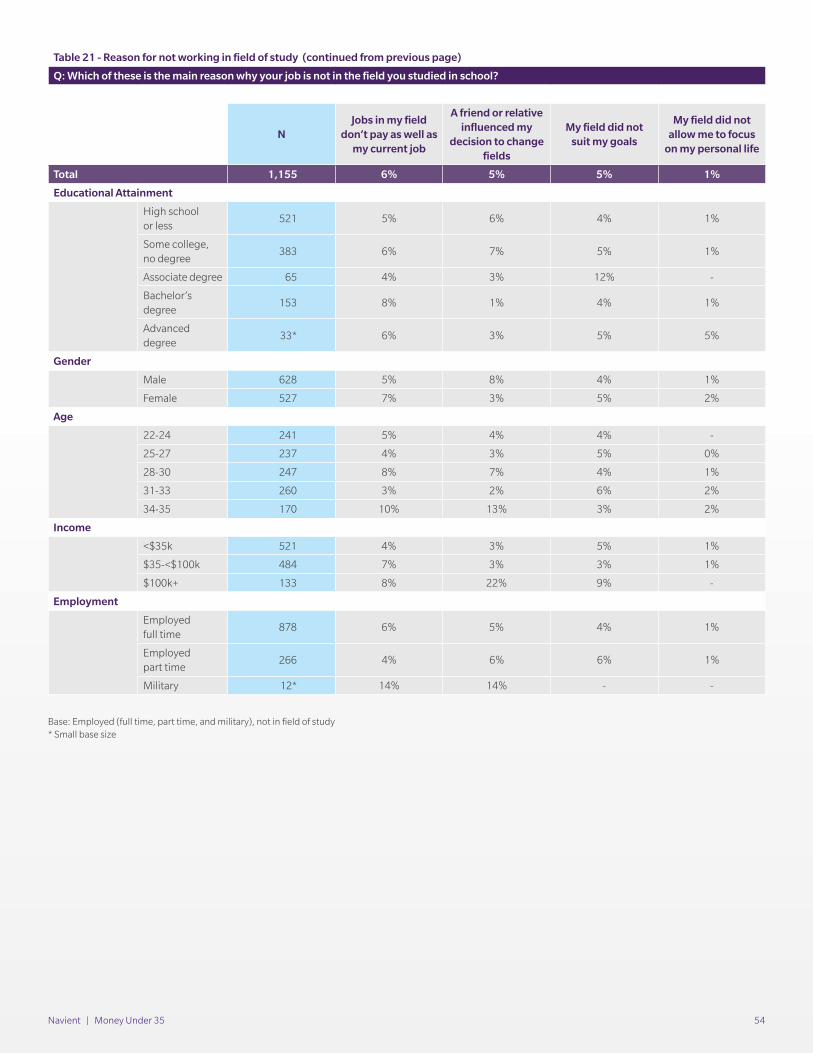
Navient | Money Under 35 54
Table 21 - Reason for not working in field of study (continued from previous page)
Q: Which of these is the main reason why your job is not in the field you studied in school?
NJobs in my field
don’t pay as well as my current job
A friend or relative influenced my
decision to change fields
My field did not suit my goals
My field did not allow me to focus
on my personal life
Total 1,155 6% 5% 5% 1%
Educational Attainment
High school or less
521 5% 6% 4% 1%
Some college, no degree
383 6% 7% 5% 1%
Associate degree 65 4% 3% 12% -
Bachelor’s degree
153 8% 1% 4% 1%
Advanced degree
33* 6% 3% 5% 5%
Gender
Male 628 5% 8% 4% 1%
Female 527 7% 3% 5% 2%
Age
22-24 241 5% 4% 4% -
25-27 237 4% 3% 5% 0%
28-30 247 8% 7% 4% 1%
31-33 260 3% 2% 6% 2%
34-35 170 10% 13% 3% 2%
Income
<$35k 521 4% 3% 5% 1%
$35-<$100k 484 7% 3% 3% 1%
$100k+ 133 8% 22% 9% -
Employment
Employed full time
878 6% 5% 4% 1%
Employed part time
266 4% 6% 6% 1%
Military 12* 14% 14% - -
Base: Employed (full time, part time, and military), not in field of study* Small base size
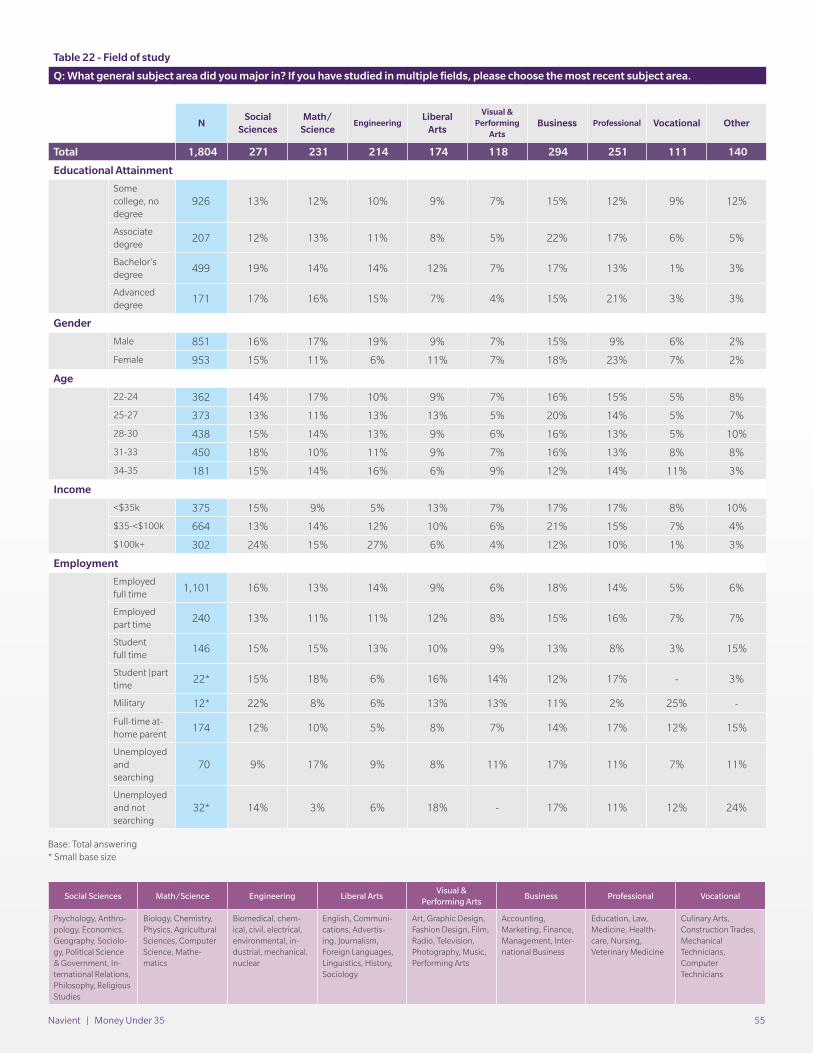
Navient | Money Under 35 55
Table 22 - Field of study
Q: What general subject area did you major in? If you have studied in multiple fields, please choose the most recent subject area.
NSocial
SciencesMath/
ScienceEngineering
Liberal Arts
Visual & Performing
ArtsBusiness Professional Vocational Other
Total 1,804 271 231 214 174 118 294 251 111 140
Educational Attainment
Some college, no degree
926 13% 12% 10% 9% 7% 15% 12% 9% 12%
Associate degree
207 12% 13% 11% 8% 5% 22% 17% 6% 5%
Bachelor’s degree
499 19% 14% 14% 12% 7% 17% 13% 1% 3%
Advanced degree
171 17% 16% 15% 7% 4% 15% 21% 3% 3%
Gender
Male 851 16% 17% 19% 9% 7% 15% 9% 6% 2%
Female 953 15% 11% 6% 11% 7% 18% 23% 7% 2%
Age
22-24 362 14% 17% 10% 9% 7% 16% 15% 5% 8%
25-27 373 13% 11% 13% 13% 5% 20% 14% 5% 7%
28-30 438 15% 14% 13% 9% 6% 16% 13% 5% 10%
31-33 450 18% 10% 11% 9% 7% 16% 13% 8% 8%
34-35 181 15% 14% 16% 6% 9% 12% 14% 11% 3%
Income
<$35k 375 15% 9% 5% 13% 7% 17% 17% 8% 10%
$35-<$100k 664 13% 14% 12% 10% 6% 21% 15% 7% 4%
$100k+ 302 24% 15% 27% 6% 4% 12% 10% 1% 3%
Employment
Employed full time
1,101 16% 13% 14% 9% 6% 18% 14% 5% 6%
Employed part time
240 13% 11% 11% 12% 8% 15% 16% 7% 7%
Student full time
146 15% 15% 13% 10% 9% 13% 8% 3% 15%
Student |part time
22* 15% 18% 6% 16% 14% 12% 17% - 3%
Military 12* 22% 8% 6% 13% 13% 11% 2% 25% -
Full-time at-home parent
174 12% 10% 5% 8% 7% 14% 17% 12% 15%
Unemployed and searching
70 9% 17% 9% 8% 11% 17% 11% 7% 11%
Unemployed and not searching
32* 14% 3% 6% 18% - 17% 11% 12% 24%
Base: Total answering* Small base size
Social Sciences Math/Science Engineering Liberal ArtsVisual &
Performing ArtsBusiness Professional Vocational
Psychology, Anthro-pology, Economics, Geography, Sociolo-gy, Political Science & Government, In-ternational Relations, Philosophy, Religious Studies
Biology, Chemistry, Physics, Agricultural Sciences, Computer Science, Mathe-matics
Biomedical, chem-ical, civil, electrical, environmental, in-dustrial, mechanical, nuclear
English, Communi-cations, Advertis-ing, Journalism, Foreign Languages, Linguistics, History, Sociology
Art, Graphic Design, Fashion Design, Film, Radio, Television, Photography, Music, Performing Arts
Accounting, Marketing, Finance, Management, Inter-national Business
Education, Law, Medicine, Health-care, Nursing, Veterinary Medicine
Culinary Arts, Construction Trades, Mechanical Technicians, Computer Technicians
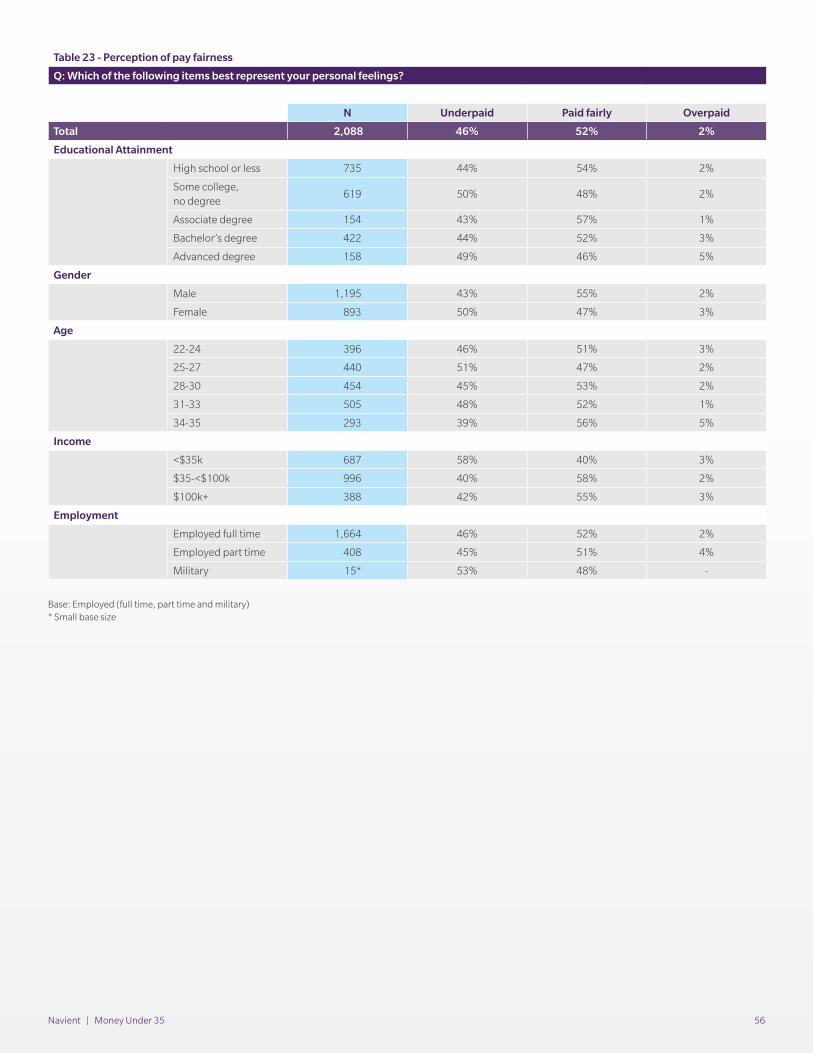
Navient | Money Under 35 56
Table 23 - Perception of pay fairness
Q: Which of the following items best represent your personal feelings?
N Underpaid Paid fairly Overpaid
Total 2,088 46% 52% 2%
Educational Attainment
High school or less 735 44% 54% 2%
Some college, no degree
619 50% 48% 2%
Associate degree 154 43% 57% 1%
Bachelor’s degree 422 44% 52% 3%
Advanced degree 158 49% 46% 5%
Gender
Male 1,195 43% 55% 2%
Female 893 50% 47% 3%
Age
22-24 396 46% 51% 3%
25-27 440 51% 47% 2%
28-30 454 45% 53% 2%
31-33 505 48% 52% 1%
34-35 293 39% 56% 5%
Income
<$35k 687 58% 40% 3%
$35-<$100k 996 40% 58% 2%
$100k+ 388 42% 55% 3%
Employment
Employed full time 1,664 46% 52% 2%
Employed part time 408 45% 51% 4%
Military 15* 53% 48% -
Base: Employed (full time, part time and military)* Small base size
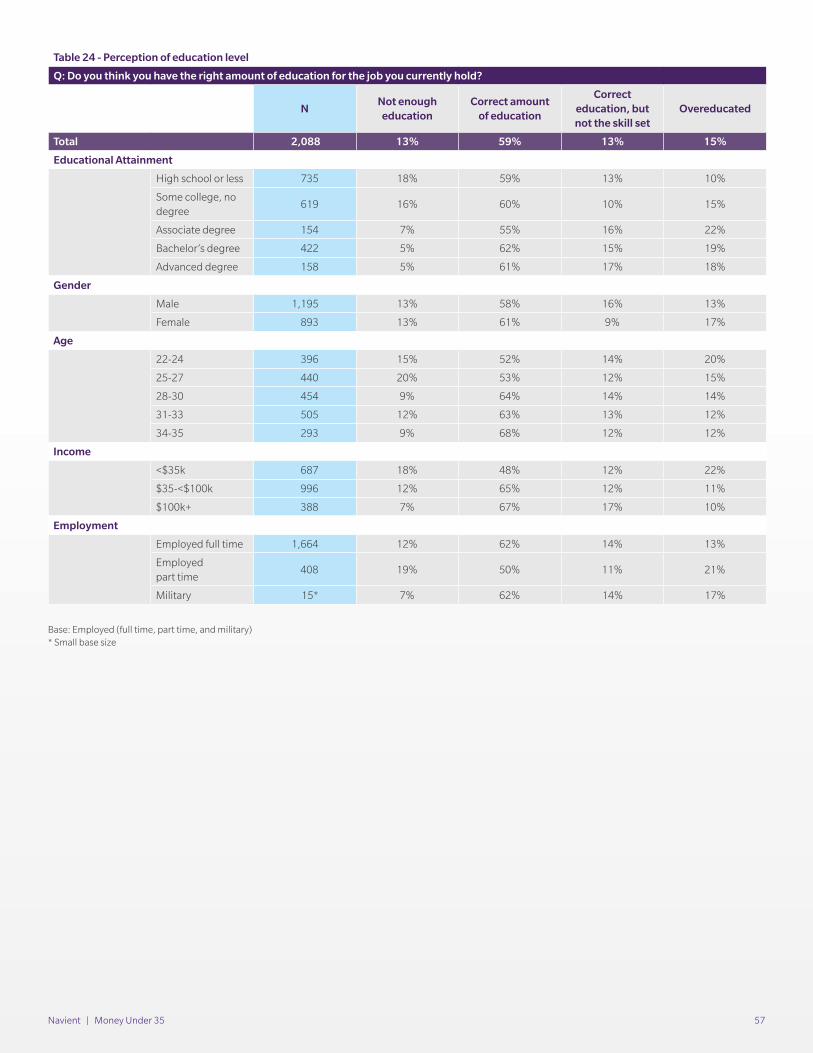
Navient | Money Under 35 57
Table 24 - Perception of education level
Q: Do you think you have the right amount of education for the job you currently hold?
NNot enough
educationCorrect amount
of education
Correct education, but not the skill set
Overeducated
Total 2,088 13% 59% 13% 15%
Educational Attainment
High school or less 735 18% 59% 13% 10%
Some college, no degree
619 16% 60% 10% 15%
Associate degree 154 7% 55% 16% 22%
Bachelor’s degree 422 5% 62% 15% 19%
Advanced degree 158 5% 61% 17% 18%
Gender
Male 1,195 13% 58% 16% 13%
Female 893 13% 61% 9% 17%
Age
22-24 396 15% 52% 14% 20%
25-27 440 20% 53% 12% 15%
28-30 454 9% 64% 14% 14%
31-33 505 12% 63% 13% 12%
34-35 293 9% 68% 12% 12%
Income
<$35k 687 18% 48% 12% 22%
$35-<$100k 996 12% 65% 12% 11%
$100k+ 388 7% 67% 17% 10%
Employment
Employed full time 1,664 12% 62% 14% 13%
Employed part time
408 19% 50% 11% 21%
Military 15* 7% 62% 14% 17%
Base: Employed (full time, part time, and military)* Small base size
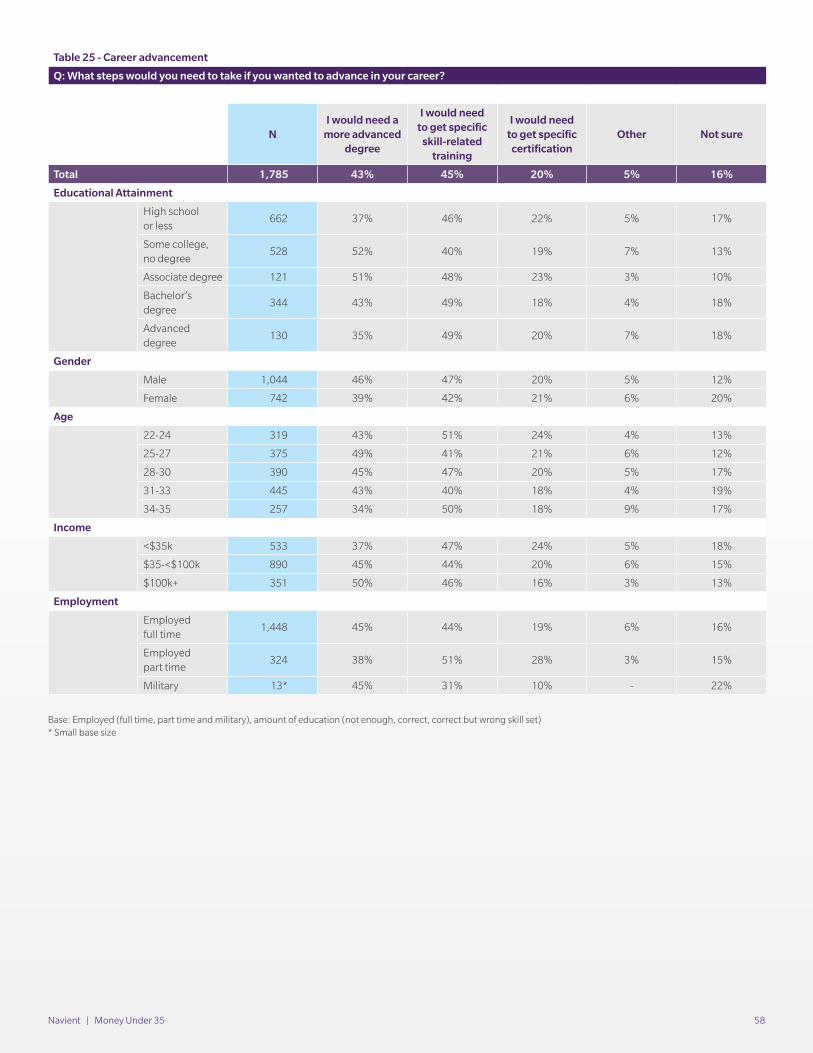
Navient | Money Under 35 58
Table 25 - Career advancement
Q: What steps would you need to take if you wanted to advance in your career?
NI would need a
more advanced degree
I would need to get specific
skill-related training
I would need to get specific
certificationOther Not sure
Total 1,785 43% 45% 20% 5% 16%
Educational Attainment
High school or less
662 37% 46% 22% 5% 17%
Some college, no degree
528 52% 40% 19% 7% 13%
Associate degree 121 51% 48% 23% 3% 10%
Bachelor’s degree
344 43% 49% 18% 4% 18%
Advanced degree
130 35% 49% 20% 7% 18%
Gender
Male 1,044 46% 47% 20% 5% 12%
Female 742 39% 42% 21% 6% 20%
Age
22-24 319 43% 51% 24% 4% 13%
25-27 375 49% 41% 21% 6% 12%
28-30 390 45% 47% 20% 5% 17%
31-33 445 43% 40% 18% 4% 19%
34-35 257 34% 50% 18% 9% 17%
Income
<$35k 533 37% 47% 24% 5% 18%
$35-<$100k 890 45% 44% 20% 6% 15%
$100k+ 351 50% 46% 16% 3% 13%
Employment
Employed full time
1,448 45% 44% 19% 6% 16%
Employed part time
324 38% 51% 28% 3% 15%
Military 13* 45% 31% 10% - 22%
Base: Employed (full time, part time and military), amount of education (not enough, correct, correct but wrong skill set)* Small base size
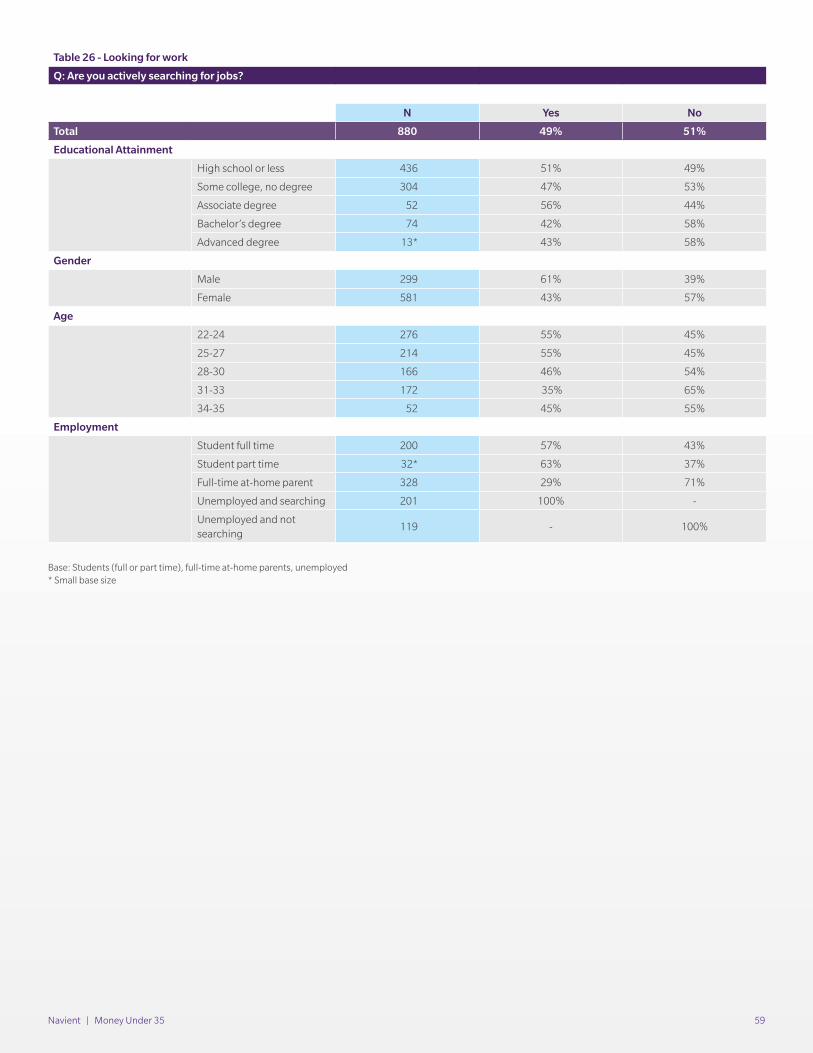
Navient | Money Under 35 59
Table 26 - Looking for work
Q: Are you actively searching for jobs?
N Yes No
Total 880 49% 51%
Educational Attainment
High school or less 436 51% 49%
Some college, no degree 304 47% 53%
Associate degree 52 56% 44%
Bachelor’s degree 74 42% 58%
Advanced degree 13* 43% 58%
Gender
Male 299 61% 39%
Female 581 43% 57%
Age
22-24 276 55% 45%
25-27 214 55% 45%
28-30 166 46% 54%
31-33 172 35% 65%
34-35 52 45% 55%
Employment
Student full time 200 57% 43%
Student part time 32* 63% 37%
Full-time at-home parent 328 29% 71%
Unemployed and searching 201 100% -
Unemployed and not searching
119 - 100%
Base: Students (full or part time), full-time at-home parents, unemployed* Small base size
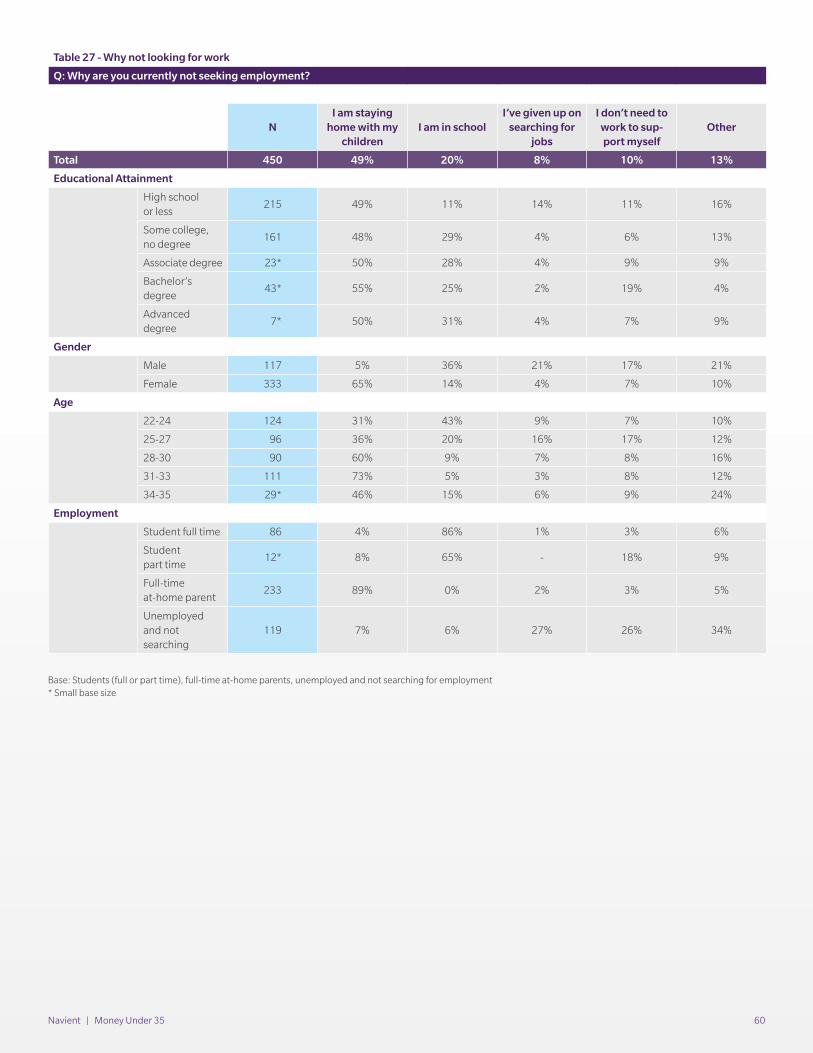
Navient | Money Under 35 60
Table 27 - Why not looking for work
Q: Why are you currently not seeking employment?
NI am staying
home with my children
I am in schoolI’ve given up on
searching for jobs
I don’t need to work to sup-port myself
Other
Total 450 49% 20% 8% 10% 13%
Educational Attainment
High school or less
215 49% 11% 14% 11% 16%
Some college, no degree
161 48% 29% 4% 6% 13%
Associate degree 23* 50% 28% 4% 9% 9%
Bachelor’s degree
43* 55% 25% 2% 19% 4%
Advanced degree
7* 50% 31% 4% 7% 9%
Gender
Male 117 5% 36% 21% 17% 21%
Female 333 65% 14% 4% 7% 10%
Age
22-24 124 31% 43% 9% 7% 10%
25-27 96 36% 20% 16% 17% 12%
28-30 90 60% 9% 7% 8% 16%
31-33 111 73% 5% 3% 8% 12%
34-35 29* 46% 15% 6% 9% 24%
Employment
Student full time 86 4% 86% 1% 3% 6%
Student part time
12* 8% 65% - 18% 9%
Full-time at-home parent
233 89% 0% 2% 3% 5%
Unemployed and not searching
119 7% 6% 27% 26% 34%
Base: Students (full or part time), full-time at-home parents, unemployed and not searching for employment* Small base size
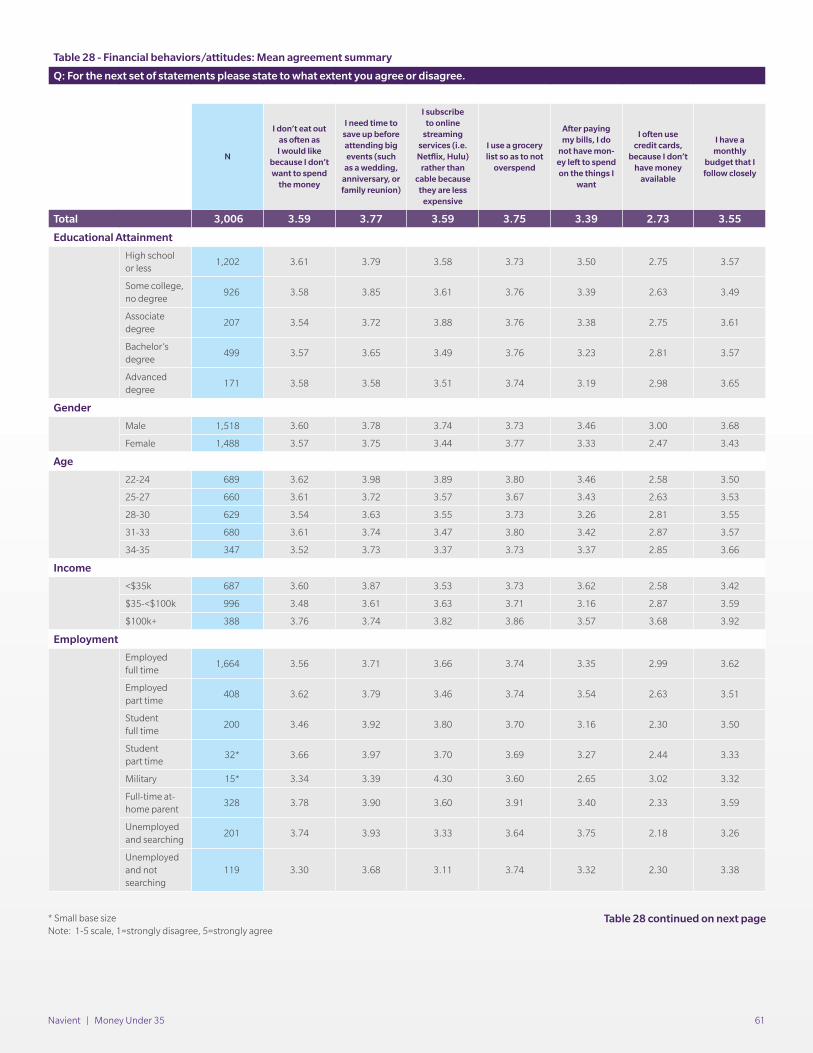
Navient | Money Under 35 61
Table 28 - Financial behaviors/attitudes: Mean agreement summary
Q: For the next set of statements please state to what extent you agree or disagree.
N
I don’t eat out as often as I would like
because I don’t want to spend
the money
I need time to save up before attending big events (such
as a wedding, anniversary, or family reunion)
I subscribe to online
streaming services (i.e.
Netflix, Hulu) rather than
cable because they are less
expensive
I use a grocery list so as to not
overspend
After paying my bills, I do
not have mon-ey left to spend on the things I
want
I often use credit cards,
because I don’t have money
available
I have a monthly
budget that I follow closely
Total 3,006 3.59 3.77 3.59 3.75 3.39 2.73 3.55
Educational Attainment
High school or less
1,202 3.61 3.79 3.58 3.73 3.50 2.75 3.57
Some college, no degree
926 3.58 3.85 3.61 3.76 3.39 2.63 3.49
Associate degree
207 3.54 3.72 3.88 3.76 3.38 2.75 3.61
Bachelor’s degree
499 3.57 3.65 3.49 3.76 3.23 2.81 3.57
Advanced degree
171 3.58 3.58 3.51 3.74 3.19 2.98 3.65
Gender
Male 1,518 3.60 3.78 3.74 3.73 3.46 3.00 3.68
Female 1,488 3.57 3.75 3.44 3.77 3.33 2.47 3.43
Age
22-24 689 3.62 3.98 3.89 3.80 3.46 2.58 3.50
25-27 660 3.61 3.72 3.57 3.67 3.43 2.63 3.53
28-30 629 3.54 3.63 3.55 3.73 3.26 2.81 3.55
31-33 680 3.61 3.74 3.47 3.80 3.42 2.87 3.57
34-35 347 3.52 3.73 3.37 3.73 3.37 2.85 3.66
Income
<$35k 687 3.60 3.87 3.53 3.73 3.62 2.58 3.42
$35-<$100k 996 3.48 3.61 3.63 3.71 3.16 2.87 3.59
$100k+ 388 3.76 3.74 3.82 3.86 3.57 3.68 3.92
Employment
Employed full time
1,664 3.56 3.71 3.66 3.74 3.35 2.99 3.62
Employed part time
408 3.62 3.79 3.46 3.74 3.54 2.63 3.51
Student full time
200 3.46 3.92 3.80 3.70 3.16 2.30 3.50
Student part time
32* 3.66 3.97 3.70 3.69 3.27 2.44 3.33
Military 15* 3.34 3.39 4.30 3.60 2.65 3.02 3.32
Full-time at-home parent
328 3.78 3.90 3.60 3.91 3.40 2.33 3.59
Unemployed and searching
201 3.74 3.93 3.33 3.64 3.75 2.18 3.26
Unemployed and not searching
119 3.30 3.68 3.11 3.74 3.32 2.30 3.38
* Small base sizeNote: 1-5 scale, 1=strongly disagree, 5=strongly agree
Table 28 continued on next page
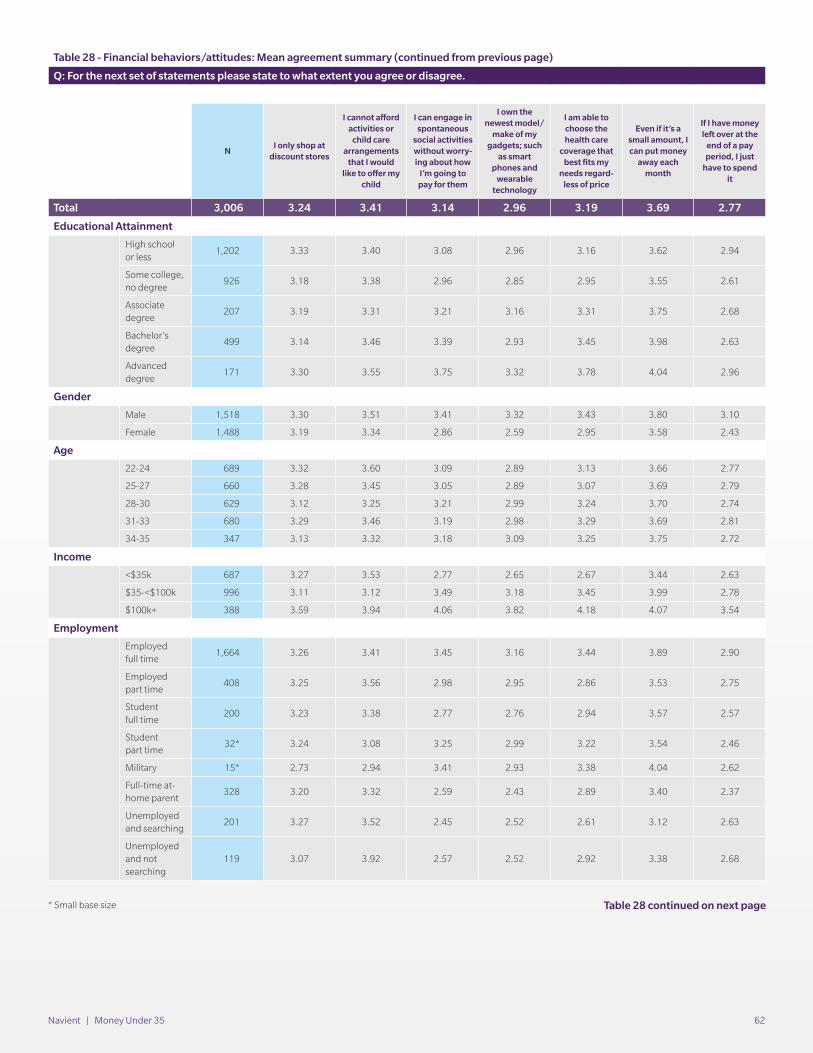
Navient | Money Under 35 62
Table 28 - Financial behaviors/attitudes: Mean agreement summary (continued from previous page)
Q: For the next set of statements please state to what extent you agree or disagree.
NI only shop at
discount stores
I cannot afford activities or
child care arrangements
that I would like to offer my
child
I can engage in spontaneous
social activities without worry-ing about how
I’m going to pay for them
I own the newest model/
make of my gadgets; such
as smart phones and
wearable technology
I am able to choose the health care
coverage that best fits my
needs regard-less of price
Even if it’s a small amount, I can put money
away each month
If I have money left over at the
end of a pay period, I just
have to spend it
Total 3,006 3.24 3.41 3.14 2.96 3.19 3.69 2.77
Educational Attainment
High school or less
1,202 3.33 3.40 3.08 2.96 3.16 3.62 2.94
Some college, no degree
926 3.18 3.38 2.96 2.85 2.95 3.55 2.61
Associate degree
207 3.19 3.31 3.21 3.16 3.31 3.75 2.68
Bachelor’s degree
499 3.14 3.46 3.39 2.93 3.45 3.98 2.63
Advanced degree
171 3.30 3.55 3.75 3.32 3.78 4.04 2.96
Gender
Male 1,518 3.30 3.51 3.41 3.32 3.43 3.80 3.10
Female 1,488 3.19 3.34 2.86 2.59 2.95 3.58 2.43
Age
22-24 689 3.32 3.60 3.09 2.89 3.13 3.66 2.77
25-27 660 3.28 3.45 3.05 2.89 3.07 3.69 2.79
28-30 629 3.12 3.25 3.21 2.99 3.24 3.70 2.74
31-33 680 3.29 3.46 3.19 2.98 3.29 3.69 2.81
34-35 347 3.13 3.32 3.18 3.09 3.25 3.75 2.72
Income
<$35k 687 3.27 3.53 2.77 2.65 2.67 3.44 2.63
$35-<$100k 996 3.11 3.12 3.49 3.18 3.45 3.99 2.78
$100k+ 388 3.59 3.94 4.06 3.82 4.18 4.07 3.54
Employment
Employed full time
1,664 3.26 3.41 3.45 3.16 3.44 3.89 2.90
Employed part time
408 3.25 3.56 2.98 2.95 2.86 3.53 2.75
Student full time
200 3.23 3.38 2.77 2.76 2.94 3.57 2.57
Student part time
32* 3.24 3.08 3.25 2.99 3.22 3.54 2.46
Military 15* 2.73 2.94 3.41 2.93 3.38 4.04 2.62
Full-time at-home parent
328 3.20 3.32 2.59 2.43 2.89 3.40 2.37
Unemployed and searching
201 3.27 3.52 2.45 2.52 2.61 3.12 2.63
Unemployed and not searching
119 3.07 3.92 2.57 2.52 2.92 3.38 2.68
* Small base size Table 28 continued on next page
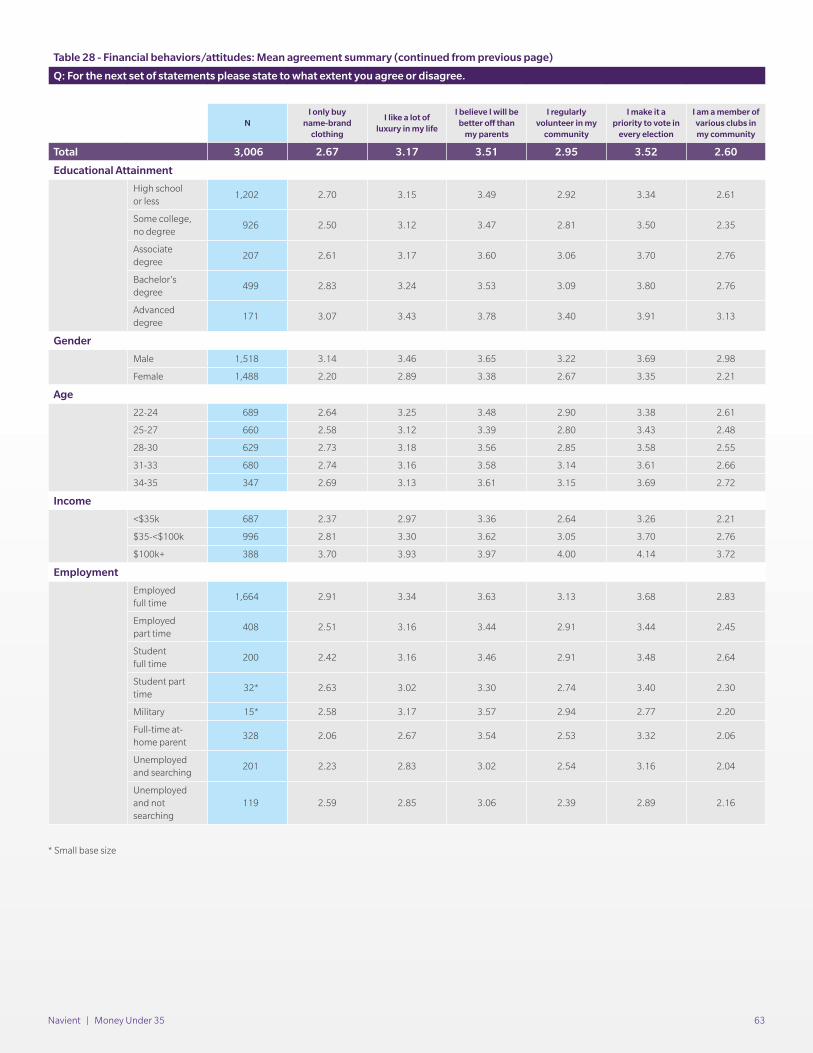
Navient | Money Under 35 63
Table 28 - Financial behaviors/attitudes: Mean agreement summary (continued from previous page)
Q: For the next set of statements please state to what extent you agree or disagree.
NI only buy
name-brand clothing
I like a lot of luxury in my life
I believe I will be better off than
my parents
I regularly volunteer in my
community
I make it a priority to vote in
every election
I am a member of various clubs in my community
Total 3,006 2.67 3.17 3.51 2.95 3.52 2.60
Educational Attainment
High school or less
1,202 2.70 3.15 3.49 2.92 3.34 2.61
Some college, no degree
926 2.50 3.12 3.47 2.81 3.50 2.35
Associate degree
207 2.61 3.17 3.60 3.06 3.70 2.76
Bachelor’s degree
499 2.83 3.24 3.53 3.09 3.80 2.76
Advanced degree
171 3.07 3.43 3.78 3.40 3.91 3.13
Gender
Male 1,518 3.14 3.46 3.65 3.22 3.69 2.98
Female 1,488 2.20 2.89 3.38 2.67 3.35 2.21
Age
22-24 689 2.64 3.25 3.48 2.90 3.38 2.61
25-27 660 2.58 3.12 3.39 2.80 3.43 2.48
28-30 629 2.73 3.18 3.56 2.85 3.58 2.55
31-33 680 2.74 3.16 3.58 3.14 3.61 2.66
34-35 347 2.69 3.13 3.61 3.15 3.69 2.72
Income
<$35k 687 2.37 2.97 3.36 2.64 3.26 2.21
$35-<$100k 996 2.81 3.30 3.62 3.05 3.70 2.76
$100k+ 388 3.70 3.93 3.97 4.00 4.14 3.72
Employment
Employed full time
1,664 2.91 3.34 3.63 3.13 3.68 2.83
Employed part time
408 2.51 3.16 3.44 2.91 3.44 2.45
Student full time
200 2.42 3.16 3.46 2.91 3.48 2.64
Student part time
32* 2.63 3.02 3.30 2.74 3.40 2.30
Military 15* 2.58 3.17 3.57 2.94 2.77 2.20
Full-time at-home parent
328 2.06 2.67 3.54 2.53 3.32 2.06
Unemployed and searching
201 2.23 2.83 3.02 2.54 3.16 2.04
Unemployed and not searching
119 2.59 2.85 3.06 2.39 2.89 2.16
* Small base size
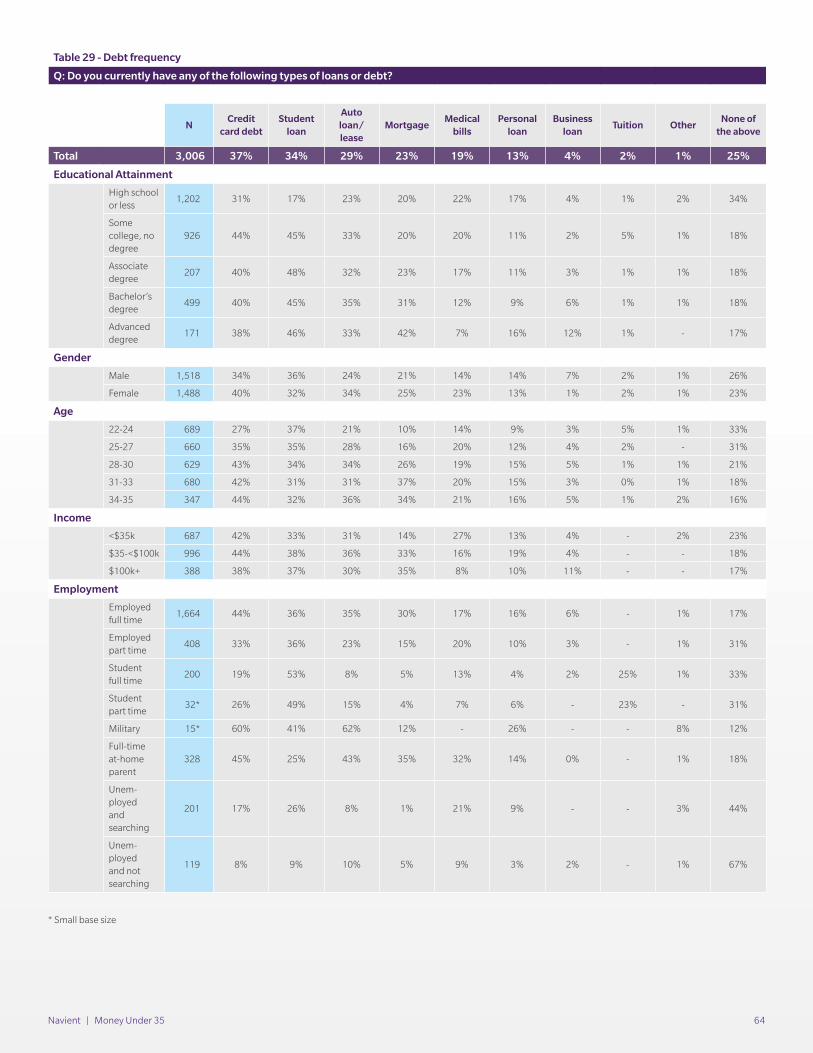
Navient | Money Under 35 64
Table 29 - Debt frequency
Q: Do you currently have any of the following types of loans or debt?
NCredit
card debtStudent
loan
Auto loan/lease
MortgageMedical
billsPersonal
loanBusiness
loanTuition Other
None of the above
Total 3,006 37% 34% 29% 23% 19% 13% 4% 2% 1% 25%
Educational Attainment
High school or less
1,202 31% 17% 23% 20% 22% 17% 4% 1% 2% 34%
Some college, no degree
926 44% 45% 33% 20% 20% 11% 2% 5% 1% 18%
Associate degree
207 40% 48% 32% 23% 17% 11% 3% 1% 1% 18%
Bachelor’s degree
499 40% 45% 35% 31% 12% 9% 6% 1% 1% 18%
Advanced degree
171 38% 46% 33% 42% 7% 16% 12% 1% - 17%
Gender
Male 1,518 34% 36% 24% 21% 14% 14% 7% 2% 1% 26%
Female 1,488 40% 32% 34% 25% 23% 13% 1% 2% 1% 23%
Age
22-24 689 27% 37% 21% 10% 14% 9% 3% 5% 1% 33%
25-27 660 35% 35% 28% 16% 20% 12% 4% 2% - 31%
28-30 629 43% 34% 34% 26% 19% 15% 5% 1% 1% 21%
31-33 680 42% 31% 31% 37% 20% 15% 3% 0% 1% 18%
34-35 347 44% 32% 36% 34% 21% 16% 5% 1% 2% 16%
Income
<$35k 687 42% 33% 31% 14% 27% 13% 4% - 2% 23%
$35-<$100k 996 44% 38% 36% 33% 16% 19% 4% - - 18%
$100k+ 388 38% 37% 30% 35% 8% 10% 11% - - 17%
Employment
Employed full time
1,664 44% 36% 35% 30% 17% 16% 6% - 1% 17%
Employed part time
408 33% 36% 23% 15% 20% 10% 3% - 1% 31%
Student full time
200 19% 53% 8% 5% 13% 4% 2% 25% 1% 33%
Student part time
32* 26% 49% 15% 4% 7% 6% - 23% - 31%
Military 15* 60% 41% 62% 12% - 26% - - 8% 12%
Full-time at-home parent
328 45% 25% 43% 35% 32% 14% 0% - 1% 18%
Unem-ployed and searching
201 17% 26% 8% 1% 21% 9% - - 3% 44%
Unem-ployed and not searching
119 8% 9% 10% 5% 9% 3% 2% - 1% 67%
* Small base size
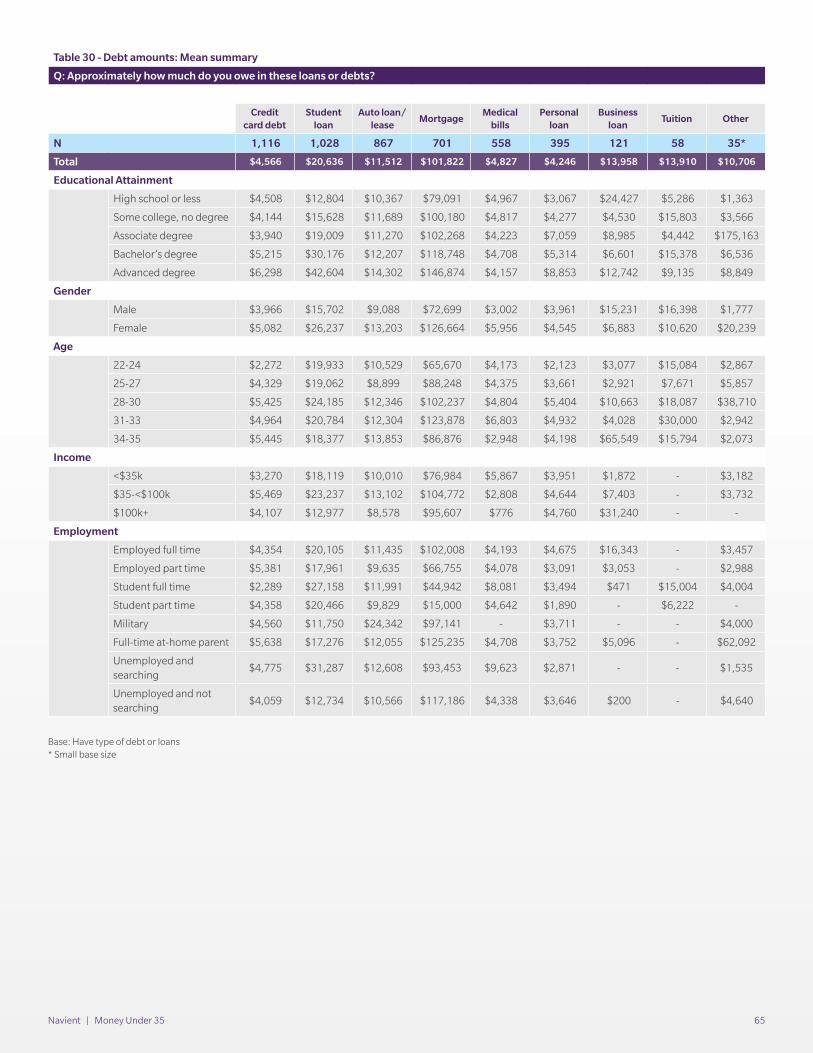
Navient | Money Under 35 65
Table 30 - Debt amounts: Mean summary
Q: Approximately how much do you owe in these loans or debts?
Credit card debt
Student loan
Auto loan/lease
MortgageMedical
billsPersonal
loanBusiness
loanTuition Other
N 1,116 1,028 867 701 558 395 121 58 35*
Total $4,566 $20,636 $11,512 $101,822 $4,827 $4,246 $13,958 $13,910 $10,706
Educational Attainment
High school or less $4,508 $12,804 $10,367 $79,091 $4,967 $3,067 $24,427 $5,286 $1,363
Some college, no degree $4,144 $15,628 $11,689 $100,180 $4,817 $4,277 $4,530 $15,803 $3,566
Associate degree $3,940 $19,009 $11,270 $102,268 $4,223 $7,059 $8,985 $4,442 $175,163
Bachelor’s degree $5,215 $30,176 $12,207 $118,748 $4,708 $5,314 $6,601 $15,378 $6,536
Advanced degree $6,298 $42,604 $14,302 $146,874 $4,157 $8,853 $12,742 $9,135 $8,849
Gender
Male $3,966 $15,702 $9,088 $72,699 $3,002 $3,961 $15,231 $16,398 $1,777
Female $5,082 $26,237 $13,203 $126,664 $5,956 $4,545 $6,883 $10,620 $20,239
Age
22-24 $2,272 $19,933 $10,529 $65,670 $4,173 $2,123 $3,077 $15,084 $2,867
25-27 $4,329 $19,062 $8,899 $88,248 $4,375 $3,661 $2,921 $7,671 $5,857
28-30 $5,425 $24,185 $12,346 $102,237 $4,804 $5,404 $10,663 $18,087 $38,710
31-33 $4,964 $20,784 $12,304 $123,878 $6,803 $4,932 $4,028 $30,000 $2,942
34-35 $5,445 $18,377 $13,853 $86,876 $2,948 $4,198 $65,549 $15,794 $2,073
Income
<$35k $3,270 $18,119 $10,010 $76,984 $5,867 $3,951 $1,872 - $3,182
$35-<$100k $5,469 $23,237 $13,102 $104,772 $2,808 $4,644 $7,403 - $3,732
$100k+ $4,107 $12,977 $8,578 $95,607 $776 $4,760 $31,240 - -
Employment
Employed full time $4,354 $20,105 $11,435 $102,008 $4,193 $4,675 $16,343 - $3,457
Employed part time $5,381 $17,961 $9,635 $66,755 $4,078 $3,091 $3,053 - $2,988
Student full time $2,289 $27,158 $11,991 $44,942 $8,081 $3,494 $471 $15,004 $4,004
Student part time $4,358 $20,466 $9,829 $15,000 $4,642 $1,890 - $6,222 -
Military $4,560 $11,750 $24,342 $97,141 - $3,711 - - $4,000
Full-time at-home parent $5,638 $17,276 $12,055 $125,235 $4,708 $3,752 $5,096 - $62,092
Unemployed and searching
$4,775 $31,287 $12,608 $93,453 $9,623 $2,871 - - $1,535
Unemployed and not searching
$4,059 $12,734 $10,566 $117,186 $4,338 $3,646 $200 - $4,640
Base: Have type of debt or loans* Small base size
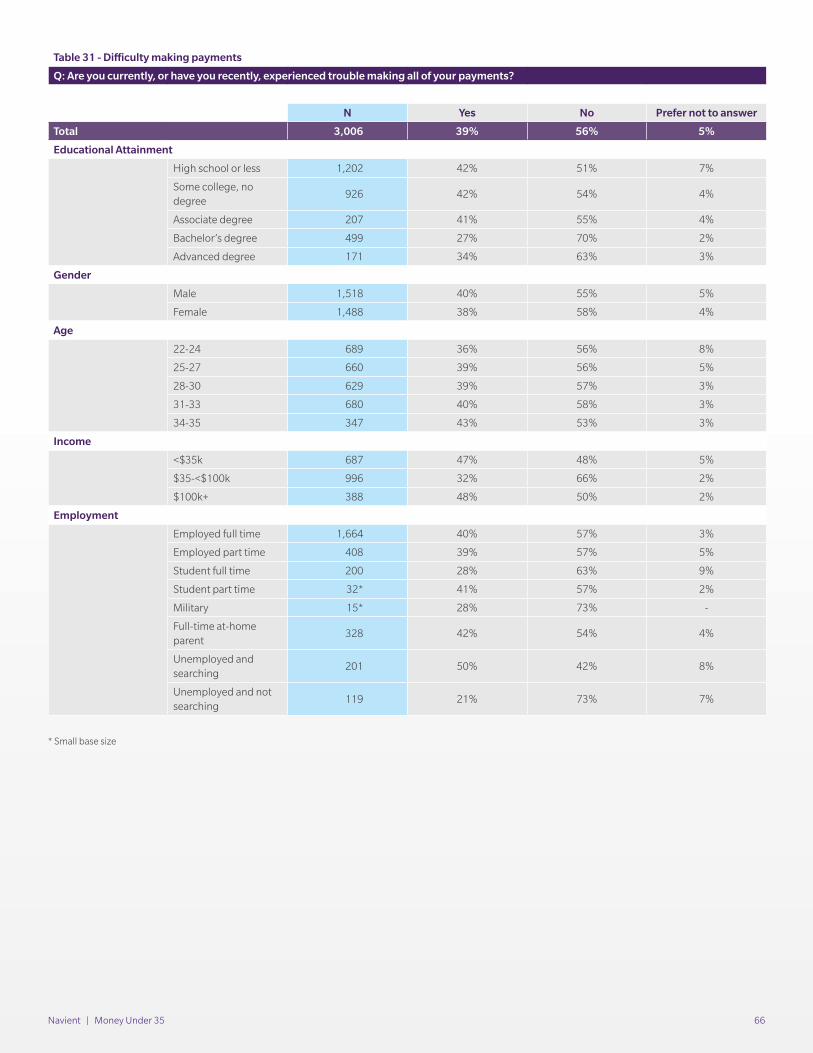
Navient | Money Under 35 66
Table 31 - Difficulty making payments
Q: Are you currently, or have you recently, experienced trouble making all of your payments?
N Yes No Prefer not to answer
Total 3,006 39% 56% 5%
Educational Attainment
High school or less 1,202 42% 51% 7%
Some college, no degree
926 42% 54% 4%
Associate degree 207 41% 55% 4%
Bachelor’s degree 499 27% 70% 2%
Advanced degree 171 34% 63% 3%
Gender
Male 1,518 40% 55% 5%
Female 1,488 38% 58% 4%
Age
22-24 689 36% 56% 8%
25-27 660 39% 56% 5%
28-30 629 39% 57% 3%
31-33 680 40% 58% 3%
34-35 347 43% 53% 3%
Income
<$35k 687 47% 48% 5%
$35-<$100k 996 32% 66% 2%
$100k+ 388 48% 50% 2%
Employment
Employed full time 1,664 40% 57% 3%
Employed part time 408 39% 57% 5%
Student full time 200 28% 63% 9%
Student part time 32* 41% 57% 2%
Military 15* 28% 73% -
Full-time at-home parent
328 42% 54% 4%
Unemployed and searching
201 50% 42% 8%
Unemployed and not searching
119 21% 73% 7%
* Small base size
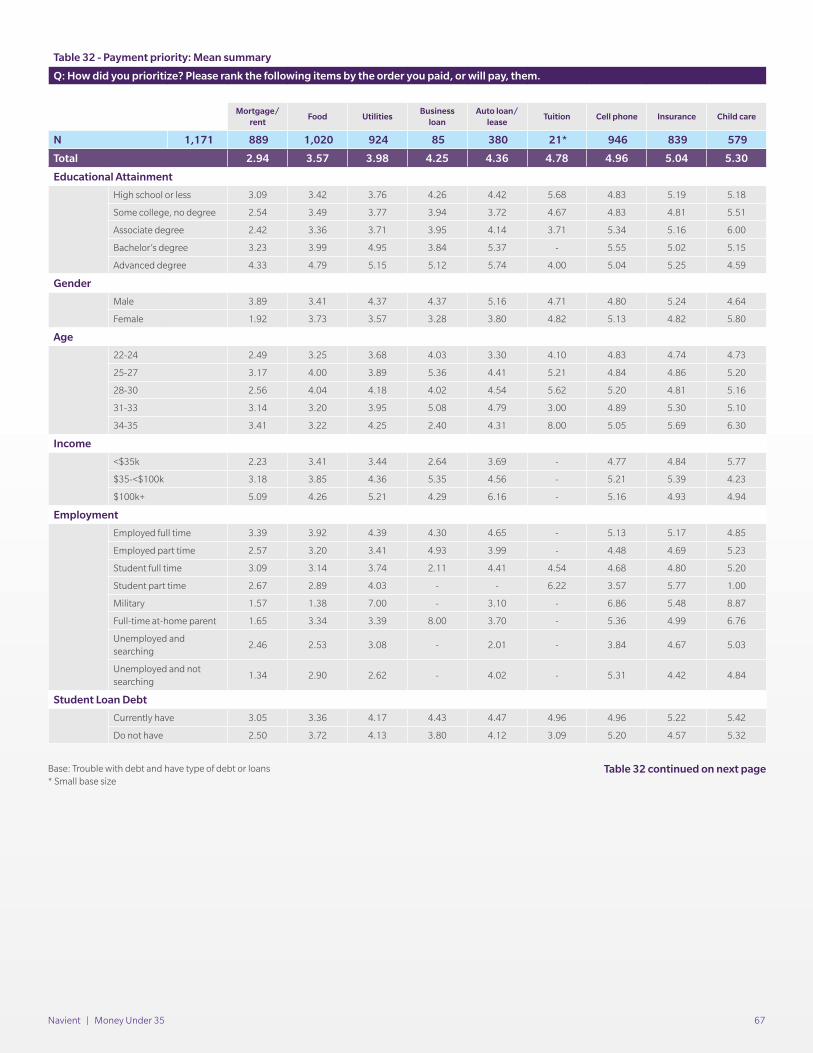
Navient | Money Under 35 67
Table 32 - Payment priority: Mean summary
Q: How did you prioritize? Please rank the following items by the order you paid, or will pay, them.
Mortgage/rent
Food UtilitiesBusiness
loanAuto loan/
leaseTuition Cell phone Insurance Child care
N 1,171 889 1,020 924 85 380 21* 946 839 579
Total 2.94 3.57 3.98 4.25 4.36 4.78 4.96 5.04 5.30
Educational Attainment
High school or less 3.09 3.42 3.76 4.26 4.42 5.68 4.83 5.19 5.18
Some college, no degree 2.54 3.49 3.77 3.94 3.72 4.67 4.83 4.81 5.51
Associate degree 2.42 3.36 3.71 3.95 4.14 3.71 5.34 5.16 6.00
Bachelor’s degree 3.23 3.99 4.95 3.84 5.37 - 5.55 5.02 5.15
Advanced degree 4.33 4.79 5.15 5.12 5.74 4.00 5.04 5.25 4.59
Gender
Male 3.89 3.41 4.37 4.37 5.16 4.71 4.80 5.24 4.64
Female 1.92 3.73 3.57 3.28 3.80 4.82 5.13 4.82 5.80
Age
22-24 2.49 3.25 3.68 4.03 3.30 4.10 4.83 4.74 4.73
25-27 3.17 4.00 3.89 5.36 4.41 5.21 4.84 4.86 5.20
28-30 2.56 4.04 4.18 4.02 4.54 5.62 5.20 4.81 5.16
31-33 3.14 3.20 3.95 5.08 4.79 3.00 4.89 5.30 5.10
34-35 3.41 3.22 4.25 2.40 4.31 8.00 5.05 5.69 6.30
Income
<$35k 2.23 3.41 3.44 2.64 3.69 - 4.77 4.84 5.77
$35-<$100k 3.18 3.85 4.36 5.35 4.56 - 5.21 5.39 4.23
$100k+ 5.09 4.26 5.21 4.29 6.16 - 5.16 4.93 4.94
Employment
Employed full time 3.39 3.92 4.39 4.30 4.65 - 5.13 5.17 4.85
Employed part time 2.57 3.20 3.41 4.93 3.99 - 4.48 4.69 5.23
Student full time 3.09 3.14 3.74 2.11 4.41 4.54 4.68 4.80 5.20
Student part time 2.67 2.89 4.03 - - 6.22 3.57 5.77 1.00
Military 1.57 1.38 7.00 - 3.10 - 6.86 5.48 8.87
Full-time at-home parent 1.65 3.34 3.39 8.00 3.70 - 5.36 4.99 6.76
Unemployed and searching
2.46 2.53 3.08 - 2.01 - 3.84 4.67 5.03
Unemployed and not searching
1.34 2.90 2.62 - 4.02 - 5.31 4.42 4.84
Student Loan Debt
Currently have 3.05 3.36 4.17 4.43 4.47 4.96 4.96 5.22 5.42
Do not have 2.50 3.72 4.13 3.80 4.12 3.09 5.20 4.57 5.32
Base: Trouble with debt and have type of debt or loans* Small base size
Table 32 continued on next page
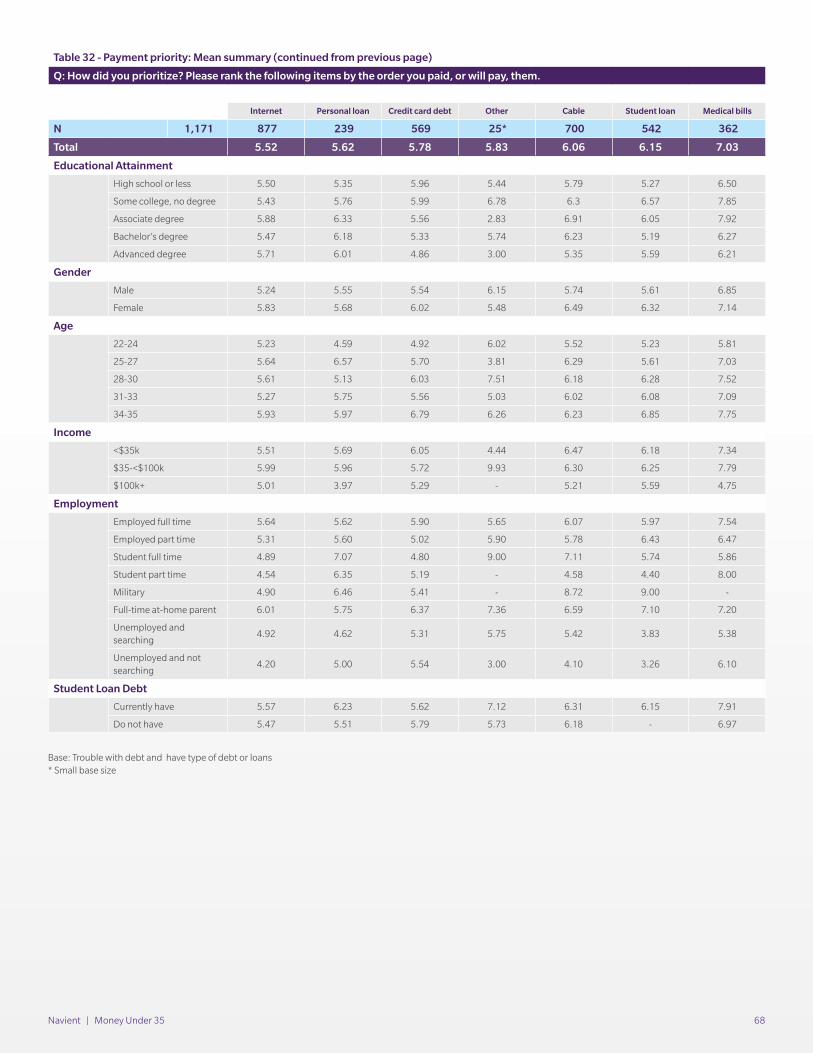
Navient | Money Under 35 68
Table 32 - Payment priority: Mean summary (continued from previous page)
Q: How did you prioritize? Please rank the following items by the order you paid, or will pay, them.
Internet Personal loan Credit card debt Other Cable Student loan Medical bills
N 1,171 877 239 569 25* 700 542 362
Total 5.52 5.62 5.78 5.83 6.06 6.15 7.03
Educational Attainment
High school or less 5.50 5.35 5.96 5.44 5.79 5.27 6.50
Some college, no degree 5.43 5.76 5.99 6.78 6.3 6.57 7.85
Associate degree 5.88 6.33 5.56 2.83 6.91 6.05 7.92
Bachelor’s degree 5.47 6.18 5.33 5.74 6.23 5.19 6.27
Advanced degree 5.71 6.01 4.86 3.00 5.35 5.59 6.21
Gender
Male 5.24 5.55 5.54 6.15 5.74 5.61 6.85
Female 5.83 5.68 6.02 5.48 6.49 6.32 7.14
Age
22-24 5.23 4.59 4.92 6.02 5.52 5.23 5.81
25-27 5.64 6.57 5.70 3.81 6.29 5.61 7.03
28-30 5.61 5.13 6.03 7.51 6.18 6.28 7.52
31-33 5.27 5.75 5.56 5.03 6.02 6.08 7.09
34-35 5.93 5.97 6.79 6.26 6.23 6.85 7.75
Income
<$35k 5.51 5.69 6.05 4.44 6.47 6.18 7.34
$35-<$100k 5.99 5.96 5.72 9.93 6.30 6.25 7.79
$100k+ 5.01 3.97 5.29 - 5.21 5.59 4.75
Employment
Employed full time 5.64 5.62 5.90 5.65 6.07 5.97 7.54
Employed part time 5.31 5.60 5.02 5.90 5.78 6.43 6.47
Student full time 4.89 7.07 4.80 9.00 7.11 5.74 5.86
Student part time 4.54 6.35 5.19 - 4.58 4.40 8.00
Military 4.90 6.46 5.41 - 8.72 9.00 -
Full-time at-home parent 6.01 5.75 6.37 7.36 6.59 7.10 7.20
Unemployed and searching
4.92 4.62 5.31 5.75 5.42 3.83 5.38
Unemployed and not searching
4.20 5.00 5.54 3.00 4.10 3.26 6.10
Student Loan Debt
Currently have 5.57 6.23 5.62 7.12 6.31 6.15 7.91
Do not have 5.47 5.51 5.79 5.73 6.18 - 6.97
Base: Trouble with debt and have type of debt or loans* Small base size
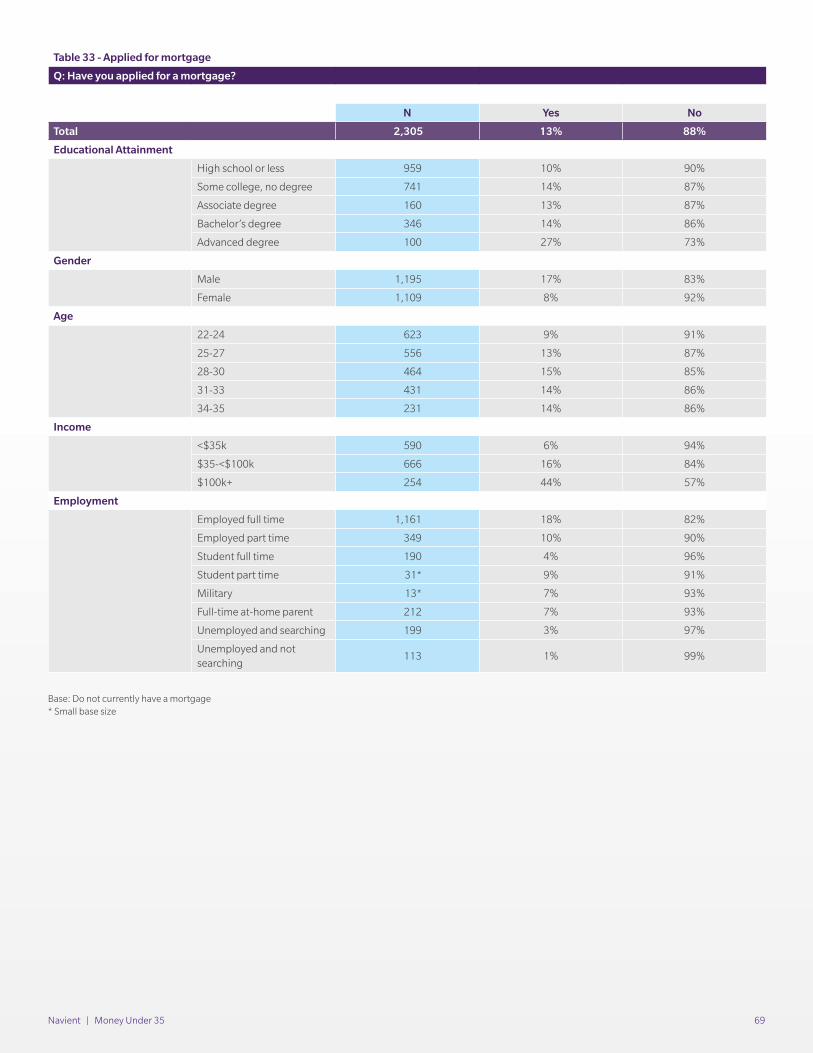
Navient | Money Under 35 69
Table 33 - Applied for mortgage
Q: Have you applied for a mortgage?
N Yes No
Total 2,305 13% 88%
Educational Attainment
High school or less 959 10% 90%
Some college, no degree 741 14% 87%
Associate degree 160 13% 87%
Bachelor’s degree 346 14% 86%
Advanced degree 100 27% 73%
Gender
Male 1,195 17% 83%
Female 1,109 8% 92%
Age
22-24 623 9% 91%
25-27 556 13% 87%
28-30 464 15% 85%
31-33 431 14% 86%
34-35 231 14% 86%
Income
<$35k 590 6% 94%
$35-<$100k 666 16% 84%
$100k+ 254 44% 57%
Employment
Employed full time 1,161 18% 82%
Employed part time 349 10% 90%
Student full time 190 4% 96%
Student part time 31* 9% 91%
Military 13* 7% 93%
Full-time at-home parent 212 7% 93%
Unemployed and searching 199 3% 97%
Unemployed and not searching
113 1% 99%
Base: Do not currently have a mortgage* Small base size
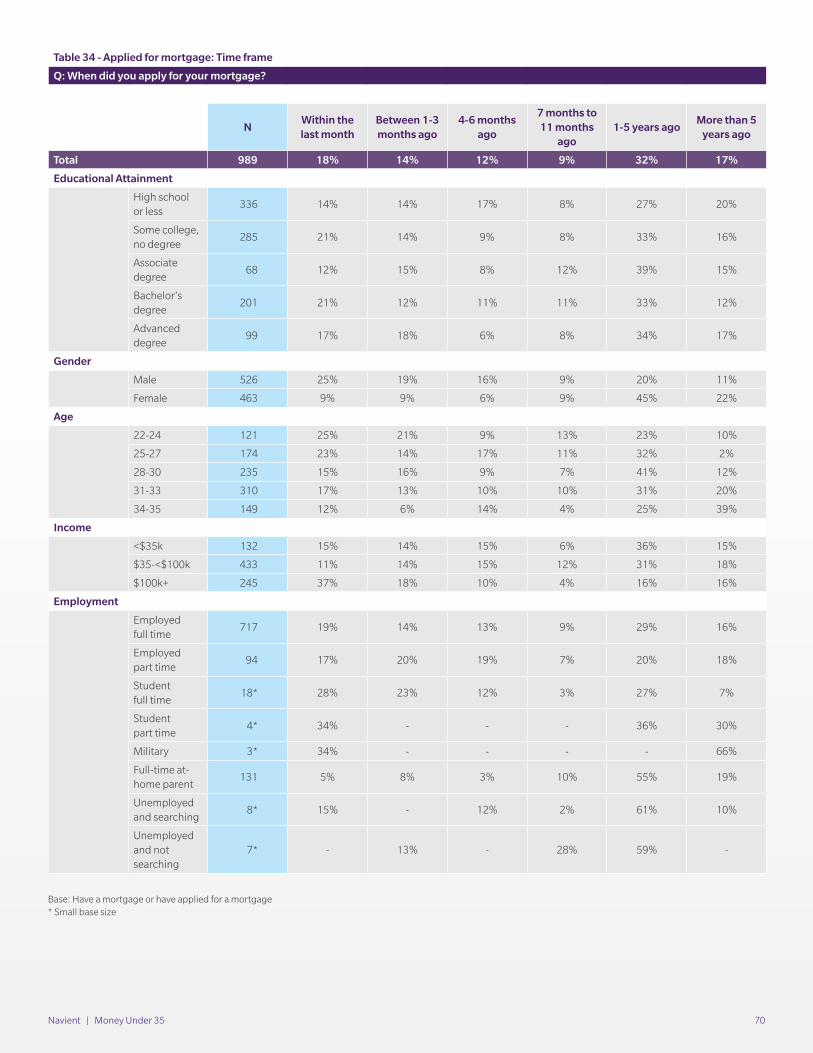
Navient | Money Under 35 70
Table 34 - Applied for mortgage: Time frame
Q: When did you apply for your mortgage?
NWithin the last month
Between 1-3 months ago
4-6 months ago
7 months to 11 months
ago1-5 years ago
More than 5 years ago
Total 989 18% 14% 12% 9% 32% 17%
Educational Attainment
High school or less
336 14% 14% 17% 8% 27% 20%
Some college, no degree
285 21% 14% 9% 8% 33% 16%
Associate degree
68 12% 15% 8% 12% 39% 15%
Bachelor’s degree
201 21% 12% 11% 11% 33% 12%
Advanced degree
99 17% 18% 6% 8% 34% 17%
Gender
Male 526 25% 19% 16% 9% 20% 11%
Female 463 9% 9% 6% 9% 45% 22%
Age
22-24 121 25% 21% 9% 13% 23% 10%
25-27 174 23% 14% 17% 11% 32% 2%
28-30 235 15% 16% 9% 7% 41% 12%
31-33 310 17% 13% 10% 10% 31% 20%
34-35 149 12% 6% 14% 4% 25% 39%
Income
<$35k 132 15% 14% 15% 6% 36% 15%
$35-<$100k 433 11% 14% 15% 12% 31% 18%
$100k+ 245 37% 18% 10% 4% 16% 16%
Employment
Employed full time
717 19% 14% 13% 9% 29% 16%
Employed part time
94 17% 20% 19% 7% 20% 18%
Student full time
18* 28% 23% 12% 3% 27% 7%
Student part time
4* 34% - - - 36% 30%
Military 3* 34% - - - - 66%
Full-time at-home parent
131 5% 8% 3% 10% 55% 19%
Unemployed and searching
8* 15% - 12% 2% 61% 10%
Unemployed and not searching
7* - 13% - 28% 59% -
Base: Have a mortgage or have applied for a mortgage* Small base size
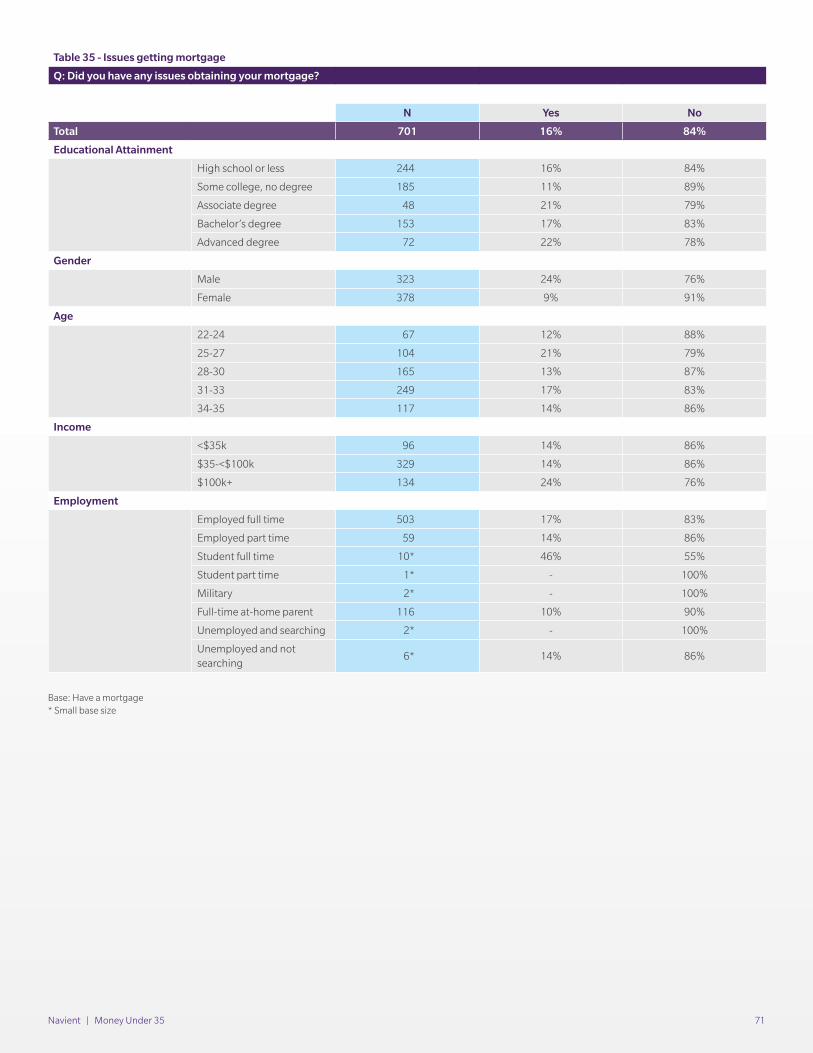
Navient | Money Under 35 71
Table 35 - Issues getting mortgage
Q: Did you have any issues obtaining your mortgage?
N Yes No
Total 701 16% 84%
Educational Attainment
High school or less 244 16% 84%
Some college, no degree 185 11% 89%
Associate degree 48 21% 79%
Bachelor’s degree 153 17% 83%
Advanced degree 72 22% 78%
Gender
Male 323 24% 76%
Female 378 9% 91%
Age
22-24 67 12% 88%
25-27 104 21% 79%
28-30 165 13% 87%
31-33 249 17% 83%
34-35 117 14% 86%
Income
<$35k 96 14% 86%
$35-<$100k 329 14% 86%
$100k+ 134 24% 76%
Employment
Employed full time 503 17% 83%
Employed part time 59 14% 86%
Student full time 10* 46% 55%
Student part time 1* - 100%
Military 2* - 100%
Full-time at-home parent 116 10% 90%
Unemployed and searching 2* - 100%
Unemployed and not searching
6* 14% 86%
Base: Have a mortgage * Small base size
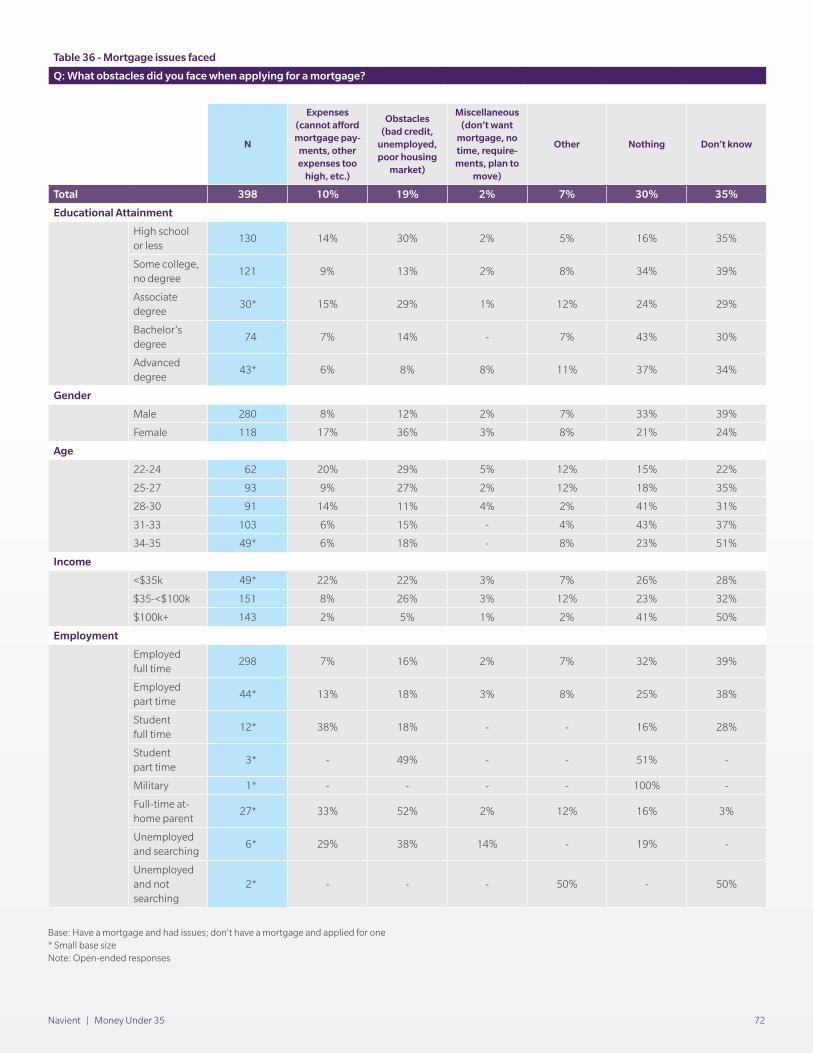
Navient | Money Under 35 72
Table 36 - Mortgage issues faced
Q: What obstacles did you face when applying for a mortgage?
N
Expenses (cannot afford mortgage pay-
ments, other expenses too
high, etc.)
Obstacles (bad credit,
unemployed, poor housing
market)
Miscellaneous (don’t want
mortgage, no time, require-ments, plan to
move)
Other Nothing Don’t know
Total 398 10% 19% 2% 7% 30% 35%
Educational Attainment
High school or less
130 14% 30% 2% 5% 16% 35%
Some college, no degree
121 9% 13% 2% 8% 34% 39%
Associate degree
30* 15% 29% 1% 12% 24% 29%
Bachelor’s degree
74 7% 14% - 7% 43% 30%
Advanced degree
43* 6% 8% 8% 11% 37% 34%
Gender
Male 280 8% 12% 2% 7% 33% 39%
Female 118 17% 36% 3% 8% 21% 24%
Age
22-24 62 20% 29% 5% 12% 15% 22%
25-27 93 9% 27% 2% 12% 18% 35%
28-30 91 14% 11% 4% 2% 41% 31%
31-33 103 6% 15% - 4% 43% 37%
34-35 49* 6% 18% - 8% 23% 51%
Income
<$35k 49* 22% 22% 3% 7% 26% 28%
$35-<$100k 151 8% 26% 3% 12% 23% 32%
$100k+ 143 2% 5% 1% 2% 41% 50%
Employment
Employed full time
298 7% 16% 2% 7% 32% 39%
Employed part time
44* 13% 18% 3% 8% 25% 38%
Studentfull time
12* 38% 18% - - 16% 28%
Studentpart time
3* - 49% - - 51% -
Military 1* - - - - 100% -
Full-time at-home parent
27* 33% 52% 2% 12% 16% 3%
Unemployed and searching
6* 29% 38% 14% - 19% -
Unemployed and not searching
2* - - - 50% - 50%
Base: Have a mortgage and had issues; don’t have a mortgage and applied for one* Small base sizeNote: Open-ended responses
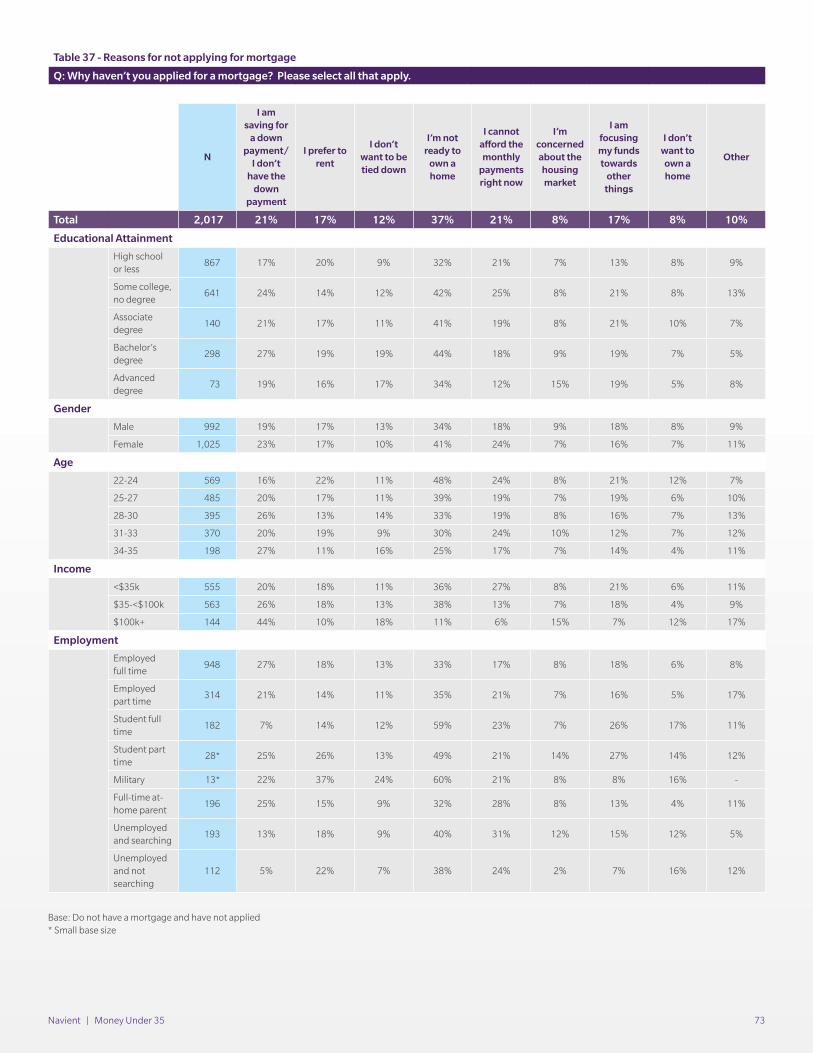
Navient | Money Under 35 73
Table 37 - Reasons for not applying for mortgage
Q: Why haven’t you applied for a mortgage? Please select all that apply.
N
I am saving for
a down payment/
I don’t have the
down payment
I prefer to rent
I don’t want to be tied down
I’m not ready to
own a home
I cannot afford the monthly
payments right now
I’m concerned about the housing market
I am focusing my funds towards
other things
I don’t want to own a home
Other
Total 2,017 21% 17% 12% 37% 21% 8% 17% 8% 10%
Educational Attainment
High school or less
867 17% 20% 9% 32% 21% 7% 13% 8% 9%
Some college, no degree
641 24% 14% 12% 42% 25% 8% 21% 8% 13%
Associate degree
140 21% 17% 11% 41% 19% 8% 21% 10% 7%
Bachelor’s degree
298 27% 19% 19% 44% 18% 9% 19% 7% 5%
Advanced degree
73 19% 16% 17% 34% 12% 15% 19% 5% 8%
Gender
Male 992 19% 17% 13% 34% 18% 9% 18% 8% 9%
Female 1,025 23% 17% 10% 41% 24% 7% 16% 7% 11%
Age
22-24 569 16% 22% 11% 48% 24% 8% 21% 12% 7%
25-27 485 20% 17% 11% 39% 19% 7% 19% 6% 10%
28-30 395 26% 13% 14% 33% 19% 8% 16% 7% 13%
31-33 370 20% 19% 9% 30% 24% 10% 12% 7% 12%
34-35 198 27% 11% 16% 25% 17% 7% 14% 4% 11%
Income
<$35k 555 20% 18% 11% 36% 27% 8% 21% 6% 11%
$35-<$100k 563 26% 18% 13% 38% 13% 7% 18% 4% 9%
$100k+ 144 44% 10% 18% 11% 6% 15% 7% 12% 17%
Employment
Employed full time
948 27% 18% 13% 33% 17% 8% 18% 6% 8%
Employed part time
314 21% 14% 11% 35% 21% 7% 16% 5% 17%
Student full time
182 7% 14% 12% 59% 23% 7% 26% 17% 11%
Student part time
28* 25% 26% 13% 49% 21% 14% 27% 14% 12%
Military 13* 22% 37% 24% 60% 21% 8% 8% 16% -
Full-time at-home parent
196 25% 15% 9% 32% 28% 8% 13% 4% 11%
Unemployed and searching
193 13% 18% 9% 40% 31% 12% 15% 12% 5%
Unemployed and not searching
112 5% 22% 7% 38% 24% 2% 7% 16% 12%
Base: Do not have a mortgage and have not applied* Small base size
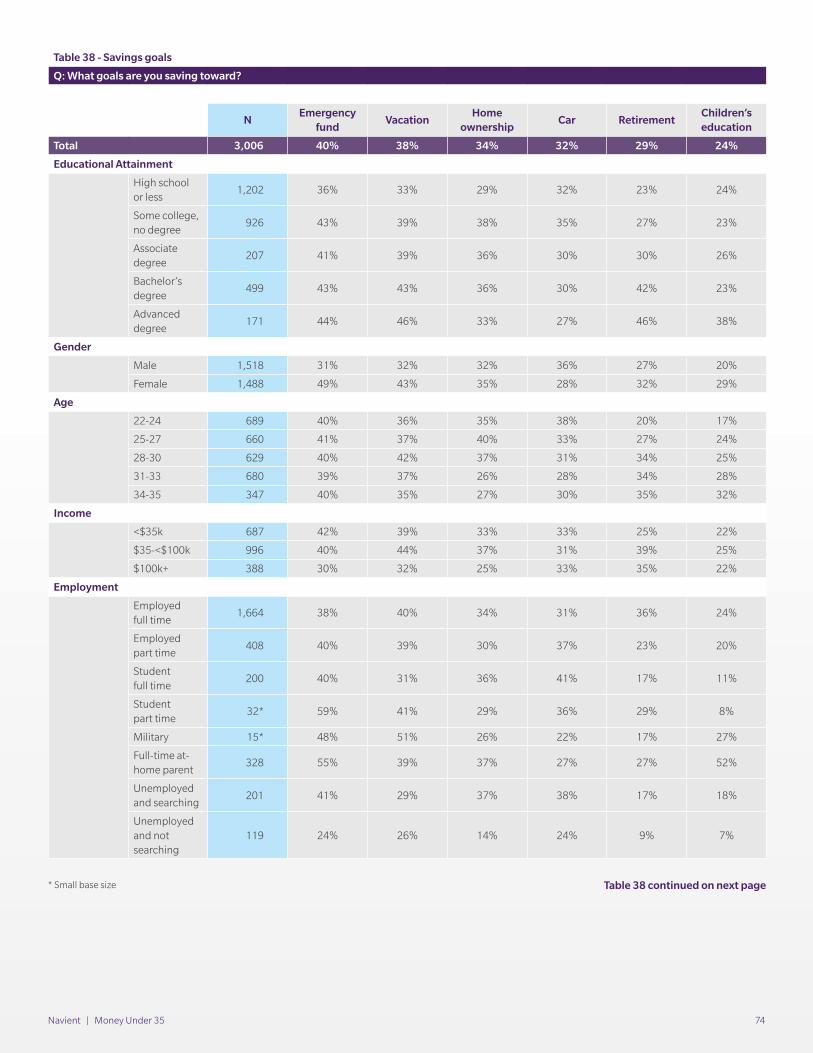
Navient | Money Under 35 74
Table 38 - Savings goals
Q: What goals are you saving toward?
NEmergency
fundVacation
Home ownership
Car RetirementChildren’s education
Total 3,006 40% 38% 34% 32% 29% 24%
Educational Attainment
High school or less
1,202 36% 33% 29% 32% 23% 24%
Some college, no degree
926 43% 39% 38% 35% 27% 23%
Associate degree
207 41% 39% 36% 30% 30% 26%
Bachelor’s degree
499 43% 43% 36% 30% 42% 23%
Advanced degree
171 44% 46% 33% 27% 46% 38%
Gender
Male 1,518 31% 32% 32% 36% 27% 20%
Female 1,488 49% 43% 35% 28% 32% 29%
Age
22-24 689 40% 36% 35% 38% 20% 17%
25-27 660 41% 37% 40% 33% 27% 24%
28-30 629 40% 42% 37% 31% 34% 25%
31-33 680 39% 37% 26% 28% 34% 28%
34-35 347 40% 35% 27% 30% 35% 32%
Income
<$35k 687 42% 39% 33% 33% 25% 22%
$35-<$100k 996 40% 44% 37% 31% 39% 25%
$100k+ 388 30% 32% 25% 33% 35% 22%
Employment
Employed full time
1,664 38% 40% 34% 31% 36% 24%
Employed part time
408 40% 39% 30% 37% 23% 20%
Student full time
200 40% 31% 36% 41% 17% 11%
Studentpart time
32* 59% 41% 29% 36% 29% 8%
Military 15* 48% 51% 26% 22% 17% 27%
Full-time at-home parent
328 55% 39% 37% 27% 27% 52%
Unemployed and searching
201 41% 29% 37% 38% 17% 18%
Unemployed and not searching
119 24% 26% 14% 24% 9% 7%
* Small base size Table 38 continued on next page
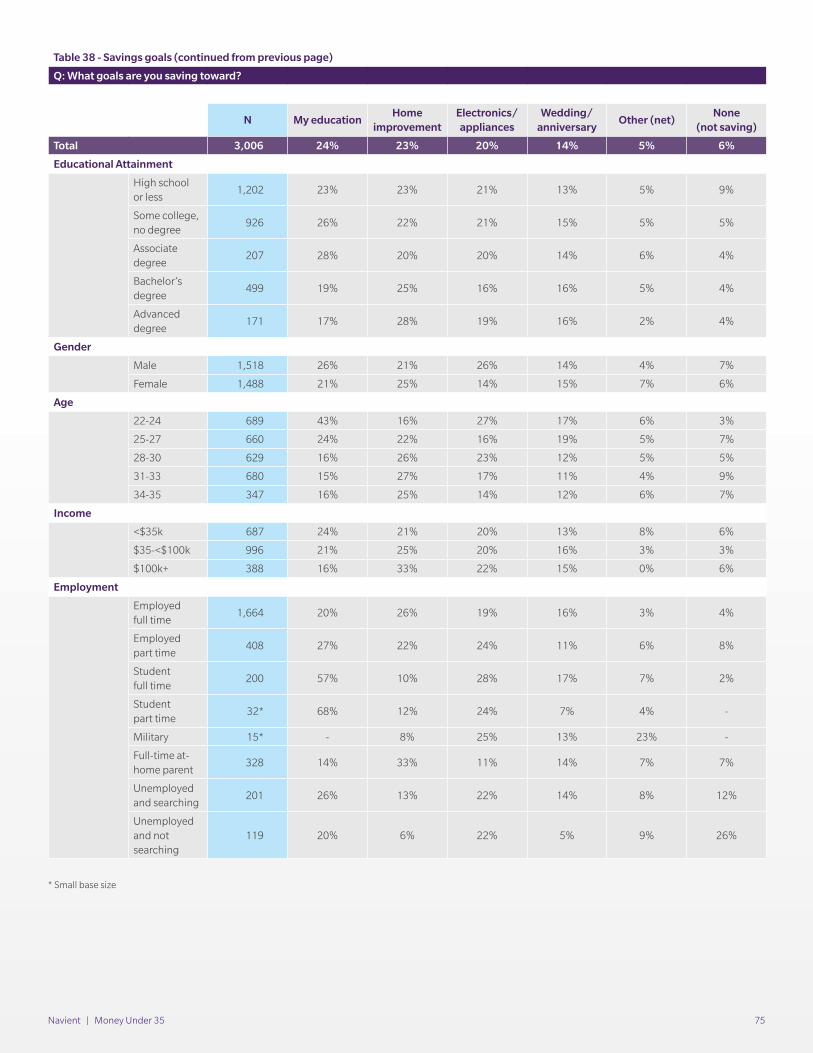
Navient | Money Under 35 75
Table 38 - Savings goals (continued from previous page)
Q: What goals are you saving toward?
N My educationHome
improvementElectronics/appliances
Wedding/ anniversary
Other (net)None
(not saving)
Total 3,006 24% 23% 20% 14% 5% 6%
Educational Attainment
High school or less
1,202 23% 23% 21% 13% 5% 9%
Some college, no degree
926 26% 22% 21% 15% 5% 5%
Associate degree
207 28% 20% 20% 14% 6% 4%
Bachelor’s degree
499 19% 25% 16% 16% 5% 4%
Advanced degree
171 17% 28% 19% 16% 2% 4%
Gender
Male 1,518 26% 21% 26% 14% 4% 7%
Female 1,488 21% 25% 14% 15% 7% 6%
Age
22-24 689 43% 16% 27% 17% 6% 3%
25-27 660 24% 22% 16% 19% 5% 7%
28-30 629 16% 26% 23% 12% 5% 5%
31-33 680 15% 27% 17% 11% 4% 9%
34-35 347 16% 25% 14% 12% 6% 7%
Income
<$35k 687 24% 21% 20% 13% 8% 6%
$35-<$100k 996 21% 25% 20% 16% 3% 3%
$100k+ 388 16% 33% 22% 15% 0% 6%
Employment
Employed full time
1,664 20% 26% 19% 16% 3% 4%
Employed part time
408 27% 22% 24% 11% 6% 8%
Student full time
200 57% 10% 28% 17% 7% 2%
Studentpart time
32* 68% 12% 24% 7% 4% -
Military 15* - 8% 25% 13% 23% -
Full-time at-home parent
328 14% 33% 11% 14% 7% 7%
Unemployed and searching
201 26% 13% 22% 14% 8% 12%
Unemployed and not searching
119 20% 6% 22% 5% 9% 26%
* Small base size
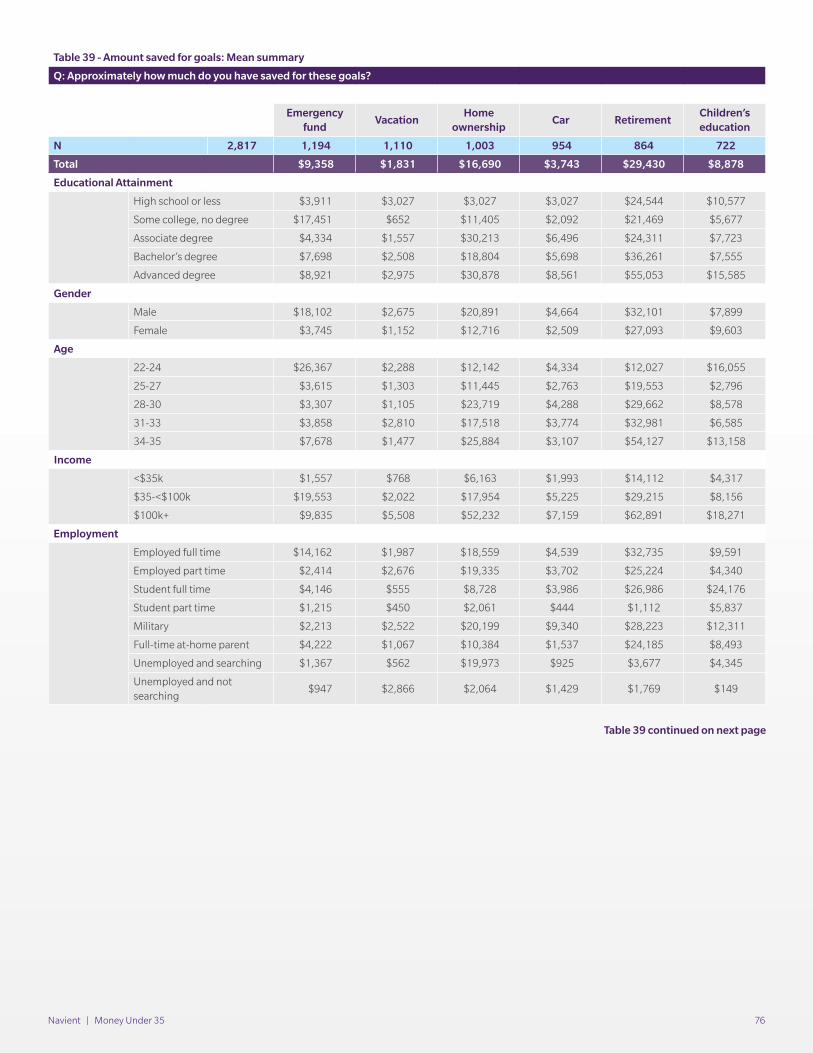
Navient | Money Under 35 76
Table 39 - Amount saved for goals: Mean summary
Q: Approximately how much do you have saved for these goals?
Emergency fund
VacationHome
ownershipCar Retirement
Children’s education
N 2,817 1,194 1,110 1,003 954 864 722
Total $9,358 $1,831 $16,690 $3,743 $29,430 $8,878
Educational Attainment
High school or less $3,911 $3,027 $3,027 $3,027 $24,544 $10,577
Some college, no degree $17,451 $652 $11,405 $2,092 $21,469 $5,677
Associate degree $4,334 $1,557 $30,213 $6,496 $24,311 $7,723
Bachelor’s degree $7,698 $2,508 $18,804 $5,698 $36,261 $7,555
Advanced degree $8,921 $2,975 $30,878 $8,561 $55,053 $15,585
Gender
Male $18,102 $2,675 $20,891 $4,664 $32,101 $7,899
Female $3,745 $1,152 $12,716 $2,509 $27,093 $9,603
Age
22-24 $26,367 $2,288 $12,142 $4,334 $12,027 $16,055
25-27 $3,615 $1,303 $11,445 $2,763 $19,553 $2,796
28-30 $3,307 $1,105 $23,719 $4,288 $29,662 $8,578
31-33 $3,858 $2,810 $17,518 $3,774 $32,981 $6,585
34-35 $7,678 $1,477 $25,884 $3,107 $54,127 $13,158
Income
<$35k $1,557 $768 $6,163 $1,993 $14,112 $4,317
$35-<$100k $19,553 $2,022 $17,954 $5,225 $29,215 $8,156
$100k+ $9,835 $5,508 $52,232 $7,159 $62,891 $18,271
Employment
Employed full time $14,162 $1,987 $18,559 $4,539 $32,735 $9,591
Employed part time $2,414 $2,676 $19,335 $3,702 $25,224 $4,340
Student full time $4,146 $555 $8,728 $3,986 $26,986 $24,176
Student part time $1,215 $450 $2,061 $444 $1,112 $5,837
Military $2,213 $2,522 $20,199 $9,340 $28,223 $12,311
Full-time at-home parent $4,222 $1,067 $10,384 $1,537 $24,185 $8,493
Unemployed and searching $1,367 $562 $19,973 $925 $3,677 $4,345
Unemployed and not searching
$947 $2,866 $2,064 $1,429 $1,769 $149
Table 39 continued on next page
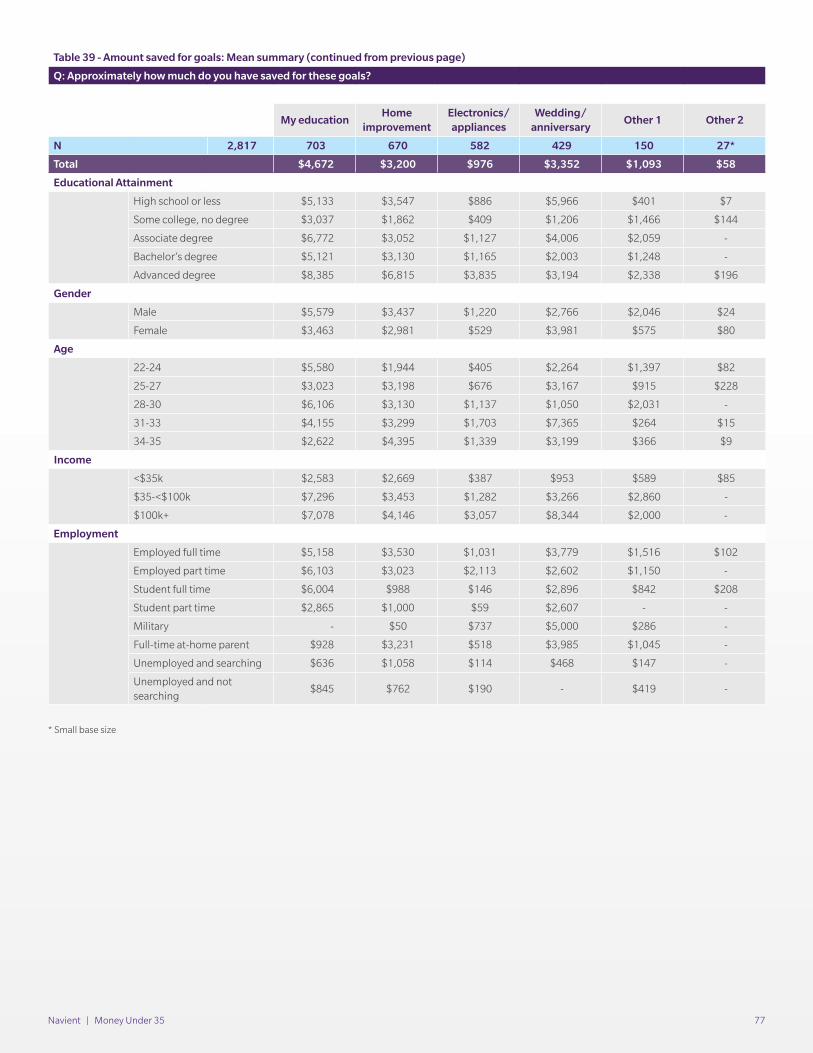
Navient | Money Under 35 77
Table 39 - Amount saved for goals: Mean summary (continued from previous page)
Q: Approximately how much do you have saved for these goals?
My educationHome
improvementElectronics/appliances
Wedding/ anniversary
Other 1 Other 2
N 2,817 703 670 582 429 150 27*
Total $4,672 $3,200 $976 $3,352 $1,093 $58
Educational Attainment
High school or less $5,133 $3,547 $886 $5,966 $401 $7
Some college, no degree $3,037 $1,862 $409 $1,206 $1,466 $144
Associate degree $6,772 $3,052 $1,127 $4,006 $2,059 -
Bachelor’s degree $5,121 $3,130 $1,165 $2,003 $1,248 -
Advanced degree $8,385 $6,815 $3,835 $3,194 $2,338 $196
Gender
Male $5,579 $3,437 $1,220 $2,766 $2,046 $24
Female $3,463 $2,981 $529 $3,981 $575 $80
Age
22-24 $5,580 $1,944 $405 $2,264 $1,397 $82
25-27 $3,023 $3,198 $676 $3,167 $915 $228
28-30 $6,106 $3,130 $1,137 $1,050 $2,031 -
31-33 $4,155 $3,299 $1,703 $7,365 $264 $15
34-35 $2,622 $4,395 $1,339 $3,199 $366 $9
Income
<$35k $2,583 $2,669 $387 $953 $589 $85
$35-<$100k $7,296 $3,453 $1,282 $3,266 $2,860 -
$100k+ $7,078 $4,146 $3,057 $8,344 $2,000 -
Employment
Employed full time $5,158 $3,530 $1,031 $3,779 $1,516 $102
Employed part time $6,103 $3,023 $2,113 $2,602 $1,150 -
Student full time $6,004 $988 $146 $2,896 $842 $208
Student part time $2,865 $1,000 $59 $2,607 - -
Military - $50 $737 $5,000 $286 -
Full-time at-home parent $928 $3,231 $518 $3,985 $1,045 -
Unemployed and searching $636 $1,058 $114 $468 $147 -
Unemployed and not searching
$845 $762 $190 - $419 -
* Small base size
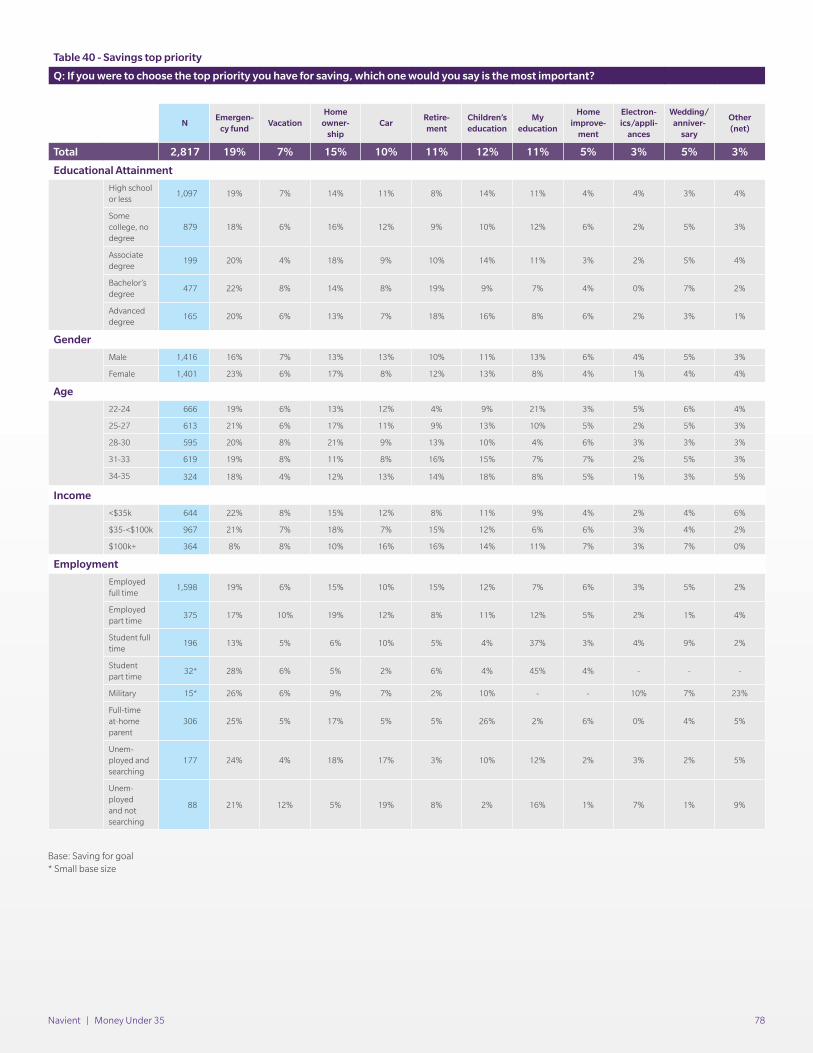
Navient | Money Under 35 78
Table 40 - Savings top priority
Q: If you were to choose the top priority you have for saving, which one would you say is the most important?
N Emergen-
cy fundVacation
Home owner-
shipCar
Retire-ment
Children’s education
Myeducation
Home improve-
ment
Electron-ics/appli-
ances
Wedding/anniver-
sary
Other (net)
Total 2,817 19% 7% 15% 10% 11% 12% 11% 5% 3% 5% 3%
Educational Attainment
High school or less
1,097 19% 7% 14% 11% 8% 14% 11% 4% 4% 3% 4%
Some college, no degree
879 18% 6% 16% 12% 9% 10% 12% 6% 2% 5% 3%
Associate degree
199 20% 4% 18% 9% 10% 14% 11% 3% 2% 5% 4%
Bachelor’s degree
477 22% 8% 14% 8% 19% 9% 7% 4% 0% 7% 2%
Advanced degree
165 20% 6% 13% 7% 18% 16% 8% 6% 2% 3% 1%
Gender
Male 1,416 16% 7% 13% 13% 10% 11% 13% 6% 4% 5% 3%
Female 1,401 23% 6% 17% 8% 12% 13% 8% 4% 1% 4% 4%
Age
22-24 666 19% 6% 13% 12% 4% 9% 21% 3% 5% 6% 4%
25-27 613 21% 6% 17% 11% 9% 13% 10% 5% 2% 5% 3%
28-30 595 20% 8% 21% 9% 13% 10% 4% 6% 3% 3% 3%
31-33 619 19% 8% 11% 8% 16% 15% 7% 7% 2% 5% 3%
34-35 324 18% 4% 12% 13% 14% 18% 8% 5% 1% 3% 5%
Income
<$35k 644 22% 8% 15% 12% 8% 11% 9% 4% 2% 4% 6%
$35-<$100k 967 21% 7% 18% 7% 15% 12% 6% 6% 3% 4% 2%
$100k+ 364 8% 8% 10% 16% 16% 14% 11% 7% 3% 7% 0%
Employment
Employed full time
1,598 19% 6% 15% 10% 15% 12% 7% 6% 3% 5% 2%
Employed part time
375 17% 10% 19% 12% 8% 11% 12% 5% 2% 1% 4%
Student full time
196 13% 5% 6% 10% 5% 4% 37% 3% 4% 9% 2%
Student part time
32* 28% 6% 5% 2% 6% 4% 45% 4% - - -
Military 15* 26% 6% 9% 7% 2% 10% - - 10% 7% 23%
Full-time at-home parent
306 25% 5% 17% 5% 5% 26% 2% 6% 0% 4% 5%
Unem-ployed and searching
177 24% 4% 18% 17% 3% 10% 12% 2% 3% 2% 5%
Unem-ployed and not searching
88 21% 12% 5% 19% 8% 2% 16% 1% 7% 1% 9%
Base: Saving for goal* Small base size
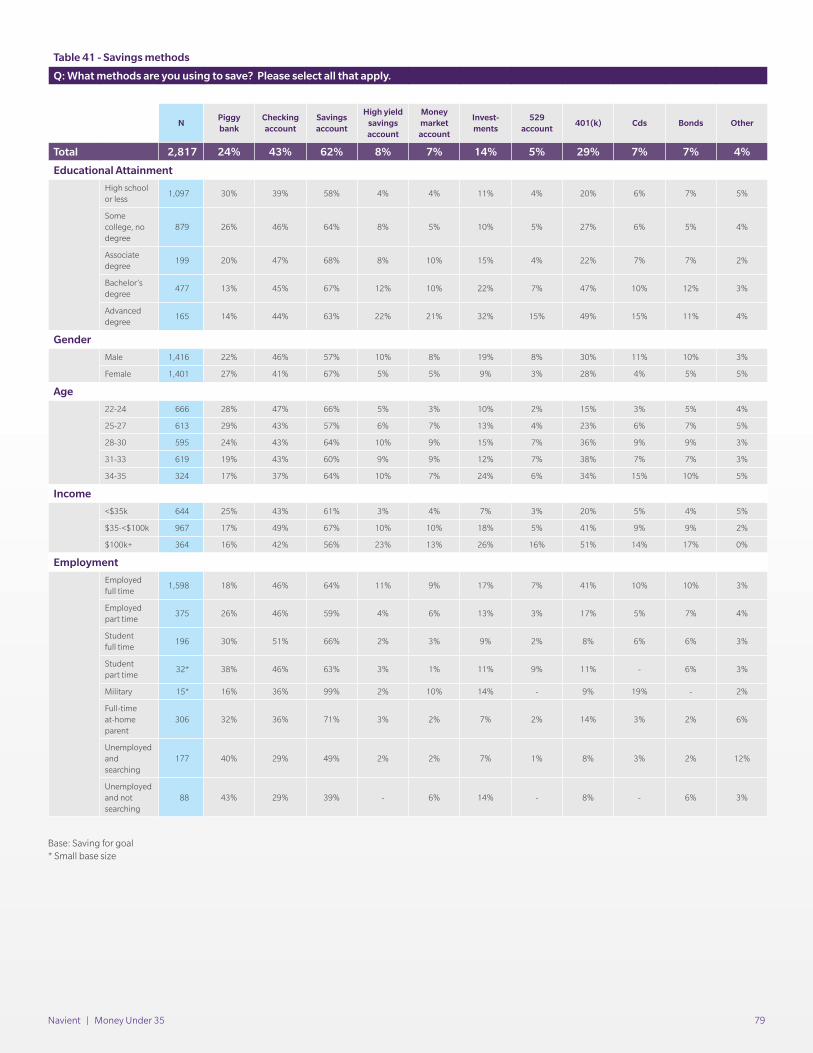
Navient | Money Under 35 79
Table 41 - Savings methods
Q: What methods are you using to save? Please select all that apply.
NPiggy bank
Checking account
Savings account
High yield savings account
Money market
account
Invest-ments
529 account
401(k) Cds Bonds Other
Total 2,817 24% 43% 62% 8% 7% 14% 5% 29% 7% 7% 4%
Educational Attainment
High school or less
1,097 30% 39% 58% 4% 4% 11% 4% 20% 6% 7% 5%
Some college, no degree
879 26% 46% 64% 8% 5% 10% 5% 27% 6% 5% 4%
Associate degree
199 20% 47% 68% 8% 10% 15% 4% 22% 7% 7% 2%
Bachelor’s degree
477 13% 45% 67% 12% 10% 22% 7% 47% 10% 12% 3%
Advanced degree
165 14% 44% 63% 22% 21% 32% 15% 49% 15% 11% 4%
Gender
Male 1,416 22% 46% 57% 10% 8% 19% 8% 30% 11% 10% 3%
Female 1,401 27% 41% 67% 5% 5% 9% 3% 28% 4% 5% 5%
Age
22-24 666 28% 47% 66% 5% 3% 10% 2% 15% 3% 5% 4%
25-27 613 29% 43% 57% 6% 7% 13% 4% 23% 6% 7% 5%
28-30 595 24% 43% 64% 10% 9% 15% 7% 36% 9% 9% 3%
31-33 619 19% 43% 60% 9% 9% 12% 7% 38% 7% 7% 3%
34-35 324 17% 37% 64% 10% 7% 24% 6% 34% 15% 10% 5%
Income
<$35k 644 25% 43% 61% 3% 4% 7% 3% 20% 5% 4% 5%
$35-<$100k 967 17% 49% 67% 10% 10% 18% 5% 41% 9% 9% 2%
$100k+ 364 16% 42% 56% 23% 13% 26% 16% 51% 14% 17% 0%
Employment
Employed full time
1,598 18% 46% 64% 11% 9% 17% 7% 41% 10% 10% 3%
Employed part time
375 26% 46% 59% 4% 6% 13% 3% 17% 5% 7% 4%
Student full time
196 30% 51% 66% 2% 3% 9% 2% 8% 6% 6% 3%
Student part time
32* 38% 46% 63% 3% 1% 11% 9% 11% - 6% 3%
Military 15* 16% 36% 99% 2% 10% 14% - 9% 19% - 2%
Full-time at-home parent
306 32% 36% 71% 3% 2% 7% 2% 14% 3% 2% 6%
Unemployed and searching
177 40% 29% 49% 2% 2% 7% 1% 8% 3% 2% 12%
Unemployed and not searching
88 43% 29% 39% - 6% 14% - 8% - 6% 3%
Base: Saving for goal* Small base size
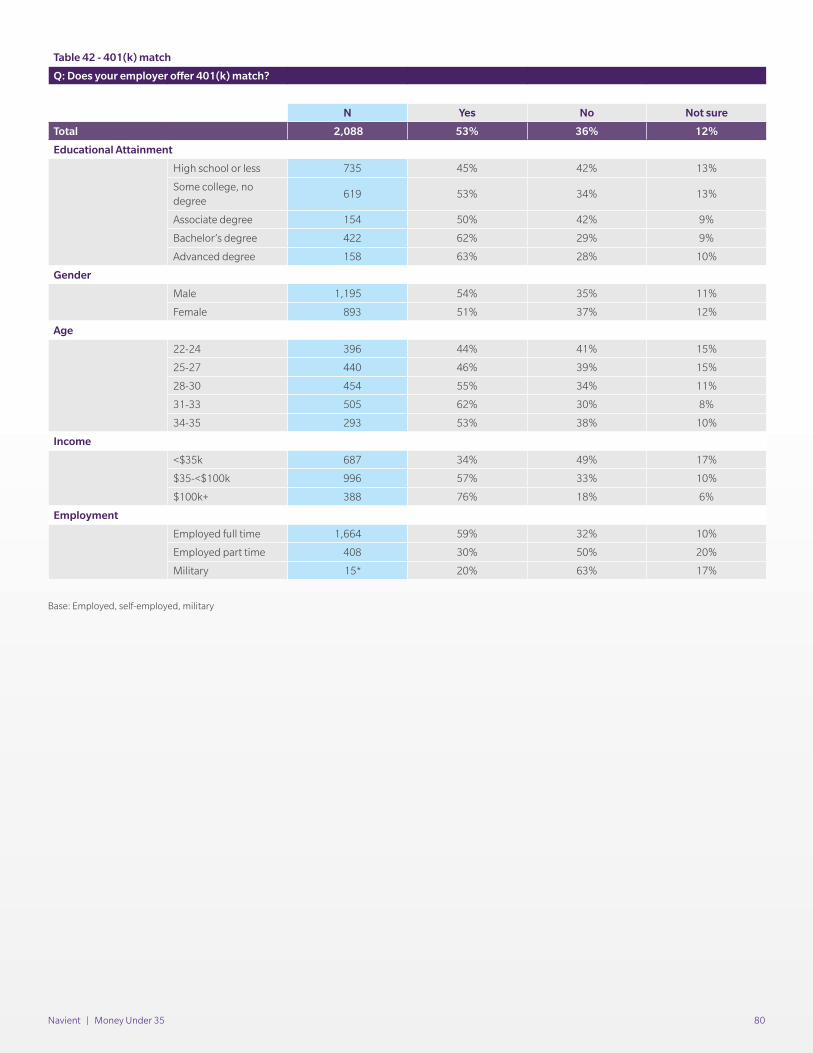
Navient | Money Under 35 80
Table 42 - 401(k) match
Q: Does your employer offer 401(k) match?
N Yes No Not sure
Total 2,088 53% 36% 12%
Educational Attainment
High school or less 735 45% 42% 13%
Some college, no degree
619 53% 34% 13%
Associate degree 154 50% 42% 9%
Bachelor’s degree 422 62% 29% 9%
Advanced degree 158 63% 28% 10%
Gender
Male 1,195 54% 35% 11%
Female 893 51% 37% 12%
Age
22-24 396 44% 41% 15%
25-27 440 46% 39% 15%
28-30 454 55% 34% 11%
31-33 505 62% 30% 8%
34-35 293 53% 38% 10%
Income
<$35k 687 34% 49% 17%
$35-<$100k 996 57% 33% 10%
$100k+ 388 76% 18% 6%
Employment
Employed full time 1,664 59% 32% 10%
Employed part time 408 30% 50% 20%
Military 15* 20% 63% 17%
Base: Employed, self-employed, military
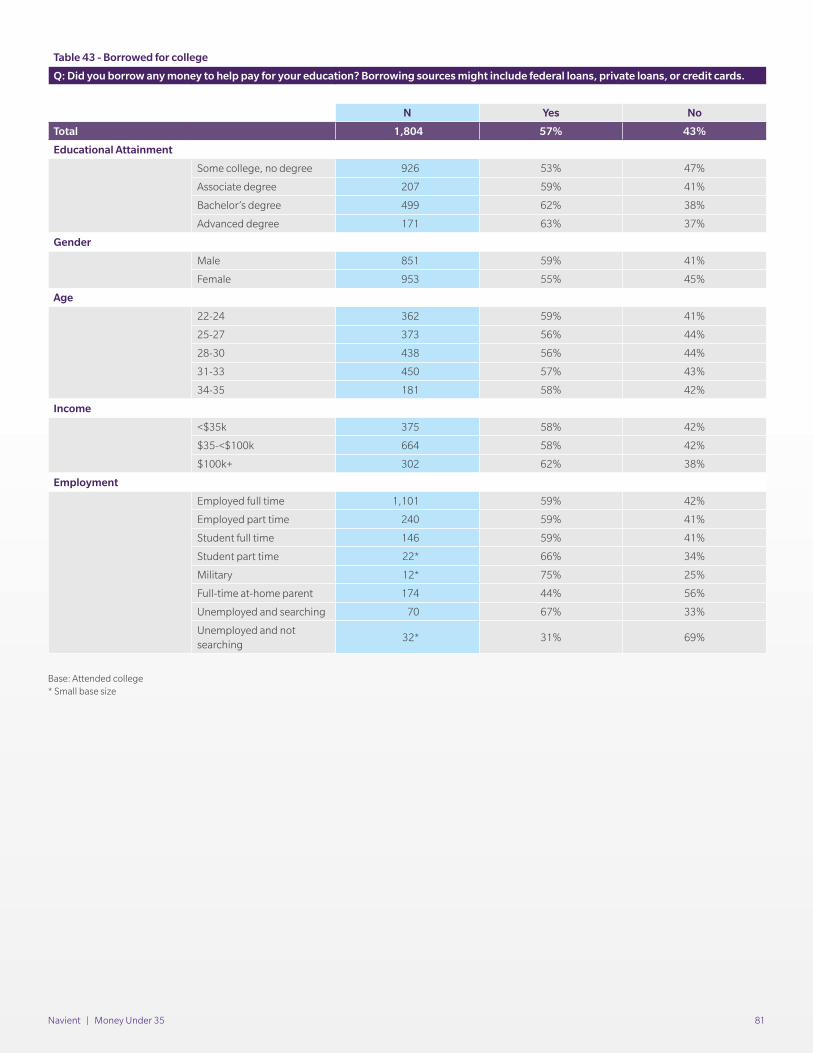
Navient | Money Under 35 81
Table 43 - Borrowed for college
Q: Did you borrow any money to help pay for your education? Borrowing sources might include federal loans, private loans, or credit cards.
N Yes No
Total 1,804 57% 43%
Educational Attainment
Some college, no degree 926 53% 47%
Associate degree 207 59% 41%
Bachelor’s degree 499 62% 38%
Advanced degree 171 63% 37%
Gender
Male 851 59% 41%
Female 953 55% 45%
Age
22-24 362 59% 41%
25-27 373 56% 44%
28-30 438 56% 44%
31-33 450 57% 43%
34-35 181 58% 42%
Income
<$35k 375 58% 42%
$35-<$100k 664 58% 42%
$100k+ 302 62% 38%
Employment
Employed full time 1,101 59% 42%
Employed part time 240 59% 41%
Student full time 146 59% 41%
Student part time 22* 66% 34%
Military 12* 75% 25%
Full-time at-home parent 174 44% 56%
Unemployed and searching 70 67% 33%
Unemployed and not searching
32* 31% 69%
Base: Attended college* Small base size
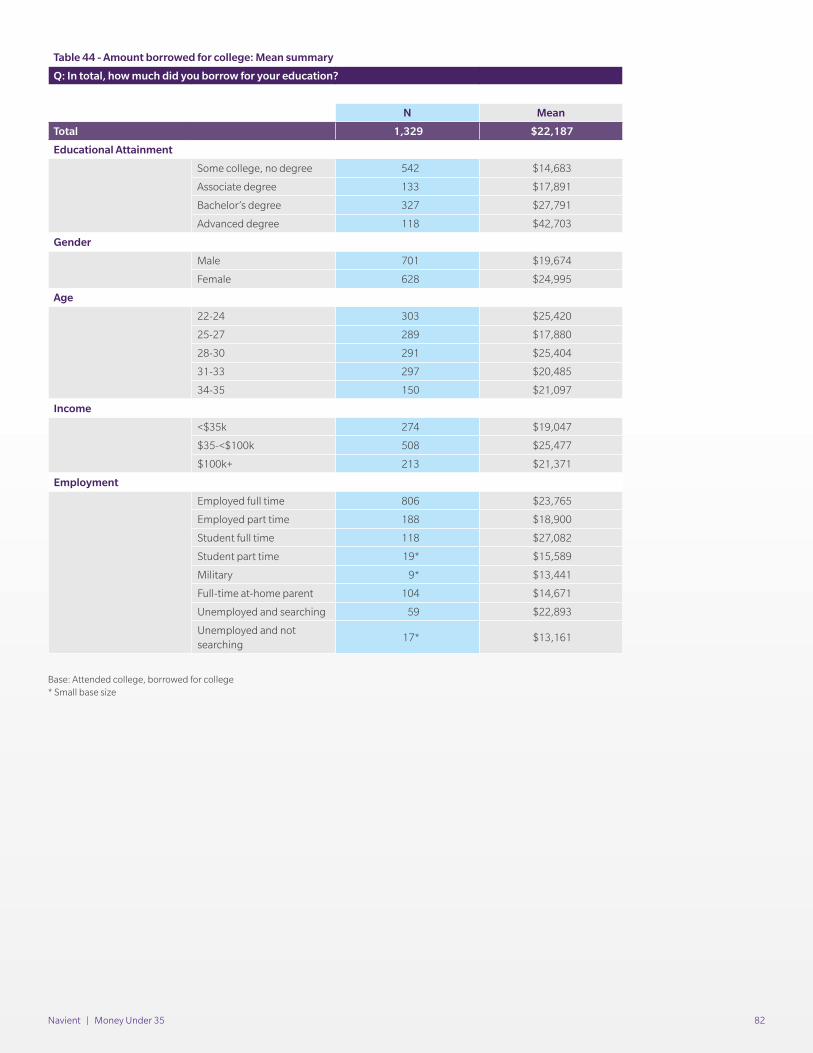
Navient | Money Under 35 82
Table 44 - Amount borrowed for college: Mean summary
Q: In total, how much did you borrow for your education?
N Mean
Total 1,329 $22,187
Educational Attainment
Some college, no degree 542 $14,683
Associate degree 133 $17,891
Bachelor’s degree 327 $27,791
Advanced degree 118 $42,703
Gender
Male 701 $19,674
Female 628 $24,995
Age
22-24 303 $25,420
25-27 289 $17,880
28-30 291 $25,404
31-33 297 $20,485
34-35 150 $21,097
Income
<$35k 274 $19,047
$35-<$100k 508 $25,477
$100k+ 213 $21,371
Employment
Employed full time 806 $23,765
Employed part time 188 $18,900
Student full time 118 $27,082
Student part time 19* $15,589
Military 9* $13,441
Full-time at-home parent 104 $14,671
Unemployed and searching 59 $22,893
Unemployed and not searching
17* $13,161
Base: Attended college, borrowed for college* Small base size
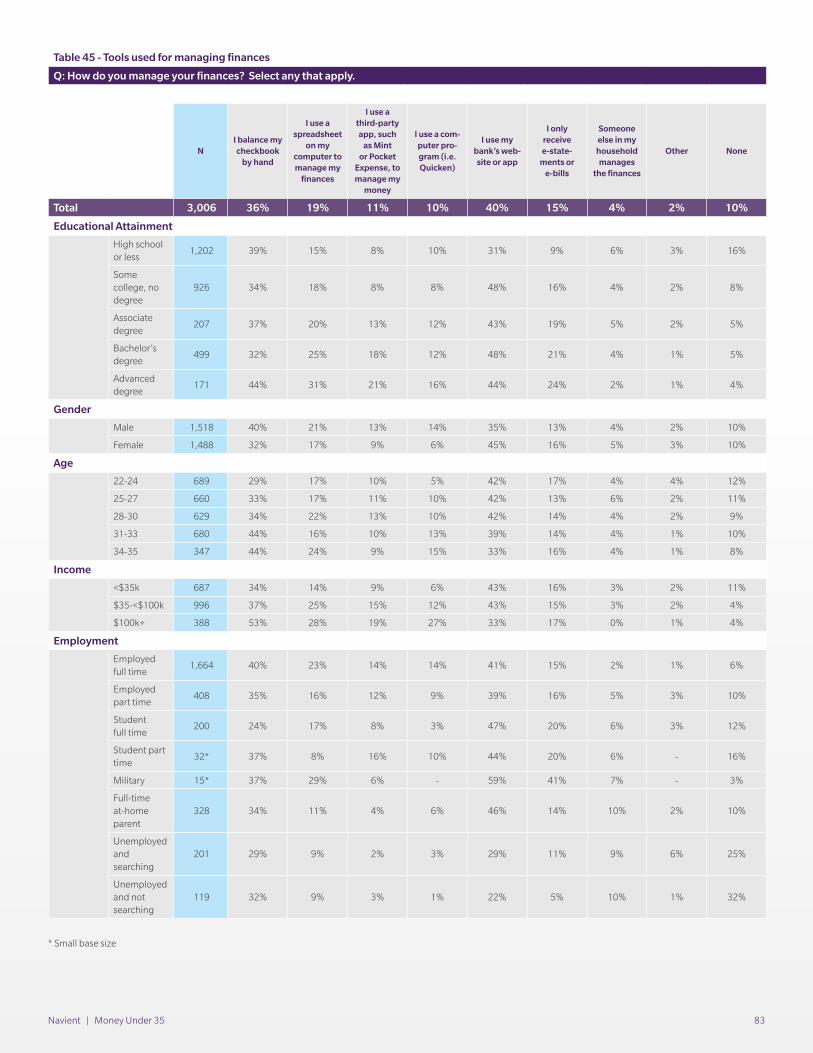
Navient | Money Under 35 83
Table 45 - Tools used for managing finances
Q: How do you manage your finances? Select any that apply.
NI balance my checkbook
by hand
I use a spreadsheet
on my computer to manage my
finances
I use a third-party app, such
as Mint or Pocket
Expense, to manage my
money
I use a com-puter pro-gram (i.e. Quicken)
I use my bank’s web-site or app
I only receive e-state-
ments or e-bills
Someone else in my household manages
the finances
Other None
Total 3,006 36% 19% 11% 10% 40% 15% 4% 2% 10%
Educational Attainment
High school or less
1,202 39% 15% 8% 10% 31% 9% 6% 3% 16%
Some college, no degree
926 34% 18% 8% 8% 48% 16% 4% 2% 8%
Associate degree
207 37% 20% 13% 12% 43% 19% 5% 2% 5%
Bachelor’s degree
499 32% 25% 18% 12% 48% 21% 4% 1% 5%
Advanced degree
171 44% 31% 21% 16% 44% 24% 2% 1% 4%
Gender
Male 1,518 40% 21% 13% 14% 35% 13% 4% 2% 10%
Female 1,488 32% 17% 9% 6% 45% 16% 5% 3% 10%
Age
22-24 689 29% 17% 10% 5% 42% 17% 4% 4% 12%
25-27 660 33% 17% 11% 10% 42% 13% 6% 2% 11%
28-30 629 34% 22% 13% 10% 42% 14% 4% 2% 9%
31-33 680 44% 16% 10% 13% 39% 14% 4% 1% 10%
34-35 347 44% 24% 9% 15% 33% 16% 4% 1% 8%
Income
<$35k 687 34% 14% 9% 6% 43% 16% 3% 2% 11%
$35-<$100k 996 37% 25% 15% 12% 43% 15% 3% 2% 4%
$100k+ 388 53% 28% 19% 27% 33% 17% 0% 1% 4%
Employment
Employed full time
1,664 40% 23% 14% 14% 41% 15% 2% 1% 6%
Employed part time
408 35% 16% 12% 9% 39% 16% 5% 3% 10%
Student full time
200 24% 17% 8% 3% 47% 20% 6% 3% 12%
Student part time
32* 37% 8% 16% 10% 44% 20% 6% - 16%
Military 15* 37% 29% 6% - 59% 41% 7% - 3%
Full-time at-home parent
328 34% 11% 4% 6% 46% 14% 10% 2% 10%
Unemployed and searching
201 29% 9% 2% 3% 29% 11% 9% 6% 25%
Unemployed and not searching
119 32% 9% 3% 1% 22% 5% 10% 1% 32%
* Small base size
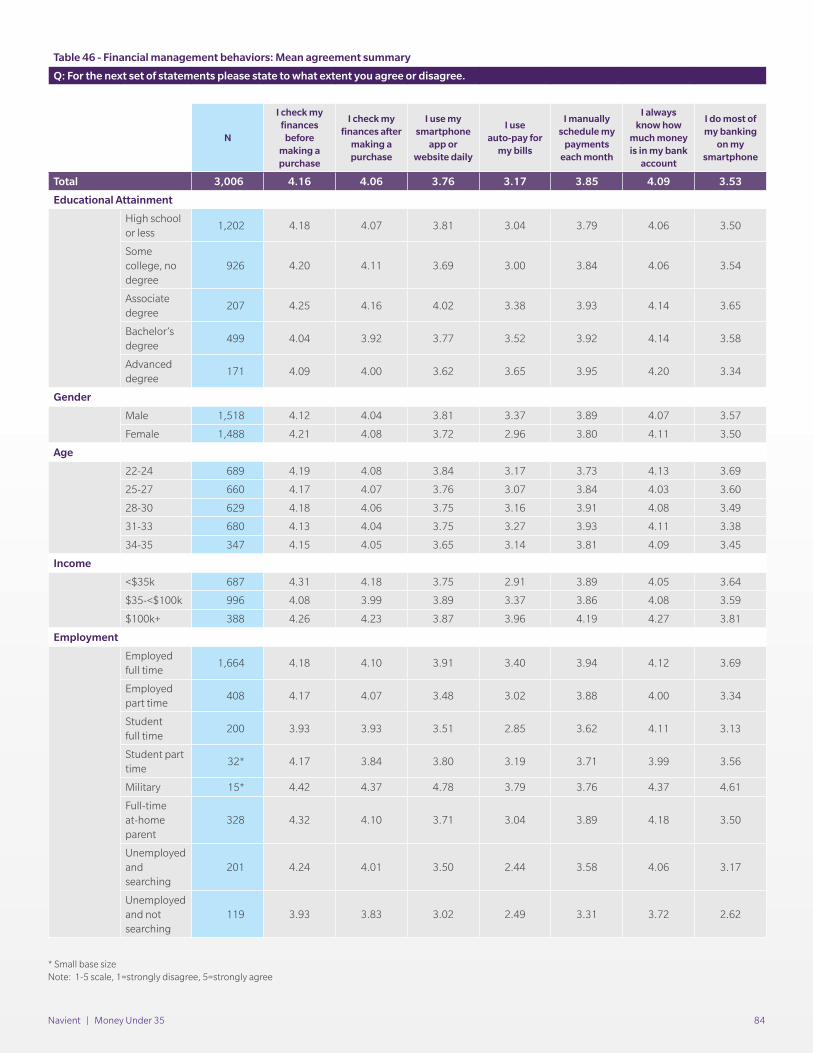
Navient | Money Under 35 84
Table 46 - Financial management behaviors: Mean agreement summary
Q: For the next set of statements please state to what extent you agree or disagree.
N
I check my finances
before making a purchase
I check my finances after
making a purchase
I use my smartphone
app or website daily
I use auto-pay for
my bills
I manually schedule my
payments each month
I always know how
much money is in my bank
account
I do most of my banking
on my smartphone
Total 3,006 4.16 4.06 3.76 3.17 3.85 4.09 3.53
Educational Attainment
High school or less
1,202 4.18 4.07 3.81 3.04 3.79 4.06 3.50
Some college, no degree
926 4.20 4.11 3.69 3.00 3.84 4.06 3.54
Associate degree
207 4.25 4.16 4.02 3.38 3.93 4.14 3.65
Bachelor’s degree
499 4.04 3.92 3.77 3.52 3.92 4.14 3.58
Advanced degree
171 4.09 4.00 3.62 3.65 3.95 4.20 3.34
Gender
Male 1,518 4.12 4.04 3.81 3.37 3.89 4.07 3.57
Female 1,488 4.21 4.08 3.72 2.96 3.80 4.11 3.50
Age
22-24 689 4.19 4.08 3.84 3.17 3.73 4.13 3.69
25-27 660 4.17 4.07 3.76 3.07 3.84 4.03 3.60
28-30 629 4.18 4.06 3.75 3.16 3.91 4.08 3.49
31-33 680 4.13 4.04 3.75 3.27 3.93 4.11 3.38
34-35 347 4.15 4.05 3.65 3.14 3.81 4.09 3.45
Income
<$35k 687 4.31 4.18 3.75 2.91 3.89 4.05 3.64
$35-<$100k 996 4.08 3.99 3.89 3.37 3.86 4.08 3.59
$100k+ 388 4.26 4.23 3.87 3.96 4.19 4.27 3.81
Employment
Employed full time
1,664 4.18 4.10 3.91 3.40 3.94 4.12 3.69
Employed part time
408 4.17 4.07 3.48 3.02 3.88 4.00 3.34
Student full time
200 3.93 3.93 3.51 2.85 3.62 4.11 3.13
Student part time
32* 4.17 3.84 3.80 3.19 3.71 3.99 3.56
Military 15* 4.42 4.37 4.78 3.79 3.76 4.37 4.61
Full-time at-home parent
328 4.32 4.10 3.71 3.04 3.89 4.18 3.50
Unemployed and searching
201 4.24 4.01 3.50 2.44 3.58 4.06 3.17
Unemployed and not searching
119 3.93 3.83 3.02 2.49 3.31 3.72 2.62
* Small base sizeNote: 1-5 scale, 1=strongly disagree, 5=strongly agree
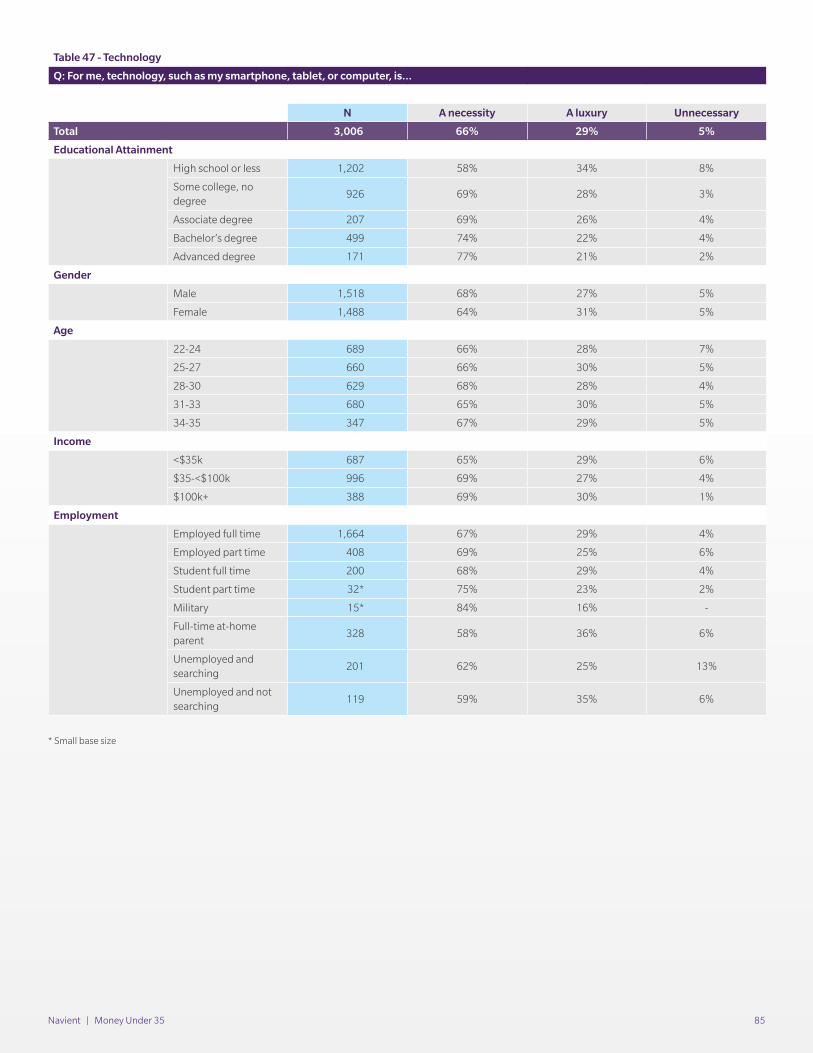
Navient | Money Under 35 85
Table 47 - Technology
Q: For me, technology, such as my smartphone, tablet, or computer, is...
N A necessity A luxury Unnecessary
Total 3,006 66% 29% 5%
Educational Attainment
High school or less 1,202 58% 34% 8%
Some college, no degree
926 69% 28% 3%
Associate degree 207 69% 26% 4%
Bachelor’s degree 499 74% 22% 4%
Advanced degree 171 77% 21% 2%
Gender
Male 1,518 68% 27% 5%
Female 1,488 64% 31% 5%
Age
22-24 689 66% 28% 7%
25-27 660 66% 30% 5%
28-30 629 68% 28% 4%
31-33 680 65% 30% 5%
34-35 347 67% 29% 5%
Income
<$35k 687 65% 29% 6%
$35-<$100k 996 69% 27% 4%
$100k+ 388 69% 30% 1%
Employment
Employed full time 1,664 67% 29% 4%
Employed part time 408 69% 25% 6%
Student full time 200 68% 29% 4%
Student part time 32* 75% 23% 2%
Military 15* 84% 16% -
Full-time at-home parent
328 58% 36% 6%
Unemployed and searching
201 62% 25% 13%
Unemployed and not searching
119 59% 35% 6%
* Small base size
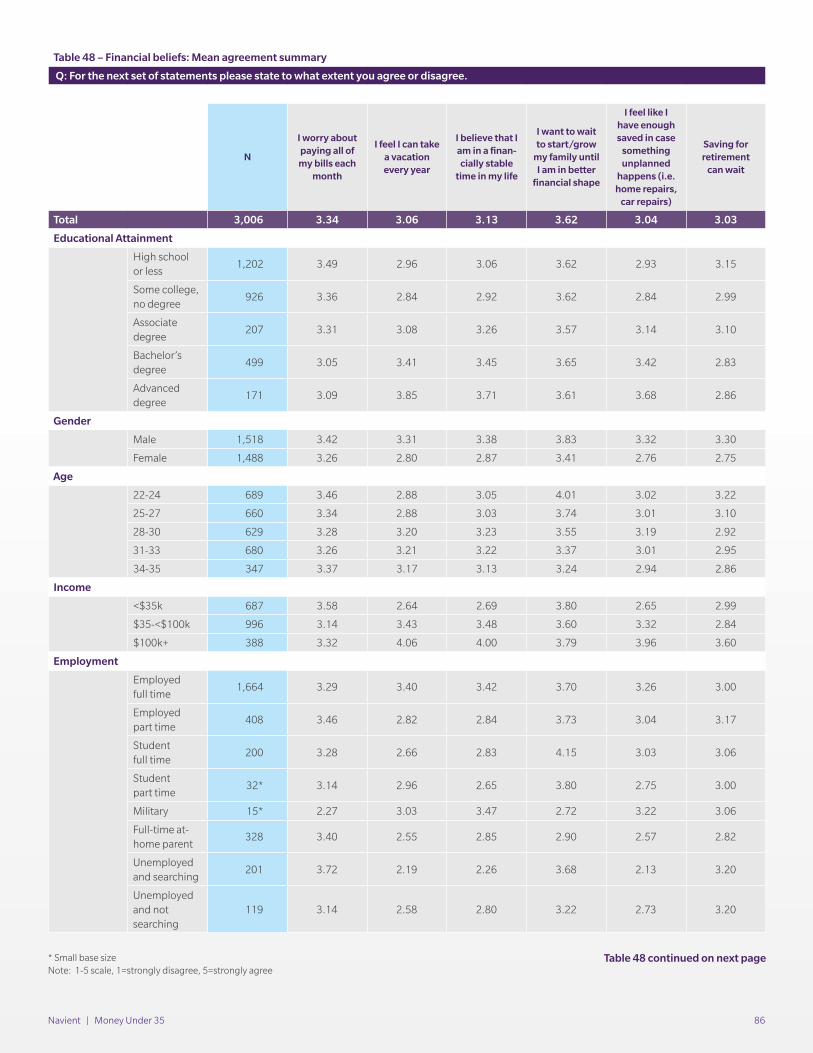
Navient | Money Under 35 86
Table 48 – Financial beliefs: Mean agreement summary
Q: For the next set of statements please state to what extent you agree or disagree.
N
I worry about paying all of my bills each
month
I feel I can take a vacation every year
I believe that I am in a finan-cially stable
time in my life
I want to wait to start/grow
my family until I am in better
financial shape
I feel like I have enough saved in case
something unplanned
happens (i.e. home repairs,
car repairs)
Saving for retirement
can wait
Total 3,006 3.34 3.06 3.13 3.62 3.04 3.03
Educational Attainment
High school or less
1,202 3.49 2.96 3.06 3.62 2.93 3.15
Some college, no degree
926 3.36 2.84 2.92 3.62 2.84 2.99
Associate degree
207 3.31 3.08 3.26 3.57 3.14 3.10
Bachelor’s degree
499 3.05 3.41 3.45 3.65 3.42 2.83
Advanced degree
171 3.09 3.85 3.71 3.61 3.68 2.86
Gender
Male 1,518 3.42 3.31 3.38 3.83 3.32 3.30
Female 1,488 3.26 2.80 2.87 3.41 2.76 2.75
Age
22-24 689 3.46 2.88 3.05 4.01 3.02 3.22
25-27 660 3.34 2.88 3.03 3.74 3.01 3.10
28-30 629 3.28 3.20 3.23 3.55 3.19 2.92
31-33 680 3.26 3.21 3.22 3.37 3.01 2.95
34-35 347 3.37 3.17 3.13 3.24 2.94 2.86
Income
<$35k 687 3.58 2.64 2.69 3.80 2.65 2.99
$35-<$100k 996 3.14 3.43 3.48 3.60 3.32 2.84
$100k+ 388 3.32 4.06 4.00 3.79 3.96 3.60
Employment
Employed full time
1,664 3.29 3.40 3.42 3.70 3.26 3.00
Employed part time
408 3.46 2.82 2.84 3.73 3.04 3.17
Student full time
200 3.28 2.66 2.83 4.15 3.03 3.06
Student part time
32* 3.14 2.96 2.65 3.80 2.75 3.00
Military 15* 2.27 3.03 3.47 2.72 3.22 3.06
Full-time at-home parent
328 3.40 2.55 2.85 2.90 2.57 2.82
Unemployed and searching
201 3.72 2.19 2.26 3.68 2.13 3.20
Unemployed and not searching
119 3.14 2.58 2.80 3.22 2.73 3.20
* Small base sizeNote: 1-5 scale, 1=strongly disagree, 5=strongly agree
Table 48 continued on next page
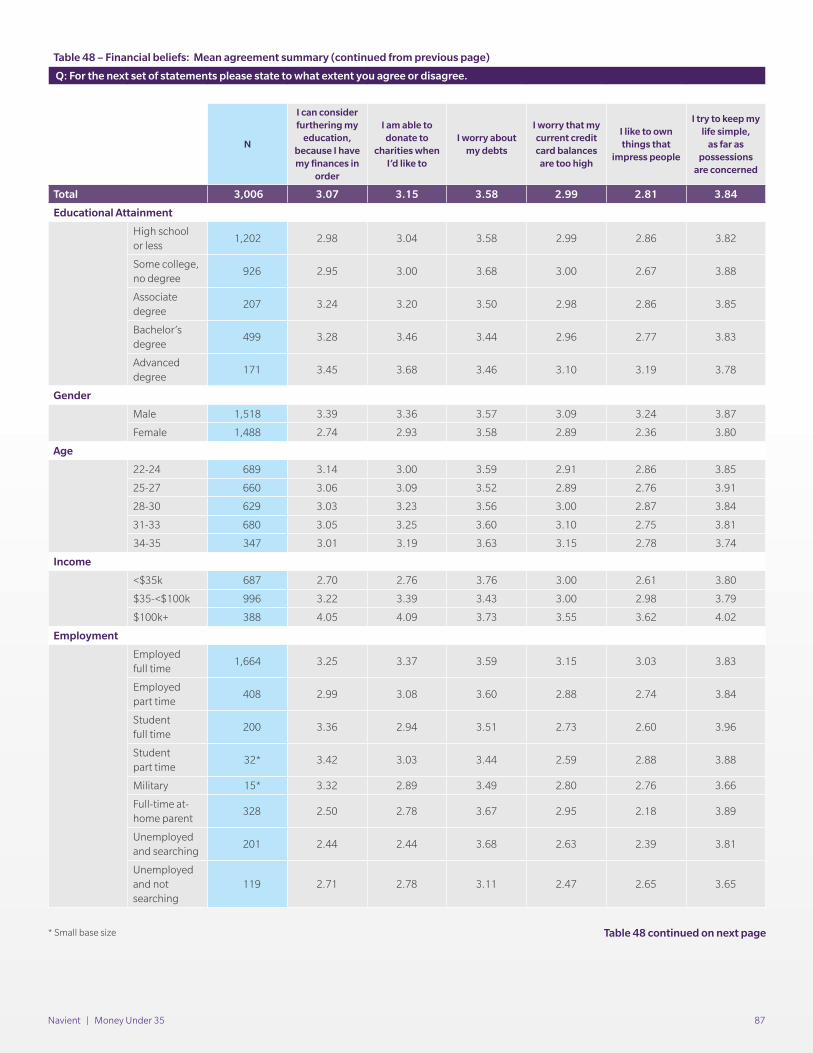
Navient | Money Under 35 87
Table 48 – Financial beliefs: Mean agreement summary (continued from previous page)
Q: For the next set of statements please state to what extent you agree or disagree.
N
I can consider furthering my
education, because I have my finances in
order
I am able to donate to
charities when I’d like to
I worry about my debts
I worry that my current credit card balances
are too high
I like to own things that
impress people
I try to keep my life simple,
as far as possessions
are concerned
Total 3,006 3.07 3.15 3.58 2.99 2.81 3.84
Educational Attainment
High school or less
1,202 2.98 3.04 3.58 2.99 2.86 3.82
Some college, no degree
926 2.95 3.00 3.68 3.00 2.67 3.88
Associate degree
207 3.24 3.20 3.50 2.98 2.86 3.85
Bachelor’s degree
499 3.28 3.46 3.44 2.96 2.77 3.83
Advanced degree
171 3.45 3.68 3.46 3.10 3.19 3.78
Gender
Male 1,518 3.39 3.36 3.57 3.09 3.24 3.87
Female 1,488 2.74 2.93 3.58 2.89 2.36 3.80
Age
22-24 689 3.14 3.00 3.59 2.91 2.86 3.85
25-27 660 3.06 3.09 3.52 2.89 2.76 3.91
28-30 629 3.03 3.23 3.56 3.00 2.87 3.84
31-33 680 3.05 3.25 3.60 3.10 2.75 3.81
34-35 347 3.01 3.19 3.63 3.15 2.78 3.74
Income
<$35k 687 2.70 2.76 3.76 3.00 2.61 3.80
$35-<$100k 996 3.22 3.39 3.43 3.00 2.98 3.79
$100k+ 388 4.05 4.09 3.73 3.55 3.62 4.02
Employment
Employed full time
1,664 3.25 3.37 3.59 3.15 3.03 3.83
Employed part time
408 2.99 3.08 3.60 2.88 2.74 3.84
Student full time
200 3.36 2.94 3.51 2.73 2.60 3.96
Student part time
32* 3.42 3.03 3.44 2.59 2.88 3.88
Military 15* 3.32 2.89 3.49 2.80 2.76 3.66
Full-time at-home parent
328 2.50 2.78 3.67 2.95 2.18 3.89
Unemployed and searching
201 2.44 2.44 3.68 2.63 2.39 3.81
Unemployed and not searching
119 2.71 2.78 3.11 2.47 2.65 3.65
* Small base size Table 48 continued on next page
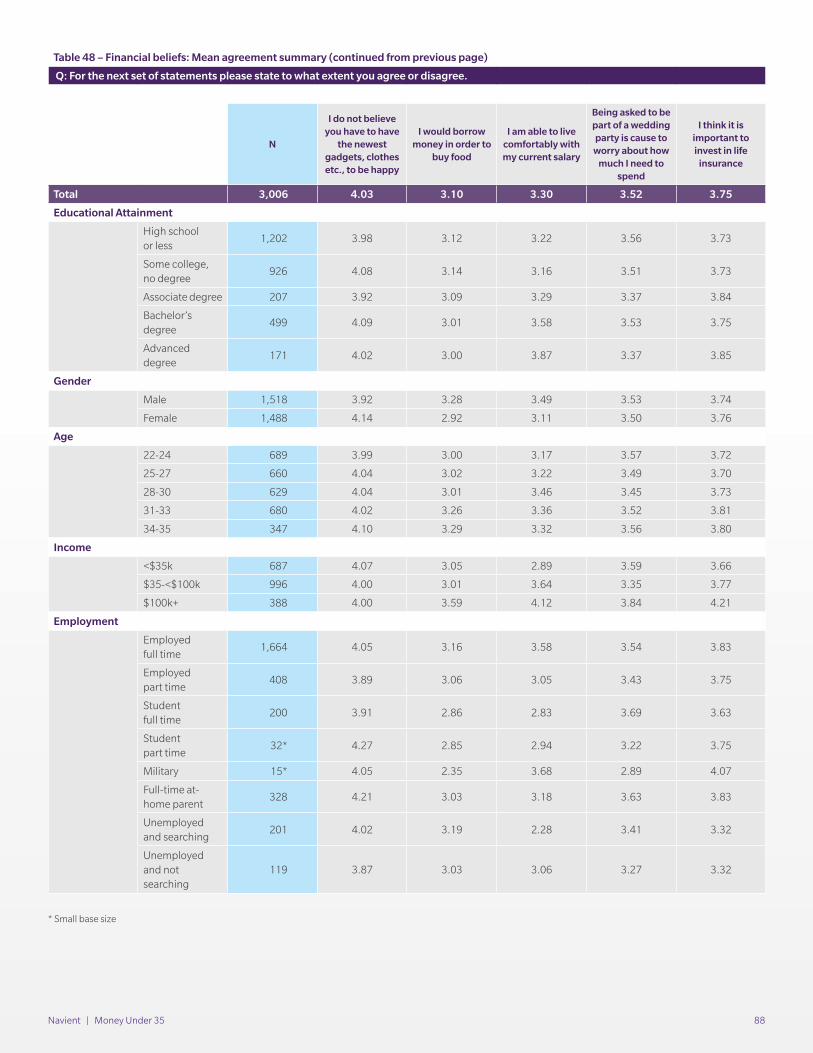
Navient | Money Under 35 88
Table 48 – Financial beliefs: Mean agreement summary (continued from previous page)
Q: For the next set of statements please state to what extent you agree or disagree.
N
I do not believe you have to have
the newest gadgets, clothes etc., to be happy
I would borrow money in order to
buy food
I am able to live comfortably with my current salary
Being asked to be part of a wedding party is cause to
worry about how much I need to
spend
I think it is important to invest in life
insurance
Total 3,006 4.03 3.10 3.30 3.52 3.75
Educational Attainment
High school or less
1,202 3.98 3.12 3.22 3.56 3.73
Some college, no degree
926 4.08 3.14 3.16 3.51 3.73
Associate degree 207 3.92 3.09 3.29 3.37 3.84
Bachelor’s degree
499 4.09 3.01 3.58 3.53 3.75
Advanced degree
171 4.02 3.00 3.87 3.37 3.85
Gender
Male 1,518 3.92 3.28 3.49 3.53 3.74
Female 1,488 4.14 2.92 3.11 3.50 3.76
Age
22-24 689 3.99 3.00 3.17 3.57 3.72
25-27 660 4.04 3.02 3.22 3.49 3.70
28-30 629 4.04 3.01 3.46 3.45 3.73
31-33 680 4.02 3.26 3.36 3.52 3.81
34-35 347 4.10 3.29 3.32 3.56 3.80
Income
<$35k 687 4.07 3.05 2.89 3.59 3.66
$35-<$100k 996 4.00 3.01 3.64 3.35 3.77
$100k+ 388 4.00 3.59 4.12 3.84 4.21
Employment
Employed full time
1,664 4.05 3.16 3.58 3.54 3.83
Employed part time
408 3.89 3.06 3.05 3.43 3.75
Student full time
200 3.91 2.86 2.83 3.69 3.63
Student part time
32* 4.27 2.85 2.94 3.22 3.75
Military 15* 4.05 2.35 3.68 2.89 4.07
Full-time at-home parent
328 4.21 3.03 3.18 3.63 3.83
Unemployed and searching
201 4.02 3.19 2.28 3.41 3.32
Unemployed and not searching
119 3.87 3.03 3.06 3.27 3.32
* Small base size
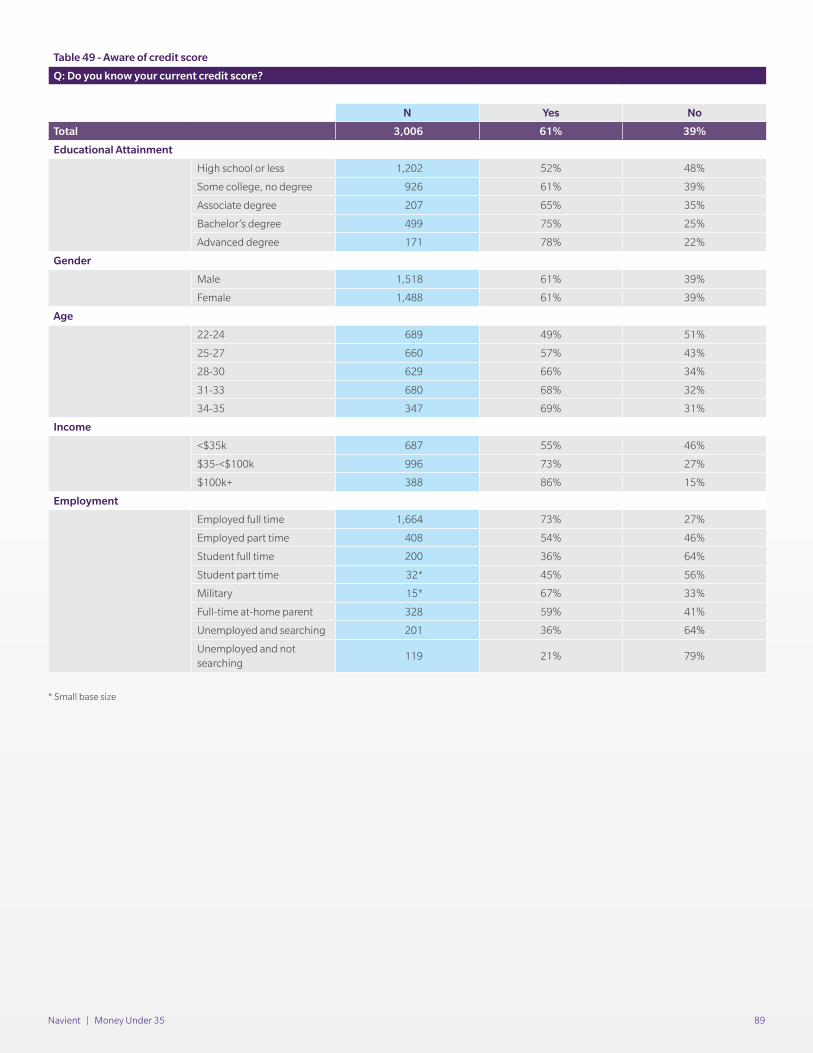
Navient | Money Under 35 89
Table 49 - Aware of credit score
Q: Do you know your current credit score?
N Yes No
Total 3,006 61% 39%
Educational Attainment
High school or less 1,202 52% 48%
Some college, no degree 926 61% 39%
Associate degree 207 65% 35%
Bachelor’s degree 499 75% 25%
Advanced degree 171 78% 22%
Gender
Male 1,518 61% 39%
Female 1,488 61% 39%
Age
22-24 689 49% 51%
25-27 660 57% 43%
28-30 629 66% 34%
31-33 680 68% 32%
34-35 347 69% 31%
Income
<$35k 687 55% 46%
$35-<$100k 996 73% 27%
$100k+ 388 86% 15%
Employment
Employed full time 1,664 73% 27%
Employed part time 408 54% 46%
Student full time 200 36% 64%
Student part time 32* 45% 56%
Military 15* 67% 33%
Full-time at-home parent 328 59% 41%
Unemployed and searching 201 36% 64%
Unemployed and not searching
119 21% 79%
* Small base size
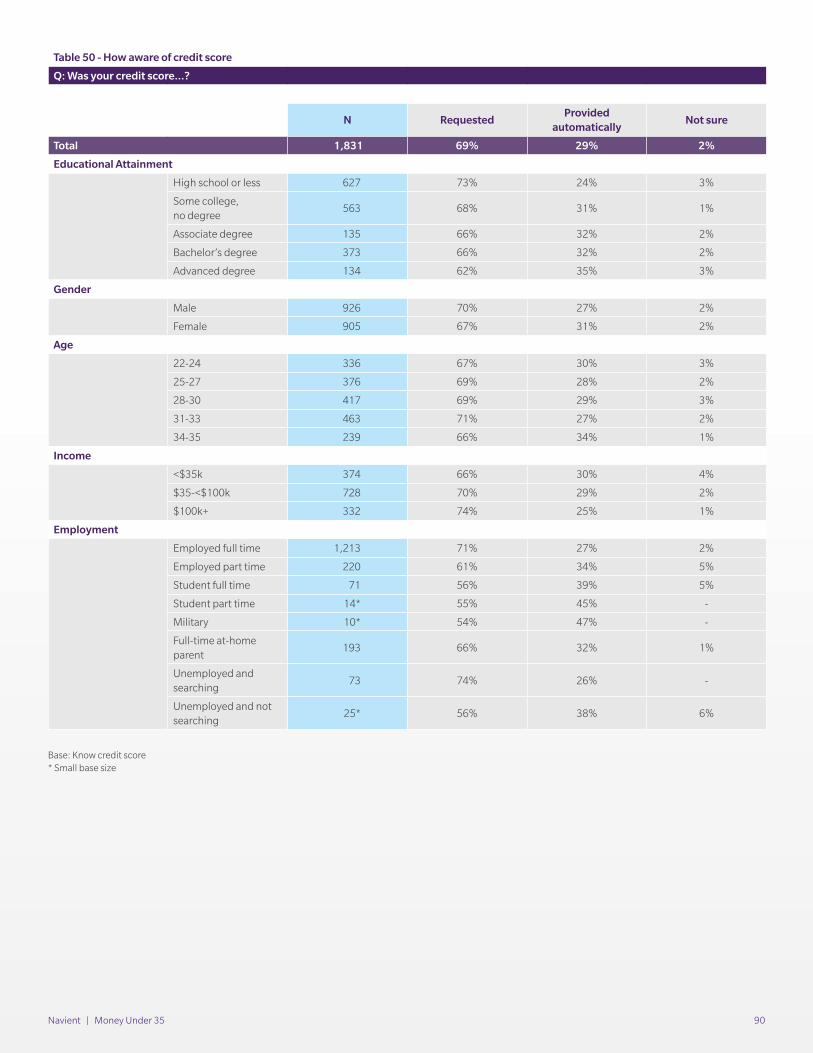
Navient | Money Under 35 90
Table 50 - How aware of credit score
Q: Was your credit score...?
N RequestedProvided
automaticallyNot sure
Total 1,831 69% 29% 2%
Educational Attainment
High school or less 627 73% 24% 3%
Some college, no degree
563 68% 31% 1%
Associate degree 135 66% 32% 2%
Bachelor’s degree 373 66% 32% 2%
Advanced degree 134 62% 35% 3%
Gender
Male 926 70% 27% 2%
Female 905 67% 31% 2%
Age
22-24 336 67% 30% 3%
25-27 376 69% 28% 2%
28-30 417 69% 29% 3%
31-33 463 71% 27% 2%
34-35 239 66% 34% 1%
Income
<$35k 374 66% 30% 4%
$35-<$100k 728 70% 29% 2%
$100k+ 332 74% 25% 1%
Employment
Employed full time 1,213 71% 27% 2%
Employed part time 220 61% 34% 5%
Student full time 71 56% 39% 5%
Student part time 14* 55% 45% -
Military 10* 54% 47% -
Full-time at-home parent
193 66% 32% 1%
Unemployed and searching
73 74% 26% -
Unemployed and not searching
25* 56% 38% 6%
Base: Know credit score* Small base size
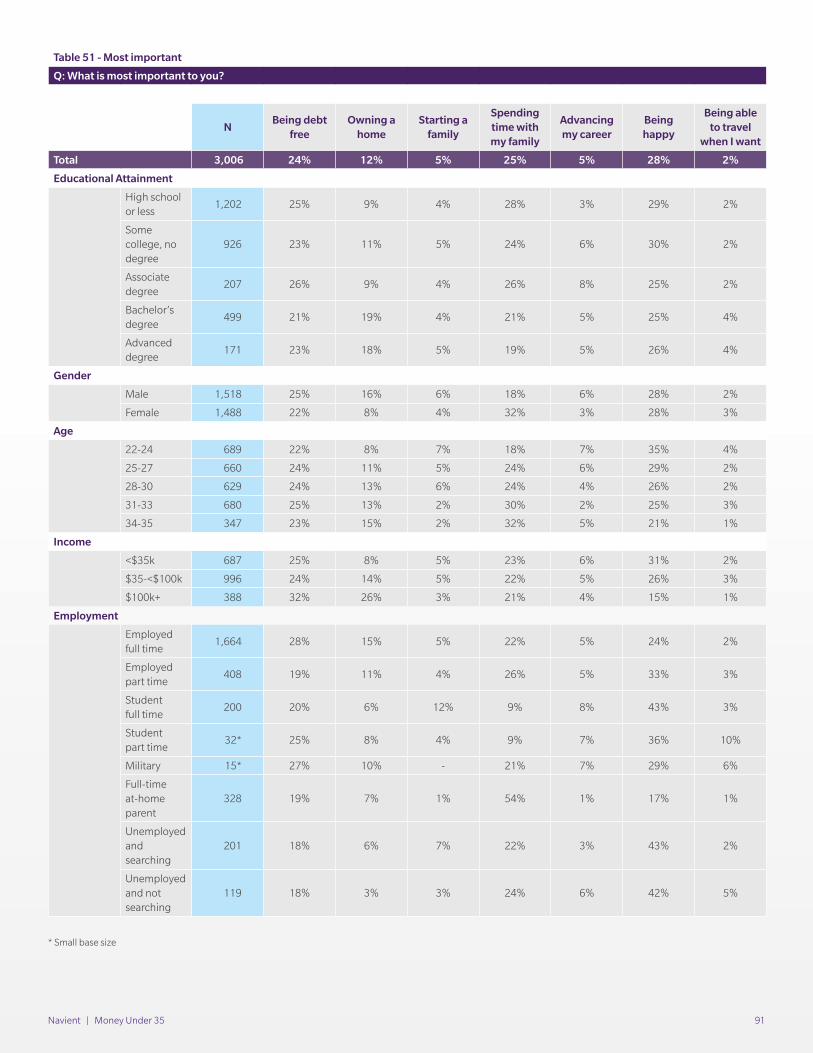
Navient | Money Under 35 91
Table 51 - Most important
Q: What is most important to you?
NBeing debt
freeOwning a
homeStarting a
family
Spending time with my family
Advancing my career
Being happy
Being able to travel
when I want
Total 3,006 24% 12% 5% 25% 5% 28% 2%
Educational Attainment
High school or less
1,202 25% 9% 4% 28% 3% 29% 2%
Some college, no degree
926 23% 11% 5% 24% 6% 30% 2%
Associate degree
207 26% 9% 4% 26% 8% 25% 2%
Bachelor’s degree
499 21% 19% 4% 21% 5% 25% 4%
Advanced degree
171 23% 18% 5% 19% 5% 26% 4%
Gender
Male 1,518 25% 16% 6% 18% 6% 28% 2%
Female 1,488 22% 8% 4% 32% 3% 28% 3%
Age
22-24 689 22% 8% 7% 18% 7% 35% 4%
25-27 660 24% 11% 5% 24% 6% 29% 2%
28-30 629 24% 13% 6% 24% 4% 26% 2%
31-33 680 25% 13% 2% 30% 2% 25% 3%
34-35 347 23% 15% 2% 32% 5% 21% 1%
Income
<$35k 687 25% 8% 5% 23% 6% 31% 2%
$35-<$100k 996 24% 14% 5% 22% 5% 26% 3%
$100k+ 388 32% 26% 3% 21% 4% 15% 1%
Employment
Employed full time
1,664 28% 15% 5% 22% 5% 24% 2%
Employed part time
408 19% 11% 4% 26% 5% 33% 3%
Student full time
200 20% 6% 12% 9% 8% 43% 3%
Student part time
32* 25% 8% 4% 9% 7% 36% 10%
Military 15* 27% 10% - 21% 7% 29% 6%
Full-time at-home parent
328 19% 7% 1% 54% 1% 17% 1%
Unemployed and searching
201 18% 6% 7% 22% 3% 43% 2%
Unemployed and not searching
119 18% 3% 3% 24% 6% 42% 5%
* Small base size
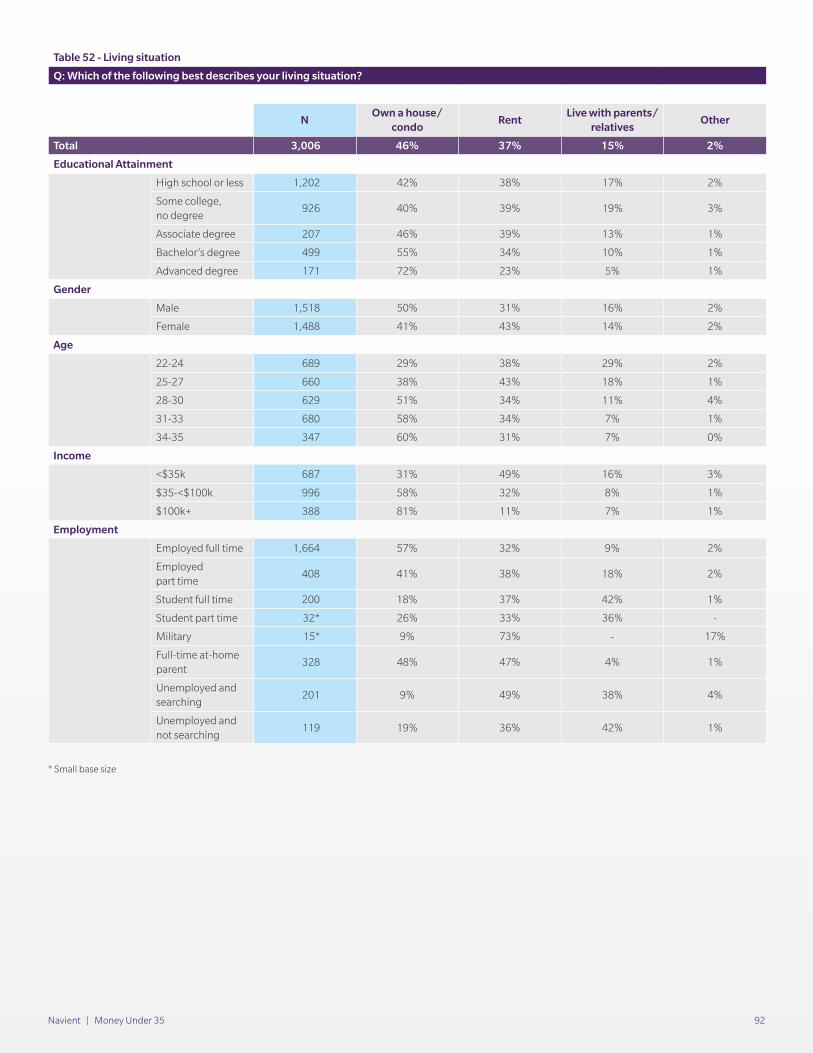
Navient | Money Under 35 92
Table 52 - Living situation
Q: Which of the following best describes your living situation?
NOwn a house/
condoRent
Live with parents/relatives
Other
Total 3,006 46% 37% 15% 2%
Educational Attainment
High school or less 1,202 42% 38% 17% 2%
Some college, no degree
926 40% 39% 19% 3%
Associate degree 207 46% 39% 13% 1%
Bachelor’s degree 499 55% 34% 10% 1%
Advanced degree 171 72% 23% 5% 1%
Gender
Male 1,518 50% 31% 16% 2%
Female 1,488 41% 43% 14% 2%
Age
22-24 689 29% 38% 29% 2%
25-27 660 38% 43% 18% 1%
28-30 629 51% 34% 11% 4%
31-33 680 58% 34% 7% 1%
34-35 347 60% 31% 7% 0%
Income
<$35k 687 31% 49% 16% 3%
$35-<$100k 996 58% 32% 8% 1%
$100k+ 388 81% 11% 7% 1%
Employment
Employed full time 1,664 57% 32% 9% 2%
Employed part time
408 41% 38% 18% 2%
Student full time 200 18% 37% 42% 1%
Student part time 32* 26% 33% 36% -
Military 15* 9% 73% - 17%
Full-time at-home parent
328 48% 47% 4% 1%
Unemployed and searching
201 9% 49% 38% 4%
Unemployed and not searching
119 19% 36% 42% 1%
* Small base size
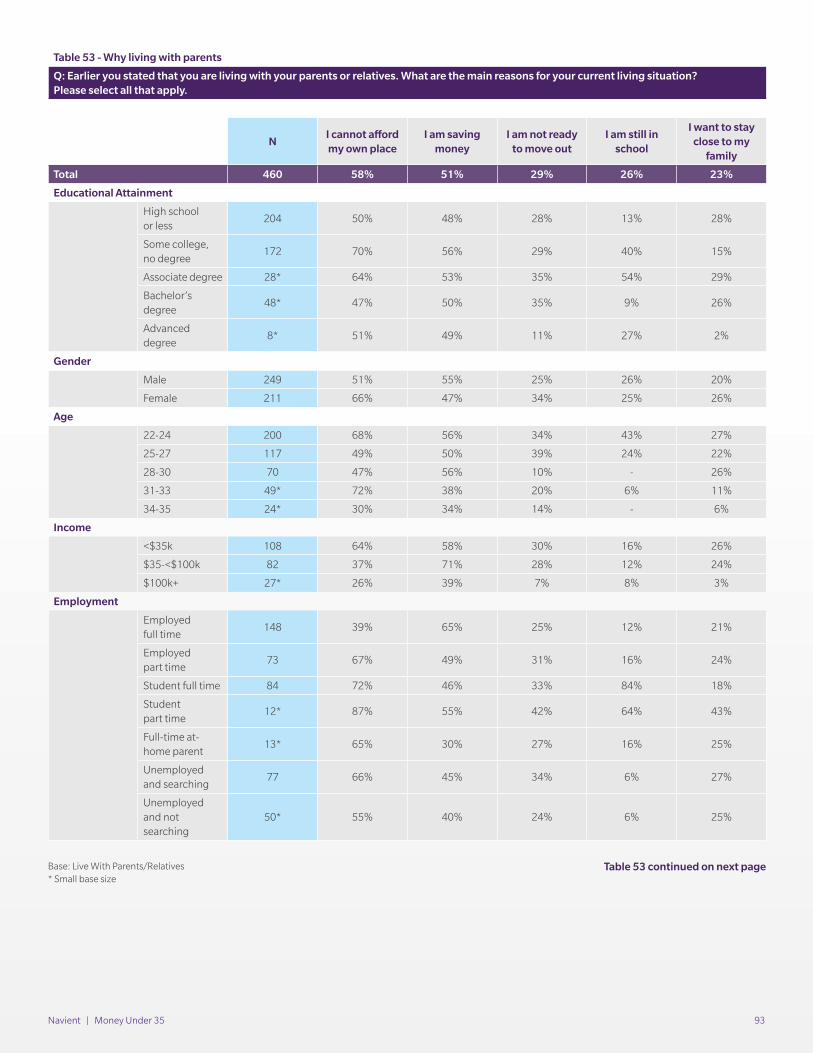
Navient | Money Under 35 93
Table 53 - Why living with parents
Q: Earlier you stated that you are living with your parents or relatives. What are the main reasons for your current living situation? Please select all that apply.
NI cannot afford my own place
I am saving money
I am not ready to move out
I am still in school
I want to stay close to my
family
Total 460 58% 51% 29% 26% 23%
Educational Attainment
High school or less
204 50% 48% 28% 13% 28%
Some college, no degree
172 70% 56% 29% 40% 15%
Associate degree 28* 64% 53% 35% 54% 29%
Bachelor’s degree
48* 47% 50% 35% 9% 26%
Advanced degree
8* 51% 49% 11% 27% 2%
Gender
Male 249 51% 55% 25% 26% 20%
Female 211 66% 47% 34% 25% 26%
Age
22-24 200 68% 56% 34% 43% 27%
25-27 117 49% 50% 39% 24% 22%
28-30 70 47% 56% 10% - 26%
31-33 49* 72% 38% 20% 6% 11%
34-35 24* 30% 34% 14% - 6%
Income
<$35k 108 64% 58% 30% 16% 26%
$35-<$100k 82 37% 71% 28% 12% 24%
$100k+ 27* 26% 39% 7% 8% 3%
Employment
Employed full time
148 39% 65% 25% 12% 21%
Employed part time
73 67% 49% 31% 16% 24%
Student full time 84 72% 46% 33% 84% 18%
Student part time
12* 87% 55% 42% 64% 43%
Full-time at-home parent
13* 65% 30% 27% 16% 25%
Unemployed and searching
77 66% 45% 34% 6% 27%
Unemployed and not searching
50* 55% 40% 24% 6% 25%
Base: Live With Parents/Relatives* Small base size
Table 53 continued on next page
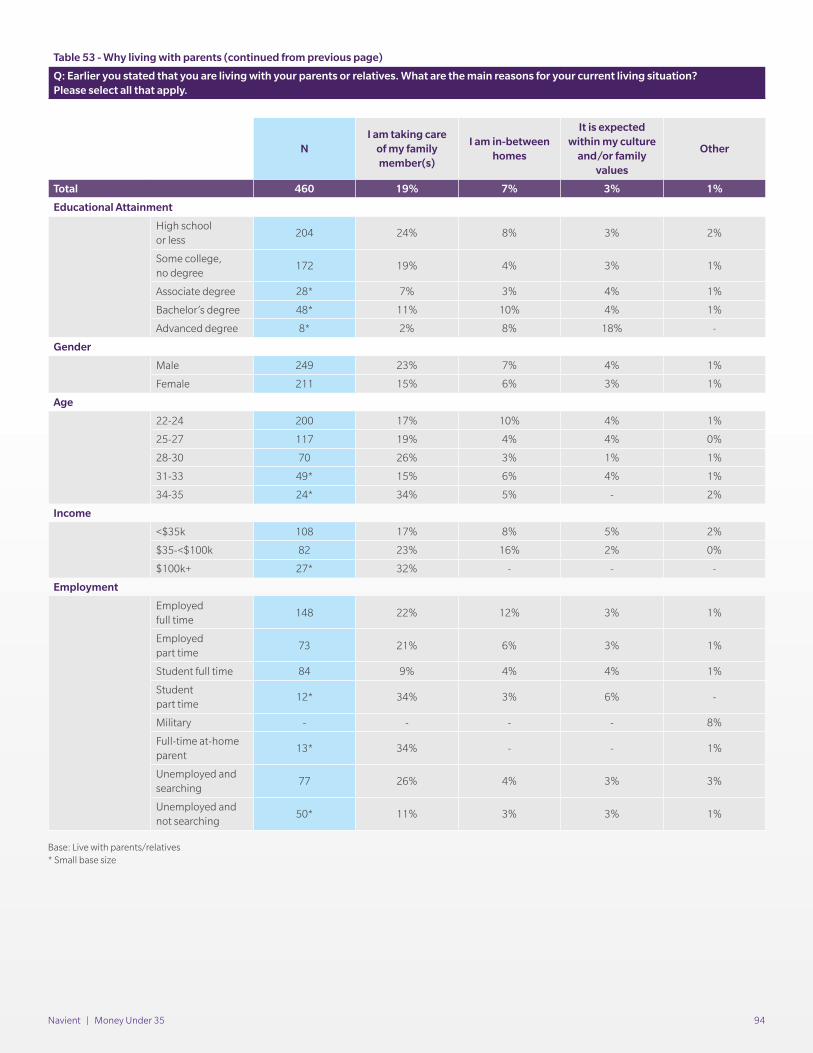
Navient | Money Under 35 94
Table 53 - Why living with parents (continued from previous page)
Q: Earlier you stated that you are living with your parents or relatives. What are the main reasons for your current living situation? Please select all that apply.
NI am taking care
of my family member(s)
I am in-between homes
It is expected within my culture
and/or family values
Other
Total 460 19% 7% 3% 1%
Educational Attainment
High school or less
204 24% 8% 3% 2%
Some college, no degree
172 19% 4% 3% 1%
Associate degree 28* 7% 3% 4% 1%
Bachelor’s degree 48* 11% 10% 4% 1%
Advanced degree 8* 2% 8% 18% -
Gender
Male 249 23% 7% 4% 1%
Female 211 15% 6% 3% 1%
Age
22-24 200 17% 10% 4% 1%
25-27 117 19% 4% 4% 0%
28-30 70 26% 3% 1% 1%
31-33 49* 15% 6% 4% 1%
34-35 24* 34% 5% - 2%
Income
<$35k 108 17% 8% 5% 2%
$35-<$100k 82 23% 16% 2% 0%
$100k+ 27* 32% - - -
Employment
Employed full time
148 22% 12% 3% 1%
Employed part time
73 21% 6% 3% 1%
Student full time 84 9% 4% 4% 1%
Student part time
12* 34% 3% 6% -
Military - - - - 8%
Full-time at-home parent
13* 34% - - 1%
Unemployed and searching
77 26% 4% 3% 3%
Unemployed and not searching
50* 11% 3% 3% 1%
Base: Live with parents/relatives* Small base size
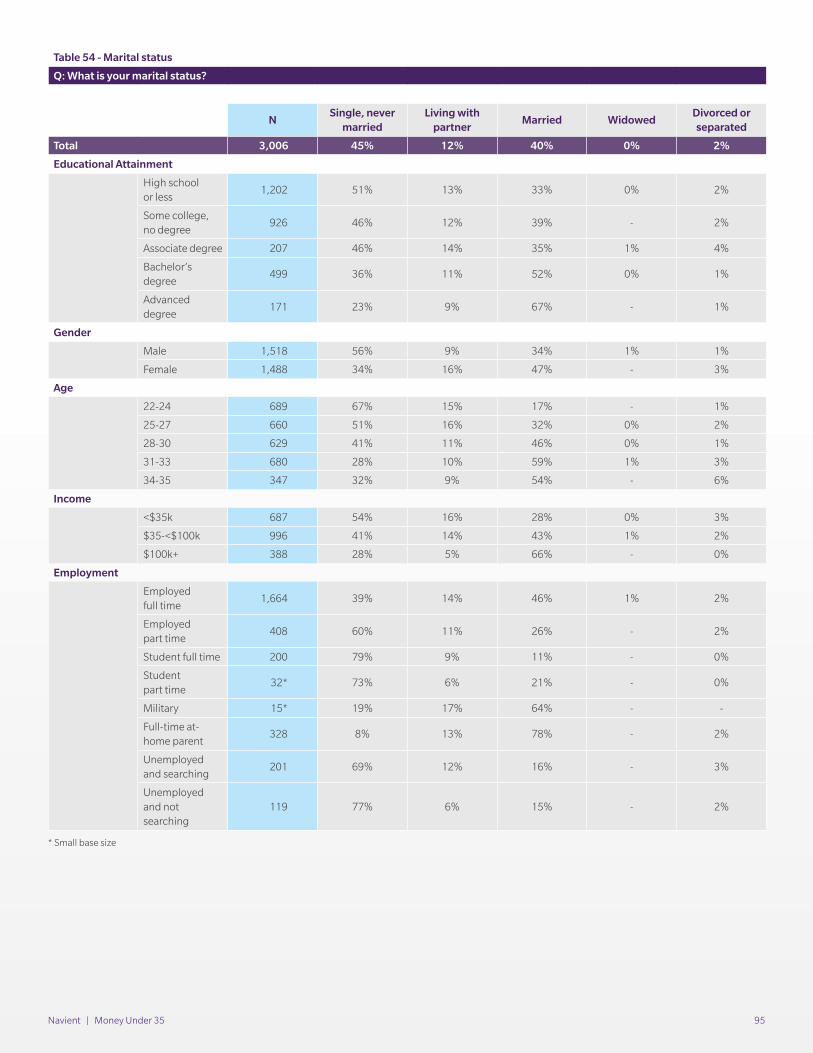
Navient | Money Under 35 95
Table 54 - Marital status
Q: What is your marital status?
NSingle, never
marriedLiving with
partnerMarried Widowed
Divorced or separated
Total 3,006 45% 12% 40% 0% 2%
Educational Attainment
High school or less
1,202 51% 13% 33% 0% 2%
Some college, no degree
926 46% 12% 39% - 2%
Associate degree 207 46% 14% 35% 1% 4%
Bachelor’s degree
499 36% 11% 52% 0% 1%
Advanced degree
171 23% 9% 67% - 1%
Gender
Male 1,518 56% 9% 34% 1% 1%
Female 1,488 34% 16% 47% - 3%
Age
22-24 689 67% 15% 17% - 1%
25-27 660 51% 16% 32% 0% 2%
28-30 629 41% 11% 46% 0% 1%
31-33 680 28% 10% 59% 1% 3%
34-35 347 32% 9% 54% - 6%
Income
<$35k 687 54% 16% 28% 0% 3%
$35-<$100k 996 41% 14% 43% 1% 2%
$100k+ 388 28% 5% 66% - 0%
Employment
Employed full time
1,664 39% 14% 46% 1% 2%
Employed part time
408 60% 11% 26% - 2%
Student full time 200 79% 9% 11% - 0%
Student part time
32* 73% 6% 21% - 0%
Military 15* 19% 17% 64% - -
Full-time at-home parent
328 8% 13% 78% - 2%
Unemployed and searching
201 69% 12% 16% - 3%
Unemployed and not searching
119 77% 6% 15% - 2%
* Small base size
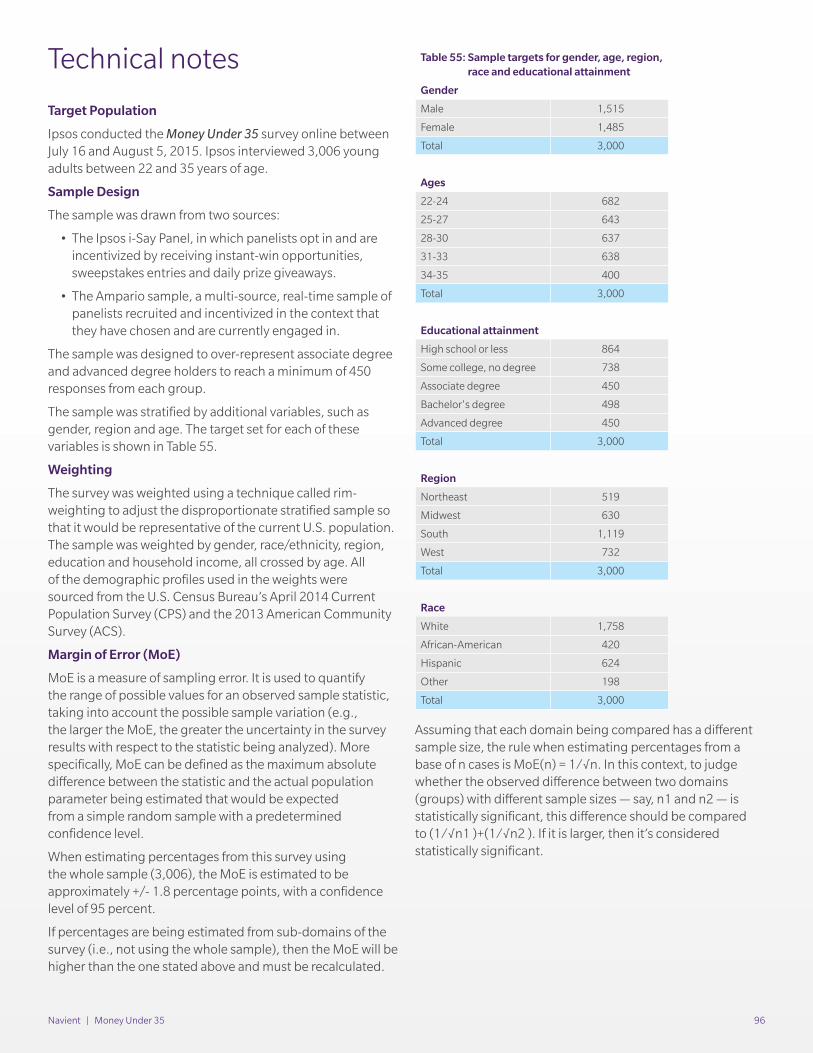
Navient | Money Under 35 96
Technical notes
Target Population
Ipsos conducted the Money Under 35 survey online between July 16 and August 5, 2015. Ipsos interviewed 3,006 young adults between 22 and 35 years of age.
Sample Design
The sample was drawn from two sources:
• The Ipsos i-Say Panel, in which panelists opt in and are incentivized by receiving instant-win opportunities, sweepstakes entries and daily prize giveaways.
• The Ampario sample, a multi-source, real-time sample of panelists recruited and incentivized in the context that they have chosen and are currently engaged in.
The sample was designed to over-represent associate degree and advanced degree holders to reach a minimum of 450 responses from each group.
The sample was stratified by additional variables, such as gender, region and age. The target set for each of these variables is shown in Table 55.
Weighting
The survey was weighted using a technique called rim-weighting to adjust the disproportionate stratified sample so that it would be representative of the current U.S. population. The sample was weighted by gender, race/ethnicity, region, education and household income, all crossed by age. All of the demographic profiles used in the weights were sourced from the U.S. Census Bureau’s April 2014 Current Population Survey (CPS) and the 2013 American Community Survey (ACS).
Margin of Error (MoE)
MoE is a measure of sampling error. It is used to quantify the range of possible values for an observed sample statistic, taking into account the possible sample variation (e.g., the larger the MoE, the greater the uncertainty in the survey results with respect to the statistic being analyzed). More specifically, MoE can be defined as the maximum absolute difference between the statistic and the actual population parameter being estimated that would be expected from a simple random sample with a predetermined confidence level.
When estimating percentages from this survey using the whole sample (3,006), the MoE is estimated to be approximately +/- 1.8 percentage points, with a confidence level of 95 percent.
If percentages are being estimated from sub-domains of the survey (i.e., not using the whole sample), then the MoE will be higher than the one stated above and must be recalculated.
Assuming that each domain being compared has a different sample size, the rule when estimating percentages from a base of n cases is MoE(n) = 1 ⁄ √n. In this context, to judge whether the observed difference between two domains (groups) with different sample sizes — say, n1 and n2 — is statistically significant, this difference should be compared to (1 ⁄ √n1 )+(1 ⁄ √n2 ). If it is larger, then it’s considered statistically significant.
Table 55: Sample targets for gender, age, region, race and educational attainment
Gender
Male 1,515
Female 1,485
Total 3,000
Ages
22-24 682
25-27 643
28-30 637
31-33 638
34-35 400
Total 3,000
Educational attainment
High school or less 864
Some college, no degree 738
Associate degree 450
Bachelor's degree 498
Advanced degree 450
Total 3,000
Region
Northeast 519
Midwest 630
South 1,119
West 732
Total 3,000
Race
White 1,758
African-American 420
Hispanic 624
Other 198
Total 3,000
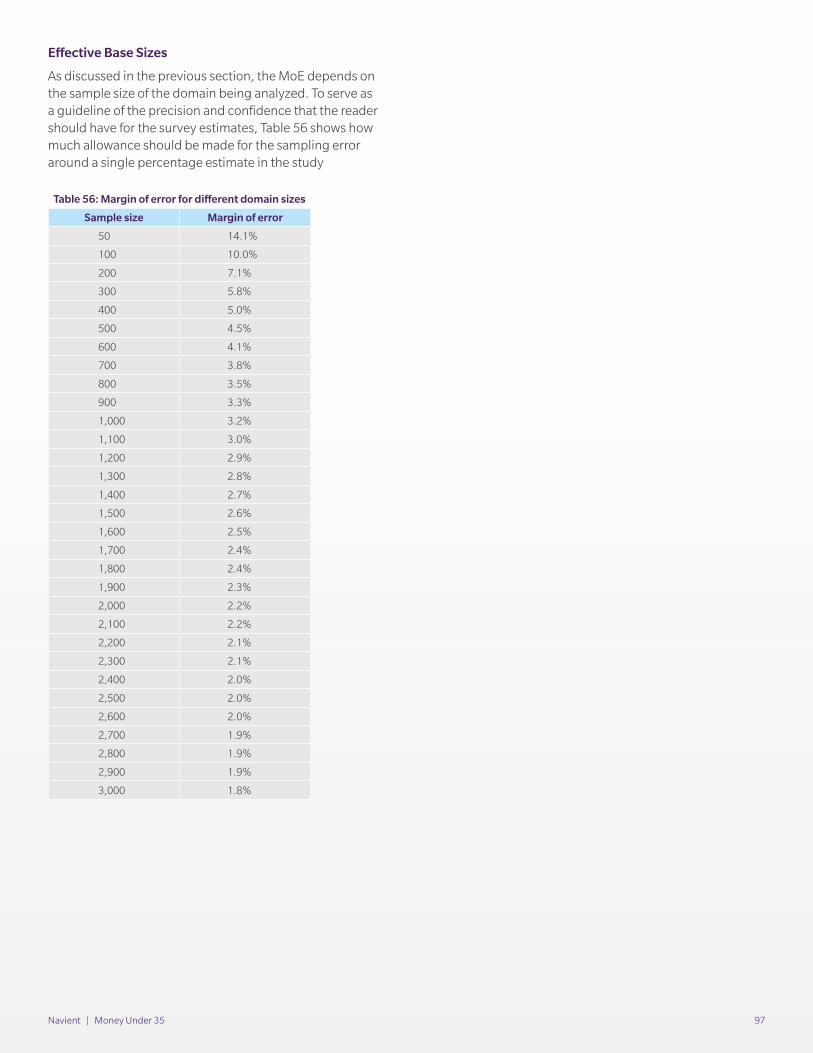
Navient | Money Under 35 97
Effective Base Sizes
As discussed in the previous section, the MoE depends on the sample size of the domain being analyzed. To serve as a guideline of the precision and confidence that the reader should have for the survey estimates, Table 56 shows how much allowance should be made for the sampling error around a single percentage estimate in the study
Table 56: Margin of error for different domain sizes
Sample size Margin of error
50 14.1%
100 10.0%
200 7.1%
300 5.8%
400 5.0%
500 4.5%
600 4.1%
700 3.8%
800 3.5%
900 3.3%
1,000 3.2%
1,100 3.0%
1,200 2.9%
1,300 2.8%
1,400 2.7%
1,500 2.6%
1,600 2.5%
1,700 2.4%
1,800 2.4%
1,900 2.3%
2,000 2.2%
2,100 2.2%
2,200 2.1%
2,300 2.1%
2,400 2.0%
2,500 2.0%
2,600 2.0%
2,700 1.9%
2,800 1.9%
2,900 1.9%
3,000 1.8%
www.navient.com