mongemo - deutsche messe agdonar.messe.de/exhibitor/hannovermesse/2017/d709905/mongemo... ·...
TRANSCRIPT

MONGEMOPermanent on-line partial discharge monitoring system for power generators and electrical motors

22
Continuous monitoring for extending the life of your machines
Knowing the condition of stator insulation is vital
Statistics for rotating electrical machines show that a major source of failure is linked to defects in stator insulation.
Aging of the stator winding insulation can occur both in the slot and end- winding areas. If the insulation condition is not monitored regularly, an inadequate assessment can lead to improper maintenance. In worst cases it can also lead to dielectric failure and costly downtime.
Early detection of partial discharges can prevent machine failure
A majority of defects can be detected early through the permanent monitoring of partial discharges (PD). PD occurs in the stator insulation system of generators and motors, where local electric field stress exceeds the local electrical strength.
The insulation materials typically used for rotating machines are resistant to a certain level of PD. However, an increase in PD activity over time can indicate insulation degradation caused by operational stress and aging processes.
Such a rise in PD activity can be an indication of insulation defects that could lead to serious damage and failure in rotating machines. On-line PD monitoring is therefore a very effective and well-established technique used to continuously assess the condition of a stator winding insulation system.
2
Hydro generators
Electrical motors
Monitoring of a single machine
The MONGEMO monitoring system can be implemented at any point of time during the service life of your rotating machines. Its modular design allows the system to be easily customized and expanded to match your exact monitoring requirements – whether for single or multiple machines.
Modular, expandable design
Turbo generators
PD sensors
Multi-channel PD acquisition unit
Central computer with monitoring software
Monitoring data helps you to optimize planning
The actionable monitoring data helps you to optimize asset management, maintenance strategy and investment planning. Failures can be avoided through the timely implementation of maintenance and repair measures to ensure a longer service life.

3
MONGEMO at a glance
Software for PD monitoring and analysis
MONGEMO includes two software packages for PD monitoring and analysis.
With the monitoring software you can configure the system, set warning and alarm thresholds and view PD data. You can also use it to record real-time data streams for in-depth post analysis. Collected PD data is shown in a trend chart for each phase.
In addition, the OMS system software provides you with tools for expert PD analysis and is used for more in-depth evaluation of the recorded raw PD data.
Centralized data processing and analysis
The collected PD data is stored on a central monitoring computer. The MONGEMO system database is scalable to handle large amounts of PD data over time. The system's convenient web interface allows you to access this data remotely for single or multiple machines.
Continuous PD detection in rotating machines
Our MONGEMO permanent on-line PD monitoring system combines advanced hardware and software for complete condition assessment of stator insulation in:
> Turbo generators
> Hydro generators
> Electrical motors
Expert advice and support
Our dedicated team of high-voltage engineers provides you with complete guidance and support. This includes on-site consultations to evaluate your monitoring needs; customized system design, installation and training; as well as support in data evaluation and reporting.
Complete on-line assessments
MONGEMO continuously records PD activity and reliably indicates the state of stator insulation while your machines are on-line during normal operating conditions.
Multi-channel PD data acquisition is performed synchronously. This enables complete data collection for more comprehensive evaluation of individual PD sources.
3
Monitoring of multiple machines
Your benefits
> Customized system approach to match specific monitoring requirements
> Synchronous, four-channel PD data acquisition for complete PD assessment
> Advanced noise suppression and fully automated PD cluster separation for convenient evaluation
> Recording of raw PD data at selected intervals for in-depth post analysis
> Seamless integration with third-party monitoring devices and SCADA systems
www.omicronenergy.com/mongemo
Effective noise suppression and source separation
You can easily select the center frequency and the bandwidth of the PD measurement to reach an optimal signal-to-noise ratio, even in noisy on-site conditions.
MONGEMO also employs advanced noise suppression and fully automated PD cluster separation techniques. These enable you to quickly distinguish multiple PD sources and external noise from each other for convenient evaluation.

1
11
Typical MONGEMO system configuration for a turbo generator. The system can also be used for monitoring PD in the stator windings of hydro generators and electrical motors.
One system for complete on-line PD monitoring
The complete MONGEMO partial discharge (PD) monitoring system for rotating machines includes a variety of PD sensors (coupling capacitors), an acquisition unit for PD data recording and a central computer with monitoring and analysis software.
MONGEMO system overview 1 Coupling capacitors
> Especially designed for detecting PD signals on generators and motors with up to 24 kV rated voltage
> Capacitive sensors from 80pF to 2.2nF (up to 10nF with external quadripole) are supported
> Detect PD in the frequency range according to the international standards IEC 60034-27-1, IEC 60034-27-2 and IEEE 1434
> Strong mechanical robustness allows installation in both horizontal and vertical positions
> Connected to the OMS 841 data acquisition unit via screened tri-axial cables in order to minimize the impact of external interference
4
Customized to meet your requirements
We design, install and set up the MONGEMO monitoring system according to your requirements for a wide variety of hydro and turbo generators and electrical motors. Multiple PD data acquisition units can be used with the same monitoring computer and software.

5
2
3
One system for complete on-line PD monitoring
Fiber optic connectivity
> Connects each acquisition unit to the central computer
> Provides uninterrupted data transmission over long distances
> Robust against electromagnetic interferences
> Ensures personal safety with complete galvanic isolation
4
Central computer and monitoring software
> Ensures expandable, long-term data storage and retrieval with a state-of-the-art database system
> Manages monitoring parameters and defined thresholds for warning and alarm levels
> Trend visualization and raw PD data recording for in-depth post analysis
> Performs data post-processing to provide useful information about insulation state
> Customizable integration of third-party sensors and SCADA systems
5 OMS 841 acquisition unit
> 4-channel, simultaneous acquisition of PD data from all three phases and an additional monitoring point
> Adjustable PD band pass filter bandwidths up to 5 MHz
> Synchronous PD signal processing with advanced source separation
> External 12 V lead-acid battery bridges temporary power outages (optional)
3
5
Protective enclosure
> Protects data acquisition unit from dust and moisture
> Lockable door to prevent unauthorized access
> Input ports for connections from coupling capacitors
> Ports for fiber optic cable connection to central monitoring computer or SCADA system
2
4

6
Software for complete PD monitoring and analysis
Actionable data for reliable assessment
MONGEMO includes two software packages for partial discharge (PD) monitoring and analysis.
The monitoring software allows you to configure the system for remote monitoring of single or multiple machines via the central computer.
PD data is processed and displayed in either real-time or historical views. You are provided with warnings and alarms of increased PD activity well before failures occur.
The OMS system software is also included for in-depth post-analysis of the raw PD data.
Recording raw PD data sets
MONGEMO records raw PD data sets based on a defined time schedule – either in real time, periodically or when a PD parameter exceeds a pre-set threshold.
The raw PD data can be analyzed in depth with the expert PD analysis software provided. We can also assist you with PD data evaluation upon request. (See )
> Scroll over data points to view date, time and PD values for each phase
> View actual PD values and alarm status
> Event log shows triggered alarms for selected assets
1 Getting started
2 View PD data
3
Monitoring software dashboard
> Configuration of all monitoring-related parameters
> Define threshold settings for alarm notifications
> Define recording of PD data sets
System configuration and control
Select desired activity, including:
> Setup system configuration or make changes
> View current monitoring session in real time (see )
> View and analyze monitoring trend data (see )
Real-time PD data
2
2

7
Software for complete PD monitoring and analysis
> See PD trend charts for each phase/channel
> Scroll over data points to view date, time and PD values
> Event log shows corresponding warnings and alarms for all monitored assets
> Zoom into any part of a historical diagram to see more detail
> Trend data can be easily exported to a .csv data file
Pop-up windows show PD diagrams
By clicking on each point of the historical PD trend diagram, a pop-up window will open with different types of PD diagrams to choose from:
> 3PARD and PRPD
> Automated clustering results
> Pulse distribution
> PD data sets
These enable you to quickly evaluate the PD data. All charts and diagrams can be printed and saved in various formats.
Historical PD data
3PARD and PRPD pop-up window
When in-depth investigation is required
Detailed PD diagnosis can be done using the OMS system software. This advanced software allows you to apply various filters to see more detail of the PD activity.
PD data evaluation support from OMICRON
We can also provide you with an in-depth analysis of collected PD data as well as condition reporting for your monitored machines. These optional monitoring services are available upon request.
Expert PD analysis3

8
Reliable and early PD detection in stator windings
> 3PARD diagrams and PRPD patterns are saved for each point in the PD trend.
> 3PARD visualizes the relation among amplitudes of a single PD pulse in onephase and its cross-talk generated signals in the other two phases.
> In order to initially eliminate interference (similar amplitudes in all three phases) from the measurement results, the corresponding area can be excluded by the semi-transparent box shown in the 3PARD.
Effective source separation and evaluation techniques
The key to successful partial discharge (PD) measurement in stator windings is the separation of parallel active PD sources and the distinction between potentially damaging PD, tolerable PD occurrences and external noise inevitably present in industrial surroundings.
In order to separate clusters of multiple PD sources, MONGEMO employs synchronous, multi-channel 3PARD (3-Phase Amplitude Relation Diagram) and automatic cluster separation evaluation techniques.
These advanced technologies are supplemented by the system’s recording of raw PD data for in-depth post analysis and are based on our knowledge and many years of experience in PD detection and source separation.
Noise supression through 3PARD filter
9
Reliable and early PD detection in stator windings
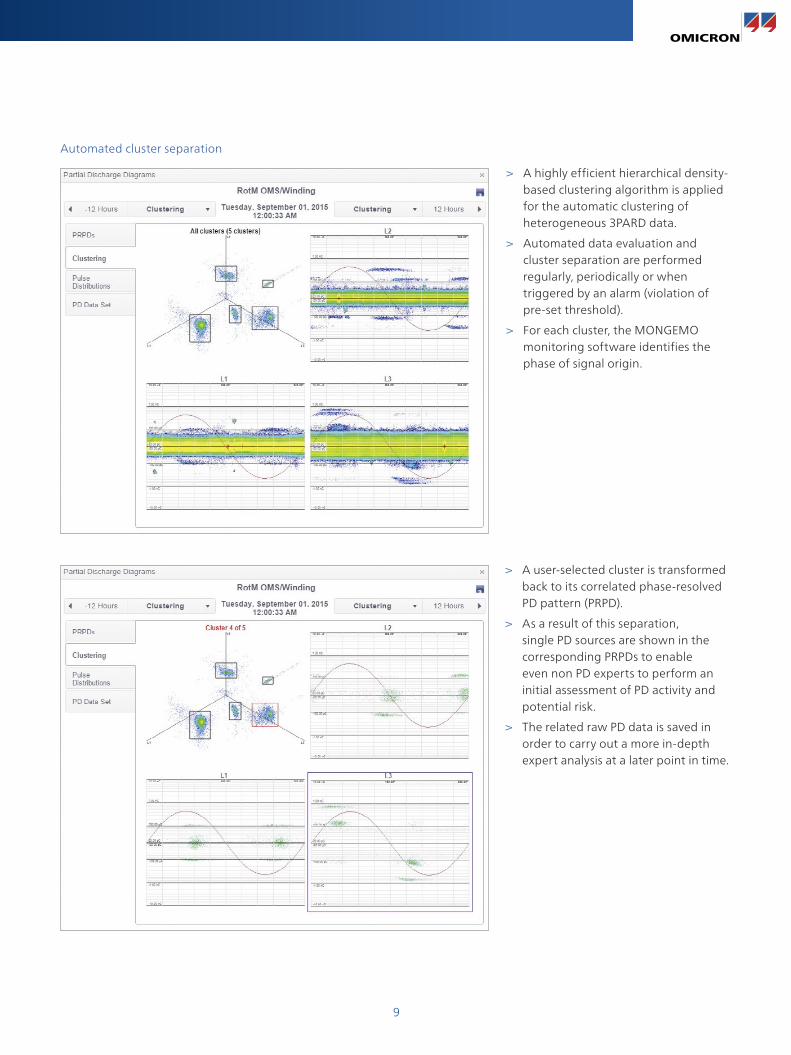
> A user-selected cluster is transformed back to its correlated phase-resolved PD pattern (PRPD).
> As a result of this separation, single PD sources are shown in the corresponding PRPDs to enable even non PD experts to perform an initial assessment of PD activity and potential risk.
> The related raw PD data is saved in order to carry out a more in-depth expert analysis at a later point in time.
Automated cluster separation
> A highly efficient hierarchical density-based clustering algorithm is applied for the automatic clustering of heterogeneous 3PARD data.
> Automated data evaluation and cluster separation are performed regularly, periodically or when triggered by an alarm (violation of pre-set threshold).
> For each cluster, the MONGEMO monitoring software identifies the phase of signal origin.

10
High-quality support at every stage of your monitoring project
MONGEMO is not only a complete set of hardware and software components. It also includes the dedicated service we provide you. Our monitoring experts are working for you to support you in all stages of your monitoring project.
We provide you with peace of mind while matching the actual needs of your high-voltage equipment over its operational lifetime.
Technical specifications
Partial discharge measurements
Number of input channels 4
Connector type BNC
Frequency range AC: DC … 16 kHzPD: 16 kHz … 30 MHz
Sampling rate AC: 31.25 kS/sPD: 125 MS/s
Peak input levels AC: 200 mAPD: 80 V
Measurement accuracy AC: ±0.25% (40 Hz < f < 70 Hz)PD: ±5 % (f = 300 kHz, Δf = 150 kHz)
Maximum double pulse resolution
< 200 ns
PD event time resolution < 2 ns
PD filter bandwidth 9 kHz … 5 MHz (10 bandwidth settings)
System noise < 1 pC (f = 400 kHz, Δf = 300 kHz, input range ≤ 320 mV)
Mechanical data – Enclosure with acquisition unit
Dimensions (W × H × D)(cable glands not mounted)
400 × 500 × 210 mm / 15.7 × 19.7 × 8.3 in.
Weight ~15 kg / 33 lb.
OMS 841 external power supply
AC (max.) DC (max.)
110 V AC … 240 V AC /50/60 Hz / max. 0.28 A
110 V DC … 300 V DC /max. 0.12 A
Fiber optic connection
Medium Standard: Duplex multi-mode fiber optic cables 50/125 μm (OM3 or better)
Optional: Duplex single-mode fiber optic cables 9/125 μm (OS1 or better)
Wavelength 1300 nm
Maximum cable length 4 km (multi-mode), 40 km (single mode)
Connector type LC
10
OMS 841 power supply
24 V DC / 0.5 A

11
We start the implementation of your monitoring system by understanding your needs and challenges. With this input, the system can be designed and configured according to your needs. Then our team of specialists installs the system for you on-site.
During the commissioning of the system, its performance and measurement sensitivity are verified. You are then trained on how to use the system and how to take maximum advantage of its features.
Our HV experts are available to help you interpret and analyze the data. We can also provide you regular asset condition reports and recommendations for further action.
Monitoring project knowledge and expertise you can rely on
> Evaluation of monitoring requirements
> Project-specific monitoring system design
> Integration of monitoring system into existing infrastructure
> Installation, commissioning and calibration of the monitoring system
> Monitoring system and data evaluation training
> Data analysis and interpretation
> Worldwide customer service & hotline
Vibration, shock and protection class
Standard Rating
Vibration EN 60068-2-6 Frequency range: 10 Hz … 150 Hz
Acceleration: 2 g continuous (20 m/s2),10 cycles per axis
Shock EN 60068-2-27 15 g/11 ms, half-sinusoid, per axis
Protection class EN 60529 IP 50 (OMS 841)IP 65 (OMS enclosure)
Environmental requirements
Operating temperature -30 … +55 °C / -22 … +131 °F
Storage temperature -40 … +80 °C / -40 … +176 °F
Humidity Up to 95 % r.H. (non-condensing)
Maximum altitude 4,000 m / 13,123.4 ft.
Electromagnetic compatibility
Emission EN 55011/22, 30 MHz … 3 GHzFCC Subpart B, 30 MHz … 1 GHz
Immunity EN 61000-6-5: MV/HV substations
Safety requirements
Safety requirements for electricalequipment for measurement, control and laboratory use
EN 61010-1
Software requirements
OMS System Software / Monitoring Software The minimum system requirements for running the OMS System Software and the Moitoring Software are:
> Windows 7 (64bit), Windows 8 (64bit) or Windows Server 2012 (64bit)
> Processor: Intel i5 2.4 GHz or a comparable x64 processor
> RAM: 4GB
> USB 2.0 high speed port
> Screen resolution (minimum): 1024 x 768 pixels
A central computer that meets these software requirements is provided by OMICRON.
11

www.omicronenergy.com
OMICRON is an international company serving the electrical power industry with innovative testing and diagnostic solutions. The application of OMICRON products allows users to assess the condition of the primary and secondary equipment on their systems with complete confidence. Services offered in the area of consulting, commissioning, testing, diagnosis and training make the product range complete.
Customers in more than 140 countries rely on the company’s ability to supply leading-edge technology of excellent quality. Service centers on all continents provide a broad base of knowledge and extraordinary customer support. All of this together with our strong network of sales partners is what has made our company a market leader in the electrical power industry.
Subject to change without notice.
The following publications provide information about additional monitoring solutions from OMICRON:
For more information, additional literature, and detailed contact information of our worldwide offices, please visit our website.
OMS 605 Portable PD Monitoring System for High-Voltage Assets
Continuous PD Monitoring System for High-Voltage Cable Systems
MONTRANO Continuous Monitoring System for Power Transformers
© OMICRON L2533, October 2015