monitoring and dividend policies of reits under … · competing reasons for the level of reit...
TRANSCRIPT

Monitoring and Dividend Policies of REITs
under Asymmetric Information
Ming-Long Lee* Assistant Professor
Department of Finance College of Management
National Yunlin University of Science & Technology 123, Section 3, University Road, Touliu, Yunlin, Taiwan 640
(05)-534-2601 EXT. 5338 FAX: (05)-531-2079
V. Carlos Slawson, Jr. Associate Professor of Finance
2163 CEBA, Finance Department E.J. Ourso College of Business Administration
Louisiana State University Baton Rouge, LA 70803-6308
(225) 578-6238 FAX: (225) 578-6366
This version: for 10th PRRES annual conference
* We thank Cater Hill, Ji-Chai Lin, Kelley Pace, Harley R. Ryan Jr., Gary Sanger, Paul J. Seguin, and Ko Wang for their
valuable suggestions. All errors are entirely our own.
1
Monitoring and Dividend Policies of REITs under Asymmetric Information
Considering the extent to which a REIT is monitored may affect our explanation for REIT dividends, especially for those dividends paid in excess of the mandatory payout level. The REIT empirical literature currently offers two competing reasons for the level of REIT dividend payouts under asymmetric information: (1) signaling explanations (supported by Bradley, Capozza, and Seguin, 1998) and (2) agency-cost explanations (supported by Wang, Erickson, and Gau, 1993). When we consider only the excess dividends above the mandatory level and when we evaluate the extent of non-dividend monitoring, agency-cost explanations dominate signaling explanations for relatively less monitored firms. KEYWORDS: REIT, Dividend Policy, Signaling, Agency Cost, and Monitoring
2
1. Introduction
Under the assumption that the capital market is perfect and investment decisions are
independent, dividends are irrelevant to firms’ values because investors could create their own
dividends by selling or borrowing against their portfolios. Despite this, we observe that firms pay out
dividends, and their stock prices change upon their dividend announcements.
Considering that mangers have information unavailable to external market participants, finance
researchers have proposed agency costs and signaling to explain dividend policies. The two
competing explanations both receive empirical support, in particular, in the industry of real estate
investment trusts (REITs). In their examination of REITS, Bradley, Capozza, and Seguin (1998; BCS
hereafter) find a negative relationship between cash flow volatilities and dividend distribution and
conclude that signaling explanations dominate agency cost explanations for dividend policies of
REITs. In contrast, Wang, Erickson, and Gau (1993; WEG hereafter) support agency cost theories.
In this paper, we attempt to add to this discussion by (1) nesting the two individual models into a
single model, and (2) extending the nested model by considering additional factors that may account
for some of the differences in the findings of WEG and BCS. Specifically we nest the two models
within a single model and extend the analysis by considering two additional effects: (1) the effect of
the mandatory payout requirement, and (2) the effect of monitoring.
The first additional effect we consider is the REIT payout requirement. REITs are required to
pay out at 95% (90% beginning in 2001) of their taxable income in the form of dividends to retain
their REIT status. Second, we consider the effect of monitoring by incorporating Easterbrook’s
(1984) monitoring rationale for paying dividends. Neither of the two previous studies account for the
explainable portion of the dividend nor the effect of monitoring.

3
We argue that the dominance between the two dividend policy explanations provided in the
existing literature may be reversed for firms that are not effectively monitored based on two reasons.
First, Easterbrook’s (1984) rationale of substitution among agency cost control devices suggests the
agency cost explanations are valid only for firms that are not effectively monitored. This rationale
implies that samples in both Filbeck and Mullineaux (1993 and 1999)1 and BCS (1998) are potentially
biased against the agency cost explanations and in favor of the signaling explanations. Second, BCS’s
(1998) signaling model implicitly assumes that managers are maximizing shareholders’ wealth and
the market knows it. Under this assumption, the market can infer firms’ private information from their
managers’ actions. We relax this assumption and allow for asymmetric information. In other words,
the managers may not be able to communicate credible signals to the market. For instance, mangers
with compensation closely tied with current firm value have incentives to send false signals with
larger dividends. Managers working in firms that are not effectively monitored may be more likely to
maximize their own wealth instead of the shareholders’ wealth compared to managers in effectively
monitored firms. Therefore, firms that are not effectively monitored may be less likely to signal
credibly. This reasoning implies the signaling explanations may be dominated by the agency cost
explanations in explaining dividend policies for firms that are not effectively monitored.
In further contrast to BCS (1998), we do not rely solely on cash flow volatilities to distinguish
the dominance between the signaling explanations and the agency cost explanations. Following
Noronha, Shome, and Morgan (1996, NSM hereafter), we stratify firms into “non-monitored firms”
and “monitored firms” to take into account Easterbrook’s (1984) rationale. Adopting this
1 Filbeck and Mullineaux (1993) examine bank holding companies that are highly monitored by regulators and conclude
that dividend announcements support signaling explanations. Filbeck and Millineaux (1999) later find that agency costs
are almost irrelevant to dividend payouts for bank holding companies. Altogether, Filbeck and Mullineaux (1993, 1999)
provide evidence that the signaling explanations dominate the agency cost explanations for the dividend policies of
effectively monitored firms.

4
encompassing principle, we artificially nest the models for the two explanations to examine their
dominance for monitored firms and non-monitored firms separately.2
The next section explains the substitution between dividend monitoring and non-dividend
monitoring devices in the framework of agency cost explanations. The third section presents our
reason for not using cash flow volatilities alone to distinguish the signaling explanations and the
agency cost explanations. The fourth section describes the sample and empirical methodology in
detail. The fifth section presents the empirical results. The last section contains conclusions.
2. Substitution between dividend monitoring and non-dividend monitoring
The dividend monitoring rationale states that paying dividends reduces the resources under
mangers’ control, and thus precipitates firms to issue new securities resulting in capital market
monitoring, thereby reducing agency costs (Rozeff, 1982; Easterbrook, 1984; Jensen, 1986). Several
studies have presented empirical evidence supporting the explanation. Examples are Rozeff (1982),
Dempsey and Laber (1992), WEG (1993), and NSM (1996). The existing evidence shows that the
explanation works over different economic conditions (Dempsey and Laber, 1992).
Because all form of monitoring devices themselves are costly, Easterbrook (1984) furthermore
postulates the substitution concept between dividends and non-dividend monitoring devices. That is,
the use of a costly dividend payout mechanism to induce capital market monitoring is less likely when
a non-dividend monitoring mechanism is in place (NSM, 1996). In addition, firms are likely driven to
the capital market by other conditions such as the need for finance high growth (Easterbrook, 1984;
NSM, 1996). Therefore, it is likely that only part of firms base their dividend decision on agency cost
considerations (NSM, 1996).
Based on the substitution concept, NSM (1996) hypothesizes that the validity of the
monitoring rationale for dividends depends on the characteristics of the firms that relate to the growth
2 By “artificially nest”, we mean that nest two non-nested models into an encompassing model (Greene, 2000, p.301).

5
opportunities and the existence of non-dividend mechanisms for controlling agency costs. Stratifying
industrial firms according to the presence of non-dividend mechanisms or growth-induced capital
market monitoring, NSM (1996) show that dividends as an agency cost control device are validity
only for firms with low growth opportunity or without the presence of alternative no-dividend
monitoring devices. In addition to NSM (1996), Filbeck and Millineaux (1999) also produce evidence
consistent with the substitution concept. Specifically they find that agency costs are almost irrelevant
to dividend payouts for bank holding companies that are highly monitored by regulators.
3. Cash flow volatilities and dividends
Cash flow volatility has been used as a determining factor to distinguish signaling explanations
from agency costs explanations. In this section, we present our reasons for considering additional
variables to distinguish signaling explanations from agency cost explanations. This section is
comprised of two parts. The first part discusses the negative relationship between dividend
distribution and cash flow volatilities in the dividend-signaling framework. The second part discusses
the ambiguous relation in the agency cost framework. The discussion concludes that the agency cost
explanations of dividends predict an ambiguous relationship between dividend paying and cash flow
volatilities.
3.1. Cash flow volatilities in the dividend-signaling framework
At least three dividend-signaling papers discuss the relation between dividend distribution and
cash flow volatilities: Eades (1982), Kale and Noe (1990), and BCS (1998).3 All three dividend-
signaling papers assume either explicitly or implicitly that the managers are perfectly aligned with
current shareholders. In other words, the managers are maximizing their firms’ values that are
equivalent to their current shareholders’ wealth.4 In this case, we can divide agents into two groups:
3 Actually, Eades (1982) stated the relation between dividends and variance of liquidation value of a firm in their one-period signaling model. Since the liquidation value is the only cash flow at the end of one period, the relation can be viewed as one between dividends and cash flow volatility. Kale and Noe (1990) share this same interpretation. 4 Current shareholders’ wealth is not necessarily equal to their firm’s current market price under asymmetric information.

6
firms (managers and current shareholders) and the market (remaining agents). Firms have information
unavailable to the market. Firms signal the asymmetric information to the market with dividend
distribution. Nevertheless, the asymmetric information is different in the three papers. Specifically,
dividends signal expected future cash flows both in Eades’ (1982) paper and BCS’s (1998) paper, and
cash flow volatilities in Kale and Noe’s (1990) paper.
In Eades’ (1982) and BCS’s (1998) models, the asymmetric information is information about the
expected future cash flows. However, both firms and the market know the variances of the future cash
flows. Firms signal the expected cash flows to the market to maximize their current firm values by
distributing dividends. The market infers the expected cash flows from the promised dividends. Firms
incur market-imposed penalties when realized future cash flows are short of the promised dividends.
The market-imposed penalties are the signaling costs that increase with the shortfalls between realized
future cash flows and the promised dividends. Increases in the expected cash flows lower the expected
costs of signaling by reducing the expected shortfall and, thus, raise dividends required for credible
signaling. This implies a positive relationship between dividends and the expected cash flows. On the
other hand, firms with known higher cash flow volatilities are more likely to have larger shortfalls
with given levels of dividend; thus, firms need smaller dividends to send credible signals. This
implies a negative relationship between dividends and the cash flow volatilities.
In contrast to Eades’ (1982) and BCS’s (1998) models, both firms and the market know the
expected future cash flows in Kale and Noe’s (1990) model. However, the asymmetric information in
Kale and Noe (1990) is defined as the volatilities of the expected future cash flows. So the
information content that firms want to signal and the market wants to infer from dividends is the cash
flow volatilities. Nevertheless, the intuition behind the relationship between dividends and the cash
flow volatilities, as well as the expected future cash flows, is very similar to those in Eades’ (1982)
model. Firms have to obtain external financing to meet the shortfalls between realized future cash

7
flows and the promised dividends. The external financing costs that increase with the shortfalls are the
signaling costs. Increases in cash flow volatilities raise the expected external financing cost associated
with given levels of dividend, which lowers dividends necessary for credible signaling.5 On the other
hand, firms with known higher expected future cash flows are less likely to incur the signaling costs
and, therefore, require larger dividends to signal credibly.
Overall, the three dividend signaling models all predict a negative (positive) relationship
between dividends and cash flow volatilities (expected future cash flows). In addition to the
theoretical predictions, Eades (1982) and BCS (1998) also provide empirical evidence that supports
the negative (positive) relationship. Therefore, we conclude that the relationship between dividends
and cash flow volatilities are negative in the signaling framework.
5 Actually, Kale and Noe’s (1990) separate cash flow volatilities into systematic risk and unsystematic risk. They predict a negative relation between dividends and unsystematic risk. But they do not give a deterministic prediction about the sign of the relation between dividends and systematic risk. Nevertheless, the existing empirical evidence also suggests a negative relation between dividends and systematic risk (see BCS, 1998).

8
3.2. Cash flow volatilities in the agency-cost framework
At least two studies discuss the relation between cash flow volatilities and dividend distribution
in the agency-cost framework: Rozeff (1982) and BCS (1998). Nevertheless, the two studies have
different predictions about the relationship. Rozeff (1982) predicts a negative relationship between
dividends and cash flow volatilities in the agency-cost framework.6 Notice Rozeff’s (1982) prediction
is the same as the prediction of the three signaling models discussed before. In other words, both the
signaling models of Eades (1982), Kale and Noe (1990), as well as BCS (1998), and the agency-cost
model of Rozeff (1982) predict a negative relationship between dividends and cash flow volatilities.
On the other hand, BCS (1998) predict a positive relationship between cash flow volatilities and
dividend distribution in the agency-cost framework.
Rozeff (1982) argues that cash flow volatilities increase a firms’ dependence on external
financing given fixed investment opportunities. External financing is costly compared to internal
financing. Dividend payments reduce the available amount of internal financing when needed for
investment. Therefore, the opportunity costs of dividends for firms with higher cash flow volatilities
are higher than firms with lower volatilities. The transaction cost effect induces a negative
relationship between cash flow volatilities and dividend payouts.
An increase in cash flow volatility, however, also increases over-investment risk. Over-
investment risk increases because investors attribute with less precision the deviation in cash flows to
the actions of corporate management or to the factors beyond management’s control. Dividend
payments reduce the funds under management’s discretion. Hence, dividend distribution reduces
over-investment risk. From this point of view, BCS (1998) argue that a positive relationship exists
between cash flow volatilities and dividend payouts under agency-cost explanations.7
6 See page 254 in Rozeff (1982). 7 See page 556 in BCS (1998).
9
Agency cost explanations, therefore, overall do not yield a determinate prediction about the
relationship between cash flow volatilities and dividend distribution. As a result, examining the link
between cash flow volatilities and dividend distribution alone cannot clearly distinguish agency cost
and signaling theories of dividends. Therefore, we differ from BCS (1998) and do not only use the
sign of the relationship to determine the dominance between the signaling explanations and the
agency-cost explanations.
4. Sample and empirical methodology
This section consists of two parts. The first part describes our data selection and the properties
of the data. The second part explains the empirical methodology used in this study.
4.1 Sample selection
We obtained the initial list of REITs for this study from Research Insight by searching
companies with SIC code 6798. We then collected relevant annual firm-specific data for REITs from
the Research Insight and the Academic Universe for the period 1988 through 1998. Dividends,
taxable income, market values of assets, leverage ratios, trading volumes, numbers of common shares,
returns on total assets, and numbers of common stockholders are from the Research Insight.8 Funds
from operations (FFO) are computed annually following Graham and Knight (2000) from the
Research Insight files as well.9 The other annual data comes from the Academic Universe. Real estate
investment information and managers’ and directors’ stock holdings are from 10-K reports and proxy
statements. Equity, mortgage, or hybrid REITs are identified from balance sheets in 10-K reports to
shareholders. All hybrid REITs and mortgage REITs are dropped. REITs in merger or liquidating
processes are also dropped. This leads to a final sample consisting of 332 firm-year observations of
8 Pretax income, taxable income in concept, reported in the Research Insight is used as a proxy for taxable income reported by REITs to the Internal Revenue Service. 9 Graham and Knight (2000) consider FFO as a cash flow measure for REITs and define FFO as net income plus depreciation, minority interest income, extraordinary items, and excluding gain or loss on sales of property, plant, and equipment.
10
equity REITs. Specifically we have 17, 19, 20, 12, 1, 12, 33, 44, 87, and 87 observations in 1989,
1990, 1991, 1992, 1993, 1994, 1995, 1996, 1997, and 1998 respectively.
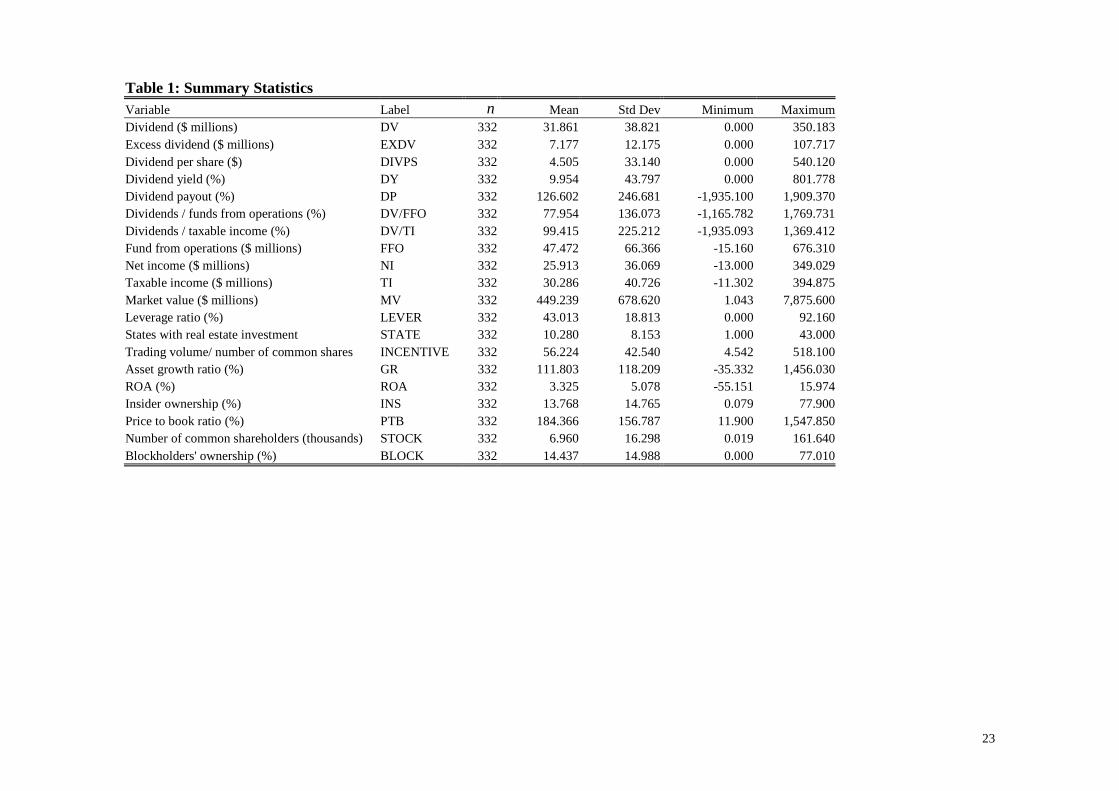
Table 1 contains descriptive statistics for all firm-years of REITs used in this study and shows
that there is significant variation in REIT dividend policies. Specifically, there are 19 out of 332
(5.72%) firm-year observations paying no cash dividends. The firm-years of REITs pay $31.86
million of dividends a year on average with a standard deviation of $38.82 million. There are 252 out
of 332 (75.90%) firm-year observations paying dividends more than the mandatory 95% payout
requirement. Excess dividends above the 95% requirement have a mean of $7.17 million and a
standard deviation of $12.17 million.
For the firm-years of REITs, dividends per share on average are $4.50. Dividend yields are
9.95% of share price on average. On average, dividend payouts measured in net income before
extraordinary items are 126.60%. Dividend payouts expressed as a proportion of funds from
operations (FFO) have a mean of 77.95%. This mean is consistent with the 70% industry norm
reported by Brandon (1997). The average dividend payouts are 99.42% of taxable income. This
payout ratio is consistent with the 100% industry norm reported by Brandon (1997).
4.2 Empirical methodology
To empirically take into account the mandatory 95% (90% beginning in 2001) payout
requirement for REIT taxable income, we construct the equation of the dividend-signaling
explanations with the expected sign for each independent variable in the parentheses as Equation (1).
( , , , , , )sEXDV F EXFFO Lagged EXFFO MV LEVER STATE INCENTIVE= (1)
where
EXDV = Annual cash dividends paid for common stocks in excess of the mandatory payout
requirement (million dollars) during a fiscal year10;
10 The three signaling models suggest the total dividends as the dependent variable. Some studies use dividend yields as
11
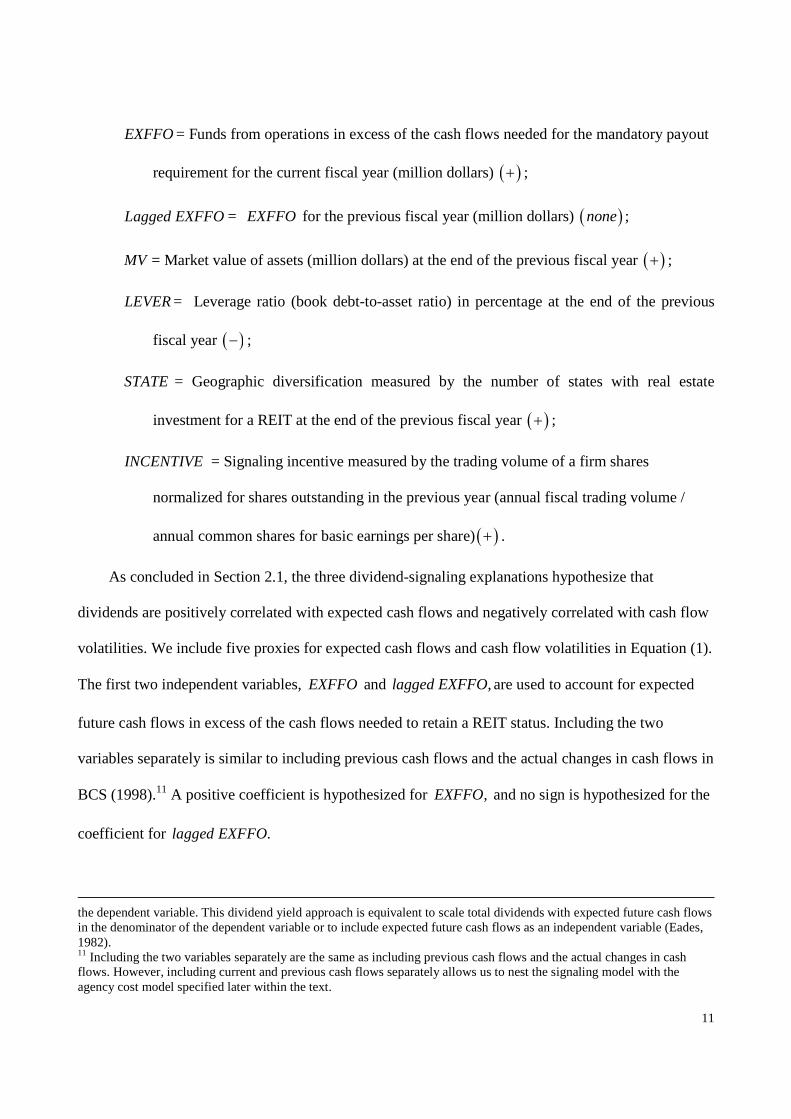
EXFFO = Funds from operations in excess of the cash flows needed for the mandatory payout
requirement for the current fiscal year (million dollars) ( )+ ;
Lagged EXFFO = EXFFO for the previous fiscal year (million dollars) ( )none ;
MV = Market value of assets (million dollars) at the end of the previous fiscal year ( )+ ;
LEVER = Leverage ratio (book debt-to-asset ratio) in percentage at the end of the previous
fiscal year ( )− ;
STATE = Geographic diversification measured by the number of states with real estate
investment for a REIT at the end of the previous fiscal year ( )+ ;
INCENTIVE = Signaling incentive measured by the trading volume of a firm shares
normalized for shares outstanding in the previous year (annual fiscal trading volume /
annual common shares for basic earnings per share) ( )+ .
As concluded in Section 2.1, the three dividend-signaling explanations hypothesize that
dividends are positively correlated with expected cash flows and negatively correlated with cash flow
volatilities. We include five proxies for expected cash flows and cash flow volatilities in Equation (1).
The first two independent variables, EXFFO and ,lagged EXFFO are used to account for expected
future cash flows in excess of the cash flows needed to retain a REIT status. Including the two
variables separately is similar to including previous cash flows and the actual changes in cash flows in
BCS (1998).11 A positive coefficient is hypothesized for ,EXFFO and no sign is hypothesized for the
coefficient for .lagged EXFFO
the dependent variable. This dividend yield approach is equivalent to scale total dividends with expected future cash flows in the denominator of the dependent variable or to include expected future cash flows as an independent variable (Eades, 1982). 11 Including the two variables separately are the same as including previous cash flows and the actual changes in cash flows. However, including current and previous cash flows separately allows us to nest the signaling model with the agency cost model specified later within the text.

12
The next three variables, ,MV ,LEVER and ,STATE are proxies for cash-flow volatilities. The
use of MV and LEVER are followed from BCS (1998). MV is expected to be negatively correlated
with cash flow volatilities and, therefore, is hypothesized to have a positive coefficient. This
expectation arises because REITs with larger market values are associated with larger portfolios that
contain a larger number of discrete assets. If cash flows to these assets are not perfectly correlated,
portfolios with a larger number of discrete assets will experience lower volatilities of cash flows from
operations. LEVER is expected to be positively correlated with cash flow volatilities and, thus, is
hypothesized to have a negative coefficient. This hypothesis is based on the positive effect of
financial leverage on volatility of cash flows to shareholders, holding the cash flows from operation
constant.
In addition to the naïve diversification considered in ,MV the systematic diversification adopted
by REITs reduces cash flow volatility as well. BCS (1998) construct geographic and property-type
Herfendahl indices to account for systematic diversification. They find that only the geographic
indices are significantly related to REIT dividends. Imitating the number of segments used in the
finance diversification literature, we measure the geographic diversification with the number of states
where an equity REIT has real estate investments.12 This index can vary from 1 for a geographically-
concentrated equity REIT to 50 for a well-diversified equity REIT.
In the one-period models of Eades (1982) and BCS (1998), there is equivalently only one type of
shareholder who has the same objective function of balancing signaling benefits and signaling costs,
thus having the same incentive to signal. In the two-period model of Kale and Noe (1990), there are
two types of shareholders: sellers and stayers. Sellers, who plan to sell out their shares, have an
incentive to signal to have a higher current market price for their shares. On the other hand, stayers,
who plan to hold their shares for the longer run, have an incentive to avoid signaling costs. Facing the
12 We were not able to use the Herfendahl index because we do not have enough data to do the calculation.
13
potential conflicts of interest between their current shareholders, mangers maximize weighted
averages of the intrinsic values and the current market values of individual firms.13 When placing
more weight on the current market values of their firms, managers will distribute more dividends
(Kale and Noe, 1990). To account for this effect, we include ,INCENTIVE which is a proxy for the
weight on the current market value in Equation (1), in addition to proxies for expected future cash
flows and cash flow volatilities.
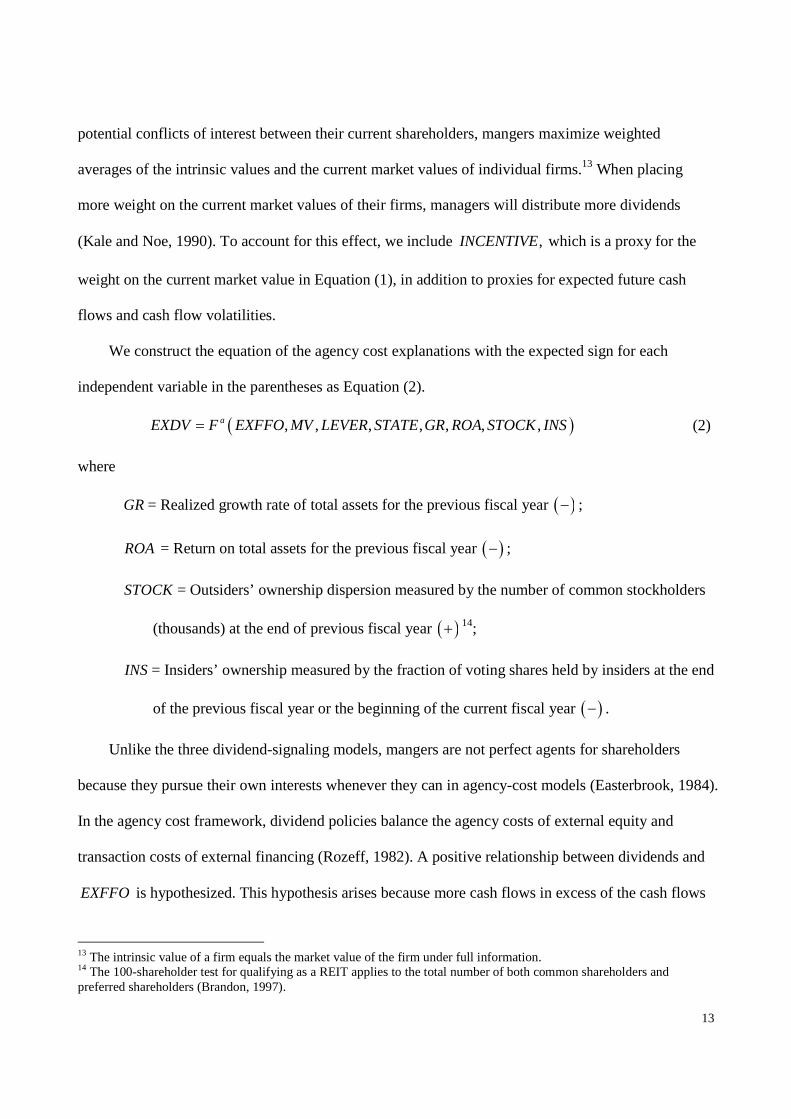
We construct the equation of the agency cost explanations with the expected sign for each
independent variable in the parentheses as Equation (2).
( ), , , , , , ,aEXDV F EXFFO MV LEVER STATE GR ROA STOCK INS= (2)
where
GR = Realized growth rate of total assets for the previous fiscal year ( )− ;
ROA = Return on total assets for the previous fiscal year ( )− ;
STOCK = Outsiders’ ownership dispersion measured by the number of common stockholders
(thousands) at the end of previous fiscal year ( )+ 14;
INS = Insiders’ ownership measured by the fraction of voting shares held by insiders at the end
of the previous fiscal year or the beginning of the current fiscal year ( )− .
Unlike the three dividend-signaling models, mangers are not perfect agents for shareholders
because they pursue their own interests whenever they can in agency-cost models (Easterbrook, 1984).
In the agency cost framework, dividend policies balance the agency costs of external equity and
transaction costs of external financing (Rozeff, 1982). A positive relationship between dividends and
EXFFO is hypothesized. This hypothesis arises because more cash flows in excess of the cash flows
13 The intrinsic value of a firm equals the market value of the firm under full information. 14 The 100-shareholder test for qualifying as a REIT applies to the total number of both common shareholders and preferred shareholders (Brandon, 1997).

14
needed for the mandatory payout requirement give mangers more discretion to over-invest in non-
positive net present value projects.15 As a result, shareholders demand more dividends than they
would otherwise. Including the cash flow variable as an explanatory variable and dividends as the
dependent variable is similar to putting dividend payouts as the dependent variable in other studies.
However, our approach allows us to nest the agency cost model with the signaling model specified
before. As discussed in Section 2-2, cash flow volatility influences dividend policies in two opposing
ways. Cash flow volatility increases over-investment risk but also expected costs of external financing.
Therefore, unlike signaling explanations, no determinate signs are hypothesized for the next three
variables, ,MV ,LEVER and ,STATE that are proxies for cash-flow volatility.
Following Rozeff (1982) and WEG (1993), we include GR in the equation of agency-cost
explanations. A negative relationship is hypothesized between dividends and .GR Rozeff (1982) and
WEG (1993) hypothesize this negative relationship because firms experiencing or anticipating rapid
asset growth would tend to retain funds to minimize the frequency of raising new capital. We also
include ROA in Equation (2) because WEG (1993) also hypothesize and show a negative relationship
between ROA and dividend distribution. The negative relationship is hypothesized because
shareholders may feel less pressure to monitor the investment decisions of managers when their firms
have superior historical investment performance.
In addition, we also include STOCK and ,INS following Rozeff (1982). A positive relationship
between STOCK and dividends and a negative relation between INS and dividend distribution are
hypothesized. The positive relationship for STOCK is hypothesized because outside shareholders
with more concentration of ownership are more likely to influence insiders’ behavior, thereby
reducing agency costs and leading to lower dividend distribution. The negative relationship for INS
15 Mooradian and Yang (2001) also measure the cash flows in excess of the cash flow needed for the mandatory payout requirement as cash flow under REIT managers’ discretion in their study.

15
is hypothesized because as outside equity holders own a larger share of the equity, they will demand
larger dividends as part of the optimum-monitoring package.
Although Eades (1982), Kale and Noe (1990), and BCS (1998) all implicitly assume in their
signaling models that managers are perfect agents for shareholders, agency problems do not
necessarily and completely invalidate credibility of dividend-signals sent by managers. In fact, Ross
(1977) develops an incentive-signaling model of capital structure. In Ross’s (1977) model, corporate
managers are not perfect agents for shareholders and are able to send credible signals because
mangers bear some signal costs. Since agency cost explanations and signaling explanations do not
preclude each other, we nest Equations (1) and (2) into Equation (3).16
( ), , , , , , , , ,EXDV F EXFFO Lagged EXFFO MV LEVER STATE GR ROA STOCK INS INCENTIVE= (3)
To control heteroskedasticity and the auto-correlation of errors, we estimate Equation (3) with Tobit
regression with year dummies and weighted by MV for all observations.17
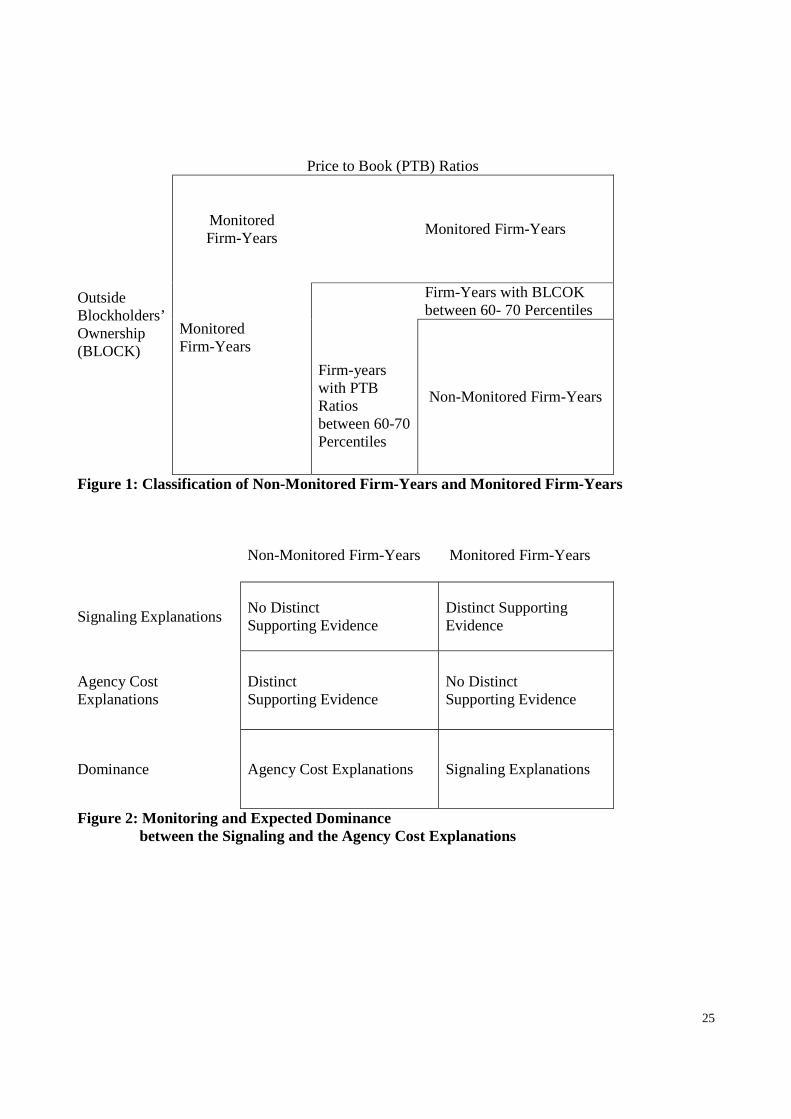
To accommodate Easterbrook’s (1984) monitoring rationale for paying dividends, we follow
NSM (1996) and stratify observations into “non-monitored firm-years” or “monitored firm-years” as
shown in Figure 1. The non-monitored firm-years do not have non-dividend monitoring, and the
monitored firm-years are monitored with non-dividend devices. Empirically, the non-dividend
monitoring devices are price-to-book (PTB) ratios and outside blockholders’ ownership (BLOCK). 18
PTB is used as a measure of investment opportunities. Higher future investment opportunities indicate
greater need for external financing, and thus are more likely to drive firms to capital market and to
induce capital market monitoring (Easterbrook, 1984; NSM, 1996).
16 Even if signaling explanations and agency-cost explanations preclude each other, artificially nesting the two explanations may help us to determine their dominance (Greene, 2000). 17 Among the 332 observations, 19 (5.7%) observations pay no dividends and 80 (24.1%) observations pay dividends no more than the 95% requirement. 18 We do not consider all non-dividend monitoring devices in this study. Nevertheless, ignoring the other non-dividend monitoring devices create bias against us to find the dominance of agency cost explanations over signaling explanations for our non-monitored firms. On the other hand, ignoring the other non-dividend monitoring devices should create bias against us to find the dominance of signaling explanations over agency cost explanations for our monitored firms. As a result, our findings are stronger than they appear.
16
To maintain enough observations for both non-monitored firm-years and monitored firm-years
and to increase their structural distinction, we define non-monitored firm-years as observations with
both PTB ratios and BLOCK below their 60 percentiles and monitored firm-years as observation with
either PTB ratios and BLOCK above their 70 percentiles. This procedure potentially creates bias
against us to find evidence that the agency-cost explanations dominate the signaling explanations for
non-monitored firm-years. Finally, we have 130 observations for non-monitored firm-years and 165
observations for monitored firm-years.19
We next estimate Equation (3) with Tobit regression first for non-monitored firms and then for
monitored firms.20 For non-monitored firms, we expect to find distinct supporting evidence for the
agency-cost explanations but not for the signaling explanations. On the other hand, for monitored
firms, we expect to find distinct evidence supporting the signaling explanations but not supporting the
agency-cost explanations. In other words, as shown in Figure 2, the agency cost explanations are
hypothesized to dominate the signaling explanations for the non-monitored firms and vice versa for
the monitored firms.
19 A Chow test not reported here confirms a structural difference between non-monitored firms and monitored firms. 20 . For non-monitored firm-years, there are 10 (7.7%) observations paying no dividends and 36 (27.7%) observations paying dividends no more than the 95% requirement. For monitored firm-years, 6 (3.7%) observations pay no dividends, and 36 (21.8%) observations pay dividends no more than the 95% requirement.

17
5. Empirical results
This section presents the empirical results of Tobit models weighted by MV and with fixed
time effect for Equation (3) in Table 2.21,22 The first part describes the results for all observations in
Model 1 that disregards the non-dividend monitoring devices. The second part presents the results for
non-monitored firm-years in Model 2 and discusses the results for monitored firm-years in Model 3.
Together Model 2 and Model 3 shows the empirical effects of the non-dividend monitoring devices.
Overall our results are consistent with the substitution concept suggested by Easterbrook (1984).
5.1 Empirical results when disregarding the non-dividend monitoring devices
When disregarding the non-monitoring devices, we have mixed evidence both for the
signaling and the agency cost explanations. Model 1 presents the mixed evidence. Specifically
EXFFO has a significant and positive marginal effect (slope hereafter). The slope of EXFFO is
consistent with both the signaling and the agency cost explanations. This slope is consistent with the
hypothesis in the signaling explanations that expected cash flows increase dividends needed for
credible signals. This slope estimate is also consistent with the hypothesis that more cash flows give
managers more discretion to over-invest in non-positive net-present value projects.
Two of the four proxies of cash flow volatility have significant marginal effects. Particularly
both MV and LEVER have significant and negative slopes. In the agency cost framework, we have
no expected signs for them as discussed in Section 3. However, we expected a positive relationship
between cash flow volatility and dividend payments in the signaling framework. Therefore, the
negative slope of MV is not consistent with the joint hypothesis that larger portfolios are subject to a
smaller unsystematic risk and that firms with less volatile cash flows pay out larger dividends (BCS,
21 We also exclude firm-years that do not paying dividends and estimate Equation (3) with weighted least squares with MV as the weight and with year dummies. The results for all firm-years, non-monitored firm-years, and monitored firm-years are similar to the results from Tobit regressions reported below in the text. 22 In addition, we examine the results disregarding both the mandatory payout requirement and the non-monitoring devices. We have results consistent with signaling explanations but inconsistent with agency cost explanations from Tobit regression weighted with MV and with year dummies. On the other hand, we have evidence consistent with both signaling and agency cost explanations from weighted least squared with MV as the weight and with year dummies.

18
1998). On the other hand, the negative slope of LEVER is consistent with the joint hypothesis that the
volatility of cash flows available to shareholders increases with financial leverage and that dividend
payouts vary with the perceived riskiness of these cash flows (BCS, 1998).
There are three additional variables having significant marginal effects. These variables are
,GR ,STOCK and .INS Contrary to agency cost explanations,GR has a significant and positive
slope. The positive slope of GR is contrary to the hypothesis that firms experiencing or anticipating
rapid growth tend to retain funds to minimize the frequency of raising new capital. As hypothesized
by the agency cost explanations, STOCK has a significant and positive slope and INS has a
significant and negative slope. The positive slope of STOCK agrees with the hypothesis that outside
shareholders with more concentration of ownership are more likely to influence insider behavior,
thereby reducing agency costs and leading to lower dividend distribution. The negative slope estimate
INS is consistent with the hypothesis that outside equity holders demand larger dividends as part of an
optimal monitoring package when they own a larger share of the equity (Rozeff, 1982).
5.2 Empirical results when considering non-dividend monitoring devices
When considering the non-monitoring devices, our evidence shows that the agency cost
explanations dominate the signaling explanations for non-monitored observations. However the
evidence for effectively monitored observations is mixed.
Model 2 exhibits the empirical estimation results for non-monitored observations. The results are
consistent with the agency cost explanations and mixed with the signaling explanations. Specifically
,EXFFO ,MV ,LEVER ,STATE and STOCK have significant slopes with signs consistent with the
agency cost explanations. Particularly the significant and positive slope of STOCK provides distinct
evidence in support of the agency cost explanations. ,EXFFO ,LEVER ,STATE and INCENTIVE
have slopes consistent with the signaling explanations. The significant and positive slope associated
with INCENTIVE is consistent with the hypothesis that managers distribute smaller dividends when

19
placing more weight on the current market value of their firms (Kale and Now, 1990). However MV
has a significant and negative slope. Contrary to the signaling explanations, this slope suggests that
cash flow volatility increases dividend payouts.
Therefore, the evidence indicates that the agency cost explanations dominate the signaling
explanations when firms are not effectively monitored. As hypothesized earlier, this dominant
relationship is opposite to the relationship documented in the existing studies that do not take into
account Easterbrook’s (1984) rationale or the mandatory payout requirement for REITs.
Model 3 exhibits the empirical estimation results for monitored observations. The evidence here
is mixed for both the signaling and the agency cost explanations. In particular, for the signaling
explanations, we have EXFFO and LEVER with hypothesized slopes and INCENTIVE with slopes
against our hypothesis. For the agency cost explanations, the significant slopes of EXFFO and
LEVER have consistent signs and INS has a hypothesized sign. However the significant and positive
slope of GR is against our hypothesis.
To summarize, we have mixed evidence for both the signaling and the agency cost explanations
for monitored firms. There are two possible explanations for having the mixed evidence here. One
potential reason is the grouping itself of monitored observations. The other likely reason is that other
ways of maximizing shareholders’ wealth may provide more net benefits than signaling expected cash
flows or cash flow volatilities. One such way is to balance corporate tax savings and shareholders’
personal tax costs when REIT managers distribute dividends (Lee and Kau, 1987).

20
6. Conclusion
The REIT empirical literature offers two competing theories for the level of dividend payouts
under asymmetric information without considering the mandatory 95% (90% beginning in 2001)
payout requirement for taxable income. WEG (1993) provide evidence supporting the agency-cost
explanations for REIT dividend policies. On the other hand, BCS (1998) have evidence supporting the
signaling explanations.
Nevertheless, we obtain different evidence when considering non-mandatory dividends and non-
dividend monitoring. We have mixed evidence for both the signaling and the agency cost
explanations. One likely reason is that balancing corporate tax savings and shareholders’ personal tax
costs may provide more net benefits than signaling expected cash flows or cash flow volatilities to
shareholders when distributing dividends (Lee and Kau, 1987). On the other hand, we have evidence
against the signaling explanations and in support of the agency cost explanations for inefficiently
monitored REITs. Our evidence suggests that the agency-cost explanations dominate signaling
explanations for dividends policies of inefficiently monitored REITs.
21
References
Bradley, Michael, Dennis R. Capozza, and Paul J. Seguin. (1998). “Dividend policy and cash-flow uncertainty,” Real Estate Economics 26, 555-580.
Brandon, David L. (1997). “Federal Taxation of Real Estate Investment Trusts,” in Garrigan and Parsons (Ed.), Real Estate Investment Trusts: Structure, Analysis, and Strategy, McGraw-Hill, New York, 83-130.
Dempsey, Stephen J. and Gene Laber. (1992). “Effects of agency and transaction costs on dividend payout ratios: further evidence of the agency-transaction cost hypothesis,” The Journal of Financial Research 15, 317-321.
Eades, Kenneth M. (1982). “Empirical Evidence on Dividends as a Signal of Firm Value,” The Journal of Financial and Quantitative Analysis 17, 471-500.
Easterbrook, Frank H. (1984). “Two agency-cost explanations of dividends,” The American Economic Review 74, 650-659.
Filbeck, Greg, and Donald J. Mullineaux. (1993). “Regulatory monitoring and the impact of banking holding company dividend changes on equity returns,” The Financial Review 28, 403-415.
Filbeck, Greg, and Donald J. Mullineaux. (1999). “Agency costs and dividend payments: the case of bank holding companies,” The Quarterly Review of Economics and Finance 39, 409-418.
Graham, Carol M., and John R. Knight. (2000). “Cash flows vs. earnings in the valuation of equity REITs,” Journal of Real Estate Portfolio Management 6, 17-25.
Greene, Willianm H. (2000). Econometric Analysis 4th Edition, Prentice Hall, New Jersey.
Internal Revenue Service. (2002). Instructions for Form 1120-REIT. Available: http://www.irs.gov/pub/irs-pdf/i1120rei.pdf.
Jensen, Michael C. (1986). “Agency costs of free cash flow, corporate finance, and takeovers,” American Economic Review 76, 323-329.
Kale, Jayant R. and Thomas H. Noe. (1990). “Dividends, uncertainty and underwriting costs under asymmetric information,” The Journal of Financial Research 13, 265-277.
Lee, Cheng F. and James B Kau. (1987). “Dividend Payment Behavior and Dividend Policy on REITs,” Quarterly Review of Economics and Business 27, 6-21.
Mooradian, Robert M. and Shiawee X. Yang. (2001). “Dividend policy and firm performance: Hotel REITs vs. Non-REIT Hotel Companies,” Journal of Real Estate Portfolio Management 7, 79-87.

22
Noronha, Gregory M., Dilip K. Shome, and George E. Morgan. (1996). “The monitoring rationale for dividends and the interaction of capital structure and dividend decisions,” Journal of Banking and Finance 20, 439-454.
Ross, Stephen A. (1977). “The determination of financial structure: the incentive-signalling approach,” The Bell Journal of Economics, 8, 23-40.
Rozeff, Michael S. (1982). “Growth, beta and agency costs as determinants of dividend payout ratios,” The Journal of Financial Research 5, 249-259.
Dempsey, Stephen J. and Gene Laber. (1992). “Effects of agency and transaction costs on dividend payout ratios: further evidence of the agency-transaction costs hypothesis,” The Journal of Financial Research 15, 317-321.
Wang, Ko, John Erickson, and George W. Gau. (1993). “Dividend polices and dividend effects for real estate investment trusts,” Journal of the American Real Estate and Urban Economics Association 21, 185-201.
23
Table 1: Summary Statistics Variable Label n Mean Std Dev Minimum MaximumDividend ($ millions) DV 332 31.861 38.821 0.000 350.183Excess dividend ($ millions) EXDV 332 7.177 12.175 0.000 107.717Dividend per share ($) DIVPS 332 4.505 33.140 0.000 540.120Dividend yield (%) DY 332 9.954 43.797 0.000 801.778Dividend payout (%) DP 332 126.602 246.681 -1,935.100 1,909.370Dividends / funds from operations (%) DV/FFO 332 77.954 136.073 -1,165.782 1,769.731Dividends / taxable income (%) DV/TI 332 99.415 225.212 -1,935.093 1,369.412Fund from operations ($ millions) FFO 332 47.472 66.366 -15.160 676.310Net income ($ millions) NI 332 25.913 36.069 -13.000 349.029Taxable income ($ millions) TI 332 30.286 40.726 -11.302 394.875Market value ($ millions) MV 332 449.239 678.620 1.043 7,875.600Leverage ratio (%) LEVER 332 43.013 18.813 0.000 92.160States with real estate investment STATE 332 10.280 8.153 1.000 43.000Trading volume/ number of common shares INCENTIVE 332 56.224 42.540 4.542 518.100Asset growth ratio (%) GR 332 111.803 118.209 -35.332 1,456.030ROA (%) ROA 332 3.325 5.078 -55.151 15.974Insider ownership (%) INS 332 13.768 14.765 0.079 77.900Price to book ratio (%) PTB 332 184.366 156.787 11.900 1,547.850Number of common shareholders (thousands) STOCK 332 6.960 16.298 0.019 161.640Blockholders' ownership (%) BLOCK 332 14.437 14.988 0.000 77.010

24
Table 2: Tobit Regression for Dividend Distribution and Mandatory Payout Requirement for Taxable Income
Signaling
Explanations Agency Cost Explanations
Model 1 (All Observations)
Model 2 (Non-monitored Observations)
Model 3 (Monitored Observations)
Dependent Variable
EXDV EXDV EXDV
Independent Variables
Hypothesized Sign
Hypothesized Sign
Marginal Effects Z
Marginal Effects Z
Marginal Effects Z
Constant No No 6.385 0.859 -5.361 -0.541 6.388 0.649 EXFFO + + 0.124 3.150*** 0.530 7.180*** 0.167 3.033*** Lagged EXFFO No 0.509 6.482*** 0.540 5.930*** 0.282 3.658*** MV + No -0.010 -5.746*** -0.026 -10.051*** -0.002 -1.166 LEVER - No -0.159 -2.678*** 0.165 1.890* -0.194 -2.367** STATE + No -0.025 -0.273 0.225 1.704* 0.218 1.625 INCENTIVE + -0.036 -1.213 0.083 2.209** -0.095 -1.744* GR - 0.021 1.909* -0.026 -1.395 0.047 2.916*** ROA - 0.112 0.313 0.812 1.130 0.009 0.020 STOCK + 0.115 2.878*** 0.126 4.275*** -0.108 -0.872 INS - -1.171 -2.335** -0.196 -1.548 -0.166 -1.757* Log-L -1,183.393 -408.207 -566.663 k 20 19 20 n 332 130 165 Note:
1. All models contain dummy variables of time fix effect and weighted by MV. 2. The value of k is 19 instead of 20 because of no non-monitored observations in 1993. 3. DV stands for cash dividends paid for common stocks. 4. EXDV stands for cash dividends paid for common stock in excess the 95% payout requirement. 5. EXFFO stands for FFO in excess of 95% of taxable income. 6. Marginal effects here are unconditional marginal effects.
25
Price to Book (PTB) Ratios
Monitored Firm-Years
Monitored Firm-Years
Firm-Years with BLCOK between 60- 70 Percentiles
Outside Blockholders’ Ownership (BLOCK)
Monitored Firm-Years
Firm-years with PTB Ratios between 60-70 Percentiles
Non-Monitored Firm-Years
Figure 1: Classification of Non-Monitored Firm-Years and Monitored Firm-Years
Non-Monitored Firm-Years
Monitored Firm-Years
Signaling Explanations No Distinct Supporting Evidence
Distinct Supporting Evidence
Agency Cost Explanations
Distinct Supporting Evidence
No Distinct Supporting Evidence
Dominance Agency Cost Explanations Signaling Explanations
Figure 2: Monitoring and Expected Dominance between the Signaling and the Agency Cost Explanations