monitoring and evaluation of social forestry in india …(v) preface social forestry and wastelands...
TRANSCRIPT

Monitoring and evaluation of social forestry in India - an operational guide
n operational guide • the monitoring nd evaluation f social forestry I India
. Slade I
iabrlel Campbell 1 contributions from .oronha .uhathakurta repplng I ~st officers in India

The designations employed and the presentation 01 material in this publication do not imply the eKpression 01 any opinion whatsoever on the part 01 the Food and Agriculture Organization 01 the United Nations concerning the legal status 01 any country. territory. city or area or of its authorities. or concerning the delimitation of its frontiers or boundaries.
M·36 ISBN 92·5-102509-6
All rights reserved. No part 01 this publication may be reproduced. stored in a retrieval system. or transmitted in any lorm or by any means, electronic. mechanical. photocopying or otherwise. without the prior permission of the copyright owner. Applications lor such permission. with a statement of the purpose and eKtent 01 the reproduction. should be addressed to the Director, Publications Division. Food and Agriculture Organization of the United Nations. Via delle Terme di Caracalla. 00100 Rome. Italy.
©FA01H1

(iii)
FAO FOREWORD
Monitoring and evaluation should be an integral part of the sound management of any form of forestry project. In projects which seek to help rural people participate in and benefit from forestry activities they are essential. As Dr. Choudhry explains in her preface to this publication, M&E provides decision makers with essential information and also permits the assumptions upon which policy and projects are based to be reviewed in the light of objective, quantified evidence.
Social, communal and other forms of participatory forestry projects are nearly everywhere still young; much remains to be learned. Of all countries, India has perhaps the most extensive and varied experience, and is a leader in this field. Among its many pioneering activities has been the development of a monitoring and evaluation system which all entities engaged in social forestry - within the different branches of government and outside it - can apply and use.
This publication reproduces the operational guide to the monitoring and evaluation of social forestry which is being used throughout India. As will be seen from the Preface, it has been developed from the sum of the experiences of social forestry units from all parts of the country, working with monitoring and evaluation specialists from the World Bank and FAO. Many aspects of the system of course reflect features which are unique to India, but much, including its basic framework and approach, should prove useful in other countries as wei!. Accordingly, the Guide is now published in the FAO Forestry Paper series.


(v)
PREFACE
Social forestry and wastelands development form a major component in India's strategy to deal with ecological balance and socio-economic crisis. More than half of India - the poorer half - depends for its sustenance needs of fuelwood, fodder and small timber on the forests and other common lands which have become increasingly denuded and degraded over the years. The Prime Minister of India has given a call to the nation to afforest 5 million hectares a year, primarily for fuelwood and fodder, and develop it as a people's movement.
There are several schemes involved in social forestry and the afforestation of degraded areas. It is essential that we carefully follow the progress of these programmes and projects in order to ensure that they are achieving stated objectives and are doing so as quickly and effectively as possible. Monitoring and evaluation are necessary in any project to provide policy makers and managers with essential data. The latter must assess progress, and impact on the one hand and respond to unexpected events and midterm corrections on the other hand. Monitoring and Evaluation are particularly important 'in a relatively new innovative and experimental programme so that learning as well as unlearning of assumptions and attitudes can take place. Monitoring and evaluation also provides feed-back from the grassroots level, enabling us to assess how well the programme is meeting the needs of the rural poor.
This Operational Guide to the Monitoring and Evaluation of Social Forestry, including Wastelands Development in India, has been prepared in order to provide a system which can, and should, be used in all social forestry projects and related programmes in the country. It is intended to provide information at the project level, for each State programme and for the country as a whole. Each State is expected to use this system both for its own operations and to provide information on progress to the National Wastelands Development Board.
The Guide is the result of a collaborative effort by the World Bank, FAa, and the Government of India. An effort in which all States and Union Territories also participated. Several States are already using it in part, and others have introduced it on a trial basis. It is hoped that all of them will now take the steps necessary to operate and implement it as speedily as possible.
Undoubtedly, as experience with the application of the Guide is accumulated, it will become necessary to refine its precepts further. It will therefore be reviewed periodically. It is also probable that some will encounter unforeseen difficulties in applying it. Arrangements have been made to provide technical advice and assistance to those State social forestry monitoring and evaluation units that require it. Requests for such assistance should be addressed to the Board.
It is also hoped that the States will choose their staff with care and provide them the necessary opportunities for training so that a strong and viable monitoring units are built.

(vi)
This Operational Guide is a silnificant s'tep towards providinl more reliable data, analysis and evaluation of problems, and will thus strenlthen the social forestry and wastelands development prOlramme. I wish to thank Mr. R.B.Slade of the World Bank and Mr. J. Gabriel Campbell, Consultant to FAO, for their deep involvement and painstakinl efforts in finalisinl this Guide. I also wish to thank the Forest Officers of the States who have contributed silnificantly to clarifyinl ideas and to makinl the Guide a more practical document.
National Wastelands Development Board New Delhi
July 10th. 1986
Kamla Chowdhry Chairman
(vii)
TABLE OF CONTENTS
Foreword by MA. Flores Rodas, Assnt. Director General, F AO Preface by Dr. K.C. Chowdhry, Chairman, NWDB
iii v
Table of Contents vii ix xii xiii
Acknowledgemen t List of Abbreviations Glossary
PART A
I. Introduction and Overview Social Forestry in India
1 1 2 4 5
Role of Monitoring and Evaluation The Guide An Overview of the Monitoring & Evaluation System
II. The Monitoring and Reporting 01 Progress 9 Seedling Production and Distribution (Nursery Reports) 11 Plantation Records and Reports IS Quarterly GOI (All India) Monitoring Report 18 Monitoring of Forestry Produce Prices 30 Annex I - Proforma District Summary of Plantation Reports 33
III. Monitoring and On-Going Evaluation 01 Farm Forestry and Village Woodlots
A. On-Going Evaluation of Farm Forestry Objectives The Information Required The Reason for Sampling and the Design of a Sample The Initial Analysis B. On-Going Evaluation of Village Woodlots Reason for On-Going Evaluation The Sampling Plan The Information Required
IV. The Monitoring and On-Going Evaluation 01 Other Social Forestry
35
35 36 37 40
41 42 43
Activities and Other Studies 45 Monitoring and Evaluation of Strip Plantations and Rehabilitation of Degraded Forests 46 Monitoring and On-Going Evaluation of Tree Patta. Tree Tenure and Group Farm Forestry Schemes 49 The Monitoring and On-Going Evaluati,on of Improved Wood stoves and Crematoria SO The Monitoring and On-Going Evaluation of Institutional Forestry SO Review of Management and Administration System 51 Special Study of Extension and Publicity Activities 51 Economic Analysis of Different Types of Farm Forestry and their effects on Crop Production and Labour Utilisation 51 The Role of Women and Other Underprivileged People in Social Forestry 51 Incentives, Legislation and the Effects of Markets on Private Tree Growing 52 Effectiveness of non-Governmental Organisations 53
Causes of Non-Participation in Social Forestry 53

(viii)
Annex I - Proforma Tabulations for Results of Rapid Reconaissance Survey of Strip Plantations and Rehabilitation of Degraded Forests S4
V. Resource Requirements and Unit Organisation 57 Field Staff Requirements S7 Headquarters Staff Requirements 60 Qualifications and Duties of Monitoring cSt Evaluation Staff 60 Size, Structure and Cost of Monitoring cSt Evaluation Units 61 The Unit and the Social Forestry Program 64 Monitoring and Evaluation - The State and the Government of India 64 Annex I - Detailed Qualifications and Duties of
Monitoring and Evaluation Staff 66
PART B
VI. The Farm Forestry Survey 69 Sampling Procedures 69 Questionnaire Design 77 Proforma Farm Forestry Questionnaire 80 Initial Tabulation of Results 94 Annex 1- A Note on Estimation Procedures if Done by Hand 124 Annex 11 - A Note on Estimating the Sampling Error 126 Annex 111- Computer Program for Farm Forestry Sample
Selection 131
VII. The Village Woodlot Survey Sampling Design. Sample Size and Survey Procedures Questionnaire Design Proforma Village Woodlot Questionnaire Initial Tabulations
135 135 138 139 154
VIII. The Management and Implementation of M&E Operations 181 The Implementatipn and Management of Monitoring Operations 181 The Implementation and Management of the Main On-Going Evaluation Activities 182 The Implementation and Management of Other Evaluation Activities, Particularly Special Studies' 188 Overall Management and Work Planning 190
IX. Use of Microcomputers. Data Processing. Analysis and Presentation 195
The Role of Microcomputers 195 Data Preparation: Filing, Coding, Entry and Editing 196 Variable Preparation: Computation and Transformation 199 Tabulation and Initial Analysis 200 Additional Statistical Analysis 201 Information Presentation and Dissemination 202 Training and Resource Requirements for Computerization 204 Annex I - Specifications for Suggested Microcomputer
Hardware and Software 206 Annex 11 - Menu for Statistical Analysis and Sample
~~ts 2~ Annex III - The Reliability and Differences Between
Estimates . 213 Annex IV - Examples of Simple Computer Graphics 216

(ix)
ACKNOWLEDG EMENT
This Guide has been prepared to help those responsible for monitoring and evaluating social forestry programmes and projects in India. It provides detailed operational guidance on the organization, staffing and operation of monitoring and evaluation activities, and on the design and conduct of appropriate data gathering and processing systems.
The Guide has been written in close consultation with the Social Forestry units in the States. The first draft was based on material gathered during discussions and field visits to selected projects during September and October 1982. This was reviewed at a national workshop convened for this purpose by the Government of India, from 27th June to 2nd July 1983 in Hyderabad. Representatives from the Government of India, fifteen States, the main bila teral aid agencies supporting social forestry in India, F AO and the World Bank took part. At the workshop all aspects of monitoring and evaluation of social forestry projects were examined in depth by working groups, and a revised framework for the Guide was developed.
In mid 1984, after further field vlSlts, a completely rewritten working draft of the Guide was distributed to State social forestry authorities for field testing. A second national workshop was then convened by the National Wastelands Development Board, from 10th to 15th February 1986, in Bangalore. This was attended by representatives from 20 States and territories and by the World Bank, FAO and bilateral agencies. At the workshop the contents of the Guide were reviewed in detail in the light of the experience gained in using it. A small Committee was then set up to advise on the finalization of the Guide.
The Government of India (NWDB) QuarterlY Monitoring Report, which appears as Figure 2.4 in the Guide, was finalized at a meeting of State representatives held at the National Wastelands Development Board on 28 February 1986. The other parts of the Guide were revised over the subsequent four months, and a final draft was reviewed and approved at a meeting of State Forest Officers chaired by Shri M. Varaderajan, Member-Secretary, NWDB., held in Delhi on 7th July 1986.
The Guide was prepared with the assistance of the World Bank and the Food and Agriculture Organization of the United Nations (FAO). It was written by Roger H. Slade of the World Bank and J. Gabriel Campbell of FAO. Michael Arnold, Chief Policy and Planning Division, Forestry Department, FAO, provided coordination and guidance. Contributions to earlier drafts were made by Prabir Guhathakurta, then Deputy Inspector General of Forests, Government of India, Raymond Noronha, consultant to FAO and Benjamin Tepping, consultant to the World Bank. The FAO contribution was provided through its Forestry for Local Community Development Programme with financial support from the Swedish International Development Authority.
The Guide draws heavily upon materials and advice provided by Social Forestry staff from many States, by the staff of the National Wastelands Development Board and other institutions. The authors gratefully acknowledge the contributions of each of the many persons and institutions who contributed to the preparation of the Guide, particularly the participants in the Bangalore Workshop on Monitoring and Evaluation in Social Forestry and follow-up meetings, whose names are listed overleaf.

Andhra Pradesh.
Arunachal Pradesh. Assam.
Bihar.
Gujarat.
Haryana.
Himachal Pradesh.
Jammu & Kashmir.
Karnataka.
Kerala. Madhya Pradesh. Maharashtra.
Manipur. Meghalaya. Orissa.
Punjab.
Rajasthan.
Sikkim. Tamil Nadu.
Uttar Pradesh.
West Bengal. GOI/NWDB.
NWDB Consultants.
(x)
Shri D. Aurora., Principal Secretary, Food & Agr. Dept. Shri E. Venugopala Rao., C.C.F. (Social Forestry). Shri. Y. Rama Mohan Rao., D.C.F. (Monitoring). Shri. P.M. Sangal., C.F. (Pasighat). Shri. N.C. Chakravarty., C.F. Shri. K.K. Gohain., C.F. Shri. N. Prased, Commissioner & Secretary, Rural Dev. Dept. Shri. A. Krishnaswamy., D.F.O. (Monitoring). Shri. B.P. Lakhani., C.C.F. (Community Forestry). Shri. P. Khanna., D.C.F. (Economics). Shri. Ashok Kumar., C.F. (Monitoring). Shri. MS. Vaid., C.C.F. Shri. Banarsi Das., A.C.C.F. (Social Forestry). Dr. Ramesh Singh., D.C.F. Shri. Attar Singh., Commissioner & Secretary, Forests. Shri. A.K. Mukherji., C.C.F. (Planning & Development). Shri. D.R. Dhiman., C.F. (Social Forestry). Shri. G.R. Sufi., C.C.F. Shri. Aga Syed Attaf., Commissioner Forests. Shri. Lalachand., D.C.F. (Monitoring). Shri. S. Shyam Sunder, P.C.C.F. Shri. N.V. Ramachandra Chetty., C.C.F. (Development). Shri. P.D. Gaonkar, Addl. C.C.F. (Social Forestry). Shri. K.J. Joseph., C.C.F. (Social Forestry). Shri. R.N. Mathur., C.F. (Social Forestry). Shri. H.A.D. Sawain., Secretary, Hort. & S.F. Shri. D.V. Narurkar., Director. (Social Forestry). Shri. Kanwarjit Singh., Joint Director. (Social' Forestry). Shri. H. Jel Shyam., Commissioner & Secretary, Forests. Shri. P. Kharkongor. Shri. N.C. Pattnaik., Jt. Director, Social Forestry (Extn). Shri. B.K. Pattnaik., Dy. Director, Social Forestry (M&E). Shri. Y.I. Chowdary., C.C.F. Shri. K.S. Aulukh., C.F. Shri. S. Verma., Director, Social Forestry. Shri.J.P.Kapoor., C.F. (Planning and Monitoring). Shri. A.L. Sharma., D.C.F. Shri. R.K. Khetrapal, D.C.F. Shri. P.S. Moktan., Secretary & C.C.F. Shri. J. Wilson., Addl. C.C.F. (Social Forestry). Shri. V. Chokkalingam., Dy. Director. (Statistics). Shri. B. Arulprakasam. C.F. Shri. W.P. Durairaj., D.C.F. (Monitoring). Mrs. V. Chanderlekha, Director, Rural Dev. Dept. Shri V.B. Mittal, Secretary, Dept. of Agriculture. Shri. K.B. Srivastava., C.C.F. (Social Forestry). Shri. H.C. Khanduri., C.F. Shri. S.K. Das. D.C.F. (Social Forestry M&E Cell). Dr. Kamla Chowdhry., Chairman, NWDB. Shri. M. Varadarajan., Member-Secretary, NWDB. Shri. N.C. Saxena., Joint Secretary, NWDB. Shri. Y.G. Jadhav., Addl. IGF. GOI. Shri. M.J. Oka., DIGF., GOI. Shri. S.K. Jain., Asst. Commissioner, GOI. Shri. Sap ish K. Dhingra, Senior Systems Eng. C.MC. Ltd. Shri. V.H. Auluck, Manager, C.M.C. Ltd.

GOI/Rural Dev. Dept.
GOI/Planning Comm.
SPWD.
CIDA.
FAO. ODA Consultant. SIDA. USAID.
World Bank.
(xi)
Shri. A.M. Rastogi, Joint Secretary. Shri. D. S. Sagvan., Deputy Advisor, Forests. Dr. Manju Sharma, Joint Advisor. Shri. R.C. Meena., Research Officer. Shri. V. Agarwal., Forestry Advisor, Society for the Promotion of Wastelands Development., New Delhi. Mrs. L.J. McDonald., First Secretary (De v), Canadian High Commission, New Delhi. Mr. Richard Baerg., Forestry Expert. Mr. J.E.M. Arnold., Chief, FODP, FAO. Dr. P.D. Hardcastle., Oxford Forestry Institute. Prof. Hans Egneus, Project Coordinator, Orissa. Mr. H. Fisher, Forestry Advisor. Dr. C. Hatch., Forestry Advisor. Shri. Amitabha Ray., Programme Specialist (Forestry). Dr. L. Ljungman., Senior Forestry Specialist. Dr. A.K. Banerjee., Forester.

AEW CCF CF DCF DDP DFO D.K. DPAP DRDA EST. FD FEW FFQ GOI Ha. INC. IRDP Km. m. M&E MEU NjA NGO No. NREP NWDB RDD RDF RLEGP Rs. SC SF SP ST TOR YEW VLW VW VWQ
(xii)
LIST OF ABBREVIATIONS
Agricultural Extension Worker Chief Conservator of Forests Conservator of Forests Deputy Conservator of Forests Desert Development Programme Divisional Forest Officer Don't know Drough t Prone Area Programme District Rural Development Administration Estimated Forest Department Forestry Extension Worker Farm Forestry Questionnaire Government of India (Central Government) Hectare Incomplete Integrated Rural Development Programme Kilometer Meter Monitoring and Evaluation Monitoring and Evaluation Unit Not Available Non-government Organisation Number, also denoted by the symbol #
National Rural Employment Programme National Wastelands Development Board Rural Development Department Reha bilitation of Degraded Forests Rural Landless Employment Guarantee Programme Rupees Scheduled Caste Social Forestry Strip Plantation Scheduled Tribe Terms of Reference Village Extension Worker Village Level Worker Village Woodlot Village Woodlot Questionnaire

Billion Block Circle
Crore District Division
Lakh Paise Pallchayat Palla Range Sarpanch Taluka
(xiii)
GLOSSARY
1,000 million A unit of administration below the district. A unit of forest administration consisting of two or more divisions. 10 million or 100 lakhs The principal administrative unit below the State. A unit of forestry administration, approximately equal to a District. 100,000 One hundreth of a Rupee. Village Council. Leasehold. A unit of forestry administration below the division. Chairman of V iIlage Council. A subdivision of a District larger than a block.


1
I. INTRODUCTION AND OVERVIEW
1. Social Forestry In India
Social forestry programs in India have grown in importance and scale and now constitute a major element in India's overall p'rogramme of rural developmen t. From modest beginnings over a decade ago, there has been an almost exponential growth in the human and financial resources devoted to social forestry. During the sixth Five Year Plan period which covered the first half of the 1980s approximately Rs. 10 billion (one thousand crore) or nearly US$ 1 billion was spent on social forestry activities. This figure is expected to double during the Seventh Five Year Plan (1985 - 90) with funds provided by the Government of India, State Governments, bilateral and multilateral donors, private industries and individuals.
The term social forestry is difficult to define precisely, but is generally understood to mean tree-growing (including associated products, e.g. bamboo, grasses, legumes) for the purpose of rural development. As social forestry has a rural development focus and is heavily dependent on the active participation of people, it is also known as "forestry for local community development" or "participatory forestry". An up to date and comprehensive discussion of these terms and the role of social forestry in rural development is to be found in Tree Growing by Rural People, FAO Forestry Paper, 64, 1985. Although a wide range of activities are included in social forestry, five main components can be distinguished in India. With variations, they are:
1. farm forestry (tree growing on private land),
2. farmer leasehold or tree pat/a,
3. village woodlots or community forestry,
4. strip plantations alongside roads, canals, railways, etc., and
5. reforestation or rehabilitation of degraded forest areas.
Social forestry programs usually include one or more of these components. There are also distinctions between and within these components depending on who owns the land on which the trees are being planted (e.g. private farmers, private industries, municipalities, forest departments, revenue departments, etc.) or who is responsible for the planting (e.g. farmers, villages, cooperatives, voluntary agencies, rural development departments, schools, etc.). Although these distinctions are sometimes blurred, all forms of social forestry are differentiated from commercial or territorial forestry by the involvement of the rural population in decision-making, management and as beneficiaries.
Farm forestry is tree planting undertaken by individual households on their own land or land they have rented from others. Tree seedlings may be planted in blocks (small plantations), on field boundaries. or around homesteads. They may be intermixed with agricultural crops in several forms of agroforestry, or they may be planted alone on either agricultural land or uncultivable wastelands. Farmer leasehold or tree palta denotes a kind of farm forestry in which poor farmers or landless laborers are given leases to tracts of public land on which, with varying degrees of public support, they are constrained to grow trees. Village woodlots are small plantations on communal or government lands, operated by or on behalf of the village, for the benefit of the village as a whole. although there may be special arrangements

2
which provide preferential treatment to the under-privileged. Strip plantations are relatively narrow areas along the sides of roads, canals, railways, and rivers, established by the Government (usually the Forest Department) with the intention of providing the benefits of forest products to local people and to serve as demonstration areas. The reforestation or rehabilitation of degraded forests refers to large plantations on public lands which have been severly degraded and which are often in environmentally critical areas. Such plantations mayor may not be considered a form of social forestry depending on whether or not there is significant involvement of local communities.
The objectives of social forestry necessarily differ by component. While all social forestry aims to increase tree production and reduce environmental degradation, the nature of the product, the type of management, and the distribution of benefits depend on the type of social forestry involved. Farm forestry is designed to help rural households better meet their own needs, whether through the direct production of fuel wood, fodder, and poles for their own use or through the production of a commercially marketable crop of poles or pulpwood. Tree patta forestry is similarly designed to increase the incomes of poor households through the sale of forest products and at the same time to help satisfy their need for fuel wood and fodder. Village woodlots are intended to provide tree products, particularly fuel wood and fodder, for the community as well as (in many cases) income to the local village panchayat. Strip plantations and reforestation are designed to provide local communities with some of their fuel wood and fodder needs and to conserve and improve the environment. To a varying degree, each of these components has features which deliberately target benefits towards the poorest and most under-privileged sections of society, including rural women who are frequently those hardest hit by the growing scarcity of tree products. However, these poverty-alleviation objectives and those related to production are often confused and this contributes to the widespread controversy surrounding the social, economic and environmental effects of social forestry.
The massive social forestry programs being carried out in India are, at present, spearheaded by the National Wastelands Development Board specially created by the Prime Minister. While the principle implementing agencies for these programs in each State are the Forest Departments, other government departments and private and voluntary agencies are increasingly being mobilized to meet national objectives. State Forest Departments have typically introduced new organizational structures to plan and implement social forestry activities and have appointed separate staff in the field and at headquarters. For forestry departments as much as for other departments and agencies, social forestry represents a departure from traditional activities and styles of working.
2. The Role of Monitoring and Evaluation
Despite the magnitude of the social forestry programme in India, there is little reliable information available to policy makers and program managers regarding the progress and effects of the program. This is perhaps, because of the novelty of the approach and the rapid and recent expansion. The widespread lack of effective information systems has hampered management and policy makers in improving the design and implementation of their programs. The scarcity of reliable information has also led to controversies and debates fueled more by impressions, isolated field visits and pre-determined opinions than by objective empirical information.

3
For these reasons. the "Government of India and most of the State Governments and other agencies involved in promoting social forestry have placed a high priority on developing an effective monitoring and evaluation (M&E) system to serve both the State Government Departments and Agencies and the Central Government. To meet this need. most social forestry projects have made specific provision for the establishment of monitoring and evaluation units (MEUs). which are expected to collect and interpret information on all social forestry activities. In a number of States. such units have been set up and have commenced operations. In other States units are planned. The purpose of this Guide is to set out the M&E system to be used by these units throughout India and to provide specific guidance on its implementation. The Guide has benefitted from advice provided by many foresters and other people in India. As a result it represents a system which, with a few modifications to suit local conditions. can be applied nationwide.
The primary role of monitoring and evaluation is to improve programme or project implementation so that the program's ultimate objectives can be met and to periodically measure progress towards these objectives. Although in many ways simply the two ends of a continuum of information, monitoring and evaluation can be separated from one another conceptually.
Monitoring can be regarded as an assessment of the efficiency with which the programme is implemented -- including measurement of the quantity and timing of input delivery and output produced. Monitoring is usually understood to include the tracking of both financial and physical activity through regular quantified reports. While detailed financial reporting and accounting systems are usually already in place for auditing purposes, systematic physical reporting and monitoring of the implementation process (both problems and progress) is not well developed. The relationships between financial expenditures and physical output are not usually studied and hence little is known about the unit costs of achievements or whether lower costs would have produced equivalent results.
In contrast. evaluation can be construed as the assessment of the results of implementing the programme. On-going evaluation is a means of exammmg the most important direct effects of the program concurrently with its implementation. This form of evaluation, sometimes called beneficiary monitoring, is meant to serve as an extension of the monitoring system in the sense that its primary purpose is still to provide managers and policy makers with information about the individuals and communities affected which will allow program implementation to be improved. Accordingly, in this Guide ongoing evaluation is considered to be part of the monitoring functions to be performed by the MEV.
Ex-post evaluation is differentiated from on-going evaluation by being conducted when a project or programme is completed as a means of assessing its overall impact and achievements. This type of evaluation, while not inherently undesirable. is complex. has a rude appetite for data. and usually requires sophisticated analytical methodologies and considerable financial and computing resources. For this reason, such ex-post impact evaluations are not included in the functions of the MEV outlined in this Guide. There is, however. value in conducting such ex-post evaluations and, in general, these should be undertaken by competent outside institutions.
Since monitoring and on-going evaluation are closely related they can often profit from being functionally integrated. Hence. while monitoring lays stress on the reporting of project progress and constraints as a time bound aid to programme management, it should be closely linked to evaluation when

4
the latter is used as a means of determining whether implementation is meeting its original objectives or producing unanticipated results which may affect (positively or negatively) the outcome of the program. Since both types of information are important to management and policy-makers', they are dealt with together in this Guide.
As widely recognized in India, a separate and specialized monitoring and evaluation unit (MEV) is necessary to implement an effective M&E system. In order to maximize the MEV's direct usefulness to management and to the daily implementation of a social forestry programme, it is recommended that, as is generally the practice, the unit be located within the implementing department or agency and report directly to top management. The duties and responsibilities of the MEV can be summarized as follows:
(a) to establish, in cooperation with programme management, clearly defined objectives and targets for program implementation against which progress can be monitored;
(b) to implement and operate a monitoring system, including the development and application of methodologies and procedures for the collection and analysis of information;
(c) to collect information to enable the periodic evaluation of progress and effects through existing administrative and accounting records, surveys and studies and to analyze, interpret and report the findings to management and, through them, policy makers and other interested bodies;
(d) to undertake, on an ad hoc basis, enquiries and studies in order to solve urgent problems for management; and
(e) to follow-up on the recommendations and results of monitoring and evaluation and assist in integrating them into future plans.
However, MEVs sho.uld not generally undertake investigations that are more properly classified as research studies, even though they may be relevant to programme performance. For example, studies of the impact of different silvicultural regimes on water tables, of the agronomic and economic interactions of trees and crops, or of the impact of increasing fuel wood supplies on health and nutrition should all be considered as long term research studies outside the purview of an MEV. Not only are such studies long-term in that they have to be carried out over many years for the results to have some validity, but they are costly and technically complex and are, therefore, best carried out by research institutions.
3. The Guide
This Guide has been developed to provide specific guidance and instructions on the establishment and implementation of social forestry monitoring and evaluation units in India. It is designed to provide a practical, easy to understand and implement, set of procedures for the operation of an efficient M&E system for a State social forestry programme. It also aims to ensure that the data collected are as objective as possible, that defensible procedures are used, that the resulting information is analyzed scientifically and, finally, that it is presented to management, the State Government and the Government of India speedily and in a readily usable form.

s
The Guide is tailored, firstly. to meet the needs of managers of social forestry programs implemented by Forest Departments and other Departments and Agencies in the States of India. All government departments responsible for social forestry programs are expected to implement the Guide and other agencies are encouraged to do so. Secondly, the Guide has been designed, from the outset, to provide policy makers within each State and in the Government of India with the information they require to oversee and guide State programs. Thirdly, by showing in detail how a specific M&E system for social forestry would work, it is intended to serve as a model for the wider audience within and outside India interested in the subject.
The Guide is oriented to social forestry programs in India, rather than projects. All of the many agencies involved in financing social forestry (State Governments, the Government of India, foreign donor agencies, private institutions), generally provide funds for specific projects over fixed periods of time These "time slices" should, however be viewed as part of the larger and longer programme of social forestry development, which is itself part of the wider national wastelands development program. Rather than link monitoring and evaluation to specific "aided" projects, it is viewed here as an adjunct to the management and implementation of the overall program. While the Guide can, and certainly should, be used by specific projects, it is intended to provide the basis for state-wide and national monitoring and evaluation in social forestry. In this way, the development of the system recommended in the Guide and the establishment of MEUs is conceived and planned as part of the long term process of developing institutions capable of sustaining the national social forestry program.
The Guide is divided into two main parts. Part A comprises five chapters which provide an overall description of the recommended M&E system together with methods of organization and resource requirements. These chapters are directed particularly to programme managers. They are intended to be comprehensive enough to allow managers to grasp the elements of the system while leaving the technical details, of greater interest to M&E staff, to Part B. Part B is composed of four largely technical chapters. These are intended to be read and studied by the staff of monitoring and evaluation units and to aid them in implementing the system. These chapters provide very specific guidance, including proformas, tables and working procedures. Although such details are likely to be of less interest to programme managers, they are certainly encouraged to study those parts that interest them.
Whilst the contents may appear to be comprehensive, they have been deliberately limited to a minimal programme of essential monitoringandevaluation. In view of limited resources and the impossibility of forseeing all issues worthy of attention at the outset, detailed guidance has been confined to those aspects of social forestry programs which experience to date suggests must be properly studied. Other aspects of the M&E system have been left to develop as time, resources, and priorities allow. In this sense, the system set out in detail in the Guide is a minimum package: a foundation upon which to build as experience and skills increase.
4. An Overview of the M&E System
To aid understanding of the system as a whole, Figure 1.1 provides an overview of the sources, flows, and destinations of M&E information. The top most part of this figure shows the main activities of a social forestry programme. The categories of plantations in Figure 1.1 correspond to those in Chapter II which deals with progress reporting. Downward pointing triangles

6
Flaure 1.1: INFORMATION FLOWS IN THE M&E SYSTEM.
Deparlm'DIII
Nurscri ••
Olh.r DePlrlDlCDIl
511" Go",rDm'DI
0.0.1.
MEU
SF MaDI.cmeDI
MoDlhly FiDlDcil1 Pro,reu
Reports
QUlrterly 001
Rcporil
ADDUII MAE a.porta
Pri"I"
Nlluerie.
NOTES. PF. Production Forestry. RDF - Rehabilitation of DeBraded Forests. Oth. • Other, VW - Village Woodlots, FF - Farm Forestry, TP • Tree Patta, VA • Voluntary Agencies, Spec. - Special, SF • Social Forestry, MEU • Monitoring and Evaluation Unit,

denote monitoring information, derived from nursery registers and plantation journals, which is reported for all activities by social forestry field staff. Upward pointing triangles indicate data collected by the MEU through sample surveys and special studies which comprise a different, but important part of monitoring and evaluation. This part of the data collection system is primarily required for "People's Plantations" where departmental staff are not directly responsible for planting activities and thus cannot be expected to report on them as part of their normal work.
The lower part of Figure 1.1 shows how the data obtained by the MEU after being transformed into usable information and summarized in reports, the most concrete ouput from monitoring and evaluation units, is disseminated to managers, policy-makers, and the field personnel responsible for implementation in order to provide feedback to improve performance. The chapters in the Guide deal with each of these aspects of the monitoring and evaluation system.
Chapter II deals with progress monitoring: the series of downward facing triangles in Figure 1.1. It provides minimum specifications for nursery and plantation record keeping, and sets out the essential returns (reports) that should be dispatched to the MEU from each nursery and plantation. Subsequently, the All India Quarterly Monitoring Report and Monthly Financial Progress Report which each State is responsible for preparing and sending to the National Wastelands Development Board are discussed.
In Chapter III, the system for the monitoring and on-going evaluation of farm forestry and village woodlots (see the upward pointing triangles in Figure 1.1) is described. Overviews of the sampling designs, the questions to be asked, and the methods of analysis are presented. The more technical details of M&E for these two components are provided in Chapters VI and VII.
Chapter IV deals with the remaining principal social forestry activities for which monitoring and on-going evaluation are required (see remaining upward pointing triangles in Figure 1.1) as well as other aspects of social forestry which demand the attention of the MEU. Strip plantations, rehabilitation of degraded forests, tree patta schemes, group farm forestry, improved wood fuel stoves and crematoria, institutional forestry, extension and publicity activities are examples. Some special studies are also suggested, including the economics of farm forestry, the role of women in social forestry, the effects of incentives, legislation and markets on private tree growing, the effectiveness of non-governmental agencies, the causes of non-participation, the impact of social forestry on fuel use, incomes, household time allocation and the health of natural forests, and the evaluation of social forestry management and administration. Although suggestions about the coverage and conduct of these studies are provided detailed methodologies are not.
Chapter V discusses the resources required to implement the M&E system. Details of the staff and other resources necessary are spelled out. The internal organization of the MEV is described and detailed cost estimates are provided.
In Chapters VI and VII, technical details of the farm forestry and village woodlot surveys respectively are given. In each, the sample design and procedures for drawing the survey sample are elaborated. In addition, complete questionnaires with pre-coded answers are set out together with many examples of the ways in which the resulting data can be initially tabulated.

8
Chapter VIII provides guidance on how to manage and implement M&E operations. Details on how to plan and schedule operations are given as well as guidance on field investigator selection, training, and supervision.
Chapter IX provides step-by-step guidance on handling the data collected in the field. Included, is advice on data processing, data analysis, and information presentation and dissemination. While the option of manual data processing has been retained, considerable emphasis is placed on the use of microcomputers, and an outline of a suitable computer users training course is included.
Finally, it is worth reiterating the main theme running through the Guide. In order to be truly useful, monitoring and evaluation must be undertaken in a thoroughly professional manner by specialists provided with adequate resources. This is only possible if the M&E unit is integrated with, used, and directed by programme management. Hence, it cannot be over-emphasized that management must fully understand the purpose of monitoring and evaluation and resist any temptation to regard M&E staff as an inspectorate or internal police force whose sole purpose is to criticize or report wrongdoing. The first step by management in making this commitment is to ensure that the requisite funds and manpower are made available to the unit. Thereafter the M&E system will flourish in direct proportion to the extent to which management heeds its products and gives focus to its enquiries. Monitoring and evaluation is an adjunct to improved management. Its primary justification is that, when done well, it can help social forestry programs attain the objective of helping rural people through tree husbandry.
9
II. THE MONITORING AND REPORTING OF PROGRESS
Some form of record keeping and reporting of physical and financial progress is undertaken by government departments in all States and by industries and voluntary agencies as part of their normal management and accounting systems. These records and reports are usually prepared by junior staff and passed on to higher levels of management. Historically. they have been developed primarily to satisfy auditing and accounting needs and are oriented towards documenting financial expenditures more than physical achievements. However, requests for information from State Governments and the Central Government of India (GOI) have also necessitated some reporting of physical progress, though this needs to be more systematic. In addition, the technical supervision of forestry work, particularly in Forest Departments, has resulted in the establishment of field records (e.g. at nurseries and other plantations) in many States. These technical records are not always systematically maintained and are variable in content and format.
Nevertheless, it is likely that much of the information required for effective monitoring is already available in one form or another. However, in the absence of standardized records and reporting timetables there is cer" tainly inconsistency between States and there may also be considerable inconsistency within States. Moreover, reports commonly issue from many sources, have overlapping coverage and differing timetables. This makes useful, timely and consistent compilation by an MEU difficult. The first step in developing an effective monitoring and evaluation system is to review these existing records and reports.
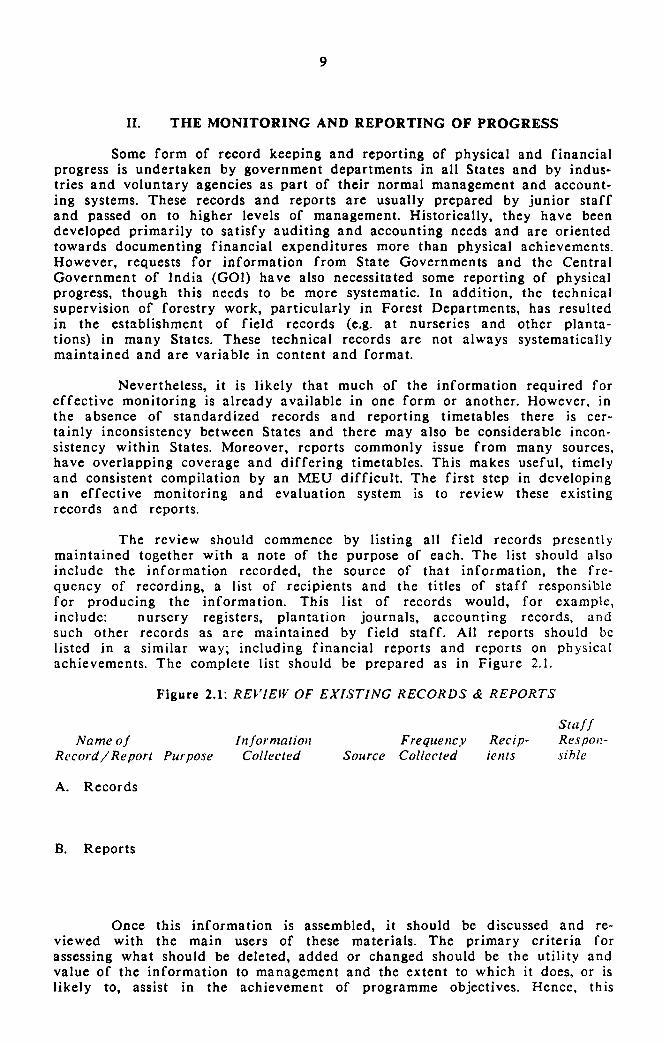
The review should commence by listing all field records presently maintained together with a note of the purpose of each. The list should also include the information recorded, the source of that information, the frequency of recording, a list of recipients and the titles of staff responsible for producing the information. This list of records would, for example, include: nursery registers, plantation journals, accounting records, and such other records as are maintained by field staff. All reports should be listed in a similar way; including financial reports and reports on physical achievements. The complete list should be prepared as in Figure 2.1.
Figure 2.1: REVIEW OF EXISTING RECORDS & REPORTS
Name oj Record I Re port Purpose
A. Records
B. Reports
Injormation Collected
Frequency Recip-Source Collected ienls
Stajj Respol!sihle
Once this information is assembled, it should be discussed and re" viewed with the main users of these materials. The primary criteria for assessing what should be deleted, added or changed should be the utility and value of the information to management and the extent to which it does. or is likely to, assist in the achievement of programme objectives. Hence, this

10
process of review requires that the MEU be in close and continuous touch with management. In addition, the Unit should be guided by the the need for consistency, brevity, clarity and timeliness in all records and reports. While there are good reasons, particularly for plantations, why some records should be maintained that will only prove useful many years hence, the operative rule of thumb should be 'when in doubt, leave it out'.
Because each State social forestry organization is organized somewhat differently and emphasizes different components of the programme and hence has different staffing, and administrative requirements, it is not possible to prejudge, or provide detailed suggestions about the outcome of this review of existing reporting systems. Of necessity, each State will require reports and records tailored to its specific requirements. Furthermore, non-governmental bodies such as voluntary agencies and private industry, will most certainly also require different systems which cannot be easily predetermined or imposed from outside. For these reasons, the detailed design of most recording and reporting formats is left to the individual departments and agencies engaged in social forestry.
However, it is widely accepted that every agency involved in social forestry activities should collect some data in a standardized manner. This is essential for the monitoring of the achievements of social forestry activities in the country as a whole as well as to provide a consistent basis for aggregating information from the different agencies involved in social forestry within States. Although some projects may differ in their approach and have some specific objectives that differ, they do share common policy goals. The achievement of these goals, and the problems involved, can only be systematically assessed by ensuring that a core of consistent data is collected by all agencies undertaking social forestry activities within a State and submitted to a central body charged with assembling and interpreting these data. The MEV within each State Forest Department is well placed to collect and collate these core data together with additional information of value to the State or required by aid agencies. These data should be incorporated into a well-designed reporting system, and result in regular reports to all managers of social forestry activity in the State as well as those responsible for policy.
At the national level, the Government of India, through the National Wastelands Development Board, (NWDB) has laid down a standard reporting system which all States are required to follow. This .requires that each State send a monthly telex/telegram to the NWDB containing up-to-date information on expenditure for social forestry as well as a regular quarterly report on physical and financial progress. Both sets of information are also to be copied to several other State authorities. In addition, the NWDB requires that each State submit an annual report summarizing overall progress, problems encountered and recommendations for future action. !I
The remainder of this chapter is devoted to describing the way in which the core information is to be standarized and the structure of the reports to be submitted to the NWDB.
11 See letters to the Chief Secretaries of all States from the NWDB, dated December 13, 1985 and March 10, 1986 as well as the resolutions of the AllIndia Workshop on Monitoring and Evaluation of Social Forestry held in Bangalore, February, 1986.

11
1. Seedllpg Production and Distribution (Nursery Reports) , . Seedling production and distribution is the starting point for most
social fOj'estry activities and is of the utmost concern to monitoring and evaluation. The three major questions that must be answered through nursery monitoring are: how many seedlings and of what species are being produced? Who is producing them? And who is receiving them? The answers to th'ese questions provide the basis for monitoring the prO'gramme's ability to meet the targets for production and distribution set for each local area, District, State, and the nation as a whole.
Data from nurseries is also of great importance to M&E, because information on seedling distribution provides the basic data (later called the sampling frame) for the monitoring and on-going evaluation of all forms of "pcople's plantations". Seedlings once distributed or sold to private farmers, leaseholders, communities, voluntary organizations, and private industries are no longer the responsibility of government departments. Hence, the only way to know what has happened to them after they have left the nursery is to conduct follow-up studies (sample surveys) on the basis of nursery records and reports. It is thus essential that adequate records are systematically and regularly maintained at each nursery or seedling distribution centre, regardless of the agency (government or private) responsible for the management of the nursery. Each State should endeavor to ensure that every nursery that receives any government funds, including private nurseries under 'buy-back' agreements and voluntary agency nurseries given governmental assistance, maintains the basic records outlined below. All other nurseries operating in the State should be requested to keep reliable records. Such records should include, at least, information on the number of seedlings prod uced, and a list of beneficiaries.
A t each nursery it is essential that a Seedling Distribution Register be maintained to record details about all seedlings leaving the nursery, even if they are being removed for departmental planting. While Forest Departments and other agencies with silvicultural intcrests will also want to maintain a separate Nursery Register or Record containing technical information such as sources of seed, seed treatment, sowing and germination dates, amount sown and germina tion rates, transplanting dates, treatments (insecticides, fertilizers, watering regimes, shading, etc,), growth characteristics, mortality, wastage, labour employed, etc., such data are primarily of concern to technical staff. The information vital to M&E activities should be recorded in the Seedling Distribution Register maintained for example by the Forester, Ranger, Nursery Foreman or equivalent person in charge of seedling distribution or sale.
The core information to be maintained in each Seedling Distribution Register is as follows:
(a) Serial Number (each disposal or sale should be serially numbered with a fresh start at the beginning of each financial year);
(b) Date (date of distribution);
(c) Name (the name of the farmer or the institution taking the seedlings);
(d) Address (including village and block -- this should be recorded in sufficient detail to allow easy location in the field during a survey);

12
(e) Category of Recipient (individual farmer, tree patta holder, community, private industry, voluntary agency, government dept. etc.)
(n Species and Number (the number of seedlings of each species taken);
(g) Intended Planting Site (e.g. block planting, homestead planting, boundary planting, roadside planting, degraded forest planting, etc.); and
(h) Amount Paid (total Rs. paid, if any).
On the basis of these distribution registers, a Quarterly Nursery Return should be prepared at the completion of each financial quarter by field officers for each nursery under their jurisdiction. A proforma quarterly return is set out in Figure 2.2. Naturally, additional information may be included in this return if this has been deemed necessary by management as a result of the review of existing returns and reports outlined earlier. However, under no circumstances should any of the information categories noted in Figure 2.2 be deleted as they are essential not only for M&E within a State but also for compiling the GOI Quarterly Report.
Data contained in the Quarterly Nursery Returns should be compiled at both the District/Division level and the State level. Depending on the availability of M&E staff, the District level tabulation work can either be done by the MEU, or by the District staff who would then forward the tabulated data to the Unit. In either case, the MEV would be responsible for tabulating the data at the State level and analyzing the results of both District and State level tabulations for presentation to management and inclusion in the GOI Quarterly Report. Since most nurseries only distribute seedlings during one season, it is likely that for three of the quarters there will be very little to report if the data collected is confined to that specified in Figure 2.2. In order to monitor the capacity of the nurseries to meet distribution objectives it may therefore be advisable to include an additional section which records the total number of seedlings under production in the nursery by species. together with details of actual or expected mortality or wastage.
In analyzing the Nursery Returns, the MEV should ensure that it examines issues such as: major differences in nursery output between Districts, the species composition of seedlings distributed, the extent to which disposal is in accordance with State policy and the extent to which distribution is biased towards particular groups. Major points regarding these issues should be summarized in a brief "memo", attached to the relevant tabulations and sent to management within two weeks of the close of the quarter.
The MEU must also obtain from each nursery, once a year, a Statemefll of Seedling Recipients per nursery. These data constitute an essential input in the Farm Forestry Survey and the statement is defined in Chapters III and VI.

13
Figure 2.2 PROFORMA
QUARTERLY NURSERY RETURN
1. GENERAL INFORMATION
1.1 Name
1. 3 Block
1.5 ~ of nursery: (tick)
Reporting Official Submission Date
1.2 Village/Town
l.4 District
Details
_ Departmental (FD, RDD, Other Dept): _ Private (landless/marginal, Others):
School: _ Voluntary Organisation: _ Private industry:
Other institutions:
1.6 Year of Establishment
l.7 Nursery area (ha) ______ 1.8 Capacity (seedlings)
1.9 Details of any Government financial support to the nursery (e.g. buy back arrangements, grants, etc. ) _____________ _
2. TOTAL SEEDLINGS DISTRIBUTED BY MAIN SPECIES (IN 'DOD's)
2.1 2.2 2.3 2.4 2.5 2.6 2.7 2.8 2.9 2.10
Species
-------------------2.11 All other species
2.12 TOTALS
IAchieve- I Current Year I ment I I Achievements I during I Tar- ITo Prevl This I
Ilast yearl get IQuarter IQuarter I Total

Figure 2.2 (continued)
3. SEEDLING DISPOSAL
Recipient/Purchaser
3.1 To Forest Department
3.2 To Other Government Departments
14
IAchieveI ment I during I Ilast yearl
3.3 To Individuals (pvt. farmers/patta holders)
3.4 To All Others (industries, towns, etc.)
3.5 TOTAL NUMBER OF SEEDLINGS DISPOSED
3.6 No. of Beneficiaries 3.6.1 Individuals 3.6.2 All Others
Current Year I Achievements
Tar- ITo Prevl This I get IQuarterlQuarterl Total
4. MAJOR ACHIEVEMENTS AND PROBLEMS (qualitative note with reconmendations)
NOTE: For definitions and clarifications in 3.1 to 3.6 see notes to GOl Quarterly Monitoring Report.

15
2. Plantation Records and Reports
Plantation records in the form of Plantation Journals are currently maintained by Forest Departments for most departmental plantations but not always for all types of departmental social forestry. Management in discussion with the MEU, should ensure that appropriate journals are maintained for all planting activity carried out by their departments in order to provide an adequate basis for the MEU to compile information and reports to aid management. Such journals should be maintained for, but not be limited to, all government sponsored plantations such as:
(a) replacement and production forests (territorial forestry);
(b) reha bili ta tion of degraded forests;
(c) community or village woodlots;
(d) strip plantations alongside roads, railways, canal banks, etc.; and
(e) other public or joint sector plantations such as those within municipalities.
For the monitoring process to be successful it is essential that complete and up-to-date records concerning each of these plantations be maintained by the field staff responsible for their establishment and maintenance.
Wherever possible, it is also desirable to encourage and help establish similar record keeping by private sector agencies engaged in planting activities. While this may be difficult in the case of farm forestry, for which a sample survey has been designed to obtain the necessary information, it may be possible in the cast." of tree palla (leasehold), self-help community (panchayat), voluntary agency and private industry plantations. The more the private sector monitors its own planting activities, the less will be the need for MEUs to mount sample surveys and special studies to assess their achievements and problems.
As for the nursery seedling distribution registers, there is a core of information that should be incorporated into all plantation journals covering the following items;
(a) Type of Plantation;
(b) Legal Status of Land;
(c) Area planted by Year;
(d) Type of Agreement between people and government;
(e) Technical Plantation Model;
(f) Type of Protection;
(g) Seedlings Planted by Number and Species;
(h) Survival and Growth by Species (measured periodically); and
(i) Product Removal, Sales, and Distribution.

16
Figure 2.3 PROFORMA
ANNUAL PLANTATION RETURN
Reporting Official _______ _ Submission Date
1. GENERAL INFORMATION
1.1 Plantation ------- 1.2 Village/Town
1. 3 Block 1. 4 District
1.5 ~ of Plantation: (tick) Amplify Below
1.5.1 By Govt. Agency (FD,RDD,Others) on: _ Replaced and Production Forest: _ Degraded Forest _ Communi ty Lands: _ Strips (Road,Rail,Canal,etc.): _ Other Public/Joint Sector:
1.5.2 By People on: Private Land: Tree Patta:
_ Self-help Community: _ Voluntary Agencies: _ Pvt. Sector Agencies:
1.5.3 Legal status of land ________________ _
1.6 Year of Establishment
1.7 Total Planted area (ha) 1.8 Total area (ha)
1.8 Give brief details below of any agreement with any Government Department concerning the management of the plantation and distribution of products (both intermediate and final)
1.9 Plantation model (include spacing):
1.10 Type of fencing (trench, wire, wall, hedge, etc.)
1.11 How Protected (paid guard, voluntary, etc.)
1.12 Area planted by year: Year

Figure 2.3 (continued)
2. PLANTING, SURVIVAL AND GROWTH
a
Year
b Major Species (if less than 5% include as others)
c I Number I I initially I I planted I
17
d e Number I
replacedl Number later I surviving I
f Average survival e/c
g Average
I height I (to 0.5 M)
3. ESTIMATED REMOVALS (in last twelve months)
Product (grass,poles,fuel,etc)
Quantity (est.Kg.)
Sales Rs. I (if any) I Beneficiaries/Purchasers
4. COMMENTS (causes of mortality, problems in distribution or marketing, species suitability, inputs provided, etc.)
NOTE:
------------------ -----------_._--_.
For definitions and clarifications, see notes to GOl Quarterly Monitoring Report.

18
These data form the basis of the Plalllation Return, a proforma of which is given in Figure 2.3. This return should be submitted by the responsible officer to the appropriate Di!:trict official (e.g. the DFO), once a year at the end of the planting season with a copy to the MEU. Where resources permit the Plantation Returns should be aggregated and summarized at the district-level and then forwarded to the MEU. An illustration of how .these data could be summarized is provided in the proforma given in Annex J to this Chapter. Wherever resources at the district-level are inadequate, the MEV will summarize the information on the basis of the copies sent to it. In either case the MEU should also undertake more extensive analysis of the data in the Plantation Returns in order to explore, for example, planting activity in relation to type of plantation management, planting models and form of protection. Such an analysis might also examine the relationship of species planted, seedling survival and growth, and plantion production to type of plan ta tion.
While the information listed above is the mlDlmum required from all plantations, it is possible that some agencies may decide to add additional items to meet their requirements for specific technical or social information. For example, some States have shown an interest in measuring sapling girth after theJourth year of growth, in documenting the suitability of the species planted to soil conditions and establishing the causes of seedling mortality. Similarly, some States may wish to include data on the labour employed on the plantation according to sex and social and economic status in order to gain further insights into the employment effects of plantations. As long as this additional data can be collected and meaningfully analyzed without overburdening staff and is deemed to be truly useful to management and policy makers m there should be few difficulties in making such additions to the core data required in Figure 2.3.
In addition to tabulating and briefly analyzing the Plantalion Returns once a year as part of its service to management, the MEV should draw on these reports together with the Quarterly Nursery Relllrns in preparing the Annual Monitoring and Evaluation. Report. In this annual report, the MEV should combine the information it has obtained from the nursery and plantation records with other infol'mation, resulting from its field inspections, rapid reconnaissance surveys, staff meetings, ad-hoc field reports, discussions with field staff, etc. and provide an overall assessment of the progress, achievements and the problems encountered, in the implementation of the social forestry programme during the year. The annual report should also summarize the inf orma tion collected on the prices of forest prod ucts. (See section 4 of this chapter). In order for this report to be useful both to management and policy makers, and to field officers, it is important that it sacrifice lengthy discussion and analysis in favor of brevity and timely release (within three months of the close of the financial year). Additional guidance on report preparation is to be found in Chapter IX.
3. Quarterly GOI ('All India') Monitoring Report .
Because the Government of India (GOI) has placed substantial emphasis on social forestry and because of th~ importance of the financial and policy decisions made at the national level, the need for national level monitoring and evaluation has become a task of the highest priority. Accordingly, the national agency for social forestry, the National Wastelands Development Board (NWDB), has developed a Quarterly Monitoring Report for this purpose in collaboration with the Forest Departments of each State and other governmental and non-governmental bodies.

19
In order to encompass all social forestry activities within the country, each State has been requested to appoint a Nodal Agency or Department whose responsibility it is to assemble the necessary information from each and every State Department or organization participating in tree planting activities. While the MEUs in State Forest Departments could fill this role, it might be allocated to another agency. Regardless of who is responsible for assembling and forwarding the total State afforestation data, each Forest Department MEU will, at least, be responsible for providing the information on departmental activities in the prescribed form.
Both the Quarterly Nursery Return and the Plantation Returns have been designed to provide, among other things, the data required by the GOI Quarterly Monitoring Report in categories consistent with that report. However, the completion of the GOI Report requires additional information pertaining to financial flows by source and purpose, e.g. tree palla and land leasing activity, tree cooperative societies, and bank credit schemes for afforestation.
The most important of these additional data concern financial flows by funding category. In order to closely monitor the flow of funds into social forestry from both GOI and State sources, the NWDB also requires that each State send it a Monthly Progress Report containing purely financial information by telex or telegram at the close of each month. It will thus be essential for MEUs to establish close working relationships with their respective accounting sections in order to obtain and despatch this information in a timely fashion. These financial data will allow the GOI (NWDB) to identify where delays in the flow of funds occur and assist them in helping implementing agencies overcome resulting problems.
The introduction and faithful implementation of this standardized national monitoring system will provide, for the first time, a consistent data base for identifying and solving short-term problems and for long-range policy formulation. The diversity of strategies followed by different States and agencies on such important issues as seedling pricing, distribution ceilings, the mix of species grown, nursery decentralization, tree tenure (patta) programmes, etc. requires that the relative effectiveness of different approaches be continuously monitored. For this to be successful, standardization is essential. However, these data will be collected in vain if insufficient resources are available at the Centre for compilation, timely analysis and follow-up actions (see also Chapter V).
Figure 2.4 presents the GOI Quarterly Monitoring Report and ·Figure 2.5 presents the Monthly Progress Report which is to be transmitted by telex or telegram. While specific definitions and clarifications are incorporated into these forms as footnotes, a few more general instructions for their completion follow.
In a State where several agencies are undertaking social forestry there will be several initial quarterly reports submitted to the nodal agency responsible for sending a consolidated report to the NWDB. This obviously places great importance on consistent presentation, consistent definitions (so that figures can be aggregated) and timely submission. In Figure 2.4, the "reporting office" will be the nodal agency submitting the report.

20
F1lure 2.4 GOVERNMENT OF INDIA (NWDB)
QUARTERLY MONITORING REPORT
Reporting Office Date Submitted
PART A: AFFORESTATION ACTIVITIES
State ----------------------Quarter Ending _________ _
Current Year IAchieve- I I Achievements
1. No. of Nurseries ---and Seedlings Distributed:
1.1 All Departments (see 11): 1.1.1 Own Nurseries (No.)
I ment I Target ITo Prev I This I !Last Year! !Quarter ! Quarter !Total
1.1.2 Seedlings from own nurseries 1.1.3 Seedlings from other nurseries 1.2 Small Farmers/Landless: 1.2.1 Nurseries 1. 2 . 2 Seedlings 1.3 Other Individuals: 1.3.1 Nurseries 1.3.2 Seedlings 1. 4 Schools: 1.4.1 Nurseries 1.4.2 Seedlings 1.5 Voluntary Organizations: 1.5.1 Nurseries 1.5.2 Seedlings 1.6 Other Institutions (pvt. etc.) 1.6.1 Nurseries 1.6.2 Seedlings 1.7 Totals: 1.7.1 Total Nurseries (No.) 1.7.2 Total Seedlings Distributed (lakhs)
NOTES 1.1 The numbers in this item should represent the total of all governmental afforestation and social forestry efforts, including schemes mounted under Social Forestry projects, Production Forestry, Fodder Plantations, NREP, RLEGP, DPAP, DDP, Soil Conservation and other such tree planting schemes. Thus, items under Section 11 (Nursery and Seedlings by Dept.) should be compiled first, and the total brought forward to 1.1. Seedlings (lakhs) refers only to the number distributed or planted even though the number produced may be higher. 'Small Farmers/Landless' includes marginal farmers. 'Totals' refer to the totals derived from 1.1-1.6 for nurseries and seedlings respectively except that 1.1.3 (Seedlings from other Nurseries) must be omitted from the summation as these seedlings are included in the figures in 1.1 through 1.6.

Figure 2.4 (continued)
2. Total Seedlings Distributed £y Main Species (lakhs):
2.1 2.2 2.3 2.4 2.5 2.6 2.7 2.8 2.9 2.10 2.11 All other species
21
I Achieve- I I ment I Target ILast Year I
3. Distribution of Departmental Seedlings and No. Beneficiaries
3.1 To Forest Department 3.2 To Other Govt. Depts. 3.3 To Individuals (pvt. farmers/patta holders) 3.4 To All Others (industries, towns, etc.) 3.5 Total Seedlings Distributed 3.6 No. of Beneficiaries 3.6.1 Individuals 3.6.2 All Others
4. No. Seedlings Purchased from Non-dept. Sources (lakhs)
Current Year Achievements
ITo Prev I This I IQuarter I Quarter ITota1
NOTES 2.1-2.11 The ten most widely distributed species should be listed in descending order of importance and all other species added together under 2.11. If a complete list of species is available, these can be added to the report as an annex. If information is complete, note that the total of 2.1-2.11 should equal the total reported in 1.7.
3.0 This information comes from items 3.1 and 3.5 of the Quarterly Nursery Return (Fig. 2.2)
3.5 The total of 3.1-3.4 reported as 3.5 should equal the sum of 1. 1. 2 and 1. 1. 3 .
4.0 This refers to all seedlings purchased by Government Departments from non-government sources (i.e. those sources listed in 1.2 through 1.6) under buy-back arrangements of various kinds. It does not include seedlings sold by private nursery owners on their own.

Figure 2.4 (continued)
5. Plantations (Incl. Fodder)
22
IAchieve- I I ment I Target ILast Year I
2Y Area ih!L ~ Seedlings (lakhs)
5.1 By Govt. Agency: 5.1.1 Replaced and Production
Forest Land: Area Seedlings
5.1.2 Degraded Forest Land: Area Seedlings
5.1.3 Community Lands: Area Seedlings
5.1.4 Strip Plantations: Area Seedlings
5.1.5 All Other Public or Joint Sector Activities: Area Seedlings
5.1.6 Sub-totals: Sub-total Area Sub-total Seedlings
Current Year Achievements
ITo Prev I This IQuarter I Quarter ITotal
NOTES 5.1.-5.2 Wherever exact figures are not known the conversion rate of 2,000 seedlings - 1 hectare should be used.
5.1.1
5.1. 3
5.1.4
5.1. 5
5.1.6
This item refers to normal "territorial" afforestation or reforestation activities on Government Forest Land where the primary objectives are commercial production or conservation.
This includes village woodlots, etc. on Community, Forest, Revenue, and Panchayat lands when the plantation is financed and implemented by a Government Department as part of a social forestry or similar scheme.
'Strip Plantations' include: roadsides, canalsides, railsides, etc.
'All Other Public or Joint Sector Activities' include: semigovernment undertakings, municipalities, joint government -private sector undertakings, etc.
'Sub-totals', are the relevent totals from section 5.1.

Figure 2.4 (continued)
5.2 People's Plantations 5.2.1 Private Land:
Ar.ea Seedlings
5.2.2 Self-help Community: Area Seedlings
23
Current Year IAchieve- I Achievements I ment I Target ITo Prev I This I ILast Yearl IQuarter I Quarter~otal
5.2.3 Tree Patta/Tree Tenure: Area Seedlings
5.2.4 Voluntary Agencies & Other Pvt. Means: Area Seedlings
5.2.5 Sub-totals: Sub-total Area Sub-total Seedlings
5.3 Pvt. Sector Indust. Area Seedlings
5.4 Total All Plantations 5.4.1 Total Area 5.4.2 Total Seedlings
6. Tree Pattas (Tree Tenure):
6.1 Pattas Granted (No.) 6.2 Total Area Granted (ha) 6.3 Total No. Trees 6.4 Beneficiaries (No.)
7. Tree Growers Cooperative Societies Formed (No.):
NOTES 5.2.1 'Private Land' refers to all types of farm forestry conducted by households.
5.2.3 'Tree Patt~ refers to a form of tree raIsIng lease granted to individuals, households, or small groups under which they raise trees on land belonging to the Government.
5.2.5 'Sub-totals', are the relevant totals from section 5.2.
5.4 'Total All Plantations', these are the relevant totals for section 5 obtained by adding the sub-totals in sections 5.1.6, 5.2.5, and 5.3.

24
Fiaure 2.4 (continued) Current Year IAchieve- I Achievements
8. Land Leased (ha):
8.1 Degraded Forest Land: 8.1.1 Rural Poor 8.1.2 Other Individuals 8.1.3 Cooperatives/Societies 8.1.4 Forest Based Industry 8.1.5 Voluntary Agencies 8.1.6 All Others 8.1.7 Sub-total
I ment I Target ITo Prev I This I ILast Year \ \Quarter \ Quarter \Tota1
8.2 Common/Cei1ing/Govt. Lands (ha): 8.2.1 Rural Poor 8.2.2 Other Individuals 8.2.3 Cooperatives/Societies 8.2.4 Forest Based Industry 8.2.5 Voluntary Agencies 8.2.6 All Others 8.2.7 Sub-total
8.3 Total Land Leased (ha):
9. RDP Afforestation Schemes:
9.1 Schemes sent to Banks (No.) 9.2 Amount Requested (lakh Rs) 9.3 Amount Sanctioned (lakh Rs) 9.4 Amount Disbursed (lakh Rs) 9.5 Area Afforested (ha) 9.6 Beneficiaries (No.)
10. Institutional Finance (Non-IRDP):
10.1 Schemes sent to Banks (No.) 10.2 Amount Requested (lakh Rs) 10.3 Amount Sanctioned (lakh Rs) 10.4 Amount Disbursed (lakh Rs) 10.5 Area Afforested (ha) 10.6 Beneficiaries (No.)
NOTES 8.1.1, 8.2.1 'Rural poor' includes all landless marginal and small farmers according to established State definitions.
8.1.2, 8.2.2 Include all individuals not covered by 8.1.1 and 8.2.1.
8.1.6, 8.2.6 Specify who is included in 'All Others'.
8.3 The sum of the Sub-totals in 6.1.7 and 6.2.7.
10.1-10.5 This should include the total of all non-IRDP sponsored financing schemes. A footnote should provide a breakdown by institution if more than one is involved.

2S
Flaure 2.4 (continued) Current Year IAchieve- I Achievements I ment I Target ITo Prev This I ILast Yearl I Quarter Quarter ITota1
11. No. of Nurseries and Seedlings Distributed ~ Dept. (Break-up of 1.1)
NOTES
11.1 Forest Dept. (Social Forestry) 11.1.1 Own Nurseries (No.) 11.1.2 Seedlings from Own Nurseries 11.1.3 Seedlings from Other Nurseries 11.2 Forest Dept. (Territorial) 11.2.1 Own Nurseries (No.) 11.2.2 Seedlings from Own Nurseries 11.2.3 Seedlings from Other Nurseries 11.3 Rural Development Dept. 11.3.1 Own Nurseries (No.) 11.3.2 Seedlings from Own Nurseries 11.3.3 Seedlings from Other Nurseries 11.4 Irrigation Dept. 11.4.1 Own Nurseries (No.) 11.4.2 Seedlings from Own Nurseries 11.4.3 Seedlings from Other Nurseries 11.5 Horticulture Dept. 11.5.1 Own Nurseries (No.) 11.5.2 Seedlings from Own Nurseries 11.5.3 Seedlings from Other Nurseries 11.6 Agriculture Dept. 11.6.1 Own Nurseries (No.) 11.6.2 Seedlings from Own Nurseries 11.6.3 Seedlings from Other Nurseries 11.7 Public Works Dept. 11.7.1 Own Nurseries (No.) 11.7.2 Seedlings from Own Nurseries 11.7.3 Seedlings from Other Nurseries 11.8 Other -----11.8.1 Own Nurseries (No.) 11.8.2 Seedlings from Own Nurseries 11.8.3 Seedlings from Other Nurseries 11.9 Other -----11.9.1 Own Nurseries (No.) 11.9.2 Seedlings from Own Nurseries 11.9.3 Seedlings from Other Nurseries
11.0 Seedlings from own nurseries refers to seedlings produced Qy the Dept. Seedlings from Others Nurseries refers to those obtained under arrangements 'such as buy-back'.
11.8-11.9 All other departments involved should be specified. Add additional items (i.e., 11.10, 11.11) if required.

26
Figure 2.4 (continued)
12. Major Achievements and Problems (Qualitative and Descriptive Notes:)
12.1 Major Achievements: _________________ _
12.2 Major Outstanding Problems:
(continue on separate sheet if necessary)

27
Fllure 2.4 (continued)
PART B: FINANCIAL ACTIVITY ---
l.
(in lakhs of Rs) I I Total
Funds from Government I Releases ----of India for I Last ----afforestation I Year I
1.1 Dept. of Forest & Wildlife l. 2 WHDB l. 3 NREP 1.4 RLEGP l. 5 DPAP l. 6 DDP 1.7 Dept. of Agriculture 1.8 Others 1.9 Total
I Current Year I I Releases to State I I I Govt. from GOI I I Sanc t ioned I ::--___ --:-:::-:--:----:--~ I I ITo Prev IThis I I I IQuarter IQuarterlTotall
Current Year 2. Funds Released ~ the Total IReleases by State Govt
State Govt. to imple- I Releases 1 ____ -:--___ _
menting units, including I Last IProvision ITo Prev IThis I GOI ~ carryover funds I Year I in the IQuarter IQuarterlTotal from the budget I _____ ...I.I--=B;.;:;u~dgc.;e:;..;t:...._J....I ___ .L..I __ ---1..1 __
2.1 Forest Dept. (for Social Forestry) 2.2 Rural Development Dept.) for 2.3 Agriculture Dept. ) afforestation 2.4 All other Govt. Depts. ) only 2.5 Total
NOTES 1.2 National Wastelands Development Board
1.3 National Rural Employment Program
1.4 Rural Landless Employment Guarantee Program
1.5 Drought Prone Area Program
1.6 Desert Development Program
1.8 Any additional central GOI programs should be specified and added at this point.
1.9 This total is the sum of all GOI funds released to the State for Social Forestry programs.

28
Fllure 1.4 (continued) I 1 __ ~C~u~r~re~n~t_Y~e~a~r ___________ 1
3. Funds made available to FOreSt-o;partment from the budget of
I Total Availa-I I I I I bility Last ITo prev I This I Total I I Year Iguarter I guarterl Availability I
3.1 Forest Department 3.2 Rural Development directly 3.3 ORDAs 3.4 Agriculture Dept. 3.5 Other Depts. 3.6 Total
Current Year I Expenditure ITo prev I This I Total
4. Expenditure BY I Last Year IQuarter IQuarterlExpenditure Implementing ;;;.De;;.lp;;.;a;.;;r.;;.tm::;:;e;;.;n.;,;:t;.;;s~I _____ -,I ___ .....l-1 __ --LI_...:S:..:o;.....::..Fa=.;r=__
4.1 Forests against 3.6 4.2 ORDAs (if spent independently
of Forests). 4.3 Agriculture Dept. 4.4 Other Oepts. 4.5 Total
5. Reimbursements
5.1 Claimed 5.2 Received
NOTES 3.3 District Rural Development Administration
3.5 Specify the 'Other Departments' .
4.4 Specify the 'Other Departments' .
5.1 Refers to all reimbursement claims submitted to external financing agencies.
5.2 Refers to all reimbursements received from external financing agencies against claims submitted.

29
Fllure 2.S MONTHLY PROGRESS REPORT FOR TOTAL
AFFORESTATION ACTIVITIES (in lakh Rs)
(Telex/Telegram to National Wastelands Development Board)
1. Report for the month of ____ _ FY 19 from State ----2. Cumulative Funds for afforestation received from Government of India:
(a) Forest (b) NWDB -----------(c) NREP ___________ _ (d) RLEGP _ (e) DPAP _ (f) DDP (g) Others (h) Total
3. Cumulative Funds including State Funds, GOI and carry-over funds released so far to:
(a) Forest Department directly ______________ _ (b) DRDAs
--~----~~-~-----------------------(c) Other Govt. departments implementing afforestation programmes ______________ _
(d) Voluntary Agencies (e) Total -----------------------------
4. Funds released by the DRDAs for afforestation to:
(a) Department of Forests ________________ _ (b) Other Govt. Agencies (c) Voluntary Agencies (d) Total ____________________ _

30
Reports should not be held up for lack of information. If information is not available on a specific item, an entry should explain whether the data is "NI A" (not available) or "B/C" (being collected). Whenever total figures are compiled but some information is missing, "INC" (incomplete) should be written after the total to indicate that the figure is incomplete. In such circumstances, a footnote should be added giving an estimated total, signified by writing "ESTH after the figure. If the answer is "none" or "zero", then "NONE" or "0" should be entered into the appropriate column. The abbreviations "No." for "Number" and "Lakh" for units of one hundred thousand (100,000) should be used consistently.
4. Monitoring of Forestry Produce Prices lJ
As readers will see forestry produce prices, as such, do not figure significantly in the analysis of the data from the sample surveys proposed in Chapters III, VI and VII. In general, prices will not be analytically useful until a complete evaluation of the project or one its components is undertaken. On a routine basis, however, the regular collection and publication of price data provides an invaluable indicator of changes in supply and demand for products, the output of which the programme aims to influence. The observation of forestry produce prices is included under monitoring activities because it must be done regularly and because the data are of special value. Price inf orma tion can be presented independen tl y of the results of other empirical in vestiga tions.
Ideally a widespread network of price observation points should be established across the state covering both urban and rural markets. With the resources likely to be available to the typical monitoring and evaluation unit (see Chapter V) this is unlikely to be feasible. Something less ambitious must suffice.
Accordingly, in each agro-climatic zone (see Chapter. III) in the state one urban and four rural markets should be selected. In these markets prices of fuel wood, poles, grass, and small timber should be observed every six months. These data should be collected by the field supervisors employed by the MEU. Whilst detailed procedures for this task must be worked out by each state MEU, a few central precepts can be stated.
First, a standard form should be designed, tested and introduced. Second, the observations at each market should be undertaken on the same day in each six monthly period in each market to preserve an equal length of time between observations and thus render the observed prices comparable. Third, for each product at each market between three and five observations should be taken. Fourth, the prices recorded should the retail market prices paid by final users for products in a usable form, for instance split wood. Fifth, it follows that final users should be the source of the data rather than traders. Sixth, separate price series should be developed for rural and urban locations. Seventh, to the extent that commodities are traded in local units the price for these local units must be the unit of record, conversion to a price per kg (or other standard measure) should be done during tabulation. Eighth,
1/ It is recommended that the MEU monitor forestry produce prices. Some States may, however, prefer to delegate this work to the Utilization Division in the State Forestry Department.

31
if comparative prices are available at government-managed depots these should be reported. Figure 2.6 is an example of the form which should be completed by investigators in the field.
These price data should be reported half yearly in the form of a bulletin. It would be no more than two pages in length and consist, in the main, of three pieces of information. First a table showing market prices for each of the six monthly periods up to and including the latest. Second, a graph showing the trends of product prices over the longer run. This, of course, will not be possible until a substantial series of observations are to hand. Third, any other relevant information on prices. This should include the current prices for wood in commercial uses (e.g. pulpwood and polewood). These prices are easily obtained either from existing records maintained by the Forest Department or from the principal commercial wood processing undertakings in the state. Additionally, and when available comparitive information on producer (farm gate) prices, derived from the farm forestry survey (see Chapter VI) should 'be included.
This price bulletin should be given wide distribution and at the very minimum be sent to every divisional forest officer, all nurseries and every officer involved in extension work or other direct contacts with farmers and tree growers.

32
Fllure 2.6 PROFORMA SIX MONTHLY PRICE
COLLECTION FORM
1. 0 Zone ______ _
1.1 Date Prices Collected --------1.2 Name and Location of Market
Is this a (circle appropriate category) a) rural market b) urban market c) Government Depot.?
Market Prices
Commodity Unit Price
1 Grass 2 Bamboo 3 Fuelwood
1.4.4 Poles
1.4.5 Small Timber
1. 4 . 6 Timber
NOTES 1.0 Specify the 'Zone' to which the prices relate.
1.2 Name the market and give details of location, e.g. village, town, district etc.
1.3 Circle the relevant eategory (type of market). Note that a new form is needed for each market.
1.4 Wherever relevant, reeord prices for different speeies. The 'unit' is the unit of measurement and must be the unit to which the price relates. If such units are traditional ones conversion to standard units of measure should be done only at MEU headquarters.

33
Annex 1: PROFORMA DISTRICT SUMMARY OF PLANTATION RETURNS
1. GENEgAL INFORMATION
1.1 District ___ _ 1.2 Reporting Year
1.3 This summary completed _ ___ (date)
1.4 Reporting Official (name and designation)
Reporting Year All Years 2. PLANTATION ACTIVITY No. of Area Percent
Planta- Planted Surviv-No. of Area Planta- Planted tions tions ing
2.1 By Government Agency: 2.1.1 Replaced & Prod. Forest 2.1.2 Degraded Forest 2.1.3 Community Lands 2.1.4 Strips 2.1.5 Other Public Agencie 2.1. 6 Sub-total 2.2 By People: 2.2.1 Private Land 2.2.2 Tree Patta 2.2.3 Self-Help Community 2.2.4 Voluntary Agencies 2.2.5 Pvt. Sector Agencies 2.2.6 Sub-total 2.3 Total
3. PLANTING SURVIVAL AND GROWTH
Reporting Year All Years
Species No. Planted
All Species
4. PROTECTION AND SURVIVAL
!YP! of Protection
None Fenced (any type incl. trench) Guarded (paid or unpaid) Fenced and Guarded
Percent Surviving
Avg. Height NO.Planted at 2 years
Percent Surviving Reporting After After Year £ Years 1 ~

34
5. ESTIMATED REMOVALS
NOTE
Product Removed
Reporting Year Quantity ~
All Years ---Quantity ~
This district summary is only suggestive. There are many other ways of presenting these data, and other items in the proforma Plantation Returns may deserve greater emphasis. These matters should be discussed by the responsible district officials with the MEU ..

3S
III. MONITORING AND ON·GOING EVALUATION OF FARM FORESTRY AND VILLAGE WOODLOTS
This chapter outlines the salient features of the monitoring and ongoing evaluation of farm forestry and village woodlots ~- two of the most important components of social forestry programmes.
A. On-going Evaluation of Farm Forestry
Farm forestry is the fastest growing component of social forestry programmes. This growth is thought to be an enthusiastic response on the part of individual farmers to the growing availability of seedlings and rising market prices for timber products, particularly poles and pulpwood. For example, by 1983 in Gujarat about 670 million seedlings had been distributed to farmers and planted on about 440,000 hectares. Strip plantings covered some 47,000 hectares on canal banks, roadsides and railway embankments and nearly 8,000 village woodlots covered 45,000 hectares. 1/
Despite this success, however, little is known about who plants these seedlings, their motivation for doing so, the effects of seedling pricing policies, the planting techniques employed, species grown, seedling survival rates, tree growth rates under farm conditions, the production and consumption of thc resulting forest products, whether food crops are being displaced and the amount of family and hired labour used for tree husbandry. Answers to these questions, and others, are essential if viable long term policies (and the mechanisms for their implementation) are to be developed which will help sustain thc balanced growth of farm forestry and maximize the participation of small and marginal farmers, the landless and the under-privileged.
These questions cannot, however, be answered by resorting to financial reports or the further manipulation of existing data such as those in the reports discussed in Chapter II, although those materials do have a role to play in on-going evaluation.
I. Objectives
Consistent with Chaptcr I the on-going evaluation of farm forestry is defined as the regular examination of the effects of farm forestry on farms and farm households. The overall objective is to provide management with information so that the initial effects of the programme are better understood and corrective actions to improve implementation or modify policy can be made. Specifically, information on matters such as the relative importance to farmers of different sources of seedlings, the places where farmers plant trees, seedling growth and survival, the production and disposal of forest products and the coverage of extension activity.
These categories overlap to some extent and are certainly interrelated. The degree to which such inter-relationships can be captured, described and interpreted will depend, in large measure, on the analytical techniques employed. Although all States are planning to introduce computers, it is unlikely that advanced analytical techniques will be used in the early stages. Hence, 'it is essential that initially the analysis be simple and based on tables, comparisons, and basic statistical inference. Sophisticated analysis should follow and not precede basic statistical work.
1/ The social forestry programme in Gujarat began in an organised way in 1970.

36
Consequently, throughout the ongoing evaluationprogrammefor farm forestry emphasis is placed on delivering information which is modest in both scale and scope but sharply focussed on the practical implications for management. Moreover, although farm forestry is a continuous process, the introduction of changes in policy and practice may be slow to take effect. For example, if an issue requiring some modification to existing practice is detected in, say, year 2 and reported shortly thereafter, the effects of a change in practice are unlikely to emerge in a quantitatively significant way until year 4 at the earliest as the intervening year will be taken up with introducing the change. Hence, the 'on-going' evaluation programme for farm forestry should be undertaken in alternate years. This also has the advantage of preventing the MEU from becoming overloaded and, hence, failing to deliver results on time -- a common problem elsewhere and one which rapidly leads to a loss of credibility and a lack of confidence in the M&E system. Moreover, the ongoing evaluation of farm forestry is only one subject that must be addressed by the M&E system. The dovetailing of this and the other elements of the M&E system into a coherent work programme is extensively discussed in Chapter VJJI.
To translate these general objectives into a clearly defined programme of on-going evaluation requires three principal steps. First the information that is required must be defined. Second, the main mechanism for obtaining that information must be selected. Third, the main elements of the initial analysis must be specified. Each of these three stages is briefly discussed below.
2. The Information Required.
If program management is to be kept aware of the progress of farm forestry and of the reactions of farmers and if the longer run process of the programme of farm forestry and project design and policy formulation is to be improved then the information required will, at the least, include the following.
o Details of who participates in farm forestry
- Large families or small? The landless or the landed? Big farmers or small farmers? Those who have other sources of income outside of agriculture or those who have substantial holdings of livestock?
- What are the sources of seedlings? How many are planted? What are the species? How far do participants travel to get seedlings? Why do they plant them? How do they transport them?
o Details of where seedlings are planted.
- On bunds or boundaries? Around homesteads? In block plantations? On fallow land or on previously cropped land?
o The characteristics of seedling growth and survival.
- How many were planted? When? How many survive? How good is the tree husbandry? How are seedlings protected? How

37
high are they? What is their girth? What is the cost of inputs for tree growing?
o The products.
What is produced and when; how is it used? Is it sold? If so, at what price and who is the buyer?
o The demand for different seedling species.
- How many seedlings are required each year? Of what species? By whom?
o Extension activities.
- Are participants receiving advice through extension? Do they adopt it? What additional advice is needed? Who should provide it? Are mass media techniques of inf orma tion diffusion eff ecti ve?
To collect such information (of which the foregoing is only a selection) requires that detailed questions be put to participants. This, however, should not be a casual process and requires that well thought-out and properly designed questionnaires be used. A suitable questionnaire has been designed and precoded and is presented in full in Chapter VI.
To administer this questionnaire, specialized investigators should be employed and trained and the method of data processing be planned together with the methods and framework of analysis. The questions, however, even when well-framed and properly organized in a questionnaire cannot be put to all participants -- time and cost among other factors make this impossible. Hence, the answers of a few must be made to serve as the answers of all. In short, a sample of participants is required.
3. The Reason for Sampling and the Design of a Sample
The geographical spread and individualistic nature of farm forestry, if it is to be systematically studied, requires the use of sample surveys which hold out the possibility of making rigorous inferences about the population with a pre-determined (or calculable) level of precision. That is to say they must be designed in such a way that when some average (mean) value is calculated it is possible to calculate the margin of error surrounding that average. However, the level of precision for a given sample survey will not normally be the same for all variables of interest. It is, therefore, usual (and certainly convenient) to identify a key characteristic in the population and to design the sample to yield an acceptable estimate of the mean value of this characteristic and to subsequently (after the data has been collected) calculate the precision with which this and other characteristics have been measured. In the particular case of farm forestry the characteristic that might be of greatest interest is the quantum of wood and woodrelated products that are harvested. However, in the early years of a project or programme the measurement of harvested production is obviously impossi ble as most trees are not harvested un til they are between 6 and 10 years old. Moreover, the harvest depends on the number of mature trees that are cut and this, in turn, depends on the number of trees that have survived from the time they were planted. Clearly the survival of seedlings is dependent on the robustness of the planting material at the time it leaves the nursery and this is outside the farmer's control. However, good tree husbandry can

38
greatly affect the survival rate of even poor planting material. So, it seems that in farm forestry a measure of the interaction of the farmer and his trees and a good indication of present success and future production can be obtained by choosing seedling survival rates, as the key characteristic of interest.
The mortality of seedlings (trees) declines over time. 11 It is highest when planted and lowest at the time of harvest. Hence, it is important to know the survival rate according to the age of the trees. It is also important to know whether the survival rate of young seedlings is static, increasing or decreasing in response to the farmers' husbandry which, of course, the programme seeks to influence through the provision of extension advice and other services. This places a premium on obtaining information about young trees. But, if something is to be learned of how survival rates translate into production, then older trees must also be studied.
Most species of seedlings distributed by social forestry programmes in India are quick growing and consequently are harvestable at or before their tenth year. Hence, an ideal sample would contain observations for trees of all ages from 1 to at least 10 years.
If M&E studies are initiated at the outset of a project then such a sample can be progressively built up over time by selecting, every two years, a "new" sample of farmers who have planted seedlings in the previous two years while continuing to study farmers in the samples selected in previous years.
However, many social forestry programmes are between 1 and 5 years old and systematic M&E has not yet commenced. This situation can be turned to advantage as, by carefully designing a sample, it is possible to study immediately farmers with trees of different ages.
Given that the elapsed time from seedling planting to tree harvesting is about ten years and in several states M&E is being introduced somewhere near the mid-point of tqis period, the recommended sampling design accomodates both 'new' and 'old' farm forestry programmes.
From the above, the problem is to select a sample of private individuals (farmers or otherwise), who have obtained (purchased or otherwise) seedlings from the nurseries in the State and to make observations on the survival and physical state of the seedlings at various stages of their growth, to interview the recipients with regard to their characteristics and farming practices, and finally to construct estimates of the values of seedling and recipient characteristics together with estima tes of the precision with which those values have been estimated. This problem can be tackled by using probability sampling, that is, the use of methods of sample selection such that the probability of selection is knowable for every element of the population and to use estimation procedures that permit objective statements of precision based on statistical theory.
11 That is to say the number of seedlings survIvmg of those originally planted declines with time. However, the rate of decline is usually fastest in the early years and very slow amongst semi-mature and mature trees. Replacement planting may moderate this process.

39
For any given year, the population consists of all deliveries of seedlings to private individuals (farmers or otherwise) by the nurseries in some area. 11 The area may be a State or a portion of a State. Although there are advantages in choosing administrative areas there are also good reasons for not doing so. First, the number of such areas comprising the State should not be large if the total sample size is to remain within manageable bounds. Hence, forest ranges or forest divisions must be ruled out. Forest circles, although relatively few in number mayor may not coincide with changes in the physical environment -- patterns of rainfall distribution, soil classes, altitude, etc. These physical conditions exert a considerable influence over the growth of trees and the nature of the farming system. India has been classified into a series of agro-climatic zones. Typically a State contains five or six such zones of which three or four cover the bulk of the State.
Although these zones have been carefully defined,· those definitions are based mainly on environmental assessments with respect to crop growth and hence may require adjustment in order to properly characterize the underlying conditions affecting tree growth. It is thus quite possible that some agroclima tic zones can be grouped together for the purposes of the farm forestry survey. Additionally, the boundaries of the zones thus determined should be adjusted to coincide with established administrative boundaries - districts or divisions. Such adjustments' are likely to affect relatively small geographic areas and are unlikely to seriously affect the validity of the survey results. Accordingly, the areas in a State for which sample results should be generated are agro-climactic zones adjusted as above.
In Chapter II proposals for the monitoring of nurseries were made which stressed the need for each nursery to maintain a register of seedling deliveries and to submit an annual Statement of Seedling Recipients to the MEV which would give the total number of deliveries for the nursery by year. Hence, it is possible to know for each nursery, not only the total number of deliveries that have been made but each and every individual delivery that has been made -- that is to say all the private individuals who have taken some seedlings from each nursery. It is thus possible to choose, from a given nursery register, a sample of deliveries and to identify and subsequently locate the individual associated with that delivery.
Although sampling is a formal technique of investigation based on a large body of statistical theory, the design and selection of samples does not ha ve to be complex, time-consuming or expensi ve. It is not essen tia I for samples to be large in order to make valid inferences about the population from which they are drawn, nor does their size depend on the size of the population. It is common, but quite erroneous, to believe that a sample must cover some pre-specified proportion of the population. Put simply the size of a sample depends on the variation in the population of the characteristic being studied and the level of confidence (precision) required in the results.
11 Throughout this chapter the terms "private individual" or "individual" refer to individual farmers or persons not the Forest Department, govern men t departments and undertakings, vol un tary organizations, corporations, and other bodies who collect seedlings from a nursery. The study of institutional plantations is dealt with in Chapter IV.

40
The calculations and procedures necessary to select a probability sample of individual deliveries for a farm forestry survey are set out in detail in Chapter VI. A summary picture of the sample sizes that result, depending on the number of zones in the State and the age of the farm forestry programme is provided in Table 3.1.
Table 3.1: RECOMMENDED SAMPLE SIZES FOR FARM FORESTRY SURVEYS
Zones in State
1 2 3 4 5
1.
-aJ
Age 0/ the Farm Forestry Program in Years 2. 3. 4. 5. 6. 7. 8.
12612/ 252 378 507 630
252 504 756
1008 1260
378 756
1134 1512 1890
504 1008 1512 2016 2520
630k,/ 630 1260 1260 1890 1890 2520 2520 3150 3150
630 1260 1890 2520 3150
9.
630 1260 1890 2520 3150
10.
630 1260 1890 2520 3150
aJ If the farm forestry programme is only one year old the first farm forestry survey would be delayed until the next year.
12/ The numbers in the table are the sample sizes; that is, the number of deliveries sampled.
k,/ After the social forestry programme has reached its sixth year the size of the sample for any given number of zones remains constant as resource constraints will prevent larger sample sizes from being used. Although the figures in the table are constant, in practice these will vary slightly because at each stage of the selection process some rounding will be necessary. Hence the actual sample sizes will be slightly bigger or smaller than those shown.
Table 3.1 provides an easy to use guide to the sample size needed in any state, providing the state has no more than five zones and the social forestry programme is not more than ten years old. For example, in a state where the programme is four years old and there are three zones the sample size would be 1134 deliveries. Sample sizes such as these are estimated to be large enough to allow the main characteristic of interest, seedling survival, to be estimated with a high degree of precision (low standard error). Hence, many other variables will also be sufficiently reliable for management to base implementation decisions on them. However, before such decisions can be made the data resulting from the survey must be processed, analyzed, interpreted and succinctly reported. Detailed guidance on these issues is to be found in Chapters VI and IX. The first step in the analysis is to summarize the survey results in a series of basic tables. The reasons for doing so are outlined below.
4. The Initial Analysis
It is difficult to predetermine th~ full range of analytical possibilities as these must reflect the issues of greatest importance in each State. However, the outline, set out above, of the information required provides a strong indication of the questions that should be addressed first. How, then, is this to be done?
Much depends on the techniques of data processing and analysis that are employed. If a micro-computer is available not only will all aspects of the analysis and subsequent report writing be more accurately and speedily accomplished but the range of questions to be studied can be greatly

41
expanded. If. however. manual data processing is perforce the chosen method of analysis, data manipulations will be much more limited. In either case, however. it will be essential to produce an initial basic series of tabulations. These tables should be as sharply focussed on the main questions as possible so that if this is all that can be achieved, owing to data processing restrictions, the resulting information will still be of great use to management. On the other hand, if the analysis is computerized, then the initial tables will not only be directly useful but provide the basis for further analysis -- quite probably of a more sophisticated nature. Hence, in Chapter VI this basic set of tables is set out together with notes on their construction and interpretation. Even a fairly brief perusal of these tables will reveal the comprehensive nature of the data collected through the survey and show how the information required will appear after initial tabulation.
Managers, however, to whom this chapter is mainly addressed, should reflect on these tables not only to confirm that they will yield useful information but also to consider other questions that they might care to have answered. The active participation of managers in this way will greatly help to ensure that the work of the MEU is relevant and timely and thus help to foster the interaction between management and the MEU that is essential to productive monitoring and evaluation.
B. On-Going Evaluation of Village Woodlots
Village woodlots are relatively small plantations established on community or government lands for the production of fuelwood, fodder, small timber and other forest products. It is intended that they be established with the participation of the community, by whom they will ultimately be managed. Usually it is intended to distribute the benefits derived from village woodlots (including the employment opportunities) with a positive bias towards the under-privileged.
Most States have established two kinds of village woodlots. Departmentally managed woodlots consist of those which have been created with Panchayat approval and with the intention to ultimately transfer management to the Panchayat but are supervised and managed by the Forest Department. Self -help or community managed woodlots consist of those which have been established and are being managed by the Panchayat with various levels of financial and technical assistance provided by the Forest Department.
I. Reasons for On-going Evaluation
The establishment of these village woodlots, particularly those dependent on self-help has been problematic. In some States the numbers established have fallen well short of planned targets. Satisfactory solutions to the difficulties involved in the transfer of management and in the distribution of benefits have not been found. Fundamental policy questions continueto be raised. Are the targets unrealistic or is the programme not adequately designed to meet them? Are community woodlots sociologically feasible? Can the Forest Department provide the kind of extension services woodlots may require? To what extent can woodlots make a significant contribution to a community's need for wood and related products? To what extent do people willingly participate in their establishment?
Similarly. at the operational level, a number of other questions remain unresolved. How much financial and technical support should the implementing agencies provide to the Panchayats? What species and management models should be adopted? What form of agreement with the panchayat is

42
most workable? How can the equitable distribution of benefits to the poorest be ensured? How effective is forestry extension work in increasing people's awareness and participation? Does the timing of operations conflict with seasonal labour shortages?
Questions of policy and operation such as these as well as the complexity of the sociological issues involved require that the ongoing evaluation of the village woodlot programme be as comprehensive aspossible. Broad comparative studies are initially required in order to uncover the range of variation and the social dynamics involved. Subsequently more specialized in~depth studies may be necessary for which skilled resources from outside the MEU must be contracted.
Nevertheless, definitive answers to some of these important questions cannot be provided in the short run. In addition to the compilation of basic information about village woodlots described in Chapter II the collection of additional information through on~going evaluation is necessary. Only then will it be possible for the M&E Unit to determine which questions should be studied in greater depth, to rank them according to priority, and to relate these priorities to the time and resources available. Initially, therefore, the on~going evaluation of village woodlots should be confined to a small (simple random) sample survey of village woodlots.
2. The Sampling Plan
The recommended sample should be approxima tel y 100 wood lots in the State as a whole. Details of the sample design and selection procedures are provided in Chapter VII. It is recommended that this sample survey be repeated every four years mainly because community attitudes are not likely to change quickly enough to warrant more frequent survey. Additionally, between the first and fourth years after the establishment of a woodlot, the only forest product likely to be available is grass; between years 5-8, other forest products such as fruit, twigs, fodder leaves, thinnings, small timber and poles will probably be available.
In each of the villages to which the sampled woodlots belong it will be important to obtain information from both village leaders and villagcrs. In principle this could be done by selecting all respondents in the survey at random from lists of all households in the village. But the number of village leaders is small relative to the total number of households in the village. Hence, such a procedure would, if the sample from each village is small, risk that the opinions of village leaders would be severely underrepresented in the sample. Because resource and time considerations require the sample to be of modest size this problem can be overcome by purposively choosing village leaders in each sampled woodlot village. Thus a major feature of the selection of respondents for the on-going evaluation survey of village woodlots is that it is partly random and partly purposive. In outline, the procedure for sample selection is as follows.
From a complete list of woodlots in the State, obtained from the monitoring of plantations described in Chapter II, the MEU must select a simple random sample of 100 woodlots. Next, within each sampled woodlot village five village leaders must be purposively selected (e.g. the Sarpanch, a female member of the Panchayat, a resident government official). To match this, a simple random selection of ten other households in the village must be chosen. This latter random sample of villagers must be selected from a complete list of all households in the village. Thus the final sample size for the woodlot survey will be as follows:

43
No. oj Woodlots No. oj Village Leaders No. Villagers
100 500 1,000
Because the village leaders in the sample are not selected randomly their responses cannot be aggregated with those of randomly selected villagers -- to do so would lead to severely biased and distorted results. Such aggregation is, however, unnecessary as the purpose of the two different sub-samples is to provide a basis for comparing the opinions and attitudes of leaderswith those of ordinary villagers.
3. The Information Required
Bearing this purpose in mind, and the: policy and operational issues mentioned at the beginning of this section, the information to be collected is summarizedbelow.
o Respondent's knowledge of the woodlot and its establishment.
- When did they learn of the woodlot? When was it started? By Whom? Why?
o Community participation.
- Who works on the woodlot? Were they paid? Who donates labour? Have contributions to the woodlot been made in other ways? What products are being produced? Who is receiving them? Has the Pallchayat benefitted from the woodlot? How?
o Respondents attitudes to the woodlot.
- Are attitudes generally positive or negative? What determines these attitudes? Do attitudes differ according to whether the woodlot is managed by the Forest Department or thecommunity?
o Woodlot management.
- Who actually manages the woodlot? Why is this so? Is the Forest Department doing enough to transfer ownership? Do villagers want ownership to be transferred?
The detailed list of Questions is provided in the structured, precoded Questionnaire set out in detail in Chapter VII.
To answer these Questions and to provide information to management the MEV must, as in the ongoing evaluation of farm forestry, undertake a basic statistical analysis. Details of this analysis and the initial tables that will result are to be found in Chapter VII.


45
IV. THE MONITORING AND ON-GOING EVALUATION OF OTHER SOCIAL FORESTRY ACTIVITIES AND OTHER STUDIES
In addition to the monitoring and evaluation studies so far discussed, each MEU,to create a balanced and comprehensive monitoring and evaluation system, should undertake a number of other studies. The number that can be undertaken depends on several factors - the most limiting of which are the financial and manpower resources available. Listed below are eleven studies concerned with the monitoring and evaluation of other aspects of the social forestry programme. Each addresses important questions concerning social forestry which have not been adequately covered by the monitoring and on-going evaluation system thus far discussed.
Monitoring and On-going Evaluation Studies:
1. The Monitoring and On-Going Evaluation of Strip Plantations and Rehabilitation of Degraded Forests.
2. The Monitoring and On-Going Evaluation of Tree Patta, Tree Tenure, and Group Farm Forestry Schemes.
3. The Monitoring and On-Going Evaluation of Improved Wood stoves and Crematoria.
4. The Monitoring and On-Going Evaluation of Institutional Forestry
Other Studies:
5. A Review of the Management and Administration System. 6. Special Study of Extension and Publicity Activities. 7. Economic Analysis of Different Types of Farm Forestry and their
effects on Crop Production and Labor Utilization. 8. Study of the Role of Women in Social Forestry. 9. Study of Incentives, Legislation and the effects of Markets on Private
Tree Growing. J O. Study on the Effectiveness of Non-Governmental Organisations in Promoting
Social Forestry. 11. Study of the causes of Non-participation in Social Forestry.
The first four of the studies listed above concern elements of the social forestry programme which are of considerable importance. Accordingly, these studies should be viewed as mandatory by the MEU and be fully integrated into the unit's work programme - see Chapter VIII. Hence, it is recommended that during the years in each four year cycle when neither a farm forestry or village woodlot survey is scheduled, these additional studies be conducted. A survey methodology similar to that developed for either the farm forestry or village woodlot survey may be employed for this purpose if the importance of the activity justifies such an effort. Alternatively, a much quicker rapid appraisal methodology could be used, at least for the first time the activity is studied. Since survey methodology is dealt with in considerable depth in Chapters VI - IX, it is not discussed any further. Instead, the use of rapid appraisal techniques is illustrated in the context of the monitoring and ongoing evaluation of Strip Plantations and Rehabilitation of Degraded Forests.
The remaining studies (5 - 11 above) are not an exhaustive list and are provided as examples. Each State is, therefore, free to determine topics for study and the priority to be accorded to each. Such priorities must, however, be decided in discussions between management and senior M&E staff.
The studies which are outlined later in this chapter are mostly complex one-time affairs which require specialized skills for their design and

46
execution. In general, it is neither practical nor desirable to expect the small staff of an MEV to undertake all, or even most, of these studies. It is likely that they will have to be subcontracted to competent local institutions but closely supervised by the senior staff of the MEV. Chapter VIII provides guidelines on the procedures to be followed in commissioning such studies.
1. The Monitoring and Evaluation of Strip Plantations and Rehabilitation of Degraded Forests: An Illustration of Rapid Appraisal
Strip Plantations (SP) are relatively narrow plantations established by the Forest Department along road sides, canal banks, and along the sides of railway tracks. Rehabiliation (or regeneration) of Degraded Forests (RDF) is the replanting of fairly large areas of Reserved Forest or public lands which are severely eroded or in environmentally critical areas.
SP have multiple objectives amongst which are:
(a) the creation of tree based assets for meeting local community needs for firewood, fodder, timber, fruit, and green manure;
(b) the conservation of soil; (c) the provision of shade for passers-by; (d) the ornamental and aesthetic; and (e) to demonstrate to local communities and ruad and rail users thc
"value" of treeL
Similarly, the objectives of the RDF are primarily:
(a) to meet the daily needs of the rural population for fuelwood, small timber, grass and leaf fodder;
(b) to create employment; (c) to help meet the State's overall demand for commercial timber; and (d) to assist in improving soil and water conservation.
The cooperation of local communities is essential for the success of both SP and RDF. Without assistance from, and acceptance by, the local community, there would be continued illicit felling and grazing, damage to plantations, and further environmental degradation.
There are, therefore, two interconnected aspects of SP and RDF about which management requires objective information. The first of these is technical information concerning planting techniques, choice of species, seedling survival and the quality of plantations. The second conccrns the socioeconomic effects of these components on local communities. Examples of the latter are the impact of closure in the early years of establishment of the plantations on different segments of the local community; the effectiveness of different types of protection for these plantations; local awareness of, and participation in developing the plantations; the benefits which are received, or anticipated, either as a matter of right or concession or agreement. These two aspects influence the type and timing of the studies and how they should be carried out.
The most important technical information that is required relates to planting techniques, choice of species (are the species planted the most suitable given the agro-climatic environment?), and the condition and vigor of the plantation. In many States, these questions can usually be answered from data routinely col1ect~d by t1'!.e Forest Departments. Hence, it may be unnecessary for the MEV to undertake technical surveys. If, however, the data

47
collected by the Department is inadequate in its coverage or quality then the MEU musteither request improvements through the intervention of management or conduct limited surveys itself. Should the latter be necessary, approaches similar to those outlined for Farm Forestry (Chapters III, and VI) and Village Woodlots (Chapters III and VII) should be followed.
To deal with the socio-economic aspects of SP and RDF major survey work is not recommended, partly because the present scale of SP and RDF operations in most social forestry programmes does not justify the cost and time that would be necessary and partly because such work would severely strain the resources available to the MEU. Instead, it is recommended that what are now popularly termed Rapid Reconnaissance or Rapid Assessment Surveys be employed.
This technique is little more than the social science equivalent of the established practice, for government officers, of touring. Essentially, it involves the careful and systematic recording of what is observed along the itinerary of the tour, and what is obtained through discussion, both with persons encountered casually and with those specially selected (either purposively or by random procedures).
There are, however, a few basic rules, the most important of which is the careful prior preparation of a checklist or informal questionaire. The elements of such a list are outlined below. Additionally, the observers must record the times and places of observation and discussion, and certain identifying features, for example, status or occupation of informants. All observations made on tour should be recorded in a separate travel log or journal. Times, distances and names of places should be recorded sequentially with the appropriate record of observations and events alongside. If standard numerical information at a number of sites is collected (for example, prices of selected goods at all markets visited), a previously prepared proforma will save time and provide a first structuring of results. Journal entries should follow a standard pattern designed to cover the checklist topics with a final, open-ended section to record overall impressions. A regular pattern eases the burden of the work, and helps to ensure that nothing is overlooked.
Above all, the observer must learn to perfect the art and science of interviewing. The art of interviewing relies heavily on the ability of the interviewer to put his respondents at ease so they provide honest, open answers. This requires modesty, sincerety, a willingness to listen, and the ability to refrain from exercising the authority of an official position. Interviewing requires a keen appreciation of the many different kinds· of bias which can arise from the interviewer situation and small, non-random samples. The observer must be alert to biased answers which may be obtained from poorer villagers who are asked a question in the presence of a powerful village leader. The observer should gauge the degree to which he is being "steered" to talk to certain people or groups, or to see a certain part of a strip, and make efforts to compensate. Finally, the observer should be aware of his own already developed biases and opinions and make every effort to have these disproved through adopting an open, objective, and inquiring attitude.
As its title suggests, Rapid Assessment is designed to be both informal and rapid. The survey should not span a period of more than three weeks. However, the number of persons interviewed during this period should be the maximum possible. The questions should be sharply focused and span a small number of points which are repeated to each respondent. The reporting should be speedy.

48
The Rapid Reconnaissance Survey (RRS) should be mounted after all the routine reports on SP and RDF have been received for a given year. After these reports have been studied, the staff should choose, within one agroclimatic zone, about eight SP and RDF (four of each type) for an RRS. The basis of choice might be provisional information about tree survival rates (for instance, choosing four SP and RDF with the highest survival rates), or the type of protection used (ranging from barbed wire fencing, to no fencing or other protection at all).
At each SP or RDF site, the number of persons with whom the observer(s) talks should be as many as possible, within the constraints of a vaila ble time and the need to hold thorough discussions. These should include the Forest Guard/Ranger responsible for the plantation and villagers found near the plantation or others who are residents in villages near the plantation. Particular care should be taken to include among those interviewed a few persons from the lowest socioeconomic sections of the village (for instance. herders and members of a scheduled caste or tribe). and women, as well as those who live further from the road.
In addition to identifying data on type of plantation, year established, etc. the checklist of major points about which information should be sought is as follows.
(a) Choice of SpeCies. Why were the species and the species mix in the plantation chosen? Was the choice the result of requests from the local population? Was this choice based on local needs, or on purely technical grounds or was it made for ornamental reasons?
(b) Plantation Survival. What are the current survival rates? Do they differ by species, site characteristics, or closeness to habitation? What are the causes of observed mortality?
(c) Type of Protection. What were the reasons for choosing the type of protection used at the plantation (e.g. to prevent animal grazing or illicit felling)'? How successful has it been?
(d) Ownership and Legal Status. Who owns the land? Who has jurisdiction over its use? Who are the traditional de facto users? How have the local people been using the area? What laws govern alternative uses?
(e) Sharing of Management and Distribution of Forest Produce. Has any arrangement or agreement been reached between the Forest De-partment and the local villagers (village panchayat. taluka panchayat) regarding protection, management and distribution of forest produce? Are the arrangements formal or informal? Are there any problems with regard to the working of these arrangements or agreements?
(f) Closure. During the first few years of the plantation when the area was closed to allow for establishment. which groups were the most affected (for example, herders, local villagers with livestock)? Were (are) they among the poorest sections of the village population? Were alternative arrangements considered and made for these groups?
(g) Rights and Concessions. Are there any existing rights and concessions with regard to use of forest produce in the RDF? How are these being exercised? By whom?

49
(h) Employment. Which sections of the local community were employed in planting and establishment operations? Were they employed directly by the FD, through contractors, or by the panchayats? Who is guarding the plantation--an FD employee, or a person employed by the local panchayat (or recommended by them)?
(i) Awareness/Knowledge. Are the villagers aware of any arrangement or agreement for the distribution of forest produce? Are they satisfied with this arrangement or agreement?
(j) Benefits. What forest produce is being received by the villagers? Is the distribution of. this produce based on socio-economic status, or does every villager have an equal right to it? What do the villagers think they are likely to get in the future from the plantation?
If the basic rules mentioned above are followed, it is a relatively simple matter, at the conclusion of the survey for the observer(s) to sift the already roughly organized information and to reduce it to a coherent, but short report. This should take no more than two weeks and the report, as well as providing the obviously descriptive should draw out those issues which are clearly actionable and suggest initiatives to management. Although the results of such a survey have no formal statistical validity, quantification of the results is valuable, not least because it imposes a certain rigor on the writer and may prevent the drawing of conclusions for which there is little evidence. Accordingly, some simple proforma tabulations with illustrative numbers are suggested in Annex I to this chapter.
2. The Monitoring and On-Going Evaluation of Tree Patta, Tree Tenure, and Group Farm ForestrySchemes
Social forestry programmes in India have recently developed some additional schemes for promoting tree growing among poorer farmers and landless laborers. These include various forms of tree tenure, frequently referred to as tree palla (certificate of rights or ownership), group farm forestry, tribal agroforestry, etc. The principal characteristic of the tree tenure schemes is that poor households are permitted to own trees they grow on government land leased to them exclusively for this purpose. Incentive and cost-sharing arrangements which form part of the schemes vary. In group farm forestry, found for example in West Bengal, a group of farmers with contiguous plots of land (usually land which has been distributed under land reform programmes) are mobilized to plant trees on their (demarcated) plots in order to benefit from economies of scale in the provision of inputs, protection, and harvesting. Similar arrangements, usually with a greater subsidy of inputs, are typical of tribal agroforestry schemes.
Except for the additional incentives and support provided, each of these schemes can be understood as a special type of farm forestry. Thus, to the extent that any of these schemes is an important part of the social forestry programme in a State, it is recommended that exactly the same methodology developed for the monitoring and evaluation of regular farm forestry be used to study these schemes. A few small additions to and modifications of the farm forestry questionnaire, to cover the additional incentives or special conditions that apply, will, however, be necessary. Likewise, the same sampling design could be used. However, if the number of beneficiaries is small,

50
a simple random sample such as that proposed for the village woodlot survey could be considered. If the scheme is just starting, it would probably be more valuable to conduct initially a rapid assessment survey such as that outlined for strips above but using a checklist based on the farm forestry survey questionnaire (see Chapter VI).
3. The Monitoring and On-Going Evaluation of Improved Woodstoves and Crematoria
In some States, social forestry projects also include a component for the promotion and distribution of improved woodstoves and the construction of improved crematoria. Unless some other agency has been charged with the responsibility of monitoring and evaluating such schemes, the MEU should undertake this task or commission an outside agency to do so.
The monitoring and on-going evaluation of wood-fuel stoves and crematoria has important technical and social dimensions. On the technical side, it is important to determine whether these stoves and crematoria are indeed saving fuel and what aspects of their design need to be reconsidered in the light of actual field use (e.g. chimneys, baffles, pot holes, etc.). At the same time, it is equally important to determine the social suitability and acceptability of the stoves and crematoria to different segments of the population based on such characteristics as cooking habits, family size, type of fuel used, cost, etc.
As this is a specialized subject in which social forestry personnel are usually not well versed, it is likely that the MEV will either have to engage a consultant to help with the surveyor contract the survey to a suitable institution. For additional guidance, it is recommended that the reader consult the FAO publication entitled Guidelines for the MOllitorillg of Pilot Stove Development Schemes., FAO, August 1985. For an example of a survey conducted in Nepal, the reader is referred to "Monitoring and Evaluation of Community Forestry in Nepal" (T. Bhattarai and J.G. Campbell in MOllitoring and Evaluation of Participatory Forestry Projects., FAO Forestry Paper 60, 1985).
4. The Monitoring and On-Going Evaluation of Institutional Forestry
In some social forestry programmes, there is an increasing number of plantations being established by various institutions including schools and other educational institutions, voluntary agencies, cooperatives, municipalities, joint public and private sector ventures, and private industries. While the monitoring of programmes with these activities is covered by the Quarterly GOl Monitoring Report (Chapter II), it is also important to conduct more thorough on-going evaluation wherever possible.
When the area of such institutional forestry is small or is new, it is recommended that the rapid appraisal methodology set out above for strips and RDF be employed for an initial assessment of these plantations and the benefits derived by local communities. However, wherever more statistically valid information is required, it is recommended that the village woodlot survey methodology be adapted and used to survey these activities. If most of the plantations are less than three years old, it is recommended that a simple random sample design be used in order to easily derive estimates of parameters for the total population of the particular type of institutional plantation being studied. In such a design, each type of plantation should be treated as a separate stratum.

51
5. Review of the Management and Administration System
While the monitoring and evaluation system set out in this Guide is designed to constantly monitor programme components to help management meet its objectives, it does not monitor the management system itself. Administrative procedures, personnel policies and practices, decision-making patterns, communication channels, relationships with local people, staffing and organization, and operating constraints are among the aspects of management which could benefit from a specialized evaluation exercise, as has been done by the Forest Departments in some states.
Such a management study should be contracted to an appropriately specialized agency. Not only are specialized skills required to usefully conduct such a study, but an outside perspective is necessary to obtain the objectivity and a fresh viewpoint that are essential. For an example of the terms of reference for such a study, the reader is refered to the Forest Department of the Government of Tamil Nadu.
6. Special Study of Extension and Publicity Activities
Extension and publicity form an essential component of all social forestry activities. To the extent that the proof of good extension and publicity is to be found in the concrete actions which they engender, the monitoring of field activities as set out in this Guide is the best way of determining their effectiveness. In the context of farm forestry and village woodlots this subject is addressed through a number of Questions which deal explicitly with extension. It is likely that this coverage in the farm forestry and village woodlot Questionnaires will suffice for most purposes. But, because it is difficult to measure to what extent extension and publicity have been responsible for any successes or failures observed in the field, it is also useful to examine this component of the programme in greater depth. Hence, it is advisable to mount a special study which specifically examines both the functioning of the extension service and the effectiveness of different media in reaching and convincing people of the value of the message transmitted. It is likely that the commissioning of an outside institution to conduct this study would be the best way to proceed.
7. Economic Analysis of Different Types of Farm Forestry and their effects on Crop Production and Labor Utilisation
Some of the most controversial issues surrounding farm forestry are the extent to which trees are planted in agricultural land and the effects of such planting on food production and employment. In addition, to the extent that farm forestry is a kind of cash crop, there are important Questions regarding its economic viability relative to alternative crops which the farmer could grow. Alternatively trees grown in mixed stands with crops or on field boundaries are thought to have positive effects on crop production.
To address these issues and Questions, it is necessary to mount a separate study of farm forestry inputs and outputs within the farmer's total agricultural system. While approximate values for some of the key variables will be available from the farm forestry survey, the degree of detailed data required as well as the specialized skills needed for analysis preclude incorporating such a study into the farm forestry survey. It is therefore recom-

52
mended that a qualified outside institution be commissioned to conduct a special study under the direct supervision of the MEU using a sub-sample of the farm forestry survey sample. As the literature on agricultural system studies is vast indeed, no attempt is made here to outline the methodology to be employed in such a study. Instead, it is suggested that institutions qualified for undertaking this work be requested to prepare detailed proposals which should then be reviewed by the MEU with the assistance of agriculturalist colleagues before finally selecting the organisation to undertake this study - see Chapter VIII.
8. The Role of Women and Other Under-privileged Peoples In Social Forestry
Throughout the Indian sub-continent, women play a substantial role in fuel and fodder collection, livestock rearing, and agriculture, regardless of whether they are or are not members of female-headed households. Despite their importance to social forestry it is increasingly claimed that they are frequently by-passed by social forestry schemes and under-represented in the decision-making and extension processes. In part this is because so few women are employed by the implementing agencies. This situation is generally held to be both inequitable and inefficient as it does not take advantage of the full productive potential of women in social forestry activities. These propositions require careful investigation designed to more clearly identify the problems and provide the basis for solutions.
Similarly, there are other groups of people who are relatively powerless and who arc frequently overlooked in the development of social forestry programmes despite efforts to prevent this. Migratory herders, tribals who depend on forestry resources, artisans living off forestry products, and other minority and socially deprived groups all have potentially important roles to play in social forestry. Currently the needs of these people arc not well understood.
For these reasons a special study on the role of women and/or other "minority" groups may well be deemed a prior~ty. Such a study would be best designed by an anthropologist or a sociologist working in a team with an economist and a forester with field experience. Until the MEV has its full complement of professional staff, it is likely that such a study would also have to be commissioned from an outside institution and much of the responsibility for its design be left to the professionals thus engaged.
9. Incentives, Legislation and the Effects of Markets on Private Tree Growing
This proposed study complements that on the economics of farm forestry and might be combined with it. In contrast to the economic study which would focus on the effects of tree growing within the farm, this study would examine the external conditions which affect farmers' decisions to grow trees. The degree and kinds of subsidies provided, other incentives, taxation, legislation inhibiting or encouraging tree growing and harvesting, marketing channels, and wood product prices and marketing restrictions are all important external factors which should be examined. Furthermore, it may be desirable to examine market trends and construct models designed to forecast the amount of tree growing under alternative assumptions about future demand.
A study such as this would require the skills of an agricultural economist, a lawyer, a sociologist and probably an econometrician if it is to be adequately undertaken. Thus, as with several other special stUdies, it should be commissioned from an outside institution with overall supervision provided by the MEV. In order to compare the effects of different State

S3
policies, it would be advisable for this study to be commissioned by the NWDB who would mandate that it cover more than one State.
10. Effectiveness of Non-Governmental Oraanisations
There is increasing interest by both Government and private agencies in expanding' the role of non-governmental organisations (NGOs) in social forestry. It is important, therefore, to assess their effectiveness in different circumstances. What are the advantages and disadvantages of NGO involvement? What are the strengths and weaknesses of NGO's, the costs and benefits to be considered? As NGO's gain experience and take up more field programmes, it is crucial not only that they institute their own monitoring and evaluation, but for State agencies to assess their capability and the value of providing them with additional support.
Since different NGOs have programmes that vary widely in scale, coverage and focus, it is impossible to specify the general methodology to be followed in examining their actual or potential effectiveness in social forestry. As with a number of the other special studies, therefore, it will be necessary to develop specific terms of reference and invite qualified institutions to submit proposals for any major study. However, for initial assessments, a suitably modified version of the rapid appraisal technique set out above for strip plantations can be employed by the MEV itself.
11. The Causes of Non-Participation In Social Forestry
A gap in the information provided by the system of monitoring and evaluation set out in this Guide is that little data is collected about nonparticipants, either individual households or entire communities (villages). Since the sampling frames for the major surveys discussed in Chapters III, VI and VII are based on participation in social forestry activities, there is little chance for the people who do not participate to be studied. If data were available on non-participants (the "control" group in sampling terminology), it would be possible to make comparisons with those who do participate and to determine if there are any important differences between the two groups (i.e. to establish whether the programme only reaches certain kinds of people and villages) and to ascertain the attitudes the of these non-participants to tree growing and the extent to which they already grow trees.
A small study of non-participants could well prove useful" in suggesting ways in which the social forestry programme could be reoriented to better serve all the people in a project area or a State. Such data would be especially important if the complex task of evaluating the impact of social forestry on household fuelwood use, rural incomes, employment, and the condition of natural forests were to be attempted. However, such an exercise would have to be planned and executed with great skill and would require considerable time and resources in order to be successful. For these reasons, such a study is not outlined in this Guide. This, however, is not to say that such a study should not be undertaken if sufficient resources and trained manpower are available and a fully competent institution can be contracted. If properly conducted, such a study would provide important policy lessons of value to both India and other nations.

S4
Annex 1. PROFORMA TABULATIONS FOR RESULTS OF RAPID RECONAISSANCE
SP RDF
SP RDF
SURVEY OF STRIP PLANTATIONS AND REHABILITATION OF DEGRADED FOREST
Table 1: CONDITION OF PLANTATIONS
Good £/ Average £/ Poor £/
4 4 4
3 1
Y "No." refers to the number of plantations visited. £/ These categories should be defined in a footnote to the Table.
Table 2: REASON FOR CHOICE OF SPECIES ---Technical
No. Nos. ~/ Local Choice Considerations Ornamental ----------Percent of Respondents-----------
4 38 40 50 10 4 28 20 70 10
~/ This is the number of respondents who provided a classifiable answer. If a significant number of the persons interviewed could not offer a
reason these "don't knows" should be shown in an additional and separate column. Where appropriate this injuction also applies to the other tables.
Table 3: SEEDLING SURVIVAL AND PLANTATION PROTECTION ---
SP RDF All
No.
4 4 8
Highly ~/ Protected - -Average
80 90 85
Modestly ~/ Not Protected Protected
Seedling Survival Percent £/--
70 75 80 70 75 73
y These categories should be defined in a footnote to the Table. £! Irrespective of species. If the plantations are of widely
different ages, this should be taken into account.

SP RDF
SP RDF
55
Table 4: NUMBER OF MANAGEMENT AGREEMENTS ---No.
4 4
With Agreement
3
Without Agreement ~
1 3
!I If agreements are being negotiated this should be specified.
Table 5:
No. Nos.
3 30
KNOWLEDGE OF AND SATISFACTION WITH AGREEMENTS !/
Know Don't Know Satisfied £/ Not Satisfied Q/ ----------------number of respondents-----------------
25 5 20 5
--------------- not applicable ---------------------
!/ Refers only to SP and RDF with agreements.
£/ The sum of these two columns cannot exceed the number claiming to know.
SP RDF
Nos.
36 40
Table 6: --- EFFECTS OF CLOSURE Claiming No Alternative
Affected !/ £I Not Affected !/ Provided £/ --------------percent of respondents-------------
90 68
10 32
85 73
!/ The percentages under these two columns sum to 100 for each type of plantation.
b/ This is a separate percentage of all respondents. £/ It may be helpful to provide an additional table showing the breakdown
of this group into. say, landless/herders, small farmers and large farmers.
SP RDF
Table 7: BENEFITS DERIVED ---Percent of Respondents
Claiming to Have Derived These Benefits !I Nos. None Grass Leaves Timber Fruit Other
37 39
28 35
72 60
35 40
o 5
o 10
2 7
a/ These percentage responses do not sum to 100 as the categories are not mutually exclusive.


57
V. RESOURCE REQUIREMENTS AND UNIT ORGANIZATION
Monitoring and evaluation is always constrained by the resources available. At times these resource constraints bind very tightly and either cannot be relaxed or relaxed only with great difficulty. At other times there may be greater flexibility. Nowhere, however, are resources unlimited and thus, those that are available must be carefully husbanded and used to their greatest advantage. Throughout, the Guide stresses the need to ensur"e that the M&E work program minimizes the demand for scarce manpower and funds yet delivers sufficient, timely information to program management. The data content and reporting frequencies of the monitoring system have been honed down and the proposed sample surveys are also a straightforward response to limi ted resources.
The resource requirements of an MEU must be related the number of zones in a state and to its essential work, that is, the work required to produce reliable information useful to management. The essential work of the MEU has been the subject of earlier chapters and, in essence, is the implementation of farm forestry surveys, the on-going evaluation of village woodlots, the preparation of key monitoring reports, the monitoring of forestry produce prices and the study of a few other components in the social forestry program.
This chapter discusses staff requirements and examines alternative approaches that allow for the gradual build-up of staff in the light of a vaila ble and foreseeable resources. Although all staff will be attached to headquarters, a distinction, to facilitate discussion, is drawn between "field staff" and staff permanently located at "headquarters." The former are discussed first.
I. Field Starr Requirements
The main work of field staff is the collection of data through sample surveys of the farm forestry and village woodlot components. They must also assist in the processing and tabulation of these data. In Chapter III it was recommended that farm forestry surveys be carried out every second year, and those for village woodlots every fourth year. During the one free year in this four year cycle, the other studies that are part of the MEU work program (e.g. the work on strips and RDF, patta schemes, and wood stoves) etc. would be undertaken - see also Chapters IV and VII. Accordingly, a staffing plan is recommended below which allows all of these tasks to be accomplished. The plan provides for the completion of a sufficient and regular annual work load, the collection of reliable data and the development of a core of skilled field staff. It also provides sufficent flexibility to accommodate short term budgetary constraints. Because the farm forestry sample surveys are the most resource demanding element in the M&E work program, we need only ensure that they can be implemented flexibly. Other elements, as shown in Chapter VIII, can then be fitted in without difficulty.
In any State about to introduce a monitoring and evaluation system the social forestry program will be at one of two stages of development: just starting, or more likely, active for some years. To commence this discussion, it is assumed that the program is just starting. As set out in more detail in Chapter VI, the build-up to the maximum sample size for the farm forestry

58
Table 5.1 FARM FORESTRY SURVEY: BUILD-UP OF THE SAMPLE SIZE IN ONE ZONE i/
No. of Yrs. Number of Strata FF Program has been 1 2 3 4 5 6&7 8&9
operating ..... Number of Deliveries ( Respondents) ......
1 -2 (1)hI 126 3 -4 (2) (126)£1 126 126 5 -6 (3) (126) (126) (126) 126 126 7 -8 (4) (90) (90) (90) (90) (90) 90 9 -
10 (5) (70) (70) (70) (70) (70) (70) 70
i/ This table corresponds to Table 6.4 in Chapter VI. hi The survey round is shown in brackets.
Total No. of Deliveries
(Respondents)
126
378
630
630
630
£I Numbers in brackets indicate the number of respondents carried forward for interviews from the preceding round.
For the purpose of calculating manpower requirements the following are assumed:
(a) an interviewer can, on average, complete three interviews per day, including travel time;
(b) interviewers work six days per week; and
(c) a round of the farm forestry survey in one zone should not take more than eight weeks of elapsed time.
In other words, it is assumed that one interviewer can conduct 144 interviews in a given survey round (Le. 3 per day x 48 days).
In a State with a new social forestry program, there are two main strategies for implementing the farm forestry survey. In the first, surveys are conducted simultaneously in all zones every other year. This is the recommended strategy as it allows other surveys and studies to be conducted in alternate years. The second preserves the alternate year timing but staggers the conduct of surveys by zone, so that surveys are conducted only in selected zones every other year. This allows the surveys to be done with a smaller number of staff, but at least doubles (to four years) the interval survey is slow, as new strata are added each year. Table 5.1 shows this build-up for one ecological zone.1/
1/ Sample sizes determine field" staff requirements and are kept as in Chapters III, VI and VII, as to reduce them would probably have undesirable consequences on the standard error of the resulting estima tes (see also Annex II to Chapter VI).

S9
between survey rounds in anyone zone. The staffing implications of the first and recommended strategy for States with three or five zones are given, as examples, in Table 5.2. Note that in states where the social forestry programme has been operating for some time the sample size, and hence the manpower requirements are greater from the outset since there are more age strata to be included in the sample, although as noted in Chapter III the sample size per zone remains constant after the program is six or more years old.
Table 5.2. FARM FORESTRY SURVEY: SAMPLE SIZE AND INTERVIEWER REQUIREMENTS FOR BIENNIAL SURVEY SCHEDULE IN A STATE WITHASOCIALFORESTRYPROGRAM BETWEEN TWO
AND FOURTEEN YEARS OLD
No. of Yrs. Field Interviewers FF Program Total Sample Size II Required has been Survey For 3 For 5 For 3 For 5 operating Round Zones Zones Zones Zones
2 I 378 630 4 6 4 2 1,134l2./ 1.890 8 14 6 3 1.890 3.150 14 22 8 4 1,890 3,150 14 22
10 5 1.890 3.150 14 22 12 6 1.890 3.150 14 22 14 7 1.890 3.150 14 22
'aI See Chapter VI for the detailed construction of sample sizes. l2./ For example. from Table 5.1 this number is 378 times 3.
Field staff requirements for the evaluation of village woodlots are roughly similar. The evaluation of a maximum of 100 woodlots for the whole State has been recommended every fourth year (Chapters III and VII). Assuming that one field worker can complete one village per week and again allowing eight weeks for field work, each field worker should complete eight village woodlots. Hence the minimum number of field staff required is thirteen. Fewer would be required if a field worker is able to complete the work in one woodlot village in less than one week. In practice however. it is likely that at least fourteen field staff will be necessary. This is equivalent to the number of interviewers required for a three zone farm forestry survey.
The numbers suggested above are operational requirements and may require modest upward adjustment (say ten percent) to allow for leave or sickness or an increase in the amount of field work. While a very short absence of an interviewer may be of little consequence as his duties can be covered by his supervisor, this is an inadequate and disruptive solution if several interviewers are absent at the same time or any absence is prolonged.
Interviewers should be carefully selected but appointed initially on a temporary basis, e.g. one year contracts. As they prove their aptitude for this work they should be converted to permanent staff. As already noted, interviewers must be supervised (see also Chapter VIII). Experience has shown that the ratio of interviewers to supervisors should not exceed 5:1 and preferbly should be about 4:1. Supervisors must be selected for their ability to operate independently in managing their far-flung charles. In the early stales of introducinl the M&E system and irrespective of whether the State has

60
an established social forestry program or one that is just beginning. field supervisors should be recruited only after a careful process of selection. Thereafter, as the required number of field interviewers increases, it is recommended that supervisors be promoted from the pool of field interviewers. Such promotion opportunities will increase the commitment of field interviewers and engender a feeling of job security.
2. Headquarters Staff Requirements
A carefully designed and operated collection system is the means to obtaining acceptable data. And, as explained in Chapter IX, the data must also be analyzed and interpreted. To perform both of these tasks successfullY staff, permanently stationed at headquarters, are required. First, lower level staff are considered and second. higher level professional officers whose duties are more wide-ranging. 11
As discussed in greater detail in Chapter VIII, field interviewers and their supervisors should provide the majority of the manpower required to undertake basic data processing and tabulation work. In doing so, they should work at headquarters during the weeks following the completion of major pieces of field work. In undertaking this work, field staff must be carefully guided and supervised. This supervision should be provided by assistant statisticians. In addition to supervising all aspects of processing sample survey data, the assistant statisticians should also be responsible for the compilation of the monitoring information discussed in Chapter II. Additionally, statistical clerks will be required to operate and maintain the data storage and retrieval system outlined in Chapter IX.
Next, the senior staff that will be required at headquarters are considered. It is of paramount importance that the senior staff of the unit should be (or become) specialists in monitoring and evaluation. This is a specialized field demanding specific formal skills backed up by practical experience. These staff must be permanent. Frequent staff changes will prevent the accumulation 'of experience and materially reduce the efficiency and utility of monitoring and evaluation. The common view that M&E is unimportant and should not be accorded either priority or importance as far as staffing is concerned is misplaced. Such views must be banished, for if they persist M&E is doomed to failure. Indeed, unless more positive views prevail M&E should not be attempted. The group of senior staff that will be required in most States is as follows:
Head of Unit Economist/Sociologist Statistician
In large States. however. it will be necessary to increase the number of professional posts. In particular a sociologist , if an economist is already hired, should be recruited. The reverse, of course, would also apply.
3. Qualifications and Duties of Monitorlnl and Evaluation Staff
Throughout this Guide, repeated reference is made to the diverse tasks that must be undertaken by the MEV and to the various categories of staff that arc needed. Accordingly. the qualifications that these staff should possess
.u Support staff such as: drivers. typists. peons, etc. are not explicitly considered. Adequate staffing at this level is, however, critical.

61
and their duties are set out in detail in Annex I to this chapter. These job descriptions should only be regarded as a guide, as the particular requirements of each State will probably require minor adjustments to the way in which responsibilities and tasks are assigned. Nevertheless, these job descriptions serve to emphasize that monitoring and evaluation is a full-time occupation requiring both dedication and specialized skills.
4. The Size, Structure and Cost or Monitoring and Evaluation Units
From the foregoing sections, it follows that the number of zones in a state has a direct effect on the MEU workload and hence on the number of staff and other resources that are required. The number of zones, however, must be carefully determined. This may be done by grouping similar agro-ecological zones in the state into larger zones which are meaningful for forestry (cf. Chapter III). Once done, this provides an initial basis for calculating staff requirements in the light of the workloads mentioned earlier. These initial estimates must, however, be reviewed in relation to the overall size of the social forestry program in the state to ensure that there are sufficient staff to carry out all duties allocated to the MEU. It may also be necessary to review staff members in the Divisional and Range offices to ensure that they ha ve sufficient resources to fulfill their reporting duties. An initial estimate of the number of zones in each state is given in Table 5.3. These estimates were derived by grouping similar agro-ecological zones together to create "zones" with roughly homogenous conditions with respect to tree growth.
Table 5.3 ESTIMATED NUMBER OF ZONES FOR SOCIAL FORESTRY MONITORING IN EACH STATE
State No. o! "zones" Slale No. o! "zones" Andhra Pradesh 5 Manipur I Arunchal Pradesh I Meghalaya I Assam 3 Mizoram I Bihar 4 Nagaland I Gujarat 4 Orissa 3 Haryana 2 Punjab 2 Himachal Pradesh 3 Rajasthan 5 Jammu & Kashmir 3 Sikkim I Karnataka 5 Tamil Nadu 4 Kerala 2 Tripura I Madhya Pradesh 5 Uttar Pradesh 6 Maharashtra 5 West Bengal 3
Table 5.4 presents initial estimates of costs and staff numbers based on the numbers of "zones" in each state. Hence, by using T~bles 5.3 and 5.4 it is possible to obtain a preliminary but detailed estimate of the costs of establishing and operating an MEU in each state.
A practical allocation of the required staff would be the Head at the apex, taking overall responsibility for the unit's operations, assisted by the Economist/Sociologist. The latter would have the primary task of guiding the analysis, drafting the resulting reports, and, in conjunction with the Statistician, have the responsibility of training staff and planning and executing all work on a day-to-day basis. In larger States (those with more than three zones), these duties would be shared with the other professional staff mentioned earlier. The size and structure of a monitoring and evaluation unit in a three zone state at full development might be as set out in Figure 5.1.

A.
Table 5.4: CAPITAL AND Jl.ECU~NT .UDGET ESTIMATES FOR M&:E UNITS IN 1H4'&lCES(Its)
IUD' -lI!I Wit» eo'" (loa-heNri_) I 14_ =-_-::*-2.,. ... _R.L.,....._ , .. -. .. h-' I.~
__ ... dor Car .J~p,
.torcycle. Subtotal
11. Office •• ui..,,, .~ocopyinc .. c~ine Electric o.,lic.tor "I',.-pe_ .. iter. "u~Diture 8~.tio .. ry, ete. C.lcDl.tor.
Subtot.l
III. "~rQc _\ar ~J Ricroco.~.r 8,.t~ Co.pater-D.t. Eatry Softw,re rac ... e. Softw.re Sapport
S.btot.l
ORit Co,t .1
90,000 100,000
20,000
100,000 .0,000
7,000 10,000 10,000
~OO
100,000 .0,000 11,_ 12,000
'0. DRil. ~
I 100,000 ~ 100.000
I 1 1 1 I
200,000
.0,000 7,000
10,000 10,000 4.000
71,000
100,000 40,000 1',000 ~ 170,000
110 .. tlpit;. ~ 110. Upit.. ~
1 90,000 1 100,000 8 160.000
1 1 2 2 2
13
3~.000
100,000 .0,000 14,000 20,_ 20,000 6.~e
200,500
100,000 .0,000 18,000 ~ 170,000
1 90,000 1 100,000
11 ~
1 1 3 3 3
17
410,000
100,000 .0,_ 21,000 M,ooo 30,000
8.500 229,500
100,_ .0,000 11,_ 12.000
170,000
1 90,000 1 100,000
14 ll!W!!!!!.
1 1 4 4 4
2:J
471,000
100,000 .0,_ 21,000 .0,000 40,_
...J.!.J92 259,500
100,_ .0,000 1',000
...ll..!!!!!l 170,000
s . ...-u. .cuaa" ann:.
I. BAH. ... v.it CIIi .. f Keo~i.t:/lociol0.i.t at.ti.tie-iaa .... i.e. .. St.t: i.t: ic i •• Fiet ..... r.i.oJ". Field I .... t:i .. 'ol'. (0 Pe~_.t
(iO T ... porar:r(--'Tr) .... Cl •• klUfEioe liar. St..t ilt iell Clerk Clerk-Typi.t: I hoa •• Attendeat:. Dri ... r.
SuMot ••
Add Bpeci.l Y':r , .01 ~,
Softw.re CoD •• l~.t
A .... l StaEE Co.t
II. Ot .... hit ...... _. tIl
------------------- -III. Co_lta_je • • 1
IctI.Al "CMU- Co"1
42,000 p ••• 36,000 p ••• 36,000 p ••• 24,000 p ••• 36,000 p •••
IB,ooo p ••• 9 .. 000 p •• ~
IB,OOO p ••• 12,000 p ••• 12,000 p •••
8 .. 400 p.a. 9,600 p •••
B,OOO p •••
161 of Ctp. Co.t.
10,000 p •••
4 2
4
42,000
)6,000
36,000
72,000 111,000
12,000 12,000
B,4OO ~ 246,_
9B,.oO
B,_
352.400
70,~0
40,000
1 1 1 1 2
6 4
1 2 1 1
6
42,000 36,000 36,000 24,_ 72,000
10B,OOO 36,000
17,000 24,000 1,400
19.200 417 ,600
167,0.0
8,000
592.640
115,210
60,000
767.920
I 1 1 1 3
B 6 1 1 2 1 2
B
42,000 36,000 3',000 24,000
10',000
144,000 ~,ooo 11,000 12,000 24,000 ',400 ~ 525.600
210,2.0
B,ooo
743.e.o
63,920
10,000
1 2 1 2 4
10 B 1 2 3 2 2
10
42,000 72,_ 36,000 4B,OOO
144,000
110,_ 72,_ 18,000 24,000 36,000 16,_ 19.200
70B,ooo
21D,200
B._ nL1!!!l
14~,200
100,000
1.244.400
1 90,000 1 100,000
17 llLJ!!!!
1 1 4 5 ~
26
1 1 1 1
1 1 1 2 ~
12 10
1 2 3 2 2
12
530,000
100,000 .0._ 2S.OOO 50,_ 50._
...lL.I!!!!t 281,_
100,000 40._ IB,_ ~ 170.000
42,000 72,_ 3 •• _
4B,_ 110,000
216,_ 90._ IB,ooo 24,000 3',000 1',_
J.t....m 79B.ooo
319,200
1.000
1.125.200
1~,960
120,000
1.402 .110
a/ r .. .-otect ~t coat. are co •• i .. teat:: .it. t.oee r'~D". at tM ..... lore Work.lao,. 19.. Jtl Bee A_a I to Chapter II for .. tail.. ~I 1..:1 ••• tr ... t .... 11 ot"'l' al1.,..aee •• ~I IltCl .... recal'J"i ... H.tio_I", co.t •• __ "iel •• ad ..... i,..at: _i.eDllace • ..:_p.el' _iate1lllllllce .... c:o.t of .. trot ... oil. aI r. C8YeK' .rYiee. of .-.i •••• cie .... i •• 1..,1 .... 1 •• 1''-1'117 for ... cul Ku.i .. ..

63
Flaur. 5.1 SIZE AND STRUCTURE OF A MONITORING AND EVALUATION UNIT IN A THREE ZONE STATE
l Head
I Economist/
Sociologist
r---- ----, I I Sociologist/ I Statistician J I Economist,U 2J I L _________ .J
Field Super- Assistant visors (3) Sta tistician (I)
---J
Other Office & Support Staff JJ
I I Temporary Field Field Inves- Sta tistical In vestiga tors (6) tigators (8) Clerk (I)
,U Dotted lines indicate posItions required in larger programs. 2J Depending on whether the first social scientist hired is an economist
or sociologist, this should be the opposite. JJ Office clerks, typists, drivers and peons.
Traditionally, Forest Departments do not employ social scientists. Consequently, even if employed, at least in the early years of M&E, there will be few promotion opportunities. Staff of adequate calibre will take time to locate, recruit and train. Hence, it may be possible for the Forest Department to obtain, on deputation, suitable staff from other departments. Alternatively, staff might be employed on a contract (tenure) basis. Should either of these options be exercised, the Forest Department should treat such occasions as opportunities to send their own staff to courses which will provide suitable training in M&E, and the social sciences, and thus enhance long-term career development.
Irrespective of whether the MEU docs or docs not have professional social science staff, all senior officers will require specific training in MetE. This is an important clement in creating the professionalism required in an MEU. This training cannot be provided by the Forestry Department or Rural Development Department. etc. Hence. suitable training opportunities at institutes or universities in India and abroad should be sought. The most senior staff should attend. at separate times. short courses (from 6 weeks to 3 months) in monitoring and evaluation. These courses should be carefully

64
chosen according to the balance in the offered instruction between theory and practice and the relative emphasis placed on the twin elements of monitoring and evaluation.
Staff, of course. are not the only resources required. Sufficient office accommodation must be provided to the unit and suitable equipment for field and office work. The unit must have an adequate operating budget to cover transport costs. printing costs. stationary and repairs to vehicles and equipment. Inadequate provision of these items is sure to severely hamper the unit's operations and reduce its efficiency and ultimately its credibility.
Supervision and quality control wilI be poor unless there is regular contact between field investigators and their superiors. In a situation where field work is necessarily geographically widely spread. such contact is only possible if adequate transport facilities are available. It is strongly recommended that a sufficient number of motorcycles and adquate travel allowances be provided to all staff operating in the field. This. however. is not enough to ensure high quality M&E work. Senior unit staff must make frequent visits to all field sites and travel extensively during surveys and this requires that the MEU be provided with its own independent transport facility: two to three vehicles should suffice. Without adequate transport, both field personnel and senior staff will be unable to effectively and efficiently complete their tasks and gain sufficient first hand knowledge of field conditions.
S. The Unit and the Social Forestry Program
Next the location of the monitoring and evaluation unit within the overall structure of the social forestry program and the officer(s) to whom it should report is examined. Monitoring and evaluation is undertaken primarily for the purpose of informing management of the successes and failures of the project so that suitable corrective actions may be taken or lessons learned for the future. Hence, it is crucial that the head of the MEU report to the most senior officer in charge of social forestry in the State. normally an Additional Chief Conservator in the case of Forestry Departments. It therefore follows that the monitoring and evaluation unit should be organizationally located to fulfill this reporting objective.
There is, finally, the question of the location of unit staff. The Head of the unit, the Economist/Sociologist, the Statistician, the Assistant Statisticians and Statistical Clerks would be permanently located at headquarters. The field supervisors and investigators would, when in the field, obtain administrative support as required from Circle and Divisional offices. Because these staff are unlikely to spend more than six months in the field each year (see Chapter VIII). and because they wilI be deeply involved with data processing. (at headquarters) at other times, it appears sensible for them to be posted to Departmental Headquarters. This is. however. a suggestion which must bow to the prevailing practice in each State.
6. Monitorlnl and Evaluation -- The State and the Government of india
This Guide, if closely followed, wilI ensure that different States work in very similar ways and that the results from one State can be reliably compared with those from another. This is an important feature when viewed nationally, as it will permit the Government of India to obtain a clear picture of the relative progress of social forestry in different parts of the country. In support of this larger objective the National Wastelands

6S
Development Board, is establishing a unit to work fulltime on the implementation and improvement of the monitoring and evaluation of social forestry. The duties of this unit include the following;
(a) undertaking regular visits to each State to discuss progress and advise on future M&E plans;
(b) ensuring that the procedures outlined in this Guide are consistently used by State MEUs;
(c) facilitating the interchange of M&E experience between State units and acting as a clearing house for methodological improvements;
(d) arranging training programs in M&E and computer use;
(e) providing technical advice to State MEUs on the scientific acceptability of procedures used in data collection, processing and analysis;
(f) developing and disseminating new techniques and methodologies likely to have wide applicability for improving M&E in the field;
(g) developing or commissioning standardized software that can be distributed to and used by each state and which will facilitate central (GOI) level aggregation and analysis;
(h) preparing an annual synthesis of evaluation findings from different States based on the comparative analysis of state data and reports, to be used fQr policy making and planning for social forestry programs in all India; and
(i) undertaking or commissioning specialized studies beyond the resources or competence of individual state MEUs.
Accordingly, State ME Us should stay in close and constant touch with the central MEU in the NWDB. The latter should, as a matter of routine be sent copies of all reports. These reports should be reviewed by the central unit and "all India" summaries produced, which would provide the basis for annual workshops. These would bring M&E practitioners from all States together to discuss progress, problems and new ideas and techniques.

66
Annex 1. DETAILED QUALIFICATIONS AND DUTIES OF M&.E UNIT STAFF
(i) Head, Monitoring and Evaluation Unit
Qualifications:
A degree in forestry; post-graduate training in economics desirable;
At least ten years practical experience in forestry;
Knowledge of basic statistical methods is a highly desirable additional Qualification;
Familiarity with methods of data collection and analysis;
Proven administrative ability.
Duties
Overall supervision and coordination of monitoring and evaluation work;
Management and administration of the unit;
Preparation of annual and long-term work programs for the unit;
Preparation of reports of the unit;
Determining studies to be carried out by outside agencies, delineating the scope and supervising the execution of these studies;
Assisting in the training of field supervisors and field workers;
Supervising the preparation of a field manual for investigators;
Supervisingdata processing, analysisanduseof compu ting facilities;
(11) Economist and Sociologist
Qualifications:
A basic degree in Economics, Sociology, Forestry or Agriculture;
For an economist, a post-graduate degree in Economics, preferably with background courses in Rural Sociology and Statistics;
For a sociologist, a post-graduate degree in Sociology or Social Anthropology preferably with background courses in Economics and Sta tis tics;
At least five years experience of designing and carrying out farm surveys and other field investigations;
Proven experience in data processing and analysis, knowledge of microcomputer use desirable;
Ability to write clearly and concisely about technical subjects.

67
Duties:
Design and supervision of monitoring and evaluation surveys;
Technical coordination of data processing and statistical compu ta tions;
Interpretation of survey findings and the drafting of reports, including monitoring reports;
Assisting in planning and implementing the work program for the unit;
Assisting in the design of studies to be undertaken by outside agencies and supervising these studies.
(ill) Statistician
Qualifications
A degree, preferably post-graduate, in statistics;
At least five years experience in the design and analysis of sample surveys;
Experience with use of computers (esp. microcomputers) for data processing and statistical analysis highly desirable.
Duties
Statistical design for sample surveys and sample selection;
Preparation of rules for laying sub-plots;
Supervising all data processing and tabulation work;
Assisting in report preparation, and the analysis of data related to program monitoring.
(Iv) Assistant Statistician
Qualifications:
A basic degree in mathematics, statistics or economics;
At least three years experience in processing data from rural sample surveys;
Familiarity with the use of calculators. Familiarity with microcomputers highly desirable;
Familiarity with agriculture and forestry.
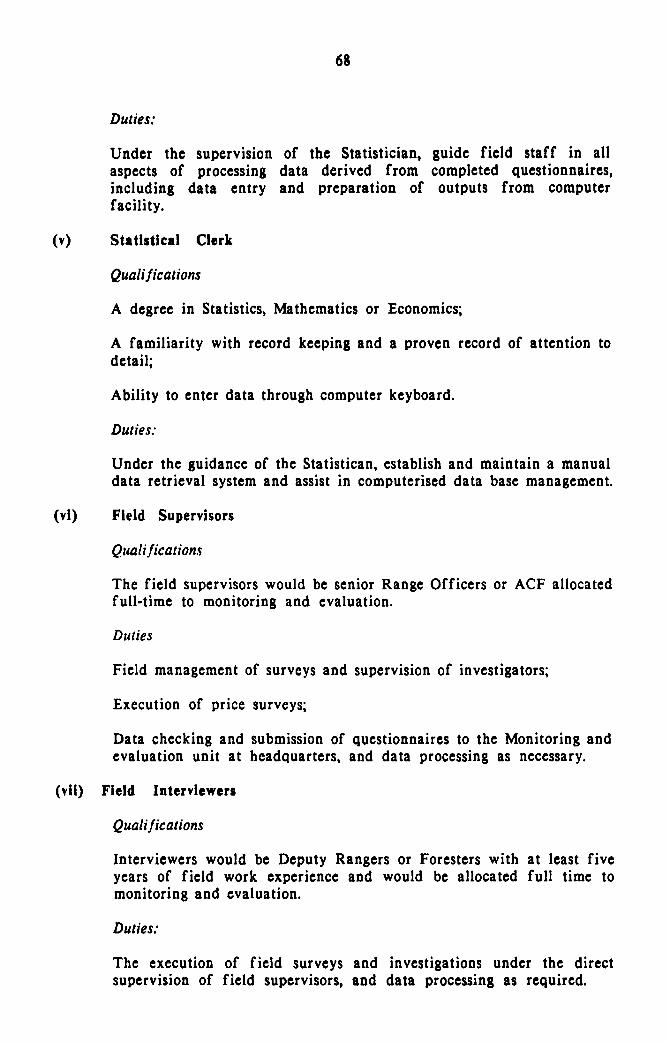
68
Duties:
Under the supervIsIon of the Statistician, guide field staff in all aspects of processing data derived from completed Questionnaires, including data entry and preparation of outputs from computer facility.
(v) Statistical Clerk
Qualifications
A degree in Statistics. Mathematics or Economics;
A familiarity with record keeping and a proven record of attention to detail;
Ability to enter data through computer keyboard.
Duties:
Under the guidance of the Statistican. establish and maintain a manual data retrieval system and assist in computerised data base management.
(vi) Field Supervisors
Qualifications
The field supervisors would be senior Range Officers or ACF allocated full-time to monitoring and evaluation.
Duties
Field management of surveys and supervision of investigators;
Execution of price surveys;
Data checking and submission of Questionnaires to the Monitoring and evaluation unit at headquarters, and data processing as necessary.
(vll) Field Interviewers
Qualifications
Interviewers would be Deputy Rangers or Foresters with at least five years of field work experience and would be allocated full time to monitoring and evaluation.
Duties:
The execution of field surveys and investigations under the direct supervision of field supcrvisors. and data processing as rCQuired.

69
VI. THE FARM FORESTRY SURVEY
Before reading this chapter readers should have carefully studied the contents of Chapters I, II, III and IV, which are more general. Understanding will be greatly aided by doing so, as the earlier chapters describe the overall system in which the farm forestry survey plays a central role. Additionally, readers should also study chapters VIII and IX. Chapter VIII provides guidance on how to implement M&E operations, including the Farm Forestry Survey and Chapter IX deals with data processing and analysis.
1. Sampllnl Procedures
The sample design outlined below uses a multi-stage, stratified sample selection plan which is easy to understand and to implement. It is, however, crucially dependent on the Statement of Seedlings Recipients mentioned in Chapters II and III. This Statement is very simple (see Figure 6.1 below) but must be sent once a year by each nursery to the MEU.
Figure 6.1 PROFORMA STATEMENT OF SEEDLING RECIPIENTS
Name of Nursery Address
Year D.! Total Recipients £} 1980 hi 1981
0 0
0 0
0 0
1986
D.! The year is defined as September 1st to August 31st. hi The years shown are illustrative only. In practice the first year for any
nursery will be the year in which the nursery first began to distribute seedlings.
£} The total number of seedling recipients (deliveries) for each year listed. This is to be taken directly from the Distribution Register maintained at each nursery.
The first stage is the selection of a probability sample of nursery registers that makes efficient use of information about the age of the register and the number of deliveries to private individuals in the register. The second stage is the selection of a sample of deliveries from each selected register. This identifies the farmers that are to be interviewed and whose plantings will be observed. For some deliveries thus selected, there will be a third stage, namely the subdivision of the seedlings planted into plots of which one or more are selected at random for detailed observation.
The first-stage sample is to be selected after the close of the main planting season and this will in most cases be the last three or four months of the calendar year. The first stage sampling unit is the nursery register; that is, the list of nursery transactions referring to the year September 1st to August 31st. Within that list of transactions only individual deliveries constitute valid entries for the purpose of sample sdection. Hence, a nursery that has been operational (delivering seedlings) for three years would have three registers -- one for each year of operation.

70
In a State where the social forestry program has been operating for six years all existing registers within a zone must be classified into five strata defined by the age of the register, identified let us say by the index h, where h-l indicates that the registers are for the current year, h-2 indicates that the registers are for the previous year, and so forth, while h-5 indicates that the registers are five years old or older. In each stratum, the registers must be listed in order of their size as measured by the number of individual recipients and by their age and size when h-5. For each stratum, mh denotes the number of registers to be selected for stratum hand nh denotes the total number of deliveries to be selected from stratum h. The sample should be distributed uniformly over the five age strata, so that onefifth of the sample registers and one-fifth of the sample deliveries are in each of the strata. In some zones this may need to be modified if there are too few registers or deliveries in a stratum. !I
The mit sample registers in stratum h will be selected with proba· bility proportIonate to the number of deliveries in a register. Let Nh de· note the number of deliveries in the i-th listed register of stratum h, and let Nb. denote the sum of deliveries in all registers in stratum h. The probabIlity of selection of the i-th register is then Nhimh/Nh' The actual selection is implemented in the following way. In the listing of registers enter the size of each register along with the cumulative sum of the sizes up to and including that register. Compute the "sampling interval" Ih - Nh/mh and then select a random number Rh from a table of random numbers in the interval from 0 to Ih. Next, calculate the sequence of sample "hits" as follows:
A register in the list is selected for the sample if it is the first one in the list whose cumulative size equals or exceeds a "hit" number in the seQuence.
To aid understanding an example of this selection process is provided below. Assume that the stratum in Question contains 59 registers (Nh -59) from which 16 are to be selected, hence mh = 16. First the registers are arranged in ascending order of size as shown in Table 6.1 below.
Now the sampling interval I is:
Ih - Nh/mh - 17,709/16 - 1,106.8125
and the random number selected between zero and Ih (i.e. between 0 and 1,106.8125) happens to be 61.7321. Hence the sequence of sample hits (registers to be selected) is:
61.7321, 1,168.5446 (i.e. 61.7321 + 1,106.8125) 16,663.9196 i.e. [61.7321 + 16 (1,106.8125)J
Register No. 2 is selected because the size in the cumulative size list for that register is the first to equal or exceed the first "hit" number (61.7321). Obviously, this procedure must be undertaken separately for each stratum in each zone.
The most desirable procedure for selecting the second slage sample; that is the sample of deliveries in each selected register i of stratum h, is
!I See the discussion of sample size below.
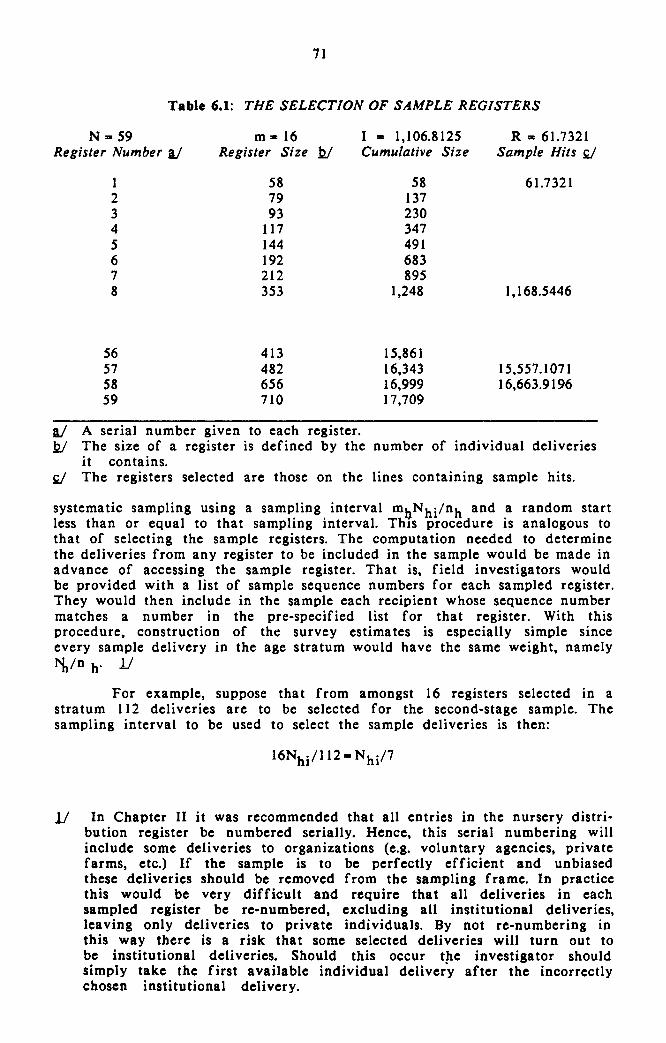
71
Table 6.1: THE SELECTION OF SAMPLE REGISTERS
N .. 59 Register Number &!
I 2 3 4 5 6 7 8
56 57 58 59
m - 16 Register Size l2/
58 79 93
117 144 192 212 353
413 482 656 710
&! A serial number given to each register.
I - 1,106.8125 Cumulative Size
58 137 230 347 491 683 895
1,248
15,861 16,343 16,999 17,709
R - 61.7321 Sample Hits 'M./
61.7321
1,168.5446
15,557.1071 16,663.9196
l2/ The size of a register is defined by the number of individual deliveries it contains.
'M./ The registers selected are those on the lines containing sample hits.
systematic sampling using a sampling interval ml).Nhi/nh and a random start less than or equal to that sampling interval. ThIS procedure is analogous to that of selecting the sample registers. The computation needed to determine the deliveries from any register to be included in the sample would be made in advance of accessing the sample register. That is, field investigators would be provided with a list of sample sequence numbers for each sampled register. They would then include in the sample each recipient whose sequence number matches a number in the pre-specified list for that register. With this procedure, construction of the survey estimates is especially simple since every sample delivery in the age stratum would have the same weight, namely
l'b/n h' 11
For example, suppose that from amongst 16 registers selected in a stratum 112 deliveries are to be selected for the second-stage sample. The sampling interval to be used to select the sample deliveries is then:
11 In Chapter II it was recommended that all entries in the nursery distribution register be numbered serially. Hence, this serial numbering will include some deliveries to organizations (e.g. voluntary agencies, private farms, etc.) If the sample is to be perfectly efficient and unbiased these deliveries should be removed from the sampling frame. In practice this would be very difficult and require that all deliveries in each sampled register be re-numbered, excluding all institutional deliveries, leaving only deliveries to private individuals. By not re-numbering in this way there is a risk that some selected deliveries will turn out to be institutional deliveries. Should this occur the investigator should simply take the first available individual deliver'y after the incorrectly chosen institutional delivery.

72
Further suppose that in the i-th selected register there are 390 deliveries to individual recipients. Then the sampling interval to be used is 390/7 - 55.7143. Next select a random number no greater than that sampling in interval, which turns out to be 20.1234. By successively adding the sampling interval and then dropping the fractional parts the following sequence of numbersspecifyingdeliveries that are to be included in the sampleis obtained:
20, 76, 132, 187, 243, 299, 354
There are, of course, several alternative procedures for selecting the sample deliveries, none of which is fully satisfactory. The least unsatisfactory alternative is to compute the sampling interval as in the above procedure, but then to round the sampling interval downward to a whole number Ihi' The sample would then consist of every Ihi-th individual delivery in the register, beginning with a random integer start (supplied to the investigator) that is less than or equal to the rounded sampling interval. The exact base weight is then not the same for every sample delivery in an age stratum, but is given by the expression IhiNh/nhNh and thus may be different for different registers. When the tabulahons of survey results are to be done manually rather than by a computer, this may not be a desirable procedure since it complicates the computations that are required. One way to obviate this difficulty is to ignore this weighting inequality and use the constant weight Nh/nh for every sample delivery in stratum h, but this will result in biased estimates. However, the bias is likely to be rather small, especially for ratio estimates. The bias arises only because the sample size in a register is somewhat larger than is implied by the use of the constant weight, so that the constant weight is somewhat greater than the exact weight that would produce unbiased estimates.
In some cases a a third stage of sampling will be necessary, or at least desirable, in order to confine observation to a subsample of a given (large) sample delivery. An example is the case in which the observation consists of making a count of the number of surviving trees. If the number of trees corresponding to the sample delivery is large, it would be wasteful of the investigator's time to count the whole planting. Instead, the planting should be divided into, say, k plots of approximately equal area, and one of them selected at random using a table of random numbers. Observation is then confined to the selected plot. The weight given above at the second stage of sampling must then be multiplied by the factor k, for the observations on that plot.
Another situation which may arise is one in which it turns out that a sample delivery was divided among several farmers. If the number of farmers involved in the delivery is small, subsampling may not be needed. However, if there are k farmers and one of them is selected at random to be interviewed, his base weight must be multiplied by the factor k. Similarly, if two of the farmers are selected at random, the base weight for each of them must be multiplied by the factor k/2. Hence, the associated weight is denoted by Whij since the weight for the j-th element may differ from that of other elemenn of the i-th delivery of stratum h. An example of this problem may be found in Annex I to this Chapter which deals with the calculation of ratio-estimates resulting from the sample survey if such calculations are done by hand rather than by computer.
The precision of the estimates will increase with increases in the 14mpl, size, but the sample size must be commensurate with the resources that are available for the work involved in selecting the sample of deliveries in each sample register and in collecting the required data from the household

73
related to each sampled delivery. The staff and other resources that should be available to the M&E unit were extensively discussed in Chapter V. Ideally, resources for this work should be determined through a process of optimization which for a stated level of precision in the estimates, gives both the size of sample and resources required. However, evaluating the farm forestry component is not the M&E unit's only task. Thus, even if an optimizing process were used the resulting resource requirements might be seriously out of line with the unit's other duties.
Accordingly, in Chapter V, resource requirements were assessed for the full work program of the M&E unit under several alternative implementation strategies. As a result, it should not be difficult to ensure sufficient resources by year six of a project or program to manage a sample of about 90 registers and 630 deliveries (farmers) in a single zone. If this sample is spread uniformly over the five age strata there will be 18 registers and 126 deliveries in the sample from each age stratum. Hence, for a farm forestry program which is six or less years old, the sample size in any particular year is derived by multiplying the number of strata in the State (Table 6.2) by the fixed number of registers and deliveries per stratum.
Table 6.2: NUMBER OF STRATA IN A STATE
Age 0/ Farm Number 0/ No. 0/ Zones in State Forestry Program Age Strata II 1 2 3 4
Number 0/ Strata in the State 121
One Year 0 0 0 0 0 Two Years 1 1 2 3 4 Three Years 2 2 4 6 8 Four Years 3 3 6 9 12 Five Years 4 4 8 12 16 Six Years 5 5 10 15 20
II The number of age strata lags one year behind the age of the program as seedlings are not studied until approximately one year after they have left the nursery.
121 The total number of strata is given by multiplying the number of zones in the state by the appropriate number oJ age strata.
Assuming that there is farm forestry activity in three zones in a State and that this activity is to be studied,then, depending on the age of the farm forestry program in the State, the total sample sizes of registers and deliveries will be as in Table 6.3.

74
Table 6.3: SAMPLE SIZE FOR A STATE WITH THREE ZONES Ii Sample Size l2J
Age oj Farm Forestry Program Registers Deliveries
One Year Two Years Three Years Four Years Five Years Six Years
Ii That is column 3 of Table 6.2.
o 54
108 162 216 270
l2J Based on 18 registers and 126 deliveries per stratum.
o 378 756
1,134 1,512 1,890
It may be necessary to modify the above procedure if some of the strata contain only a small total number of registers (say, less than 50). In such cases, some of the strata should be combined with their neighbors before selecting the sample of registers. so that each stratum contains at least 50 registers. The number of registers to be selected should then be allocated equally among the new strata, which have been reduced in number. As before, prior to selecting the sample of registers in a stratum, the registers in that stratum should be ordered by age, and by size within each age class.
At the outset it was proposed that the farm forestry survey be undertaken only in alternate years. Hence, in a State where the farm forestry program has just started, the first round of the sample survey would be undertaken in year two, the second in year four, the third in year six and so on. Because one of the objectives of the ongoing evaluation is to study change over time it is desirable to keep the same farmers in the sample throughout successive rounds of the survey. In early rounds, this is a trivial matter as the sampled registers and deliveries from the first round can be retained and supplemented by the addition of those selected in the second round. Once, however, the cumulative size of the sample in a zone reaches the limit imposed by available resources (about 630 deliveries) then this simple process of addition must be changed. In a given agro-climatic zone this stage is likely to be reached at the fourth round and to avoid an increase in the total sample size only a sub-sample of registers and deliveries from previous rounds can be retained - this can be done by rota ling the sample. The following sampling plan retains a large proportion of the observations from the third round, while including a sample from the new strata added for the fourth round. For the purposes of exposition the following remarks are confined (as in earlier sections) to the procedure to be followed in one agro-climatic zone.
For the fourth round, there are two additional register strata to be added to those of the third, for a total of seven strata. It is desirable for each of the seven strata to contribute about 1/7 to the sample for the fourth round. and the sample to remain of the same size as in the third round. Hence, in each of the five strata from the third round the sample selected should be reduced by multiplying by the factor 5/7. This is accomplished by selecting two whole numbers at random in the range from I to 7. and using these to delete two deliveries from every set of seven successive sample deliveries in the third round sample. For example, if the random numbers are 2 and 5 the sample deliveries deleted in the example below would be excluded from the sample:
/ I, 2, 3, 4, 5, 6. 7 / 8, 9, 10, II, 12, 13, 14 / 15, 16, . . . . .

7S
To select the sample from the two new strata of registers, first assign the number of registers and deliveries to be selected from each of them. A reasonable choice is the same number of registers that were assigned to the two youngest strata of registers in the third round, and S/7 of the numbers of deliveries that were assigned to those strata in the third round. The procedure for selecting the sample registers and the sample deliveries from those registers will of course be the same as in earlier rounds.
Sample selection for the fifth round of the survey, two years later, follows the same principles. That is, the sample used in the fourth round is reduced to 7/9ths of its former size and samples are selected and added from the registers of the two most recent years. Table 6.4 below illustrates these proced ures.
Table 6.4: SAMPLE SIZES IN DIFFERENT SURVEY ROUNDS IN A STATE WITH ONE ZONE
Number of Deliveries Sampled No. of years FF Survey From From Program has been Number Round Previous New Operating of strata II Number Rounds Strata Total
I 2 IhI 126 126 3 2 4 3 2 126 2S2 378 5 4 6 5 3 378 252 630 7 6 8 7 4 450 180 630 9 8
10 9 5 490 140 630
'SJ Where each stratum consists of nursery registers of the same age. hi Although the FF program is two years old, there is only I set (stratum)
of registers containing entries which relate to seedlings planted approximately one year before the first round of survey.
In a State where the farm forestry program has been operating for more than five years, as is the case with many States, the adjustment procedure is similar but the stratum sample sizes change somewhat as successive survey rounds are undertaken. This is illustrated in Table 6.5 below.

76
Table 6.S: SAMPLE SIZES IN DIFFERENT SURVEY ROUNDS IN A STATE WHERE THE FARM FORESTRY PROGRAM HAS EXISTED FOR SIX OR MORE YEARS AT THE TIME OF THE FIRST SURVEY ROUND i/
Number 0/ Years FF Program Has Existed t t+1 1+2 t+3 1+4
No. of Strata 5 6 7 8 9 No. of deliveries to be
selected per stra tum 126 90 70 Survey Round No. I 2 3
Total Sample Size 630 630 630
In Round I No. 0/ Deliveries Per Stratum
Stratum 5 contains trees of age 5+ 126 Stratum 4 contains trees of age 4 126 Stratum 3 contains trees of age 3 126 Stratum 2 contains trees of age 2 126 Stratum I contains trees of age I ill
630 In Round 2
Stratum 7 contains trees of age 7+ 90 Stratum 6 contains trees of age 6 90 Stratum 5 contains trees of age 5 90 Stratum 4 contains trees of age 4 90 Stratum 3 contains trees of age 3 90 Stratum 2 contains trees of age 2 90 Stratum I contains trees of age I 2.Q
630
aJ That is, in the Table t - 6 or more years.
Once the sample has been selected and the survey results have been delivered to headquarters it will, as part of the analysis, be important to calculate the sampling error. There are several ways of doing this and one such method, based on manual calculations, is illustrated in Annex II to this chapter.
The foregoing explanation of the calculations and procedures to be followed in the selection of the farm forestry sample have been prescribed for two reasons. First, to provide a detailed outline of the practical and some of the theoretical issues involved. Second, to provide a step by step set of guidelines for actual application in the situation where the sample is chosen by hand. Once the M&E unit has acquired a micro-compter the tedium and time involved in this process can be greatly reduced. By using a simple computer program on a data file consisting of all distribution registers the sample can be automatically selected precisely in accordance with the guidelines in this chapter. Such a program is described and illustrated in Annex III to this chapter.

77
2. Questionnaire Design
Surveys of the type under consideration have specific data collection objectives and the questionnaire to be used should, therefore, consist only of relevant questions. There are, however, many such relevant questions and all cannot be included if the elapsed time for survey field work is limited, respondents are not to be alienated and the information collected is to be speedily and easily processed. The latter step is, of course, greatly dependent on the processing technology employed (see also Chapter IX). Accordingly, the questions that have been included in the proforma questionnaire set out in this Section are all adjudged relevant but, in particularly propitious circumstances a few might be added, in other circumstances some might be omitted. However, the proforma questionnaire illustrated has been widely tested and discussed and should be seen as a firm pattern for the actual questionnaire to be used in any given State.
In studying the proforma questionnaire set out in the pages that follow, readers will notice that it has been laid out so that basic instructions and reminders to the investigators are close at hand (the page opposite the relevant question), and that an almost fully structured system has been adopted. Additionally, the proforma has been almost completely pre-coded for computerization (see Chapter IX) but this in no way precludes its use if data processing is done manually.
The questionnaire is presented in English but it should always be fully translated (with the possible exception of the instructions) into the spoken version of the relevant local language. This translation should be carefully undertaken and during the translation process a constant dialog between the designer (question formulator) and the translator should be maintained. The translation must be a colloquial one, understandable by illiterate villagers. The temptation to create a literary translation must be resisted. It must always be remembered that the data resulting from a highly structured questionnaire will, in large measure, be only as good as the questions used in their solicitation.
No matter how carefully the questions are formulated and translated they will not be perfect and a careful piloting (field testing) of the full questionnaire will be necessary. 11 This should not be a large exercise and should be undertaken by the most skilled and experienced investigators in conjunction with more senior staff. About forty interviews should be sufficient and should be conducted amongst respondents carefully selected to represent the widest range of respondent types. During and after each pilot interview, the "pilot interview response form" set out in Figure 6.1 should be completed. Respondents might also be encouraged to give their opinions of the questions. Following this pilot operation the information in the response form should be assessed and analyzed and the question modified accordingly. At the very least all literary phrases and words should be eliminated and the spoken versions of the questions actually used by the pre-test investigators
11 Alternative formulations of the questions can also be studied at this time but this will necessarily lengthen the process. In any event, improvements in question formulation will emerge with each succeeding survey round.
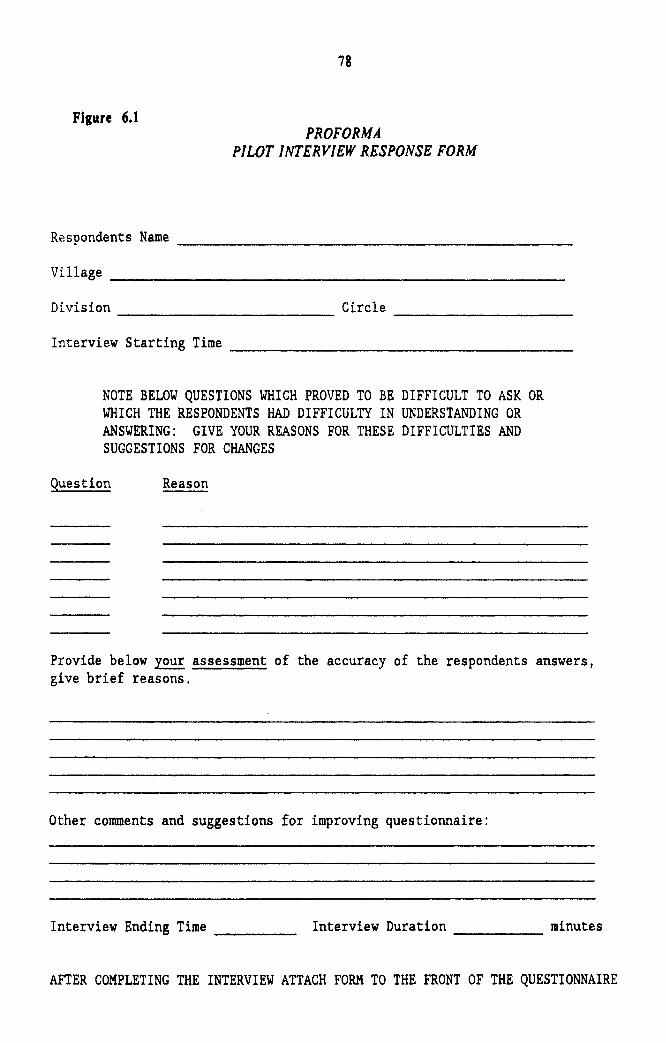
78
Figure 6.1 PROFORMA
PILOT INTERVIEW RESPONSE FORM
Respondents Name ____________________ _
Village __________________________________ _
Division Circle ------------- ----------------Interview Starting Time __________________________ _
NOTE BELOW QUESTIONS WHICH PROVED TO BE DIFFICULT TO ASK OR WHICH THE RESPONDENTS HAD DIFFICULTY IN UNDERSTANDING OR ANSWERING: GIVE YOUR REASONS FOR THESE DIFFICULTIES AND SUGGESTIONS FOR CHANGES
Question Reason
Provide below your assessment of the accuracy of the respondents answers, give brief reasons.
Other comments and suggestions for improving questionnaire:
Interview Ending Time ____ _ Interview Duration minutes -----
AFTER COMPLETING THE INTERVIEW ATTACH FORM TO THE FRONT OF THE QUESTIONNAIRE

79
to interview the respondents substituted in their place. Although these precepts are given here in the context of the farm forestry survey they apply with equal force to all surveys undertaken by the MEU.
In studying the questionnaire, readers will note its comparative brevity. Brevity, however, is not synonymous with simplicity. Many of the questions are complex and in any event should be linked "conversationally" together. The questions that have been included have all been carefully considered and judged in the light of the survey's objectives. Throughout, a simple "rule of thumb" has been adopted namely "when in doubt, leave it out." There is always a great temptation in questionnaire design to pursue every avenue and to fully explore all issues with scant regard for the resulting volume of data or the problems of processing it in a speedy and manageable manner. It is undoubtedly more difficult to omit questions than to include them but is only by ruthlessly abandoning all but the most important that brevity, relevance and practicality can be simultaneously achieved.
As presented (in English) none of the questions, if correctly administered, appear to be leading (i.e., do not predispose the respondent to a particular answer) but great care must be taken to preserve this feature during translation. Similarly the ordering of the questions is designed (as far as possible) to permit the questions to flow smoothly together. Pretesting may, however, suggest an alternative ordering.
As presently formulated the farm forestry questionnaire elicits information on a range of parameters which are thought to be important, such as family and farm size, livestock holding, seedling acquisition and planting, foregone crop production, seedling survival and growth rates, production of forest products, plantation maintenance costs, farmer's species preferences and the amount of extension advice received by farmers. Many of these subjects are complex and, as is pointed out in other chapters, can be further explored through additional in-depth studies. Moreover, household wood consumption, attitudes to improved stove (cooking) technology and crematoria are examples of subjects not covered at all. These too can be covered by special investigations (see Chapter IV).
Consistent with the sampling design most of the questions that have been included measure variables that are expected to change over time. Hence, they should be asked at each survey round. A few questions seek historic data which does not change. Hence, in principle, these questions need be asked only once. However, unless data is immediately available from previous questionnaires, they should be repeated in each round so as to avoid tabulation problems.
At the time the survey is put into the field suitable general instructions (which are not included in the present proforma) should be given to investigators. Preferably, these should be codified into a field workers manual. Such a manual should provide detailed advice and guidance to intestigators concerning all aspects of their work. Particular emphasis should be given to aspects such as selecting the deliveries from nursery registers, locating respondents, handling of questionnaires, checking procedures and how to deal with unusual situations. Additionally, the manual must contain the full master codes jor crops and species which are required by the questionnaire but which cannot be included in it. These master codes will of course vary from state to state. To write a manual of this kind requires not only substantial knowledge of sample survey work and interviewing respondents, but also experience gained through using the farm forestry survey questionnaire.


II
PROFORMA
FARM FORESTRY QUESTIONNAIRE
INVESTIGATOR PLEASE NOTE
In general, respondents' answers should be recorded in the spaces provided beside or below the questions. When the interview is over the relevant codes or values can be entered in the boxes on the right hand side of each page. In some questions however, direct entry of answers into boxes is required. Particular care must be taken, in these cases, to ensure that answers are correctly recorded. If a respondent cannot answer a question or declines to give an answer, write DK (Don't know) neatly beside the question.

Q 1.1
Q 1.9
Q 2.1
Q 2.2
Q 3.0
Q 3.1 Q 3.2
Q 3.3
Q 3.4
82
INSTRUCTIONS TO INVESTIGATORS
The 'Year' in the Registration section is to record the year of the register from which the respondent was selected.
Below poverty line refers to the Government List (e.g. "Green Card Holder", etc.) maintained by the Panchayat.
Reside means those normally resident, and includes those temporarily absent.
Establish the main source, subsidiary sources are not necessary nor is any quantitative estimate. It should also be made clear to the respondent that he should reply in terms of ! normal year.
QUESTIONS ON FARM SIZE AND LIVESTOCK HOLDING COULD BE ASKED AT THE END OF THE INTERVIEW IF THIS INFORMATION IS THOUGHT TO BE SENSITIVE AND LIKELY TO CAUSE ANXIETY TO THE RESPONDENT.
Include 'land normally cultivated but temporarily fallow. Only land for which the respondent is personally responsible or over which he has some authority should be included. Operated land is land farmed and, of course, can be greater than the land owned.
Be sure to include all land that the farmer could irrigate with present sources irrespective of the source of the irrigation water. The fact that a canal is temporarily dry or a tubewe11 not working should be disregarded.
Exclude land 'rented in' from close kin, e.g., father or brother.

83
FARM FORESTRY QUESTIONNAIRE
1.0 REGISTRATION
Date of Interview -----------------------Name of Surveyor __________________ _ Questionnaire Serial Number ____________ _
1.1 Nursery Register Year _________ _
1.2 Zone/Circle __________________________ _ 1.3 District/Forest Division _____________ _ 1.4 Ta1uka/Range ____________ -:--______ _ 1.5 Name of Nursery ___________ Serial No. 1. 6 Name of Village _________________ _ 1.7 Farmer's Name ---------------:---------:----1.8 Respondent's Name _____ ~ Respondent's sex
(1) Male (2) Female 1.9 Type of Farmer __ -:--___ ~--_:__-------~-
(1) Below poverty line (2) Above poverty line 1.10 Category of farmer: (1) Scheduled Caste ___ _
(2) Scheduled Tribe ------(3) Other -------------
2.0 ~HO~U~S=EH~O~L=D _SI_Z_E __ AN __ D OCCUPATION
2.1 How many people reside in your household? __
2.2 What is your family's primary source of income?
(2) Dairying (1) Farming,-__ (3) Ag. 1abor-:--_ (4) Skilled lab.
(4) Unskilled labor (5) Govt. emp1oyment_
(6) Business ----- (7) Other (Specify) ___ __
3.0 FARM SIZE AND LIVESTOCK HOLDING
3.1 How much land do you own? ha ----IF ANSWER TO 3.1 IS NONE GO TO Q.3.5
3.2 How much land are you cultivating at present? Operated land ha
3.3 How much of your cultivated land is irrigab1e? Irrigab1e land ha
3.4 How much of your cultivated land is rented in? Land rented in ha
Value or Code
Variable Name
** FILE 1 REG.DAT **
_1_1 FARNUM
LI_LI YEAR
LI ZONE LLI DISTRICT
I_LLI RANGE I_LLI NURSERY
LI_I SEX
LI_I FARMTYPE
L 1 FARMGROUP
LI_I HHPOP
I_I OCCUP
1_1_1 ·1_1 OWNLAND
LLI . LI OPERLAND
LLI· LI RENTIN

Q 3.5
Q 4.0
Q 4.2
Q 4.3
Q 4.4
Q 4.6
84
INSTRUCTIONS TO INVESTIGATORS
Include livestock that he manages for others as well as those that he owns.
The blank spaces in this question should be completed at the time you select the household from the register at the nursery.
To code the species in this question USE THE STATE MASTER CODE FOR TREE SPECIES. List only the four main species grown and include the remainder under 'All others'.
Treat this question with care. Payment should be understood to mean every payment dire'ctly related to the acquisition of the seedlings.
Find out how the farmer moved the seedlings from the nursery to his home or whether another villager collected the seedlings for himself and the farmer.
Thil que.tion could alao be phra.ed: "What do you intend to do with the tree. when they mature?" Do not prompt the respondent.

IS
3.5 How many livestock do you maintain?
3.5.1 Buffalo ----3.5.2 Cattle 3.5.3 Goats/Sheep __ 3.5.4 Others ----
4.0 SEEDLING ACQUISITION
4.1 According to departmental records, you obtained some seedlings from the nursery at ____ _ in the year Is this correct? ___ _
(1) Yes (2) No
IF ANSYER TO Q 4.1 IS YES GO TO Q 4.2 IF ANSYER TO Q 4.1 IS NO END INTERVIEW
Page ~ .Value Variable
or Code Name
LLI BUFF LLI CATTLE LLI GSHEEP LLI OTHLIV
I_I CONFIRM
4.2 Please tell me the names of the species of seedlings and the number of each that you obtained?
Name of Species Number ~ Code Number
All others Total
LLISP1 LLISP2 LI_ISP3 LLISP3 LLISP4 I_LISPS
4.3 How much did you pay for the seedlings?
Rs ---4.4 How far did you have to transport the seedlings
from the nursery or distribution center? ____ km
4.5 How did you transport these seedlings? ___ _
(1) Handcarried (2) Cart (3) Tractor (4) Other Villager (5) Other
4.6 Yhat was the main reason for planting these seedlings?
(1) Fue1wood ----- (2) Fodder (3) Sale (4) Ornamental_ (5) Ease of management_ (6) Other ___ _
LI_LLLI NUMSP1 LLI_I_LI NUMSP2 LLLLI_I NUMSP3 LI_LI_LI NUMSP4 I_LLI_LI NUMSPO LI_LLLI NUMALL
LLLI SEEDCOST
1_1_1.1_1 NURDIST
LI TRANSPRT
I_I WHYPLANT

Q 5.1
Q 5.2
86
INSTRUCTIONS TO INVESTIGATORS
Fallow land should be long-term or permanent fallow or wasteland. Previously cropped land should be land normally and regularly cropped even though it might have been temporarily fallow at the time of planting the seedlings.
To code the crops in this question USE THE STATE MASTER CODE FOR CROPS. All details in this question must refer only to the land planted to the trees mentioned in earlier questions. Remember that the last twelve months covers two seasons (rabi and kharif) the farmer may have grown crops in both seasons. If metric units are not used locally, record the answer in local units. Note this on the questionaire. Conversions to metric units must be done at headquarters prior to data processing. The answers to 5.2 will be approximate. Do not force the farmer to give an answer of which he is uncertain. Instead write 'don't know' clearly beside the question.
ALL QUESTIONS IN SECTIONS 6.0, 7.0, 8.0 AND 9.0 REFER TO THE SEEDLINGS OBTAINED DURING THE YEAR MENTIONED IN Q 4.1. IT IS ESSENTIAL THAT THIS BE UNDERSTOOD AND STRICTLY APPLIED.
IN SECTIONS 6.0 AND 7.0 YOU MUST FORMULATE APPROPRIATE INTRODUCTORY QUESTIONS YOURSELF. MUCH INFORMATION IS REQUIRED FROM THE RESPONDENT IN THESE SECTIONS SO TAKE YOUR TIME AND BE PATIENT WITH THE RESPONDENT. USE THE CODES AT THE BOTTOM OF THIS PAGE TO COMELETE THE QUESTIONNAIRE. SPECIES MUST BE CODED FROM THE STATE MASTER CODE FOR TREE SPECIES.
CODES FOR SECTIONS 6.0 AND 7.0 --- ---(a) Place planted: (1) Block (2) Boundaryfbund (3) Homestead area
(4) Other (5) More than one site (b) Cause of death: (01) Fire (02) Grazing (03) Health of seedling at
planting (04) Wrong species for site (05) Poor site preparation (06) Lack of weeding (07) Disease (08) Pests (09) Wildlife (10) Deliberate damage (11) Waterlogging (12) Other_~_
(c) 1IP! of protection: (1) wire fence (2) live fence (3) stove fence (4) brush fence (5) trench (6) part of group planting/protection (7) no physical protection (8) Other __ ....,--_~ __
(d) Product: (1) Building poles (2) Pulp poles (3) Fue1wood (4) Small timber (5) Fodder (6) Fruit (7) Ground grass (8) Charcoal (9) Other __ ~_~
(e) Buyer: (1) Other villagers (2) Trader (3) Forest Dept. (4) Other Gov't agency (5) Other _____ _
(f) How sold: (1) By self (2) Agent (3) Forest Dept. (4) Other Gov't agency (5) Other ________ _
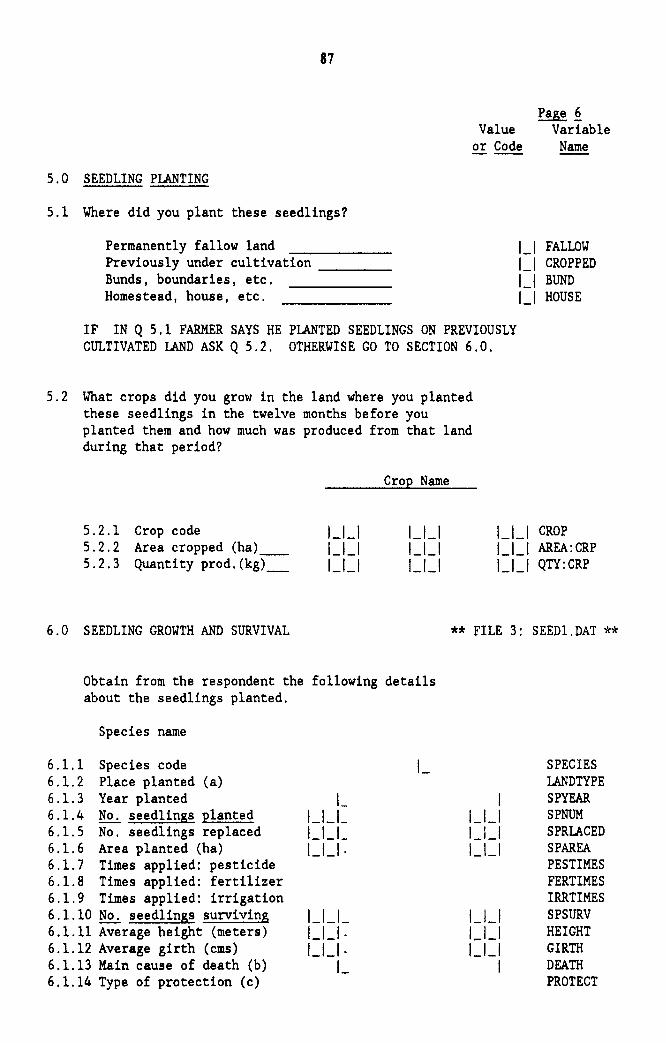
87
5.0 SEEDLING PLANTING
5.1 Where did you plant these seedlings?
Permanently fallow land Previously under cultivation ___ _ Bunds, boundaries, etc. Homestead, house, etc.
Page ~ Value Variable
or Code Name
LI FALLOW LI CROPPED LI BUND LI HOUSE
IF IN Q 5.1 FARMER SAYS HE PLANTED SEEDLINGS ON PREVIOUSLY CULTIVATED LAND ASK Q 5.2. OTHERWISE GO TO SECTION 6.0.
5.2 What crops did you grow in the land where you planted these seedlings in the twelve months before you planted them and how much was produced from that land during that period?
5.2.1 Crop code 5.2.2 Area cropped (ha) 5.2.3 Quantity prod. (kg)_
6.0 SEEDLING GROWTH AND SURVIVAL
LLI LI_I 1_1_1
Crop Name
LLI I_LI LI_I
Obtain from the respondent the following details about the seedlings planted.
Species name
6.1.1 Species code 6.1.2 Place planted (a) 6.1.3 Year planted 6.1.4 No. seedlings planted 6.1.5 No. seedlings replaced 6.1.6 Area planted (ha) 6.1.7 Times applied: pesticide 6.1.8 Times applied: fertilizer 6.1.9 Times applied: irrigation 6.1.10 No. seedlings surviving 6.1.11 Average height (meters) 6.1.12 Average girth (cms) 6.1.13 Main cause of death (b) 6.1.14 Type of protection (c)
L LLI_ LLI_ LLI·
LLL LLI· LLI·
L
LLI CROP L LI AREA: CRP LLI QTY:CRP
** FILE 3: SEED1.DAT **
I LLI LLI I_LI
I_LI LI_I LLI
I
SPECIES LANDTYPE SPYEAR SPNUM SPRLACED SPAREA PESTIMES FERTIMES IRRTIMES SPSURV HEIGHT GIRTH DEATH PROTECT

Q 7.1
Q 9.1
Q 9.2
88
INSTRUCTIONS TO INVESTIGATORS
First establish the products the farmer has obtained (e.g., poles, timber, lops and tops, grass leaves, etc.). Then obtain quantities. As supplementary questions establish whether the respondent sold the products and if so, how much was sold. For each product sold record the amount (Rs) received by the farmer, to whom he sold the product (e.g. Villagers, trader, Forest Dept., etc.) and how it was sold (i.e. did he sell it himself, through an agent or through the Forest Dept.).
This applies to the time when the respondent lifted the seedlings mentioned originally in Q 4.1.
These answers will be approximate but try to get the respondent to be as precise as possible. Use the STATE MASTER CODE FOR SPECIES.

89
7.0 HARVESTED PRODUCTS
Value or Code
Variable Name
Obtain from the respondent the following details of tree products harvested during the last twenty-four months from the trees mentioned in section 6.0 above.
Product
7.1.1 Product code (d) 7.1.2 Quantity produced (kg) 7.1.4 Quantity sold (kg) 7.1.5 Rs received from sale 7.1.6 To whom sold (e) 7.1.7 How sold (f)
LI LLLLI
I_LI_I_LI LI_LLLI
LI I_I
1_ PRODUCT 1_1_1_1_ QTYPROD
1_1_1_1_1_ QTYSOLD 1_1_1_1_1_ VALSOLD
1_ BUYER 1_ HOWSOLD
IF THE FARMER REPORTED IN SECTION 6.0 THAT HE ESTABLISHED A BLOCK PLANTATION ASK THE QUESTIONS IN SECTION 8.0. OTHERWISE GO TO SECTION 9.0.
8.0 BLOCK PLANTATION MAINTENANCE
8.1 What was your total expenditure on all inputs, such as fertilizer, insecticides or water, purchased during the last 24 months for your block plantation? Rupees
8.2 How many mandays of hired labor did you employ during the last 24 months for your block plantation~ mandays
8.3 How many mandays of household labor were used for your block plantation during the last 24 months mandays
9.0 SPECIES AVAILABILITY AND EXTENSION SERVICES
9.1 When you obtained your seedlings from the nursery were all the species you wanted available in the numbers required? ____ __
(1) Yes (2) No
** FILES: MAIN.DAT **
1_1_1_1 INPUT
LLLI LABHIRE
LI_LI LABSELF
** FILE6: EXTEN.DAT **
LI SPAVAIL
IF ANSWER TO Q 9.1 IS NO, ASK Q 9.2 OTHERWISE ASK Q 9.3
9.2 Which species did'nt you get and how many did you want?
9.2.1 First species name ______ _ . 9.2.2 Firs t species number _________ _ 9.2.3 Second species name _____ _ 9. 2 . 4 Second species number _______ __
I_I DESSPl 1_1_1_1_1 DESQTY1
I_I DESSPl 1_1_1_1_1 DESQTY2

Q 9.4
Q 9.5
Q 10.1
Q 10.2
90
INSTRUCTIONS TO INVESTIGATORS
Listen to what the farmer tells you and identify his answers according to the categories in the question. If the farmer does not mention a subject record this as 'No'.
You should explain that 'workers' means persons such as the DFO, RFO, FEW, Motivator and VEW.
Do not read the list to the respondent, or prompt him in any way.
Take care not to bias the respondent in his answer.

91
Value or Code
Variable Name
9.3 Did you receive advice at the nursery on how to plant and care for trees when you obtained the seed1ings? ___
(1) Yes (2) No
IF ANSWER TO Q 9.3 IS YES ASK Q 9.4 IF NO GO TO Q 9.5
9.4 Please tell me what you were advised? (1) Yes (tick)
9.4.1 Choice of species 9.4.2 Pit preparation 9.4.3 Fertilizer treatment 9.4.4 Distance between plants 9.4.5 Irrigation/watering 9.4.6 Pest control 9.4.7 Weeding 9.4.8 Other (Specify) ___ _
(2) No (tick)
9.5 Since planting, have you received any advice from workers in the Forest Department or any other organisation on tree husbandry? If so, how often?
9.5.1 Forest Department 9.5.2 Agriculture Department 9.5.3 Other Govt. Department 9.5.4 Non-Govt. Organization
Yes (tick)
No. of times
10.0 FUEL AND FODDER SOURCES AND PLANTING INTENTIONS
10.1 What are your main sources of fodder? Main source: (1) Yes
(tick) 10.1.1 Common grazing/grass lands 10.l. 2 Purchased grass 10.1. 3 Crop residues 10.1.4 Purchased cattle feed 10.1.5 Other (Specify)
(2) No (tick)
10.2 What are your main sources of fuel for burning? Main source: (1) Yes (2) No
10.2.1 Forest lands 10.2.2 Own trees 10.2.3 Crop residues 10.2.4 Roadside vegetation 10.2.5 Dung cakes 10.2.6 Purchased wood 10.2.7 Other
(tick) (tick)
LI ADVICE
SPCHOICE PITTING FERTILIZ SPACING WATERING PESTS WEEDING OTHERADV
LLI FORDEPT LI_I AGDEPT 1_1_1 OTHODEPT LI_I NGO
LI I_I LI LI I_I
COMMONS PURGRAS CROPRES PURFEED OTHFEED
FORFUEL PUTFUEL CROPFUEL ROAD FUEL DUNG FUEL PURFUEL OTHFUEL

92
INSTRUCTIONS TO INVESTIGATORS
Q 10.4 Record only the first three species that the farmer says he wants, Use the STATE MASTER CODE FOR SPECIES.
Q 10.5 Note only the first two reasons the farmer gives. Do not prompt the farmer or read the list of possible answers to him.
AT THE END OF THE INTERVIEW WRITE AND SIGN YOUR NAME IN THE SPACES PROVIDED.

93
Value or Code
Variable Name
10.3 Do you intend to plant more trees next year? __ _ (1) Yes (2) No (3) Undecided
IF ANSWER TO Q 10.3 IS YES, ASK Q 10.4 IF NO OR UNDECIDED GO TO Q 10.5.
10.4 Which species do you intend to plant and how many?
10.4.1 First species name ______ _ 10.4.2 First species number ______ _ 10.4.3 Second species name 10.4.4 Second species number ------10.4.5 Third species name 10.4.6 Third species number _____ _
10.5 What are your main reasons for not planting trees next year?
(note first two reasons only)
Reason -----Reason
(1) Have enough (2) No more land (3) Poor growth (4) Easily damaged
-----
(5) Not economical (6) Prefer other crop (7) Other (Specify) _____ _
I_I NEXTYR
I_I SPDESA LLLLI DESANUM
LI SPDESB LLLLI DESBNUM
LI SPDESC LLLLI DESCNUM
I_I NOTREE1 LI NOTREE2
Interviewer Name: Signature: I I I INTERV
* * * END OF INTERVIEW * * *

94
3. Initial Tabulation of the Results
Tables are the product of data analysis. While there are several stages between designing a sample and a Questionnaire and producing analytical results a discussion of these aspects is, in the interests of showing what can and should be initially produced from the data collected in the sample survey, postponed until Chapter IX.
There are two basic mechanisms for processing data collected in the survey: manual (using simple desk top calculators) and computerized. Prevailing conditions in most projects require that manual methods be used although computerized processing is likely to be introduced in the very near future. The method used exerts a strong influence over the extent and nature of the resulting analysis. Under manual conditions, the preparation of two or three way cross-tabulations are demanding and represent the feasible limit to data manipulation. The calculation of standard deviations and other statistical properties, although time consuming, can be done with relatively simple desk-top calculators. Accordingly, all the suggested tabulations set out at the end of this chapter can be easily produced with the aid of such machines. If computers are used, however, the range and depth of analysis can be greatly expanded (see Chapter IX). Even then, however, it will still be essential to produce the initial tabulations.
The remainder of this chapter is devoted to depicting the initial tabulations that should be produced. Each table is presented on a separate page. Short notes accompany each table which identify the sources (questions) of the data in the Questionnaire, briefly describe the purpose of the tabulation and suggest interpretative possibilities. The suggested tabulations are not exhaustive but instead focus on the key values and relationships that can and should be obtained from the answers to the Questions that have been posed. A little thought and experiment will soon reveal other tabulations which might be desirable in the circumstances of a particular State.
The tables are set out as if data about trees up to ten years old is available. In practice this is unlikely, unless the State has a long established social forestry program. Hence, in most situations the number of years (columns in the tables) for which data are reported will be less than those shown.
In the proforma tables no distinction is drawn between zones and the state as a whole. Each table should. however. be prepared jor each zone as well as jor the entire state. Comparisons between zones should be drawn, during the writing of all reports, in a manner which will be instructive for management. All quantity and area values should be denominated in metric measures. When data are recorded in the field in units of measurement other than metric units, extreme caution should be exercised in undertaking the conversion calculations.

95
Table FFl: CHARACTERISTICS OF FAMILIES LIFTING SEEDLINGS FROM NURSERIES
Year In Which Trees Planted A.I
Characteristic 1 2 3 4 5 6 7 8 9 10 All
Main Source of Income
a) Farming (%) b) Dairying (%) c) labouring (%) d) Skilled
activity (%) e) Government
employment (%) -f) Business g) Other (%)
Landless (%) Family Size Total Sample Size (N) -
A.I These age groups should correspond to the age strata in a zone. There should be as many or as few age groups as the data demand. It may be appropriate to group trees over, say, 5 years into two year age groups e.g. 6 and 7 year old trees, 8 and 9 year old trees, etc.
NOTES
1. Data for this Table are to be taken from Q's 2.1, 2.2 and 3.1 of the Farm Forestry Questionnaire (FFQ).
2. The purpose of this Table is to provide an indication of whether the characteristics of families lifting trees change over time. If, for example, there is a preponderance of families where the main source of income is not agriculture then it may suggest bias in the seedling distribution program or that households without outside income are not well placed to adopt tree planting. If a large proportion of families mainly dependent on dairying are lifting seedlings this may reflect an appreciation of the value of trees for fodder purposes. If families where members are officials of village organizations are over-represented then it may suggest that the program is failing to reach a wide audience and benefits are being undesirably restricted. Similar conclusions may be drawn if the landless are under-represented.
3. In the text describing this Table, comparisons with data from other sources (e.g., census data) should be made to esta blish the ex ten t to which the data reported are or are not representative. It will probably be necessary to make formal tests of statistical significance to establish whether the observed differences are real or apparent.

96
Table FF1: DISTRIBUTION OF FARMERS BY FARM SIZE (OPERATED AREA)
Year In Which Trees Planted
Operated Area (ha) 11 J 2 3 4 5 6 7 8 9 10 All
0.1 - 1.9 (lib) hi 2.0 - 4.9 (lib) 5.0 Plus (%)
No. of Farmers (N)
11 The class intervals should be adjusted to suit local conditions. hi Percentages are the proportions calculated using the total number of
farmers (operators) as the base.
NOTES
1. These data are derived from the responses to Q 3.2 in the FFQ.
2. This Table is designed to show whether larger or smaller farmers (based on their operated area) tend to predominate amongst those obtaining seedlings. If the distribution is well balanced throughout the period covered by the Table, or if the trend is clearly towards a balanced (equitable) pattern then there should be no cause for alarm. If, however, the data show that large farmers predominate it may be suspected that there are operational problems that need attention in order to redress the balance.
3. The holding size classes in this Table (and in Tables FFS and FF7) are illustrative. States differ in their classifications of "landless, "small," "marginal," "medium," and "large"land holdings. The relevant State classification should be used so that the data reported are consistent with those from other sources. The size of the class intervals should, however, always be shown in the table.

97
Table FF3: PREVALENCE OF IRRIGATION AND TENANCY
Year In Which Trees Planted
Operated Area 1 2 3 4 5 6 7 8 9 10 All
Farmers with some irrigated land (%) i/ -
A verage area irrigated (ha) 121
Pure owners (%)
Pure tenants (%)
Partial tenants (%)
Average area rented in (ha)k.1
11 As a percent of all landholders in the relevant tree age group. 121 Only for those with irrigated land. £! Only for those who rent in land.
NOTES
1. These data are derived from Q's 3.2, 3.3 and 3.4 in the FFQ.
2. These data will allow judgements to be made about whether seedlings are being lifted, more than or less than proportionately (in comparison with the general population) by farmers who have irrigated land or who are full or partial tenants. Again, it is the trend that matters, whether it is stable or moving in favour of or against any of these categories.

98
Table FF4: OWNERSHIP OF LIVESTOCK
Year In Which Trees Planted
J 2 3 4 5 6 7 8 9 10 All
Percent of households with: II
Buffalo Cattle Goats/Sheep Any livestock
A verage No. of livestock units per household !21
Sample Size (N)
ill These percentages should be the proportion of all families owning the relevant type of livestock.
!21 A suitable set of coefficients for the different classes of livestock should be used to arrive at the number of livestock units. The average should be calculated only for households having some livestock.
NOTES
1. Q 3.5 in the FFQ provides the data for this table.
2. The purpose of 'this Table is to assess whether the proportion of families with livestock is increasing over time and whether the average number of livestock units per family is increasing or decreasing. Increasing trends may suggest a growing dependence on trees for fodder and would provide some justification for making available tree species well suited to animals. These results should be compared to Table FF27 concerning fodder sources.
3. In this Table, as in many others, the apparent trends over time should not be overemphasized. This is because the characteristics that may be changing may do so under the influence of exogenous forces quite unrelated to social forestry (e.g. the average number of livestock units per household may be falling due to a series of droughts). Moreover, as is implied above, the direction of causality may not be clear (e.g more trees may produce more fodder for ca ttle, but equally more ca ttte may require more trees).

99
Table FFS: AVERAGE NUMBER OF SEEDLINGS OBTAINED
Year In Which Trees Planted
Operated Area (ha) 1 2 3 4 5 6 7 8 9 10 All
0.1 • 1.9 • 'a/ -
2.0 • 4.9
5.0 plus
Landless
'a/ Entries in the table are the average number of seedlings lifted by farmers in the appropriate size class and tree age group.
NOTES
1. These data come from the responses to Q 4.2 in the FFQ.
2. This Table is designed to reveal whether households are taking quantities of seedlings that are reasonable in relation to their landholding. If, for example, very small farmers or the landless are taking large numbers it may suggest that they are not using them fully or are passing them on to others.
3. See also note 3 to Table FF2.

100
Table FF6: PERCENT SPECIES COMPOSITION OF SEEDLINGS
Year In Which Trees Planted
Species 1 2 3 4 5 6 7 8 9 10 All
Eucalyptus (%) . if . Neem (%) Sheesham (%) Babul (%)
(%) j%) j%)
Other hi (%)
if The entries in the table should be the percent of the species m the relevant tree age group.
hi The main species included in "other" should be listed in a footnote to the table.
NOTES
1. These data are calculated from the responses to Q 4.2 of the FFQ.
2. One purpose is to assess whether the species composition of seedlings lifted, as reported by farmers, is broadly consistent with the aggregate statistics compiled from annual nursery returns. Minor discrepancies can be ignored but if there are major differences then this may reflect inaccurate nursery records or poor knowledge of their trees on the part of farmers. In either case further investigat'ion would be warranted. Another purpose is to establish whether the species composition is changing with time.
3. Species individually accounting for less than 5% of the total should be grouped together under "other".
4. The species noted in the Table above are illustrative only and should be changed to reflect the actual situation revealed by the survey data.

101
Table FF7: PERCENT OF FARMERS WHO PAID FOR SOME OR ALL SEEDLINGS
Year In Which Trees Planted
Operated Farm Area (ha) 1 2 3 4 5 6 7 8 9 10 All
Landless
0.0 - 1.9
2.0 • 4.9
5.0 plus
Average expenditure per seedling (Paise) hi -
'iii Entries in the table are the percentages (proportions) of farmers in the appropriate size class and tree age group.
hi This should be calculated by dividing the Rupee expenditure reported in Q 4.3 by the number of seedlings obtained (Q 4.2). If the state has a policy of distributing free seedlings to some households, or an initial number are always given free, after which payment must be made, appropriate adjustments to the calculation should be made. These adjustments should be reported in a footnote to the Table.
NOTES
I. These data are obtained from the response to Q 4.3 together with those from Q 3.2 in the FFQ.
2. The purpose is to establish whether farmers are paying or not paying in accordance with State policy or to reveal whether farmers are being improperly required to pay for seedlings.
3. See note 3 to Table FF2.
4. A similar Table showing the percentage of farmers who received free seedlings should also be prepared.
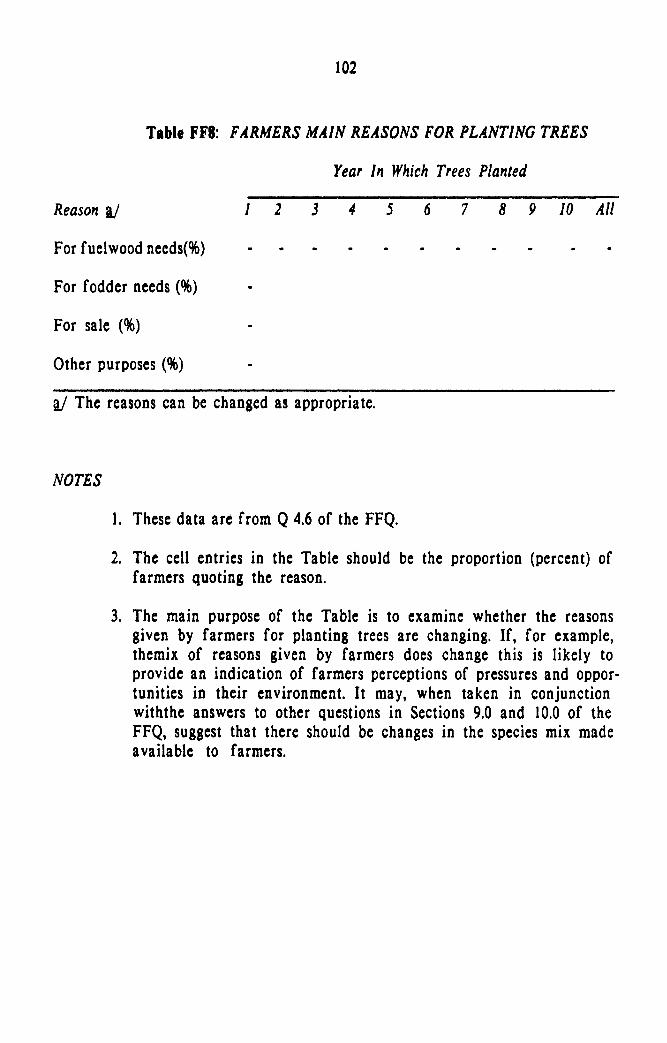
102
Table FF8: FARMERS MAIN REASONS FOR PLANTING TREES
Year In Which Trees Planted
Reason aJ 1 2 3 4 5 6 7 8 9 10 All
For fuel wood needs{%)
For fodder needs (%)
For sale (%)
Other purposes (%)
if The reasons can be changed as appropriate.
NOTES
1. These data are from Q 4.6 of the FFQ.
2. The cell entries in the Table should be the proportion (percent) of farmers quoting the reason.
3. The main purpose of the Table is to examine whether the reasons given by farmers for planting trees are changing. If, for example, themix of reasons given by farmers does change this is likely to provide an indication of farmers perceptions of pressures and opportunities in their environment. It may, when taken in conjunction withthe answers to other questions in Sections 9.0 and 10.0 of the FFQ, suggest that there should be changes in the species mix made available to farmers.

103
Table FF9: LOCATION OF PLANTED SEEDLINGS
Year In Which Trees Planted Percentage of Farmers Planting in: 1 2 j 4 5 6 789
Previously fallow land • J/ .
Previously cropped land
Bunds, boundaries, etc.
Homestead, houselot, etc.
10 All
11 The entries in the Table are percentages of all farmers in each tree age group planting seedlings in the relevant location. Some farmers may have planted in more than one location and they will, therefore, enter the calculations more than once. Hence, the percentages in the columns may not add to one hundred. This should be made clear in a footnote to the table.
NOTES
1. These data are derived from the responses to Q S.l of the FFQ.
2. The main purpose of this Table is to examine whether an increasing proportion of farmers are planting on arable or potentially arable land in comparison with those planting on their houselots or boundaries. A lack of boundary or houselot planting may suggest that a greater extension effort is required.

104
Table FFIO: CROPS DISPLACED BY FARMERS PLANTING TREES ON PREVIOUSLY CULTIVATED LAND
Crop Displaced
Crop:
Number of farmers reporting (N)
1
Percent of Farmers Ii -A verage area l2/ displaced (ha)
Average yield l2/ foregone (kg/ha)
Crop: _____ _
Number of farmers reporting (N)
Percent of Farmers Ii -A verage area displaced (ha) l2/
A verage yield foregone (kg/ha) l2/
Fallow Land
Number of farmers reporting (N)
Percent of Farmers Ii -A verage area of pre
viously fallow (ha) l2/ -
Year In Which Trees Planted
2 3 5 6 7 8 9 10 All
Ii Percentages should be calculated for the relevant tree age group using as the base the total number of households in the sample who have an operational landholding (Q 3.2).
l2/ Averages only for those reporting under the relevent crop.
NOTES I. These data are derived from Q's 5.1 and 5.2 of the FFQ.
2. The Table should include responses only from farmers who have planted seedlings which displaced crops. Although the last two lines of the table deal with farmers who have used previously fallow land.
3. The purpose of the Table is to establish which crops are being displaced and/or whether permanently fallow land is being progressively given over to trees. If the number of farmers reporting remains small it is probable that this phenomenon is confined to the larger farmers. If, however, it is widespread then all classes of farmers are involved and this would warrant more detailed investigation of the data in order to assess the likely consequences.
4. By appropriately valuing the production foregone an indication of the opportunity cost of tree growing can be obtained.

lOS
Table FFll: RAINFED: CHARACTERISTICS OF TREES PLANTED
Year In Which Trees Planted
Species 1 2 3 4 5 6 7 8 9 10 AU
Number of farmers reporting
A verage area planted (ha)
A verage number of seedlings planted per hectare
Farmers using pesticides: Percent applying (%) Average number of times a/
Farmers using fertilizers: Percent applying (%) Average number of times a/
Farmers who replanted (%)
Seedlings surviving (%)
A verage height (meters)
Average girth at BH (ems)
aJ Only among those applying.
NOTES 1. This Table is derived from the answers to Q 6.1 of the FFQ. A similar table should be prepared for each of the two or three most frequently reported species.
2. Similar sets of tables should be prepared separately for plantings on irrigated land and on boundaries etc.). Where the table is repeated to report boundary, bund or row planting substitute "number of trees" for "area planted" and omit "number of seedlings per hectare".
3. The purposeof these tables is to provide a synopsis of the main characteristics affecting productivity, and the extent to which they are changing over time. Suitable coefficients developed from research results or special studies can be used to provide estimates of production.
4. If the results indicate poor survival rates, inadequate pesticide or fertilizer treatments and/or low growth the results from these tables should be examined carefully to assess how farmers can be helped to improve their tree husbandry. Reference should be made to Ta bles FF2S and FF26.
S. These tables are basic initial tabulations. Once produced the information may point to many other desirable cross-tabulations or to the main variables that should be used in a regression analysis of seedling survival and Irowth.

106
Table FF12: PERCENT SEEDLING SURYIY AL BY SPECIES AND YEAR OF PLANTING
Age of Trees in Years
Species i/ 1 2 J 4 5 6 7 8 9 10 AU
i/ All principal species should be reported.
NOTES
I. This Table is derived from the answers to Q 6.1 of the FFQ.
2. The purpose is to highlight the results of the surveyfor the most important characteristic studied.
3. Interpretation, however, should be based not on these figures alone but on simultaneous study of the details in Table FFI2.
4. Separate tables should be prepared showing the main causes of mortality for any species where the survival rate is below sa y, 80 percen t.

107
Table FF1J: PERCENT SEEDLING SURVIVAL BY METHOD OF PROTECTION
Method 0/ Protection
Man-Made Fence Live Fence Trench Group None
Age 0/ Trees in Years
1 2 j 4 5 6 or more All
- i/ -
i/ Entries are the average survival percentages for the types of protection named and the age group of the trees. These may be calculatedas the average of the survival rates reported by each respondent or, and more accurately, the weighted survival rate for all seedlings in the sample.
NOTES
1. The data for this Table are derived from the answers to the several elements of Q 6.1 in the FFQ.
2. If desired the Table could be reported according to species.
3. The purpose of the Table is obvious and should allow inferences to be drawn about the effectiveness of different methods of seedling protection compared to no protection at all.
4. The grouping together of all trees over 6 years is arbitrary and should be adjusted to suit local needs.

I.
2.
3.
108
TableFF14: AVERAGE SEEDLING SURVIVAL RATES( PERCENT) BY FARMER CHARACTERISTIC AND MAIN SOURCE OF INCOME
Age of Trees in Years
Characteristic I 2 3 4 5 6 or more AI/
Below Poverty Line -i/ Above Poverty Line Scheduled Caste/Tribe Not SC or ST.
Main Source of Income
Farming Dairying Labouring hi All Others
AI/ Farmers r;)
i/ Entries are the average survival percentages (irrespective of species) corresponding to each element (row) in the table and the relevant tree age group. These may be calculated as the average of the survival rates reported by each respondent or, and more accurately, the weighted survival rates for all seedlings corresponding to the entry.
hi Includes both agricultural and unskilled labouring.
r;) The overall survival rate (irrespective of species) for all farmers in the sample according to the age of the trees. See also i/ above.
NOTES
1. The data for this Table are derived from the several elements of Q 6.1 and Qs 1.9, 1.1 0 and 2.2 in the FFQ.
2. The sources of income shown in the Table are arbitrary and should be changed to reflect local conditions. There should not be more than three or four groups as the sample sizes are not large enough to allow ex tensi ve disaggregation.
3. The purpose of this Table is to establish whether there are any apparent relationships between seedling survival and selected socioeconomic characteristics of farmers. If such relationships exist they are likely to be consistent over time. Hence, the pattern according to the age of the trees may be more important than the figures for anyone tree age group. Consistently low or high survival rates for anyone group or characteristic would suggest that further analysis is necessary in order to identify causality. Poor survival for poor and underprivileged households may suggest the need for more extension advice or other kinds of assistance.
4. See also note 4 to Table FF 13.

109
Table FF1S: AVERAGE SEEDLING SURVIVAL RATES (PERCENT) BY FARM SIZE TENANCY, AND LIVESTOCK HOLDING
1. Operated Farm Size II
Landless Small and Marginal Large
2. Tenancy r;}
Pure Tenant Part Tenant Pure Owner
3. Livestock Holding slI
None 1-2 Livestock Units 3-5 Livestock Units 6 or more Livestock Units
4. All Farmers ~
Age 0/ Trees in Years
1 2 3 4 5 6 or more All
-hi
a/ The categories for farm size should be defined according to the standard State classification. The size of the class intervals (in hectares) should always be stated.
12.1 Entries are the average survival percentages (irrespective of species) corresponding to each element (row) in the table and the relevant tree age group. These may be calculated as the average of the survival rates reported by each respondent or, and more accurately, the weighted survival rates for· all seedlings corresponding to the entry.
r;} Pure tenants and pure owners rent all their land and no land respectively. Part tenants own some land and rent some land.
slI Actual holdings of livestock should be converted to livestock units using standard conversion factors. Those used should be stated in a footnote to the table.
~ See footnote r;} to Ta ble FF 14.
NOTES 1. The data for this Table are derived from the several elements of
Q6.1 and section 3.0 of the FFQ.
2. The breakdown of livestock holdings is arbitrary and should be modified to suit prevailing conditions. See also note 2 to Table FFI4.
3. The purpose of this Table is similar to FFI4. If, for example, survival rates are consistently higher for owners than tenants, this would suggest that tenancy has a negative effect on seedling survival.
4. See also note 4 to Table FF13.

1.
2.
3.
4.
110
Table FF16: AVERAGE SEEDLING SURVIVAL RATES (PERCENT) BY SEEDLINGS ACQUIRED, PAYMENT FOR SEEDLINGS
AND REASONS FOR PLANTING
Age oj Trees in Years
No. Seedlings Acquired 1 2 3 " 5 6 or more
less than 100 -aJ 101 - 500 501 - 2000 more than 200 I
Payment
All Free All or some purchased
Reason Jor planting
For Domestic Fuelwood For Sale For Fodder Other Reason
All Farmers hi
All
if Entries are the average survival percentages (irrespective of species) corresponding to each element (row) in the table and the relevant tree age group. These may be calculated as the average of the survival rates reported by each respondent or, and more accurately, the weighted survival rates for all seedlings corresponding to the entry.
hi See footnote ~ to Table FF14.
NOTES
1. The data for this Table are derived from the several elements of Q6.1 and Qs 4.2, 4.3 and 4.6 of the FFQ.
2. The class intervals for seedlings acquired are arbitrary andshould be modified to suit prevailing conditions. Similar remarks apply to the reasons for planting. See also note 2 to Table FF14.
3. The purpose of this Table is similar to FFI4 and FFI6. For example, survival rates may differ according to whether the farmer did or did not pay for all or some of his seedlings, or planted only a few as opposed to many. If such relationships are apparent more detailed analysis should be undertaken to derive operational implications.
4. See also note 4 to Table FF13.

III
Table FFI7: AVERAGE SEEDLING SURVIVAL RATES (PERCENT) BY PLACE OF PLANTING AND EXTENSION ADVICE
1. Place of Planting
Block Boundary/Bund Homestead Area Other
2. Extension Advice
a) Advice at Nursery Yes No
b) Post Planting Advice Yes No
3. All Farmers .b./
Age of Trees in Years
1 2 3 4 5 6 or more All
'a/ Entries are the average survival percentages (irrespective of species) corresponding to each element (row) in the table and the relevant tree age group. These may be calculated as the average of the survival rates reported by each respondent or, and more accurately, the weighted survival rates for all seedlings corresponding to the entry .
.b./ See footnote ~ in Table FFI4.
NOTES
1. The data for this Table are derived from the several elements of Q6.1 and Qs 9.3 and 9.5 in the FFQ. Any positive answer to Q 9.5 should be counted as IIYes" for post planting advice.
2. The purpose of this Table is similar to FF 14, IS, 16. Hence, the notes to those tables also apply to this one.
3. In this Table and in many others (e.g. FFI4, IS, 16) the entries in the Table should always be interpreted in relation to the final column All and the values for All Farmers. This will often require tests for statistically significant differences between the values in the rows compared to the last column and the bottom row. Similarly, to establish whether there are differences in survival rates between no advice and some post planting advice in this Table formal significance tests will be necessary.

112
Table FF18: PERCENT SEEDLING SURVIVAL BY DISTANCE TRANSPORTED
Distance Transported aJ Seedlings one year after planting
Less than 2 km 2 - 4 km 4 • 6 km 6 - 8 km 8 • 10 km more than 10 km
11 Distance categories can be varied as appropriate.
NOTES
1. Based on the answers to Q 4.4 of the FFQ.
2. The entries in the Table are the survival percentages irrespective of species, and are to be calculated initially only for seedlings less than one year old. If the results reveal a significant pattern then the Table should be extended to include . older trees.
3. If distance is shown to have a noticeable affect on survival this will offer guidance on how close together nurseries or distribution points should be.

113
Table FF19: PERCENT SEEDLING SURVIVAL BY MODE OF TRANSPORT
Mode 0/ Transport Di
Hand Carried
Bullock Cart
Tractor /Trailer
Collected by Others
Other
FROM NURSERY .
Seedlings one year after planting
No. Households reporting (N)
aJ Percentages should be calculated on the basis of the number of households reporting (N).
NOTES
I. Based on the answers to Q's 4.5 and 6.1 of the FFQ.
2. The entries in the Table are the survival percentages irrespective of species. As in Table FFI8 this will involve calculating separate survival rates for each sub-group (users of particular modes of transport) in the sample.
3. The Table depicted above is only for households who provide data on seedlings planted about one year ago or less. It may, however, be valuable to include responses for older trees (as in many other tables). This cannot be established beforehand and some initial tabulations will be necessary to establish whether such results are worth reporting.
4. The Table will help establish whether survival is affected by method of transport. It may, of course, be time in transit that is more important than mode.

114
Table FF20: MAIN CAUSES OF SEEDLING MORTALITY
Age 0/ Trees in Years
1 2 3 4 5 6 or more All Proportion 0/ Farmers Citing:
a) Fire -Ai b) Grazing c) Seedling Quality d) Incorrect Species e) Poor Site Preparation f) Inadequate Maintenance g) Deliberate Damage h) Other Ca uses
3./ The values in the Table are the proportion (percent) of farmers citing a given cause of mortality. These causes could be weighted by the mortality rates - the inverse of the survival rate.
NOTES
1. These data are to be taken from Q 6.1.13 in the FFQ.
2. One purpose of this Table would be to establish whether causes that are controllable (by farmers) are declining in importance. If so, this may indicate that farmers are taking greater care of their trees.

liS
Table FFll: PRODUCTION OF TREE PRODUCTS BY AGE OF TREES
Product ________ _
Production and Sales ( last 24 months)
1
A verage Quantity Produced aJ -A verage Quantity Sold aJ A verage Receipts (Rs) lJ A verage Price Received (Rs)lJ -
2 3
3.1 The averages are per reporting household.
NOTES
Age 0/ Trees in Years
4 5 6 7 8 9 10 All
I. This Table is constructed from data in Q 7.1 of the FFQ.
2. It will be helpful to add a line to the table expressing the "No. of Households Reporting" each element as a proportion of all households in each tree age group in the sample.
3. The objective of the Table is to provide an indication of when households begin to obtain tree products, average levels of output, the proportion sold and prices received. Such data will help in the determination of the benefits being derived from the social forestry program.
4. A separate Table should be constructed for each main product together with another Table reporting the average total income per household based on the Quantity produced and the observed sales prices. The latter should be taken from the appropriate round of the six monthly forest products price survey.
5. This Table provides only a broad indication of output. More detailed studies will be necessary to construct a true input-output picture of farm forestry.

116
Table F'22: AVERAGE ANNUAL EXPENDITURE PER HECTARE ON PURCHASED INPUTS FOR MAINTENANCE OF BLOCK PLANTATIONS
Age 0/ Trees in Years
Annual Expenditure J 2 3 4 5 6 7 8 9 10 All
No, farmers reporting • • •• •••••• Averaae expenditure • Ii· · · · · · · · · ·
Ii Entries for expenditure in the table should be expressed on a Rupees per hectare basis calculated only for the farmers reporting some expenditure.
NOTES
1. Data are derived from Q's 8.1 and 6.1 of the FFQ.
2. The purpose of the Table is obviously to provide estimates of farmers outlays on growing trees and should be studied in con· junction with Table FF23 which deals with labour inputs.
3. The Table provides only a rough indication of inputs. The data should be annualized by dividing the responses in the questionnaire by two. To obtain more detailed and reliable data with which to estimate I production function for example more detailed and more limited studies will be necessary, They will also have to be carried out over a period of several years,

117
Table FF13: ANNUAL AVERAGE LABOUR INPUTS PER HECTARE FOR BLOCK PLANTAT10NS
Age 0/ Trees in Years
Labour Inputs 1 2 3 4 5 6 7 8 9 10 All
Family Labour Hired Labour Total Labour
-ll -
11 Labour inputs should be expressed in mandays per hectare and be based only on the responses of those reporting labour use. This may vary according to the category of labour.
NOTES
1. The information should be taken from the responses to Q's 8.2 and 8.3 of the FFQ.
2. The number reporting each category of labour use should also be included in the Table.
3. The purpose of the Table is to examine the changing uses of labour as trees age and the extent to which labor is hired for any or all operations. As in Table FF22 the data should be annualized.
4. A rough indication of cost could be obtained by multiplying by the average daily wage rate.
5. See also notes to Tables FF22 and FF23.

118
Table FF24: AVAILABILITY OF SPECIES AT NURSERY
Farmers No Percent
Farmers reporting that all species required were available
No of farmers requesting the following species that were not available:
Average No. Species iJ Seedlings Required
(i) _____ _ (ii) _____ _
(iii) (iv) _____ _ (v) ____ _
iJ Report all species requested.
NOTES
1. These data are from Q's 9.1 and 9.2 in the FFQ. These data refer only to farmers who took seedlings in the year prior to the survey.
2. If there is uniform satisfaction all is well. If, however, there is widespread demand for a particular species not already being provided, or being produced on only a small scale, management should be advised to take appropriate action.
3. These results should be cross-checked with those in Table FF28.

119
Table FF1S: ADVICE ON TREE HUSBANDRY PROVIDED AT NURSERY
Advice received 011:
Species choice Pit preparation Fertilizer trea tmen t Seedling spacing Watering Pest control Weeding No. of farmers reporting
Percellt of farmers 11
11 These percentages are to be calculated using the number of farmers reporting (recorded at the foot of the Table) as the base.
NOTES
1. These data come from Q's 9.3 and 9.4 of the FFQ and refer only to farmers who took seedlings last year.
2. The purpose of this Table is to show whether farmers receiving seedlings are also receiving advice on how to plant and maintain them. Low percentage responses or answer responses suggest that staff manning the nurseries are not performing their duties satisfactorily and that management should take action to improve their perf ormance.
3. By repeating this Table after every survey round a picture of improving or declining performance will be obtained. It may, however, be worthwhile to extend the Table to cover trees of different ages when the survey is conducted for the first time.

120
Table FF26: FARMERS RECEIVING TREE HUSBANDRY ADVICE AFTER PLANTING THEIR SEEDLINGS
Age 0/ Trees in Years
Proportion 0/ all farmers 1 2 3 4 5 6 7 8 9 10 All receiving advice: aJ
Number Percent
No. Percentage visited:
Once Twice Three or more times
II This is the number of farmers reporting a positive answer to Q 9.5 All subsequent values in the table are percentages of this figure.
NOTES
1. If there are sufficient positive responses to Q 9.5 of the FFQ which is the source of these data a breakdown between visits made by the Department of Forestry, the Department of Agriculture, any other Government department and non-government agencies may be helpful.
2. The objective of this Table is to show whether there is sustained follow up, in the form of advice and guidance, to farmers who have trees of different ages. If such follow up is lacking there may be a case for improving extension operations, especially if survival rates and pro4uction depicted in earlier tables are below expectations.

121
Table FF27: FARMERS MOST IMPORT A.NT SOURCES OF FODDER
A.ge 0/ Trees in Years Most Important Sources 0/ Fodder 1 2 .3 4 5 6 7 8 9 10 All
Free Grazing -J.1 -Purchased Grass Crop Residues Purchased Concentrates Own Trees Other
'.JJ Cell entries should be the percentages reported for each reason within each tree age group. Column percentages may sum to more than 100 percent as the sources are not mutually exclusive.
NOTES
1. These data are from Q 10.1 of the FFQ.
2. The interpretive possibilities of this Table are obvious. If, for example, "own trees" shows, over time, a growing percentage response then that may imply that the farm forestry program is having a positive effect.
3. An identical table dealing with sources of fuel (Q 10.2 of the FFQ) should be prod uced.
4. Caution· see also note 3 to Table FF4.

122
Table FF28: FARMERS TREE PLANTING INTENTIONS
Farmers No Percent a/
Farmers who intend to plant more trees next year
Farmers intending to plant following species:
Average No. Seedlings ~
Species a) ____ _ bl b) ___ _ c) ____ _ d) ___ _ e) ____ _
a/ Percent of all farmers in the sample. hi Calculated as percentages of those who intend to plant i.e. the number
reported in the first line of the Table. ~ The average number of seedlings should be calculated on the basis of the
number of farmers "demanding" each species.
NOTES
1. These data come from Q's 10.3 and 10.4 of the FFQ and the Table should be interpreted in relation to Table FF 8.
2. This Table should be produced after each round of survey but, in general, stands alone and does not require comparison with other years. Its purpose is to signal to management the likely level and composition of the demand for seedlings next year.
3. It is a simple matter to calculate total estimated demand for a given species. This should be done for all species and provided as a small separate "memo" to management as soon as the survey work is completed in the field and all data are assembled at headquarters.

123
Table FF19: FARMERS REASONS FOR NOT PLANTING MORE TREES
Farmers No Percent JJ
Farmers who do not intend to plant more trees next year
Reasons for not planting:
a) Have enough b) No more space (land) c) Seedlings don't grow well d) Seedlings easily damaged e) Other
JJ All percentages in the Table should be calculated using the "No." reported as the base.
NOTES
1. These data come from Q 10.5 of the FFQ.
2. This Table should be interpreted in the light of Table FF 8.
3. The Table is designed to analyze the reasons for not intending to plant. If the number of farmers who do not intend to plant trees next year is large it may suggest that the external circumstances facing farmers have changed or that there is something wrong with the program or that the program is succeeding. The reasons will suggest which of these possibilities is most likely.
4. Although a formal comparison with other years is not essential, some comparisons with the responses to this question from farmers who have older trees especially after the first round of survey may be useful.

124
Annex I. A NOTE ON ESTIMATION PROCEDURES IF DATA PROCESSING IS DONE BY HAND
This note on estimation procedures is of particular relevance if manual data processing is used and follows logically from the sample design prescribed in Chapter VI. The principles enunciated are, however, also relevant to computerized data processing.
Recall that estimates of population totals are obtained as weighted sums of the sample observations, the weights being those given in Chapter VI. Examples of such totals are the total number of trees of a given age that have survived, the number of tree-growing farmers that have a specified characteristic or that follow a specified farming practice, the time spent by farmers in maintaining their trees, and similar totals. Symbolically. if Yhil denotes the value observed for the j-th observation of the i-th sample delivery of stratum h, and Whij the corresponding weight, the estimate of the total for the whole population would be given by the expression:
Weighted Sum of a given characteristic = ~ ~ ~ Whij Yhij h i j
Usually, there will be less interest in such a total than in the ratio of two such totals. An important example is the survival rate of trees of a given age; that is the ratio of the number of surviving trees of a given age to the number of seedlings planted. Another example is the ratio of the total number of trees in the current year to the number in a previous year. Still another example is the proportion of farmers with a specified characteristic or using a specified farming practice, among farmers growing trees. Such population ratios are estimated as ratios of two estimated totals. 1/
Table 1 is an example of a worksheet that might be used in calculating such a ratio. As such it also provides clear guidelines on how to undertake many of the calculations necessary to produce the initial tabular analysis mentioned in section C of Chapter VI.
1/ Note also that such ratios play a role even when the purpose is to estimate a total. This is so when the population total being estimated by the denominator or the ratio is known from an independent source. For example. the estimated proportion of surviving trees. whose denominator. is the estimated number of original seedlings. is multiplied by the known number of original seedlings to estimate the total number of surviving trees. This estimator has a smaller sampling error than the numerator of the ratio. which also estimates the same quantity. because of the positive correlation between the numerator and the denominator of such a ratio. An estimate of this type which is likely to be of considerable interest is an estimate of the total volume of wood. possibly for the sub-population of trees of a given age. For each sample observation. the volume may be estimated by a function that relates the volume to the area of the plot and the height and diameter of the trees. This estimated plot volume then plays the role of the observation Yhij in the numerator of the ratio.

125
table I: WORKSHEET FOR ESTIMATING THE SURVIVAL RATE OF SEEDLINGS IN A STRATUM
1o. of Itrltla •• of •• of .... H ... •• of IIlilllt.d OIlNn.tio ..
I.CaCIa lUI- IuWw IIIUud •• IIIJ.acI1 ItIiUL IIlllatt tIdIL b.r.xW.lt ".~Ii •• laElilli. IIhtj ,
IIni/l nij IIntj 'nij • \1J II lin ·n IIh "n/lln hij
12,800 16 128 100 1,000 900 100,000 90,000 60 50 6,000 5,000 70 50 7,000 5,000
4 120 110 12,000 11,000 5 110 110 11,000 11,000 6 90 40 9,000 4,000 7 40 40 4,000 4,000 8 ~I! m ll.2D2 n,.
2,079 1,528 207,900 &I 152,800 W
4
12.800 16 128 16
I 2 3 4 5 6 7 I~
I 2 3
I 2 ,
110 900 200 160 189
35 75
~§g U~IZI 2,119
40 270
1,500
n •••
145 18,000 14,500 847 90,000 84,700 135 20,000 15,500 123 16 ,000 12,300 109 18,900 10,900 30 3,500 3,000 70 7,500 7,000
ZZR m~IZI ~Mgg ZZ,ggg 1,749 211,900 174,900
20 4,000 2,000 122 27,000 12,200
1,349 150,000 134,900
0.',
33.210 1.1 29,060 If 3,321,000" 2,906,00(
2,906,000 PlrcenUI' .urvinl nt. of ... dliol' • --- • 100. 17.3
3.328.000
1./)./ n.N Ir' ... .,1 .. of th. wilhU' •• , of thl D_ntor IDd dno.inator th.t .ppe.r iD Tabl. I of A.ODU II to tni. ChipUr .lId pr"ida tbe hili. for thl elleulatioD of the JacltDUt lit wt .. of vlriuc ••
£1 Thh h III • ...,1. of a CAM "ban thl Mltct •• daawn, tllr.' Ollt to hlw. be.D 'plit • .o ... t two f.,..ra oDly 0111 of "hleb w. ht.ni.wd. Tba oIlM".d Wllllll, liw'D ill parnthl.h, .1I1t i. thlt c ... be dOllbl.d.
"If It h .,pernt tut tUM toult If. tu ..... tllOM .rad lIy 1.1 .Dd If alt1pliad by 100 (th. COD.UDt wilht li'f •• II, 12.800/121). Thh. of, eOllr •• h to be lllpeettd h ... .,1. da.illlld to Ii .. n.ry oll"n.tio. tbe ... oll.mtloD tilt •• wi,ht. If ..... v.r. differ.llt procadur ... n follCllllol h .. I.eti .. tU .. .,11 tUD .11 OIlM"teioD •• y DOt ba .. tba _ wilht .11' " ... tivolII' DOt be • direct nltLpl. of :,1 ... &/. l1.1llrly. if IIti.t ... n ... ire. for. Irollp of .trtU or tu nth .... pll til .. it "ill lit lllcal .. ry to 11M tU flill wlpd. ,roee"" Nt out .Mf. II tlla willlu to be ."lied "ill w.ry trOll Itrtt. to .tr.t ••
nIl .. WIIIt IIWIPLI U IIIIPLYO. taY or u .. arAlmr; m WoCUUTIOII. It Ullac til. _noD TIl WlPLIIG 11101 or an _lOar .. 01 IAtll 101 .,. linD ITIA!IIII 01 .,. IVI-IOPVLA%JDI or !II ITlAtIIII eM • CoU.C'III.&DD.
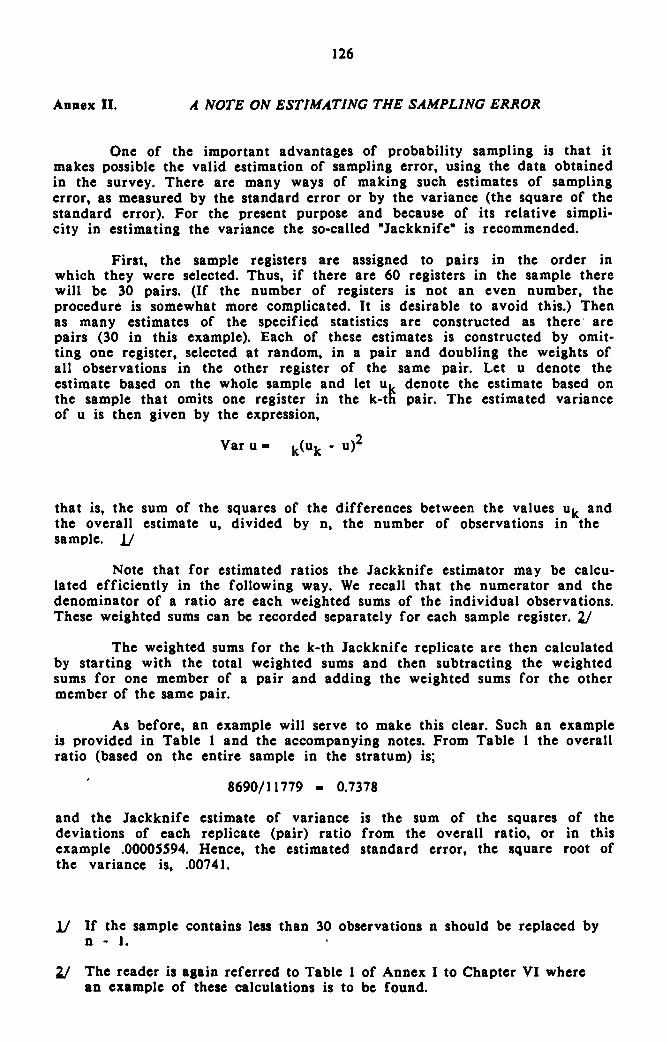
126
Annex II. A NOTE ON ESTIMATING THE SAMPLING ERROR
One of the important advantages of probability sampling is that it makes possible the valid estimation of sampling error, using the data obtained in the survey. There are many ways of making such estimates of sampling error, as measured by the standard error or by the variance (the square of the standard error). For the present purpose and because of its relative simplicity in estimating the variance the so-called "Jackknife" is recommended.
First, the sample registers are assigned to pairs in the order in which they were selected. Thus, if there are 60 registers in the sample there will be 30 pairs. (If the number of registers is not an even number, the procedure is somewhat more complicated. It is desirable to avoid this.) Then as many estimates of the specified statistics are constructed as there are pairs (30 in this example). Each of these estimates is constructed by omitting one register, selected at random, in a pair and doubling the weights of all observations in the other register of the same pair. Let u denote the estimate based on the whole sample and let uk denote the estimate based on the sample that omits one register in the k-th pair. The estimated variance of u is then given by the expression,
Var u.
that is, the sum of the squares of the differences between the values uk and the overall estimate u, divided by n, the number of observations in the sample. 1/
Note that for estimated ratios the Jackknife estimator may be calculated efficiently in the following way. We recall that the numerator and the denominator of a ratio are each weighted sums of the individual observations. These weighted sums can be recorded separately for each sample register. V
The weighted sums for the k-th Jackknife replicate are then calculated by starting with the total weighted sums and then subtracting the weighted sums for one member of a pair and adding the weighted sums for the other member of the same pair.
As before, an example will serve to make this clear. Such an example is provided in Table 1 and the accompanying notes. From Table I the overall ratio (based on the entire sample in the stratum) is;
8690/11779 - 0.7378
and the Jackknife estimate of variance is the sum of the squares of the deviations of each replicate (pair) ratio from the overall ratio, or in this example .00005594. Hence, the estimated standard error, the square root of the variance is, .00741.
1/ If the sample contains less than 30 observations n should be replaced by n - 1.
V The reader is again referred to Table 1 of Annex I to Chapter VI where an example of these calculations is to be found.

127
The sampling errors of estimates derived from the survey depend not only on the number of registers and the number of deliveries selected for the sample, but also on the degree to which registers differ from one another with respect to the average characteristics of their seedlings and their recipients, and on the degree to which recipients in the same register differ from one another. Unfortunately, little is known at present about these variabilities and hence it is not possible to make very firm predictions about the sampling errors that would result from the suggested design. Nevertheless, on the basis of rough knowledge, we expect that a sample of 90 registers and 630 deliveries in a climatic zone will yield estimates whose precision is usefully high. Tables 2 and 3 present preliminary estimates of the level of the standard error for samples of different sizes from a single age stratum for two types of statistics.
Readers, on examining the changes in the standard error as the sample size declines .(Tables 2 and 3), should not immediately conclude that the sample sizes recommended are too large and that smaller ones will do. Such a conclusion might be wrong on a number of possible counts among which the most important is that many parts of the analysis will require estimates of characteristics of sub-populations based on only a portion of the sample. These subsamples then become the sample for the purpose of the calculation and will necessarily have higher standard errors. If then the original sample is reduced on the basis of the evidence in Tables 1 and 2, estimates related to sub-populations may have standard errors which are so high as to render them valueless for the purpose of decision making by management (see also Chapter IX).

128
Table 1: EXAMPLE OF JACKKNIFE ESTIMATE OF THE YARIANCE OF A RATIO
Numerators Denominators Weighted Sumsli Weighted Sumsli
Pair 1st 2nd 1st 2nd • • - - -Estimate- - - - - -No.'DJ Regi- Regl- Regi- Regi- Numer- Denomi-
sterk! ster ster k! ster ator r;Jj nator ~ Ratio U
I 153 177 208 218 8,666 11,769 0.7363 2 129 131 187 198 8,688 11,768 0.7383 3 145 150 201 209 8,685 11,771 0.7378 4 170 148 214 198 8.712 11,795 0.7386 5 130 156 176 195 8,664 11,760 0.7367 6 137 145 178 198 8,682 11,759 0.7383 7 160 . 129 216 179 8.721 11,816 0.7381 8 129 151 184 196 8,668 11,767 0.7366 9 104 128 170 184 8,666 11,765 0.7365
10 137 139 192 195 8,688 11,776 0.7377 11 160 183 203 220 8,667 11,762 0.7368 12 178 107 223 166 8,761 11,836 0.7402 13 143 143 209 184 8,690 11,804 0.7362 14 162 122 198 161 8,730 11,816 0.7388 15 174 123 215 202 8,741 11,792 0.7413 16 136 138 179 204 8,688 11,754 0.7392 17 131 136 189 193 8,685 11,775 0.7376 18 192 117 247 176 8,765 11,850 0.7397 19 131 144 184 188 8,677 11,775 0.7369 20 139 134 200 184 8,695 11,795 0.7372 21 172 155 227 196 8,707 11,810 0.7373 22 132 115 177 184 8,707 11,772 0.7396 23 149 167 198 197 8,672 11,780 0.7362 24 129 141 183 186 8,678 11,776 0.7369 25 164 116 215 192 8,739 11,802 0.7404 26 135 153 189 193 8,672 11,775 0.7365 27 146 167 201 211 8,669 11,769 0.7366 28 160 155 206 198 8,695 11,787 0.7377 29 158 137 218 205 8,711 11,792 0.7387 30 137 161 181 201 8,666 11,759 0.7370
8,690gJ 11,779bJ
II The derivation of these weighted sums can be found in Table 1 of Annex I to Chapter VI.
121 The Pair number refers to a pair of nursery registers in a stratum. ~ The first register is chosen at random from the two registers in the pair. r;Jj The numerator is given by taking the sum of the weighted sums of numera-
tors, subtracting the weighted sum of the numerator for the 2nd Register, corresponding to the first pair and adding the weighted sum of the numera-tor for the 1st Register corresponding to the first pair (e.g. 8,690 - 177 + 153 - 8,666).
~ Similar to r;Jj above but with respect to the denominators (e.g. 11,779 -218 + 208 - 11,769).
U The ratio is simply the numerator divided by the denominator. For the first pair that is 8,666/11,769 - 0.7363.
gJ The sum of the weighted sums of the numerators for the 1st and 2nd regis-ters (e.g. the sum of the values in the first two columns).
hi As for gJ above but with respect to the denominators.

129
Table 2: ANTICIPATED STANDARD ERRORS OF THE ESTIMATED PROPORTION OF RECIPIENTS POSSESSING GIVEN CHARACTERISTICS, FOR A SINGLE AGE-STRATUM
OF REGISTERS
Sample Sizes m n
( Registers) ( Recipients) True Proportion Standard Error
16 128 .10 or .90 .035 .20 or .80 .046 .30 or .70 .053 .40 or .60 .056
16 96 .10 or .90 .038 .20 or .80 .050 .30 or .70 .057 .40 or .60 .061
16 64 .10 or .90 .043 .20 or .80 .057 .30 or .70 .065 .40 or .60 .070
12 96 .10 or .90 .040 .20 or .80 .053 .30 or .70 .061 .40 or .60 .065
12 72 .10 or .90 .043 .20 or .80 .058 .30 or .70 .066 .40 or .60 .071
12 48 .10 or .90 .049 .20 or .80 .066 .30 or .70 .075 .40 or .60 .081
8 64 .10 or .90 .049 .20 or .80 .065 .30 or .70 .075 .40 or .60 .080
8 48 .10 or .90 .053 .20 or .80 .071 .30 or .70 .081 .40 or .60 .087
8 32 .10 or .90 .060 .20 or .80 .081 .30 or .70 .092 .40 or .60 .099

130
Table 3: ANTICIPATED STANDARD ERRORS OF THE ESTIMATED SURVIVAL RATE, FOR A SINGLE AGE-STRATUM OF REGISTERS
Sample Sizes m n True Survival
( Registers) (Recipients) Rate Standard Error
16 128 .10 or .90 .042 .20 or .80 .048 .30 or .70 .052 .40 or .60 .054
16 96 .10 or .90 .044 .20 or .80 .052 .30 or .70 .057 .40 or .60 .060
16 64 .10 or .90 .049 .20 or .80 .060 .30 or .70 .066 .40 or .60 .069
12 96 .10 or .90 .048 .20 or .80 .055 .30 or .70 .060 .40 or .60 .062
12 72 .10 or .90 .051 .20 or .80 .060 .30 or .70 .066 .40 or .60 .069
8 48 .10 or .90 .057 .20 or .SO .069 .30 or .70 .076 .40 or .60 .oso
8 64 .10 or .90 .059 .20 or .80 .068 .30 or .70 .073 .40 or .60 .076
8 48 .10 or .90 .063 .20 or .80 .074 .30 or .70 .080 .40 or .60 .084
8 32 .10 or .90 .070 .20 or .80 .084 .30 or .70 .093 .40 or .60 .098

131
Annex III. COMPUTER PROGRAM FOR FARM FORESTRY SAMPLE SELECTION
The following program was written by Raj Bhatia and J. G. Campbell using the macro language provided in a commonly used electronic spreadsheet program, Lotus 1-2-3. It provides a clear demonstration of how the sample design outlined in Chapter VI can be programmed to facilitate sample selection by eliminating all hand calculations and also enhances understanding of the statistical methods used by graphically demonstrating the selection process. All that is required to run the program (in addition to the computer and the Lotus 1-2-3 program disk) is the list of all nursery registers and the number of deliveries in each. With this data in hand and a rudimentary knowledge of the operation of 1-2-3 (namely, how to move the cursor and print the results), it is possible to produce the final sample within a matter of minutes.
The specific steps required to run this program are as follows:
1. Load 1-2-3 and retrieve the sample selection program file.
2. Type in the names of the registers in column B and the corresponding number of deliveries in column C.
3. Place the cursor on the first serial number (location A II).
4. Type AL T -A. (This sorts the registers according to size.)
5. Type ALT-B. (This produces a cumulative total).
6. Type ALT-C. (This selects a random number).
7. Type ALT-D. (This selects the chosen registers and indicates the number of deliveries to be sampled in each.)
8. Type ALT -E. (This selects the serial numbers of the deliveries (farmers) to be interviewed in each selected register.)
9. Copy or print out the selected registers and delivery serial numbers and give them to the interviewers for locating and interviewing the respondents in the field. .
Steps 3 to 8 could, of course, be made into a single-step command if so desired. The following three figures contain printouts of the program showing:
o in Figure 1. an example of Step 2. the filling in of the names of the registers with the number of deliveries;
o in Figure 2. an example of the results of running steps 3 to 8 with this list of registers (each run would produce different results as a different set of random numbers would be selected); and
o in Figure 3. a printout of the macro program used.

132
Fllure 1. NURSERY NA.MES A.ND NUMBER OF DELIVERIES
.WI IIIIIIIT ..... IIIIC!!DI ._ ( .. I ftWII) ad ••••• __ ... _. La ••••• _ ••••• _ .. __
III. O ... miD 'ftI IIIIC!: 11 III. o. smlm. 'I' IIG: 7
... • f ... bt." "rtt~ ~, Ii .. .... l" .. --_ .............. - 0_10-
In Li.t Dr '11 .. " Itr. .... r .. rtd ti .. ...... ilt.re "u.- ... "iht.r Iii. Uo. ---------
...... rll 43
.i,Uipar m
..... U.II 170 • I' .. r .... 207 .... I ... ' 21 billie"'" 141 .. .,.rll 2" .. l .. UIII ~I
1IIDt' 1165 10 .. t .... t m 11 Itl""'ro 245 12 Ii nil 71 13 .. r .. 170 14 ,.,'.1 107 U lit .... 4., 16 .i ... l. 12 17 .... l ... d 217 11 ... ltwa., 471 n '*-t .... 167 20 I,m .. 1 261 21 Ilj._ll 70 22 .. l.Atr l3t 23 1 ... ,,_1 131 24 ..... J ..... r 901 2' ~'Il'1Ito I. 26 Dhtr.kttl. 1124 27 .... "h .... n 21 ',"c ... h 240 2t D.r ... t 621 '0 S.lIIIolflrll 149 31 Jo .. lttprll '" 32 lilt .... 74'
" ... I .. i ,., ,. Dttbi 7.
" .... ,.rJI1 62' 31 I"'ttl,. '71 37 .... , 215 ,. .... rUt ... , .. " Ii ..... 174 40 ~11".' .. 1 m 41 lalllt'" 72 42 ....... rl 473 43 !i .. rhallt m .. II.". 4' 45 Il._e ... rl m .. .'.,"r 129 47 .... lp ... m • 41 ClIent ..... '79 4' ~1I .. rl .. '" 1., SO Ilrwacu 411
....1. "ill'
1..,.IIt. for Hell laltct .. "Ihter
....... for 11.11 lal.ct.~ "Ihtlf
lal .. t.~ '.IIIIU larul IuMIr. of IItH"ri ..
laltett~ i. '.eb "Iilttr

133
Ffaure 2. SAMPLE SELECTION RESULTS
bill ",um, IAIIIoI U"crlll III ... .., ('I. 1r1An1l)
•• 0' _nil !II IIIoIcr, II III. 0' IISomali .... 110. 7
.. I .. ' ........ ... I.tt .... n •• ~, .1 .. .... 1 •• ....... "'lal .... u 01 "lIn,l .. . __ .... _--........... __ .. C_I." I., .... I" .... ..Iu," I .... , ... lIttl .. ,. ... 1 ..n .. tin ",11 .. III'" .. Itt'"
_ .... _ ... __ ....... _ ......... , ... ... Itter U .. 'IM 'IU.' teal.ln ...hln
II Ih .. l. 11 12 17 ... "1 .... 11 II , .... 1 ... 1 II , . I ...... ,. 43 101 .. ..... 1 • 41 lSI
21 llia.l. 70 ZlI 10 17 17 J7 " '7 I! '1 I .. " leU 71 zn II 111811 It J7l I. h ... 1 107 471 .. GeI.1l1f IZI 107 2J (\"._1 UI m 2Z .. I .... ' UI 1M I ""."or 141 IOU
'0 &. ...... n 141 II. 11 hh' .... II! U •• IS .. I ... 170 UII ... um U u " 71 " 110 I .. III 41 &.".rl .... II' 170' • II .. , .... 107 1110 21 'd .... I. 14. mo II "U"n m UII 7 ..... ,. UI 2U1
20 I.IU .. I III JIll u.21m II II " .1 In IU 101 14. n .... 11 us 'If! 17 PIIII .. rl 211 , ... II '''NI,'' , .. 'Ill 40 &..".1 .. 1 m 4t" 'UU57 ,. lIZ II' m III J2Z ., U .. rl .. lI • m .,71 '1 Cle, ...... m '"1 lJ ...... 1 ,a ,n • I "lull •• 40. 5742 U.US7I JI JI .. m III III U7 ,.
.1 ...... rl 47J IU' 11 1 .. 1_.1 '71 Hn )0 II,.. ... •• 717. ... 71421 .. .. UI I • m U' ", .. I U .. t .... .a 7U1 ., 1I ..... d ,,, Ill. II ., ., UI Z07 UI H' ')0 m 2. 0 .. , ... , UI ..,2 H I .. ,ttlll 121 ... M.1571' J7 J7 U7 II! J07 ,,, •• J7I 12 .. I .... 741 lOUt I Pl.m,. m I'''' 101.1411 • • I .. S02 '1' '" 127 m
14 Gulli 7. 11m
" II ..... II. 11647 lU.tm I' H 1M '1' 43. ,., III ., It &..11 .... I. usn II! .1421 I! 17 II' '.1 .. I ,,, m ISO 24 ·'1"- .. I I ... , '1 ". .. Iu .. ,' '"~ .,.14 UI .... 2 2 140 171 .n ,,. I .. a, H no Il I,. 171 Illn "'.7142 II II III JOI .. I "1 721 .7 10 """" "2 m14 141.7142 It! 107 141 J .. 5U I!' III m II • n".11 112 • 11"1 • ""I I1U I"" 7 1 .... U5 "
,. III 'M '" m ... 10" , "._11 •• 1701 lUll I. 121 II II m us J77 ." III 743 ., 117 1101 lUI u" 147' 15" 47 .... 1 .... 1271 ISm 7 U5.4215 ,. ,.
'11 717 I'U 1m Iia 101'

134
Fllure 3. SAMPLE SELECTION: MACRO PROGRAM
toTAL IUIIIII or DOII'1'I11 WIPL IIG II'l'IIVAL mlmD UIIIIIl ID IUDlmlliIAL IIIIJIIi IIZI
50 1314.3"'"
171 23"7.00000
2365t
o 9999
IIlCIDI
A IUllUG II'1'II-UCUG 1ST! 1- • (IIGIT)(IIGIT)(EIfD) (ooVII)(IIGI'l') (IIGIT) (IIGI'l') ICUG IBTEI-IUDIOInD-/UCSOI'1'lD- • (I IGIl') (IIGIT) (lID) (ooVIW (IIGIt) (IIGIt) IDlIDI01TED-rA-G/lQ
I (IIGIT )+(Llft )-(IDl'T) (CALC )-(ooVl) +(VP )+(Llft)-W. (LIft) (IID)(JX)VI) (IIGIT)-(IID) (!XlVI) (IDl'T) (CALC)-IUllCUIi m-/UClIU--(CALC)-(GOTO )SIZI-+ClIZI-(IDl'T) (CALC)-(CALC)/1lJ.
C (GOto)Woo,-'IOUlD(flAID*IIT!IVAL_I,O)-(IDl'T) (CALC)(ooVl)+(UP)-(IDl'T) (CALC)-(CALC)-
D (GOTO)SOlnD-(IIGIT)(IIGIT)(IIGIT) Iuellm-(II)-IIIIDJJIIG ID)IIZI--/IQ IIIIUJIIIG-JO)IIIZI--(JX)VI)/1G1115-(IIGIT)(lDlt )+7-(1Dl'T) (CALC)-(GOto )IUDIIG ID-(EDl'T )+II'l'IIVAL 1-(IDl'T) (CALC)-(GOTO )ISIZI-IIG1115- - -
! (GOTO)SOITED"'(IIGIT)(IIGIT)(IIGIT) IDCnIZI-(.1 )-(IIGIT )/ucal'TS-(.I)-11Irsm-ZZIO--/IQ IIIll'TSaDlO--(OOVI) (LIft) 11G1123-(IIGIT)+(Llft) (LIft) (Uft) IIl'TS-(lDlT) (CALC)IUCII'l'IIVAL-(IS)-(IlGlft'lIIOVID(fWD*(Llft) ,O)-(IDl'T) (CALC)IUCBtAlt-(IS)-(UGIt ) !Dr (It) • ( .. D) (IlGIT )-ItAlt-II'l'IlVAL -ImlVAL*(Il'TS-l)(Llft)(Llrr) (urr )(Llft) (DOIflI)/IG.l23-
IZrIII WGI alPY DOI8TEI III BOlt AlIA IZUD SOInD UIfCI
lilY! CUllOl TO CUM alLUMII IZ rIll .o11lULA .01 CUIIIUTm totAL
SILler WDOM lIU1IIl1
10 IlIt to OUt AlIA

135
VII. THE VILLAGE WOODLOT SURVEY
As in Chapter VI, readers are reminded that Chapters I, II, III and IV should have been read before this chapter is studied and that guidance on implementation and data processing are to be found in Chapters VIII and IX respecti vel y.
1. Sampling Design, Sample Size and Suney Procedures
The sampling design for the village woodlot survey is based on the premise that, at least initially, the most important objective should be to improve knowledge and understanding of community response to village wood lots and the degree of participation. Accordingly, the sample should be a random sample of sufficient size to permit comparisons of the responses of different groups of village people and village leaders according to the age of the woodlot. Because few woodlots are truly community managed, there seems to be little value in stratifying the sample according to such a difference. Moreover, it is not easy to draw clear-cut distinctions between community managed and departmentally managed woodlots;
The age of the woodlot must, however, explicitly enter the sampling design. This is because community attitudes change Slowly and it will be of great importance to compare attitudes in "old" and "new" woodlots. Additionally, many States have a policy of transferring management of the woodlot to the community only some years after woodlot establishment.
The first step in drawing the sample is to construct a complete list of all village woodlots arranged according to their year of establishment. The oldest woodlots should be at the beginning and the youngest at the end. This list should then be divided into parts, the first part consisting of "old" woodlots and the second of "new" woodlots. 11 For this purpose those woodlots established five years or more ago should be considered old and all the more recent as new. In the case of States with all woodlots less than five years old, woodlots established in the first year of operations can be taken as "old" so long as they are at least three years old. In the case of very new projects, the survey should be delayed until there are some woodlots which are at least three years old. By comparing "old" woodlots with new woodlots, insights can be gained into whether community attitudes toward such communal ventures are changing, the extent to which participation is increasing or decreasing, and the degree to which equity objectives are being achieved.
Once separate stratum lists (old and new) of village woodlots have been made and sequentially numbered, the sample can be chosen by calculating an appropriate sampling interval and using a table of random numbers. This is an analogous process to that used in Chapter VI for the farm forestry survey and is illustrated below in the discussion concerning the choice of households for the woodlot survey.
11 It would have been desirable to further stratify the sample according to zones since differences in animal husbandry and agricultural cropping strategies, characteristics of different zones, may affect people's attitudes toward woodlots. However, limited resources and ease of data analysis preclude such an expansion.

136
The recommended size of the sample has been determined on the basis of estimates of the resources likely to be available and the kinds of analysis which will be most useful.1/ The necessity for making comparisons between different sub-populations of woodlots must be balanced with the desirability of adequately measuring and understanding differences between and within villages. Since the degree of variation in key variables is presently unknown, the sample is apportioned equally between strata and between villages. Thus, a total sample size for a state of 100 woodlots (SO old and SO new), 1000 village households, and SOO village leaders is proposed.
Even though the number of households and leaders in the sample is larger than the number of woodlots in the sample, this docs not imply relatively small sampling errors for estimates of the characteristics of households and leaders. For the latter, the variance among villages is an important component of the total variance. Also, nothing is said here about. the
. manner in which sampling errors can be estimated. For these reasons at least, this sampling design should be regarded as provisional. Early field testing should provide information which can be used to improve this sampling design or to aid the formulation of a different design. For example, if a particular state has more than one third of its woodlots in the "old" category (i.e. S or more years old)then no stratification is necessary and a simple random selection of 100 woodlots can be made. Such a design has the additional advantage of avoiding the need to weight the results to produce estimates for the entire state.
The sample of households should be chosen from a complete list of all households in each of the selected villages (i.e. those with woodlots). Every effort must be made to ensure that this list is complete and special attention should be given to checking that all poor and underprivileged households arc included. From this list, ten households should be chosen at random. Each household selected for the sample should be classified, before the survey work in that village begins, into either high or low socio-economic status. The definition of low socio-economic status should be consistent with that used to construct the list of poor households that should have been drawn up by all Panchayats to meet Government requirements under the IRDP, Minimum Needs and Works Programs. The overall size of the sample is illustrated in Table 7.1 below.
Table 7.1: SAMPLE SIZE AND STRATIFICATION FOR VILLAGE WOODLOT SURVEY
Villages/woodlots Households II Village leaders l2./
aJ Based on 10 households per village. l2./ Based on S leaders per village.
Old SO
SOO 2S0
New 50
SOO 250
Total 100
1000 SOO
1/ It is estimated that one surveyor can complete one woodlot survey, ten household surveys, and five leader interviews within four days. Allowing another day and a half for travel and drawing the sample, this means one surveyor can cover one village per week.

137
The selection of the sample of villagers in each village should proceed as follows. The complete list of households should be numbered serially and continuously, Next, by dividing the total number of households in the village by 10 and rounding to the nearest whole number, the sampling interval I is obtained. After picking the first household by choosing a random number r between 1 and I from a random number table, the second through tenth are obtained by successively adding the sampling interval to that random number (i.e., r, r+I, r+21, r+31 ... r+91). As with the farm forestry survey, where a similar procedure is recommended, the best method is to use a precisely calculated interval (Le. up to 3 decimal places). However, rounding the interval to the nearest whole number provides an acceptable approximate. In the rare event that the last "hit" (selection number) is slightly greater than the number of the last listed household, selecting that last household as a part of the sample is acceptable, This procedure will yield an approximately self-weighted sample.
For example, say a village has 279. households. The list should be constructed so that the households are listed consecutively, i.e. No. 1 to No. 279. By dividing 279 (the total number of households) by 10 the sampling interval of 27.9 is obtained and rounded to 28. A random number table is then consulted to obtain the first number found between 1 and 28, say 24. Household No. 24 thus becomes the first household selected. The second is 52 (24 + 28); the third is 80 [24 + (2)(28)]; etc. until No. 276 [24 + (9)(28)]; the last household to be selected.
As the following list shows, the village leaders to be interviewed in each sample village (a maximum of five) must be prespecified and consist of residents of the village occupying positions of leadership. This will ensure that the major viewpoints of the village leadership and other opinion-makers are represented. It is possible that this list will require minor changes in some States to accomodate different conditions and institutional arrangements.
List of Individuals to be Interviewed in VlIIaae Leader Survey
(a) Panchayat
L Sarpanch; elected head (or if unavailable, Deputy Sarpanch or other member of Panchayat);
ii, Woman member of Panchayat (if unavailable, other active woman leader);
(b) Officials
iii. Village Level Worker or Agricultural Extension Worker, or schoolteacher;
iv. Forest Department Extension Worker or Ranger, VLWor AEW;
(c) Others v. Influential "opposition" leader in village suggested by Ranger or VLW
(not by Sarpanch).
In order for the results from each village to be as comparable as possibie, it is important for the investigator not to subsitute persons belonaina to another cateaory for absent villaae leaders. The investiaator must restrict interviews to the leaders mentioned above. It is important not to

138
obtain the name of the opposition leader from the present sarpanch. Usually, by consulting officials such as the Ranger or extension worker, it is possible to identify the leader of the main opposition group in the village.
2. Questionnaire Deslln
The proforma questionnaire that has been developed for use in the village woodlot survey is reproduced in its entirety later in this section. Most of the questions have pre-determined response categories to facilitate rapid tabulation and coding for analysis. Since conditions differ in each State and it is rarely possible to anticipate all major types of responses, it will be essential that this questionnaire be pre-tested and response categories added or revised if necessary. Similar procedures to those outlined in Chapter VI for the Farm Forestry questionnaire should be used.
The pre-test of the questionnaire and sample design should be conducted as a special exercise in the months preceding the actual survey. Three or four village woodlots can be purposively selected for diversity and a complete pre-test of the survey conducted using investigators who will later undertake the full study. This exercise will achieve two important objectives;
1. the questionnaire will be thoroughly pretested and the translations, response categories, and sampling procedures refined; and
2. investigators will become experienced in the administration of the survey.
The questionnaire also includes a small number of open ended questions requesting the respondents opinions on the woodlot and its management. While it is possible to pre-classify most response categories (especially after a thorough pre-test) some questions call for explanations. These should be left open and the answers written down in short sentence form. The respondent's answers should be recorded as stated, and classified and coded at the time of data processirtg. This is because we wish to know what the respondent believes or feels about the woodlot, not whether what is believed is true or false. Analysis of such responses usually reveals a discern able pattern which permits generalizations to be made.
As for the farm forestry survey, field investigators and their supervisors should be trained in the purpose and intent of the survey and how to carry it out (see Chapter VIII). Similarly, investigators should be provided with a field manual. This manual, however, could be written as a short supplement to that for the farm forestry survey, expanding and describing only those aspects of the woodlot survey that differ from the farm forestry survey.
The questionnaire as prescribed, is fully structured and largely pre cod cd for computerised data entry and analysis. This, however, in no way precludes the use of the questionnaire for surveys which are to be analyzed by hand.
139
PROFORMA
VILLAGE WOODLOT QUESTIONNAIRE
INVESTIGATOR PLEASE NOTE
Answers should, at the time of interview, be recorded in the spaces. provided beside or below the question or by ticking the appropriate response or responses. After the. interview is complete the relevant codes or values can be entered in the boxes on the left hand side of each page.

140
Page !
INSTRUCTIONS TO INVESTIGATORS
Q 1.1 - 1.13 These should be filled in by the interviewer after consulting appropriate records and through observation. Answers are not to be obtained by questioning the respondent. The first question for the respondent is Q 2.1. In addition to completing all initial information fill in the appropriate name of the villager or village leader in the "respondent"category, 1.11. Make sure that the respondent is a resident of the village. Codes will have been established for the Zones, Districts or Blocks by the KEU. Use them to code the answers. All questionnaires should be numbered serially when returned to the MEU and the number added at the top of questionnaire.
Q 2.1 This is the mest important question. Make sure that the respondent understands that you are asking about the woodlot in his/her village. Not about social forestry generally, or other village woodlots. The emphasis must be on the word "your".
Q 2.3 Take the first response that the respondent gives. Do not enter into any discussion. If the respondent says "Agricultural Department" note that, even if you know it to be incorrect.
Q 2.3 Don't know should be ticked if the respondent cannot give an answer. This applies to appropriate questions throughout the questionnaire. If a respondent "does not know" the answer to a question and there is no appropriate code, then write D.K. neatly beside the question.

141
PROFORMA
VILLAGE WOODLOT HOUSEHOLD AND VILLAGE LEADER QUESTIONAIRE
1.0 REGISTRATION (NOT TO BE ASKED)
Date of Interview Questionnaire Serial No. __ _
1.1 Zone/Circle ______________ _ 1.2 District/Forest Division _________ _ 1.3 Block/Range ______________ _ 1.4 Panchayat _______________ _ 1.5 Village ________________ _ 1.6 Year Established
~-------------1. 7 Established by: (1) Forest Dept._ (2) Other Govt. Dept. __ (3) Voluntary Agency_
(4) Panchayat_(S) Village __ (6) Other __ 1. 8 Managed by: (see codes in 1. 7 above) __ ----1. 9 Management Plan Prepared: (1) Yes_(2) No __ _ 1.10 Respondent Selection: (1) Random househo1d __ _
(2) Village Leader __ _ Pod tion _______ _
1.11 Respondent's Name _,....-______ ------1.12 Respondent's Sex: (1) Ma1e __ (2) Fema1e __ _ 1.13 Respondent's Social Category:
(1) Scheduled Caste or Tribe __ (2) Other __ _ 1.14 Respondent's Economic Category:
(1) Below Poverty Line ___ (2) Above Poverty Line __
2.0 KNOWLEDGE Qf WOODLOT AND WOODLOT ESTABLISHMENT
2.1 Is there a woodlot in your village? (1) Yes _2) No_
IF ANSWER TO Q 2.1 IS nYES" ASK Q 2.2 IF ANSWER TO Q 2.1 IS NO GO TO Q 4.2
2.2 When did you first came to know about the woodlot? (1) Before it was started ___ _ (2) When it was started
----:---:--(3) Several months afterwards __ (4) Can't remember -------
2.3 Whom do you believe started the woodlot? (1) Forest Department ______ _ (2) Agricultural Department_ (3) Panchayat. _____ _ (4) Panchayat and Forest Department __ (5) Other (specify) ___________ _ (6) Don't know _________ _
Value or Variable Code Name
LLLI WNUM
LI ZONE I_LI DISTRICT LLI BLOCK
LLI YEAR
LI ESTAB LI MANAGE LI PLAN
LI SAMPLE
LI SEX
LI GROUP
LI ECON
I_I WOODLOT
LI HEAR
LI STAllT

Q 2.4
Q 2.5
Q 3.1
Q 3.4
Q 3.5
Q 3.6
142
INSTRUCTIONS TO INVESTIGATOR
As in Q 2.3 note the first response.
Note only the respondent's first three responses and use the codes to enter these. If the respondent hesitates, do not prompt him/her. Enter in the space provided under "Other" all responses which are not specifically listed, for example, "shade", "windbelt".
The meetings referred to in this question and in Q 3.2 are formal meetings called to discuss a proposed, or ongoing, woodlot, not casual conversations in the fields, or at tea shops.
Some respondents may have contributed voluntary labor and been paid as well. If this is the case, the "both" category should be ticked and code "3" entered on the right.
Responses to this question might include, for example, protection of the ·woodlot (whether paid or unpaid). Note every response under this question. For example, the respondent may say "I kept my cattle away from the woodlot". This is a "contribution". A contribution does not mean only a payment, but something which the respondent has done, or refrained from doing, to assist in the establishment and maintenance of the woodlot. Answers are to be coded later.
Kake sure that the respondent understands that you mean not only the respondent but also any person residing with the respondent. The word "received" includes a person who has collected products from the woodlot and given them to the respondent or any other person residing with the respondent. In other words, it is not necessary for the respondent to have collected the products, so long as they reached the respondent's house. Do not read the products to the respondent.

143
2.4 Who was most influential in starting the woodlot?
(1) Forest Guard (5) Village Leader_ (2) Motivator (6) Other (specify). (3) Range Forest Officer __ (7) Don't know (4) Forest Extension Worker
2.5 Why was this woodlot started?
(01) For Fue1wood ___ (02) As Wasteland Rec1amation___. (03) For Timber and po1es ___ (04) For Fodder (05) For Fruit __ (06) For Ornamental purposes __ (07) To prevent distribution among the landless __ (08) For Income for the panchayat ___ ___ (09) Other (Specify) (10) Don't Know
3.0 PARTICIPATION
3.1 Have you attended any village meetings in which the woodlot was discussed? (1) Yes __ (2) No ___ _
IF ANSWER TO Q 3.1 IS "YES" ASK Q 3.2 IF ANSWER TO Q 3.1 IS "NO" GO TO Q 3.3
3.2 Were these meetings held before or after the woodlot was started?
(1) Before __ (2) After __ (3) Both __
3.3 Have you, or has any member of your household worked on the woodlot? (1) Yes ____ (2) No ___ _
IF ANSWER TO Q 3.3 IS "YES" ASK Q 3.4 IF ANSWER TO Q 3.3 IS "NO" GO TO Q 3.5
3.4 Were you paid for this or did you give the labor free? (1) Paid __ (2) Free __ (3) Both ___ _
3.5 Have you contributed in any other way to the establishment and running of the woodlot? If yes, how?
3.6 Have you, or anyone in your household received or collected any products from the woodlot?
Product (tick as appropriate) 3.6.1 Grass, fodder leaves ___ _ 3.6.2 Twigs, deadwood, fuel leaves. 3.6.3 Fruits 3.6.4 Loppings/thinnings ___ _ 3.6.5 Timber/poles ___ _ 3.6.6 Bamboo 3.6.7 Grazin,----3.6.8 Other (specify) __
Value Variable or Code Name ---
LI PERSON
LLI WHY 1. LLI WHY 2. LLI WHY 3.
I_I ATTEND
I_I MEETING
LI WORK
LI PAYIAB
LI CONTRB
FODDER FUEL FRUIT LOPPING TIMBER BAMBOO GRAZE OTHPROD

Q 3.10
Q 3.12
Q 3.16
144
INSTRUCTIONS TO INVESTIGATORS
If panchayat members other than those specified "sold" woodlot products, note this beside 'other'.
The sums of money involved should not be discussed or recorded. This question is to establish whether the respondent is aware of where the money goes.
The answers to this question should be written down and coded later.

145
Value Variable or ~ Name
3.7 Did you pay for all, or any, of these products? (1) Yes __ (2) No __
3.8 Have any of the products of the woodlot been sold or given to people from other villages?
(1) Given __ (2) Sold __ (3) Neither __ (4) Don't know__ .
IF ANSWER TO Q 3.8 IS "GIVEN" OR "SOLD" ASK Q 3.9 IF "NEITHER" OR "DON'T KNOW" GO TO Q 3.11
3.9 Were these people from outside the panchayat? (1) Yes __ (2) No __ (3) Don't know
3.10 Who sold or gave them away? (1) Panchayat_(2) Forest Dept._(3) Both (5) Other (Specify) (4) Don't know ___
3.11 Has any money received from sales of woodlot produce accrued to the panchayat?
(1) Yes __ (2) No __ (3) Don't Know __
IF ANSWER TO Q 3.11 IS "YES" ASK Q 3.12 IF ANSWER TO Q 3.11 IS "NO" OR "DON'T KNOW" GO TO Q 3.13
3.12 What did the panchayat do with this money? (1) Invested in bank (2) Spent on village project (3) Spent on forestry (4) Other _~~ ___ _ (5) More than one response (6) Don't Know
3.13 Who paid for the following inputs for the woodlot?
2.18.1 Seedlings 2.18.2 Establishment labor 2.18.3 Protection
.-------~ (1) Forest Dept. (2) Panchayat ____ _ (3) Both - (4) Other -----(5) Don't Know
3.14 Were these inputs mostly provided on time? (1) Yes __ (2) No __ (3) Don't Know __
3.15 Do you receive adequate support from the Forest Department? (1) Yes __ (2) No __ (3) Don't Know __
IF ANSWER TO Q 3.15 IS "YES" GO TO Q 3.16 IF ANSWER TO Q 3.15 IS "NO" OR "DON'T KNOW" ASK Q 4.1
3.16 What additional support do you need?
LI PAYPROD
LI SOLDPROD
LI SOLDOUT
I_I WHOSOLD
LI RSPANCH
LI INCOME
LI SEEDCOST I_I WCOT LI PROTCOST
LI INPTIME
LI SUPPORTl
I_I SUPPORT2

146
INSTRUCTIONS TO INVESTIGATORS
Section 4.0 These questions concern attitudes and it is therefore very easy to misunderstand or misinterpret the respondent. Listen carefully to what the respondent says and do not prompt him or in any other way suggest answers. Do not enter into a discussion if you think the response is incorrect.
Q 4.3 Record only the respondents first two responses,
Q 4.7 Record the 5 main species suggested as the respondent states them and later use the STATE MASTER CODE for tree species to code the responses.
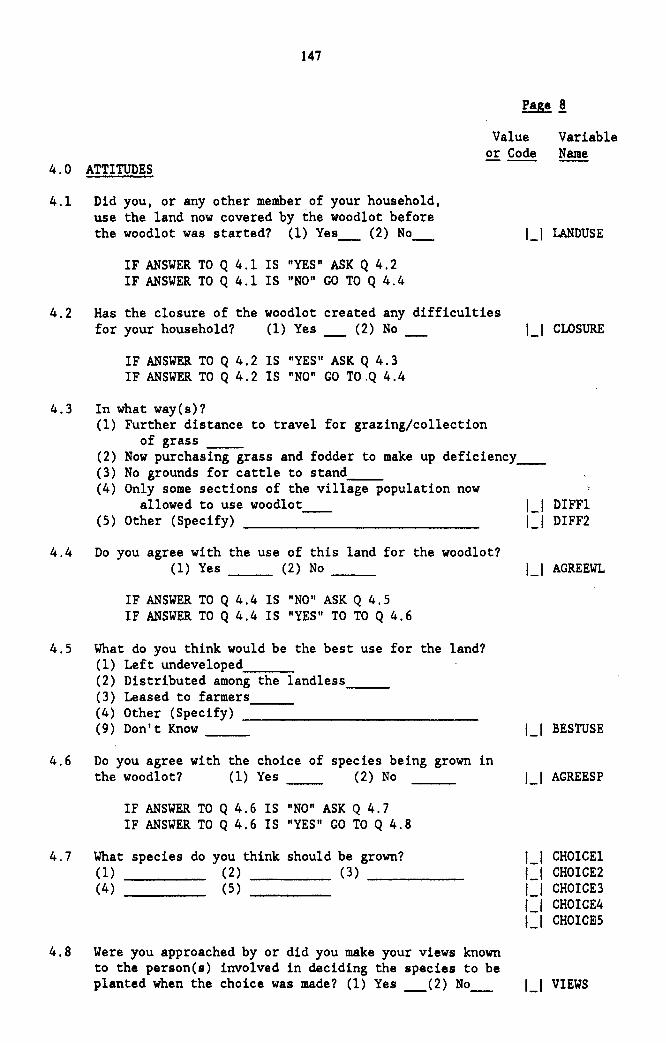
147
Value Variable or Code Name
4.0 ATTITUDES
4.1 Did you, or any other member of your household, use the land now covered by the woodlot before the woodlot was started? (1) Yes ___ (2) No ___
IF ANSWER TO Q 4.1 IS "YES" ASK Q 4.2 IF ANSWER TO Q 4.1 IS "NO" GO TO Q 4.4
4.2 Has the closure of the woodlot created any difficulties for your household? (1) Yes ___ (2) No _
IF ANSWER TO Q 4.2 IS "YES" ASK Q 4.3 IF ANSWER TO Q 4.2 IS "NO" GO TO.Q 4.4
4.3 In what way(s)? (1) Further distance to travel for grazing/collection
of grass __
LI LANDUSE
LI CLOSURE
(2) Now purchasing grass and fodder to make up deficiency __ (3) No grounds for cattle to stand ___ _ (4) Only some sections of the village population now
allowed to use woodlot I_I DIFFl (5) Other (Specify) I_I DIFF2
4.4 Do you agree with the use of this land for the woodlot? (1) Yes (2) No __
IF ANSWER TO Q 4.4 IS "NO" ASK Q 4.5 IF ANSWER TO Q 4.4 IS "YES" TO TO Q 4.6
4.5 What do you think would be the best use for the land? (1) Left undeveloped._....,.---:-(2) Distributed among the landless ---(3) Leased to farmers __ _ (4) Other (Specify) ____________ _ (9) Don't Know __ _
4.6 Do you agree with the choice of species being grown in the woodlot? (1) Yes __ (2) No
IF ANSWER TO Q 4.6 IS "NO" ASK Q 4.7 IF ANSWER TO Q 4.6 IS "YES" GO TO Q 4.8
4.7 What species do you think should be grown? (1) (2) (3) ______ _
(4) (5)
4.8 Were you approached by or did you make your views known to the person(s) involved in deciding the species to be planted when the choice was made? (1) Yes ___ (2) No
I_I AGREEWL
I_I BESTUSE
LI AGREESP
LI CHOICEl LI CHOICE2 LI CHOICE3 LI CHOICE4 LI CHOICES
LI VIEWS

Q 4.11
Q 4.14
148
INSTRUCTIONS TO INVESTIGATORS
Do not suggest answers to the respondent. Note only the answers he or she gives you.
Record only the first two responses given by the respondent.

149
Value Variable ~ Code Name
4.9 Is there a plan for the sharing of products from the woodlot? (1) Yes __ (2) No _(3) Don't Know _ I_I PLANKNOW
IF ANSWER TO Q 4.9 IS "YES" ASK Q 4.10 IF ANSWER TO Q 4.9 IS "NO" OR "DON'T KNOW" GO TO Q 4.11
4.10 Do you agree with the way in which the forest produce from the woodlot is being distributed or is planned to be distributed? (1) Yes __ (2) No_(3) Don't Know_.
IF ANSWER TO Q 4.10 IS "NO" OR "DON'T KNOW" ASK Q 4.11 IF ANSWER TO Q 4.10 IS "YES" GO TO Q 4.14
4.11 What suggestions do you have regarding the distribution of the produce from the woodlot? (1) Free and equal distribution to all __ (2) Free distribution to landless and weaker sections (3) Sale to all villagers __ (4) Sale only to landless and weaker sections __
I_I AGREEDT
(5) Sale by auction for common village benefit _____ i_I DISTRIB (6) Other (Specify) (7) No suggestion __
4.12 Who is responsible for managing the woodlot? (1) Forest Dept._ (2) Panchayat_ (3) Both __ (4) Other (Specify) (5) Don't Know___ I_I RESPON
IF ANSWER TO Q 4.12 IS "PANCHAYAT" OR SOME OTHER VILLAGE ORGANIZATION GO TO Q 4.20 IF ANSWER IS "FOREST DEPT." OR "BOTH" ASK Q 4.13. IF ANSWER IS "DON'T KNOW" GO TO Q 5.1.
4.13 Do you think that the panchayat is capable of taking over the management of the woodlot?
(1) Yes (2) No ___ (3) Don't Know __ _
IF ANSWER TO Q 4.13 IS "NO" ASK Q 4.14
LI PANCAP
IF ANSWER TO Q 4.13 IS "YES" OR "DON'T KNOW" GO TO Q 4.15
4.14 Why not? (1) Insufficient funds ---(2) Lack of experience--:--:-_ (3) Other village priorities __ _ (4) Inadequate technical experience __ _ (5) Village factions __ _ (6) Insufficient labor available __ _ (7) Other (Specify) ________________ _
4.15 Have you or the panchayat asked for the transfer of management of the woodlot to the panchayat?
(1) Yes ___ (2) No ___ (3) Don't Know __ _
IF ANSWER TO Q 4.15 IS "YES" ASK Q 4.16
I_I NOPANCH1 I_I NOPANCH2
LI ASKTRANS
IF ANSWER TO Q 4.15 IS "NO" OR "DON'T KNOW" GO TO Q 4.17

Q 4.18
Q 5.1
ISO
INSTRUCTIONS TO INVESTIGATORS
You must make it clear to the respondent that the question is a hypothetical case. If the Forest Department is bearing all costs at the time of the survey, tell the respondent that there is no intention of withdrawing that support. It may also be necessary to introduce this question with a preliminary discussion. This will depend, partly, on the length of establishment of the woodlot. For example, if the woodlot is close to being harvested, the only cost which will remain is the cost of harvest and sale. Make it very clear that the question is hypothetical; that neither the Department, nor the Government is necessarily considering either a loan or grant.
The emphasis here is on the word "you", 1. e., the respondent IS
present household and not any forebearers.

lSI
Value Variable or Code Name ---4.16 Why was it not transferred?
(1) FD unwilling because it is too early __ _ (2) FD feels that we cannot manage the woodlot ___ (3) FD is preparing transfer formalities __ (4) Agreement states we have to wait till year __ (5) Other (Specify) (6) Don't Know __
4.17 Why did you choose a managed woodlot instead of a self-help village woodlot? (1) No funds (2) Insufficient labor __ _ (3) No technical or managerial experience ___ (4) Panchayat funds needed for other projects __ (5) Village factions_ (6) Lack of leadership_ (7) Other (Specify)
I_I NOTRANS
( 8) Don't know I_I ASKMANAG
4.18 If the costs of management (i.e. costs of protection, harvesting, thinning) were to be received by the panchayat as a grant or loan, do you think that the panchayat could take over the management of the woodlot?
(1) Yes ____ (2) No __ (3) Don't Know ___ I_I PANMAN
IF ANSWER TO Q 4.18 IS "YES" GO TO Q 5.1 IF ANSWER TO Q 4.18 IS "NO" ASK Q 4.19, THEN GO TO Q 5.1 IF ANSWER TO Q 4.18 IS "DON'T KNOW" GO TO 4.20
4.19 Why not? (1) No managerial skills ___ (2) Village factions (3) No technical skills (4) Insufficient labor (5) Legal problems (6) Other (Specify)
4.20 Why did panchayat undertake a self-help village woodlot instead of a managed one? (1) Sufficient funds (2) Village 1eadership __ __ (3). Had technical and managerial experience __ _ (4) Did not want to share income -----
I_I WHYNOT
(5) Other (Specify) (6) Don't Know I_I SELFHELP
5.0 PRIVATE PLANTING
5.1 Have you ever planted any tree seedlings on your own land? (1) Yes (2) No I_I TREPLANT
IF ANSWER TO Q 5.1 IS "YES" ASK Q 5.2, Q 5.3 AND THEN Q 6.1 IF ANSWER TO Q 5.1 IS "NO" ASK Q 5.4
5.2 Where did you get your seedlings? (1) FD nursery (2) Private nursery __ _ (3) Other Govt.nursery_(4) Other Villagers __ I_I SOURCE (5) Other (Specify) _____ _

Q 6.1
Q 6.2
152
INSTRUCTIONS TO INVESn~~'l'~RS
This includes lind that he may have rented in.
You Ire only concerned with the major source of income (not every source) and not with the amount of income that is obtained.
At the end of the interview, write and sign your name in the spaces provided.

153
5.3 How many seedlings did you plant? No. __
ASK Q 5.4 ONLY IF ANS\lER TO Q 5.1 \lAS "NO".
5.4 Why not? (1) Insufficient land ____ (2) No time __ (3) Desired species not avai1ab1e ___ (4) No transport (5) No labor for tree operations (6) Nursery too far (7) Not told about seedling availability_ (8) Other (Specify) ______ _
6.0 PERSONAL CHARACTERISTICS
6.1 How much land do you operate? ____ ha
6.2 What is usually your greatest source of income? (1) Farming (5) Dairying ~~_ (2) Ag. labor (6) Unskilled 1abor_ (3) Skilled labor (7) Govt. emp1oyment ___ (4) Business (8) Other ___ _
6.3 Have you heard about village woodlots through any of the following?
6.3.1 Radio 6.3.2 T.V. 6.3.3 Newspapers 6.3.4 Posters/Signs 6.3.5 Forest Dept. Official 6.3.6 Agriculture Official 6.3.7 Other Govt. Dept. 6.3.8 Voluntary Agency 6.3.9 Village Leaders 6.3.10 Friends, Neighbors ,etc. 6.3.11 Other (Specify)
(1) Yes (2) No
Value Variable or Code Name
1_1_1_1_1_1 SEEDLING
LI NOSEED1 LI NOSEED2
I 1 LAND
I_I OCCUP
RADIO TV PAPER POSTER FORDEPT AGDEPT OTHDEPT VOlAGEN LEADER FRIENDS OTHSOURC
Interviewer Name ------- Signature ____ _ 1_1_1 INTERV
**** END OF INTERVIE\l ****

154
3. initial Tabulations
The possibilities for useful analysis of the data obtained from the woodlot surveys are limited only by the the skill of the analyst, the time available, and the computing resources employed. Irrespective of whether computer or manual methods of analysis are used, the analysis should be based initially on straight-forward tabulations of the results of each question with some simple cross-tabulations to assist the identification of possible relationships between variables. This descriptive analysis should be prepared soon after the completion of the survey (see Chapter VIII) so that the most obvious findings can be made available to management and policy makers. The main initial tabulations that should be made are set out in the pages that follow.
The main dimensions for the tabulations are those upon which the sample design is based--that is old and new woodlots and villages, and village leaders. Within these basic categories initial comparative analysis should, in addition, focus on differences between households of low socioeconomic status and those of higher status. Note, also that most of the estimates provided in the tables are ratios, in which both the numerator and denominator are sample estimates.
Like the .tabulations resulting from the Farm Forestry survey. those for the willage woodlot survey contain brief notes on how they are to be constructed and some suggested interpretive possibilities. Because the tables provide, in the main, no more than simple comparative statistics which point out differences between groups of households or woodlots of different ages, firm conclusions will remain elusive unless formal statistical tests for differences are undertaken - see Chapter IX. Even then, however, causality will not necessarily be established and further higher order analysis, using a micro-computer, may be necessary.

ISS
Table VW I: KNOWLEDGE OF VILLAGE WOODLOT
Villagers Excluding Village Leaders
1. Respondents who first knew about the woodlot:Before it was started 1I When it was started 1I Several months later II
2. Respondents who are not aware of the woodlot
Total No. of Respondents (N)
Woodlots
Old New ----Percent----
1I These sub-category percentages are percentages of those included in the first row of Item 1 of the Table. As such they should sum to 100 percent.
NOTES
1. The data for this Table are obtained from the responses to Q's 2.1 and 2.2 of the Village Woodlot Questionnaire (VWQ). The Table should be based only on an analysis of responses from villagers. Village leaders should be excluded.
2. The purpose of this Table is to show any differences in awareness between old and new woodlots. There is a prior expectation that villagers associated with old woodlots will generally be more aware than those who respond about new woodlots. However low awareness in new woodlots suggests that the extension effort was inadequate. When respondents became aware of the woodlot is also strongly suggestive of the degree of consultation. If the majority of villagers came to know about the woodlot only after it was started then' there wa's probably inadequate prior consultation. The Table will reveal whether this feature has changed with time: the comparison between old and new. Additionally, the proportion (percentage of villagers) who are not aware of the woodlot is a revealing statistic. The higher this proportion the poorer the dissemination of information, irrespective of the details concerning when respondents first came to know about the woodlot.

156
Table VW2: KNOWLEDGE OF VILLAGE WOODLOT BY RESPONDENT'S SOCIOECONOMIC STATUS
Woodlots
Respondents who are aware 0/ the woodlot a/ Old New ----Percent----
1. Low status hi 2. High status hi
aJ 1;'hese repondents will be those included in Item I of Table VWl. hi Excluding village leaders.
NOTES
l. This Table which is also constructed from the answers to Q 2.1 of the VWQ, classified on the basis of the details recorded at the end of the questionnaire, shows whether the proportion of low sta tus households who are aware of the woodlot tends to increase with time.
2. If few "poor" respondents are a ware this points to the possible need to modify the way the program is being implemented or to focus publicity and extension efforts more sharply on the disadvantaged. Moreover, although prese'nt awareness is not a certain guide to the future a low level of awareness among "low status" households suggests tha t such households are unlikely to share fully in future benefits.

IS7
Table VW3: AGENCY BELIEVED RESPONSIBLE FOR STARTING WOODLOT
J. Villagers Correctly Beliel'illg !I
(a) Forest Department (FD) (b) Panchayat
2. Leaders Correctly Believing i/
(a) Forest Department (FD) (b) Panchayat (c) Panchayat and FD
Woodlots
Old New -----Pe rce n t -----
a/ Only correct responses must be used. They should be expressed as a proportion (percentage) of those respondents who answered Q2.2.
NOTES
1. The data for this Table come from Q2.3 in the VWQ.
2. Incorrect perceptions (the inverse of the values in the Table) ha ve practical implica tions for ex tension activities.
3. A similar table should be prepared based on the responses to Q2.4 in the VWQ.

IS8
Table VW4: PURPOSE OF VILLA.GE WOODLOT
Respondents Believing the pur pose to be 11
Wood, Wood Products Ornamental Reclamation Stop distribution to landless Fruit Panchayat Income Other
Old Woodlots New Woodlots
Villagers Leaders Villagers Leaders -------------------------Pe ree lit -----------------------
11 The possible responses (including Other) in the questionnaire should be grouped together to reduce the size of the table. Percentages may sum to more than 100 as the categories are not mutually exclusive.
NOTES
1. The data for this Table come from Q2.5 of the VWQ.
2. Perceptions of woodlot purpose are a good indicator of the use to which people think a woodlot should be put. Strong differences between villagers perceptions and those of village leaders indicate a lack of consultation or the imposition of views by the more powerful. Alternatively. if the responses betray a widespread misunderstanding of the purpose of the woodlot then there is ground for suspecting that much more extension work is necessary.
3. It is reasonable to expect a greater congruence between the actual purpose of the woodlot and respondents perceptions for "old" woodlots. If this is not so extension and community involvement have probably failed.

159
Table VW5: EXTENT OF PARTICIPATION IN VILLAGE MEETINGS CONCERNING WOODLOT
Woodlots
Respondents Attending Meeting(s) Old New ----Percent----
1. Villagers
Low Status 11 Higher Status 11 All .IV
2. Leaders
11 The percentage of the relevant group . .IV The weighted percentage of all villagers excluding leaders.
NOTES
I. Q3.1 of the VWQ provides the data for this Table.
2. Since social forestry is dependent for its success on community participation in decision making, the information from this Table will form a useful basis for addressing these issues and for formulating future policy. The Table will not only indicate the scale of participation in meetings but also suggest which segments of the village population are participating in decisions.
3. The Table should be repeated, with a slight modification, to handle the responses to Q3.2 (timing of meetings) of the VWQ. This information will suggest whether participation has increased, reduced or remained constant since the woodlot was established. Increased participation would be a signal of "success" while declining participation in meetings may imply growing disinterest.

160
Table VW6: EMPLOYMENT.lN VILLAGE WOODLOTS
Woodlots
Old New
Respondents Claiming to have Worked on Woodlot Paid Free Paid Free ··············Percent············
1. Villagers
Low Status l/ Higher Status l/ All hi
2. Leaders
l/ The percentage of the relevant group. hi The weighted percentage of all villagers excluding leaders.
NOTES
1. The data for this Table are obtained from responses to Q's3.3, 3.4 and 3.S of the VWQ. If a significant number (more than 5%) of respon· dents mention other contributions (Q 3.5), these could be listed in a footnote to the Table.
2. This Table will show whether the policy of using woodlots to provide employment to the disadvantaged is working. Additionally, the extent to which villagers freely contribute labor or help in other ways is a strong indicator of their commitment to the woodlot and a sign that they believe some benefits will ultimately accrue to them.

161
Table VW7: RECEIPT OF PRODUCTS FROM VILLAGE WOODLOT
Product if
Grass, twigs and leaves Fuelwood Fruits Loppings/Thinnings Timber
Households Obtaining Products from Woodlots "Low Status" "High Status"
Old New Old New ••••••••••••••• -•••••• Perce nt ••••••••••• -••••••
if The number of product categories should be lengthened or shortened to reflect actual responses. The percentages should be the percentages of all households in each category.
NOTES
1. This Table is based on the responses to Q 3.6 of the VWQ. Similar tables for "all households" and "village leaders" should be prepared.
2. It is important to know whether any benefits are being received from the woodlot and who is receiving those benefits. Obviously, the range of benefits that can be received from "new" woodlots is likely to be less than from "old" woodlots (since, for instance, lops and tops, and timber will not be available for distribution). But, if in "old" woodlots nothing, or few products are being received, this should prompt the Department to re-examine its policies and procedures.
3. The interpretation of these tables should pay particular attention to any differences in the proportions of "low status" and "high status" households obtaining woodlot products (in terms of the relevant percentages or the composition of the products received). If the propor· tion of "low status" households receiving benefits is small relative to their share of the village population, then there may be grounds for suspecting that their access to products is being restricted in some way.

162
Table VW8: PAYMENT FOR PRODUCTS FROM VILLAGE WOODLOT
1. Villagers
Low Status Ii Higher Status Ii All hi
2. Leaders
Responde,tts Paying for Products
Woodlots
Old New ·······Percent·· ....
Ii As a percentage of those receiving one or more products. l2./ The percentage of all villagers excluding leaders.
NOTES
1. Data for this Table are obtained from response to Q 3.7 of the VWQ.
2. The Table casts light on several Questions. For example, has payment for products been agreed upon, or is payment being illegally demanded? Is payment justified? Does payment appear to be discriminatory?

163
Table VW9: DISPOSAL OF WOODLOT PRODUCTS TO OUTSIDERS
Respondents believing: Products Sold Products Given Away Products Sold or Given Away to Outsiders
Person( s) believed to have sold or given products away
(a) Panchayat (b) Sarpanch (c) Forest Guard (d) Range Forest Officer
Villagers aJ Leaders Ii
Woodlots Woodlots Old New Old New ---------------Pe rce 11 t ------. ----------
~ Percentages for these two groups must be calculated separately.
NOTES
1. These data are to be taken from Q's 3.8, 3.9 and 3.10 of the VWQ.
2. Taken as a whole this table reflects whether there is a widespread perception among villagers that products from the woodlot are being given or sold to others; whether these 'others' are from outside the panchayat and, who, if they were sold, is believed to have sold them. The opinions of the village leaders may differ substantially from the perceptions of villagers.
3. A widespread, but false impression that products from the woodlot are being improperly disposed of, is likely to be very counter-productive and require determined efforts to dispel it. If, however, such impressions are correct then the need for firm corrective action is also implied.

164
rable VWIO: RECEIPTS FROM WOODLOT SA.LES A.ND THEIR USE II
Woodlot sales have yielded income for Panchayat kl
Use of that income by Panchayat kl
a) Banked b) Village benefit c) Reinvested in Forestry
Villagers 121 Leaders 121
Woodlots Woodlots Old New Old New ••••••••••••••• -. P e ree" t •• _.- ._ •• _ ••• _.
1.1 The number of woodlots (percent of those studied) that have yielded income for the panchayat should be stated in a footnote.
121 Percentages for these two groups must be calculated separately. £! Percentages may not sum to 100 as categories are not mutually exclusive.
NOTES
1. This Table is constructed from the responses to Q's 3.11 and 3.12 of theVWQ.
2. This Table should be interpreted in two ways. First, a comparison of the perceptions of villagers with the probably more informed responses of leaders should be made. Large discrepancies suggest a low level of community awareness. Second, by paying more attention to the leaders responses the extent to which the panchayat is using the proceeds of the woodlot for. further forestry investment or other activities can be inferred. This should allow informed judgments about whether the panchayats are using the revenue from woodlots in a productive manner.
3. It is unlikely that new woodlots will have yielded an income. If this is the case the relevant columns should be dropped from the Table.

165
Table VWll: TIMELINESS OF INPUTS FOR VILLAGE WOODLOT BY SOURCE Ii
Believing Inputs Provided on Time
1. Villagers hi
Seedlings Establishment Labour Cost Protection Inputs supplied on time FD Support adequate
2. Leaders hi
Seedlings Establishment Labour Cost Protection Inputs supplied on time FD Support adequate
Source of Inputs
Forest Not yet Don't Department Panchayat Provided Know ••••••••••••••••••••••• Pe rce nt ••••••••••••••••••••••••
B.! Another category "Others" could be added if necessary. hi Calculate percentages separately for the two groups.
NOTES
1. This Table uses the responses to Q's 3.13, 3.14 and 3.15 of the VWQ.
2. This Table is to be interpreted in the same way as Table VWIO. Com· parisons should be drawn between the perceptions of villagers and the responses of the village leaders. Attention should also be paid to the proportion of respondents who report "don't know" as this will reveal the extent to which knowledge of who supplied inputs is or is
, not widespread.
3. A similar Table should also be prepared to analyze and report the responses to Q 3.16 concerning respondents views on their need for additional FD support.

166
Table VWll: USERS OF WOODLOT AREA AFFECTED BY CLOSURE
NOTES
1. Villagers
Low Status i/ Higher Status i/ All
2. Leaders
Woodlots
Old New ·····Percent·····
i/ The percentage of the relevant group should be given in the columns. Leaders are tabulated separately.
1. This Table, constructed from the responses to Q's 4.1 and 4.2 of the HVLQ relates to those respondents who stated that they had used the woodlot area before woodlot establishment.
2. This Table will guide management in determining whether alternative provision should be made for the most affected villagers before closure of community lands for the establishment of a village woodlot. Footnotes should be added to the table specifying the most frequent effects for each group based on the answers to Q 4.3 in the VWQ.
3. If a large proportion of respondents claims to have been adversely affected by the establishment of the woodlot, this variable, in a series of additional tables, should be related to participation (see Table VW5) and opinion about the use of the land devoted to the woodlot (see Table VW13).

167
Table VW13: BELIEFS ABOUT USE OF LAND FOR WOODLOT ESTABLISHMENT
Villagers Excluding Village Leaders
1. Villagers who believe present use is the best use:
Low Status i/ High Status i/ All
2. Preferred use of those who do not believe presen t use is the best use: hi
Left undeveloped Distribute to landless Lease to farmers
'd! Percent of the relevant group.
Woodlots
Old New -----Pe rcent -----
hi Categories may change depending on respondents answers to Q4.5.
NOTES
1. This Table uses the responses from Q's 4.4 and 4.5 of the VWQ.
2. Attention should be paid to differences between high and low status households and between old and new woodlots. If a high proportion of households, especially low status households, believe that the woodlot is the best use of the land this would suggest widespread community support for the woodlot.
3. If many households believe the land should have been used in other ways this may reflect a genuine disagreement or that the purpose of the woodlot has been inadequately explained and understood.
4. Pay particular attention to the "new" and "old" results as opinions may change as the woodlot matures and begins to yield tangible products. Compare results to other relevant Tables e.g. VW4, VW7, VW9 and VWIO.

168
,.bl. VW14: OPINIONS REGARDING SPECIES MIX IN WOODLOT
Villagers Excluding Village Leaders
1. Villagers who agree with species mix:
Low Status High Status AU
2. Preferred species of villagers who disagree with sP"cies mix:
___ il
Woodlots
Old New All •••••••• Percent··--·-··
3..1 Specify and group species appropriately. A void making the list too long. Percentages are to be calculated as proportions only among those who disagre'e with present species mix.
NOTES •
1. The data for this Table come from responses to Q's 4.6 and 4.7 of the VWQ.
2. This Table, like ,Table VW13, provides a comparative basis for estimating the extent of consultation and participation. If significant numbers of low status villagers disagree with the species mix this might suggest that their interests have been ignored.
3. Only if the number of respondents who disagree with the species mix is substantial (say, more than 2S percent) should the second half of the table be prepared. Whether the proportion agreeing or disagreeing changes as the woodlot ages should be examined.

169
Table VW15: EXTENT OF CONSULTATION WITH PERSONS WHO DISAGREE ABOUT SPECIES MIX IN WOODLOT
Villagers Excluding Village Leaders who did not or could not make their ,iews known
Low Status High Status All
NOTES
Woodlots
Old New ······Percent· .. ••
1. This Table is to be compiled from the responses to Q 4.8 of VWQ.
2. These data should show whether those who are dissatisfied with the woodlot had an opportunity to express their views, and whether that opportunity was greater for households of higher status than for those of lower status.
3. If the consultation process is working the figures for "new" woodlots should show an improvement (or at least no worsening) over those Cor "old" woodlots.

170
Table VW16: VILLAGERS OPINIONS ABOUT PLANS FOR DISTRIBUTION OF WOODLOT PRODUCE
I. Villagers reporting no plan exists 111
Low Status High Status All
2. Villagers who disagree with plan f&I
Low Status High Status All
Woodlots «I
With M.P. Without M.P. Old New Old New ••••••• -•• -•• Pe ree nt --_ •• __ •• _.
aJ In addition to the "old"·"new" breakdown responses must be classified according to the actual presence or absence of management plans (M.P.). This information is to be found at the very beginning of the questionnaire.
111 As a proportion of all households in the sample when allocated to the relevant "cells" of the Table.
f&I Proportion of those who disagree' i.e. those who answered "no" to Q 4.10.
NOTES
1. Responses to Q's ·4.9 and 4.10 of the VWQ provide the data for this Table.
2. Part I of this Table provides the basis for judging the extent to which plans are rightly or wrongly believed not to exist. These responses might indicate that extension work has been inadequate and/or that there was a low level of consultation and planning by officials. Greatest emphasis, in drawing conclusions, should be placed on the situation reported for old woodlots, for obvious reasons.
3. Where there are a substantial number of respondents who disagree with the actual or proposed system of forest produce distribution, a table should be constructed from responses to Q 4.11. Such information should guide policy reformulation and the preparation of future plans.

171
Table VW17: BELIEFS ABOUT THE MANAGEMENT OF THE WOODLOT
1. Old Woodlots
Villagers correctly believing Leaders correctly believing
2. New Woodlots
Villagers correctly believing Leaders correctly believing .
Agency Responsible for Management II Don't
Panchayat Forest Dept. Other Know ••••••••••••••••••••••••• Pe rce n t ••••••••••••••• ----••• ---•••
aJ Classification to be based on the actual situation using data at beginning of the Questionnaire.
NOTES
1. This Table is based on the responses to Q 4.12 of the VWQ.
2. If the proportion of respondents having incorrect beliefs or not knowing who manages the woodlot are substantial then this would sug· gest that more extension and information work is necessary. Incorrect beliefs by leaders would be particularly serious.

172
Table VW18: BELIEFS ABOUT PANCHAYATS' ABILITY TO TAKE OVER WOODLOTS MANAGED BY FOREST DEPARTMENT
Villagers Leaders
Woodlots Woodlots New Old New Old ------------Percent------------
1. Believe Panchayat could not take over i/
2. Don't know
3. Reasons for that belief: hi
a) No managerial skills b) Village factions c) No technical skills d) Not enough labor e) Other
i/ Those who answered "no" to Q 4.13. hi Reasons expressed by those included in section I of Table. These percen
tages may not sum to 100 as answers are not mutually exclusive.
THIS TABLE (VWI8) AND TABLES VWI9 AND VW21 ARE BASED ONLY ON RESPONSES FROM VILLAGES IN THE SAMPLE THAT HAVE WOODLOTS MANAGED BY THE FOREST DEPARTMENT. THAT IS, RESPONSES IN THE QUESTIONNAIRES ARE TO BE USED FOR THESE TABLES ONLY IF THE RESPONDENT CORRECTLY STATED IN Q 4.12 THAT THE FOREST DEPARTMENT MANAGED THE WOODLOT.
NOTES
1. This Table, based on the answers on Q's 4.13 and 4,14, provides an indication of the reasons why people believe the panchayat is ilIequipped to take over the management of the woodlot. The opinions of leaders should probably be given greater weight than the views of villagers. If the constraints are ones which could be eased by training and advice then this provides a guide for future action.
2. Of equal importance however is the inverse of section one of the Table - that is, those who believe the panchayat could take over. If this is a clear majority (especially amon, leaders) then the Forest Department should identify (from the survey) which particular village woodlots are involved and act accordingly.
3. Care should be taken, however, not to draw erroneous conclusions. If most respondents don't know (hence no opinion) than this signals that the issue is premature and has not yet been considered widely in the village.
4. This Table must also be examined in the light of the results in Table VW19.

173
Table VW19: REQUEST FOR TRANSFER OF WOODLOT MANAGEMENT TO PANCHAYAT AND REASONS FOR NON·TRANSFER
1. Claiming that transfer requested hi
2. Don't know
3. Reasons why not transferred t;}
a) Too early b) Lack of managerial capacity c) Transfer formalities not complete d) Limited by agreement e) Other
aJ The "old"-"new· breakdown may be unnecessary. hi Those answering "yes" to Q 4.1 S.
Villagers Leaders
Woodlots 1I Woodlots aJ Old New Old New -------------. Pe ree nt ---------------
t;} As a percentage of those claiming that transfer has been requested. Percentages may not sum to 100 as answers are not mutually exclusive.
NOTES
1. This Table is based on the responses to Q's 4.1 Sand 4.16 of the VWQ.
2. If, and giving greatest weight to the responses of leaders, the majority of respondents have asked for transfer then the F.D. should take note of the stated reasons causing delay and act accordingly.
3. If few seem to have requested a transfer then this provides a basis for further enquiries to establish why this is so. Table VW20 should also throw light on this matter.

174
Table VWlO: REASONS FOR CHOOSING A MANAGED WOODLOT
Reasons aJ
No funds Inadequate managerial experience Other financial priorities Village factions Lack of leadership Other
Villagers Leaders
Woodlots Woodlots Old New Old New -----------.-Pe ree nt --------------
i/ As beforet the reasons are not mutually exclusive.
NOTES
1. This Table is based on the answers to Q 4.17 of the VWQ.
2. On the basis of this Table inferences should be drawn about the most important factors determining the choice of a managed woodlot. Attention should be paid to the extent that villagers and leaders views differ.

175
Table VW21: REASONS WHY PANCHAYATS CANNOT TAKE OVER MANAGEMENT OF WOODLOT IF COSTS WERE RECEIVED AS GRANT OR LOAN
Villagers Leaders
Woodlots Woodlots Old New Old New ••••••• -.... -. Pe rce nt ---_ •••••• _ ••
1. Believing Panchayat could not take over aJ
2. Don't know
3. Reasons why Panchayat could not take over hL
a) No managerial skills b) Village factions c) No technical skills d) Insufficient labor e) Legal problems f) Other
y Those answering "no" to Q 4.18. QJ Reasons are not mutually exclusive.
NOTES
1. This Table is to be compiled from the responses to Q's 4.18 and 4.19 of the VWQ.
2. If the number of respondents believing that the panchayat could not take over is substantial, the Table provides an interesting basis for assessing whether adequate technical assistance is given to villagers to enable them to take over management of a woodllot. Of equal interest, even if this assistance is provided, is whether village factions appear to present a serious obstacle to community management.
3. When the percentage of respondents who provide "other" reasons is more than 5 percent, the reasons should be listed in a footnote to the Table.

176
Table VW22: REASONS FOR CHOOSING A SELF-HELP WOODLOT
Villagers Leaders
Woodlots Woodlots Old New Old New --------------Pe ree nt -----•••••• --.
Reasons Ii
a) Sufficient Funds b) Village Leadership c) Competence d) To keep all income e) Other f) Don't know
i/ Reasons are not mutually exclusive and may not sum to one hundred.
NOTES
l. Based on answers to Q 4.20 of the VWQ providing respondent also stated in Q 4.12 that the panehayat manages the woodlot.
2. Of particular interest will be whether there are noticeable differences between the responses of villagers and leaders or whether many villagers "don't know" thus signifying a lack of consultation.
3. Additionally, the Table will show whether the reasons are changing with time, presumably as a result of widening knowledge about woodlots and their management.

177
Table VW13: SOURCES OF SEEDLINGS FOR PRIVATE PLANTING
Leaders
Villagers
Low Status High Status All
Respondents Planting Trees Average No.
Seedlings No. Percent Planted
if Sources are not mutually exclusive.
NOTES
Sources J.I
F.D. Private Other Nursery Nursery Sources ················Percent···············
1. This Table is based on the responses to Qs 5.1, 5.2 and 5.3 of the VWQ.
2. The results will be of interest to F.D. management, particularly if low status villagers obtain most of their seedlings from private nurseries or other sources. These can be specified if significant.
3. It may be profitable to repeat the table or at least the first three columns separately for "old" and "new" woodlots. This may indicate whether there is any relationship between the presence of a woodlot and private planting.

178
Table VW24: REASONS FOR NOT PLANTING SEEDLINGS
Reasons 1/
Insufficient land No time Lack of desired species No transport Insufficient labor Distance to nursery Did not know seedlings were available Other
1/ Reasons are not mutually exclusive.
Villagers
Low Status High Status (N- ) (N- )
.•..••••.••. Pe rcent············
.ll! .ll!
ll! Percentages to' be calculated only among respondents answering "no" to Q 5.1.
NOTES
1. This Table is based on the replies to Q 5.4 of the VWQ.
2. This is an important table which should be compared with the results of the Farm Forestry Survey. It may be that a greater number of persons of low status indicate that insufficient land, lack of time and labor prevent private tree cultivation. Such responses, however, would indicate the need for greater flexibility on the part of the Department in order to reach such persons and to devise means by which tree cultivation can be encouraged among them. If the responses indicate that the nursery is too far away, or that there is a lack of knowledge about seedling distribution, the Department should look into the pattern of nursery location and examine the extension system.

179
Table VW1S: VILLAGERS SOURCES OF INFORMATION ABOUT WOODLOTS
All Villagers Low Status High Status
Woodlots Woodlots Woodlots Old New Old New Old New •••••••••••••••••••••••••• Percent ••••••••••••••••••••••••
I. Source
Radio T.V. Newspapers Posters, Signs F.D. Staff Agric. Staff Other Govt. Dept. Voluntary Agency V illage Leaders Friends, etc. Other
2. Those who have not heard about woodlots
NOTES
l. The responses to Q 6.3 of the VWQ are to be used for this Table.
2. This Table provides useful information for the extension wing of the Forest Department. It may provide evidence about the effectiveness of different methods of communication, as well as an indication of those who have not been reached by any method.

180
Table VW26: CHARACTERISTICS OF SAMPLED RESPONDENTS
Villagers ( N
Woodlots Old New All
Proportion landless (%)
Average operated area (ha) lJ
Proportion male (%)
Proportion female (%)
Proportion below poverty line (%)
Proportion SC or ST (%) hi
II Based only on respondents who report that they do cultivate some land. ltI Scheduled caste or tribe.
NOTES
1. The Table is to be calculated from the responses to Q 6.1 of the VWQ and the details recorded directly by the interviewers in Part 1.0 of theVWQ.
2. This Table, although presented last here, should be presented near the front of the report as it presents data which will allow the validity of all subsequent comparisons between groups to be assessed. It also provides a check on the extent to which the actual sample conforms to the design.

181
VIII. THE MANAGEMENT AND IMPLEMENTATION OF M&E OPERATIONS
The main elements of the M&E system thus far delineated are,
(a) the monitoring of seedling production and distribution through nursery returns;
(b) the monitoring of social foresty plantations through plantation returns;
(c) the completion of a Quarterly "All India" Monitoring Report;
(d) the despatch of The Monthly Financial Progress Report;
(e) the monitoring of forestry produce prices through six monthly observations in selected markets;
(f) the on-going evaluation of farm forestry through periodic sample surveys;
(g) the on-going evaluation of village woodlots through periodic sample surveys;
(h) the on-going evaluation of strip plantations, RDF and other plantations through rapid reconnaissance; and,
(i) the management of other studies of various kinds undertaken by the M&E Unit or other qualified institutions.
In this chapter, the way these elements should be organized and managed is discussed. Throughout, the discussion is guided by the dual objectives of how best to define and meet the information needs of program management. As such the Chapter is addressed mainly to the senior staff of the MEU whose job it is to design and manage the M&E program.
The chapter is organized into four main sections. The first deals with the essential monitoring functions listed above: items a, b, c, d and e. The second outlines key aspects of the implementation and management of the main on-going evaluative functions: items f and g. The third section briefly covers issues relating to the remaining evaluation functions and special studies: items hand i above. Finally, section four ties all together in a discussion of overall implementation and work planning. Although it facilitates discussion, the reader should note, that this classification is primarily for convenience of presentation and much of what is said in anyone section applies with equal force to the others.
1. The Implementation and Manalement of Monltorlnl Operations
The successful implementation of the unit's monitoring activities is predicated on two axioms. First, that the unit is, and is seen to be, an integral part of the management system of the social forestry program. Second. that monitoring information and reports are delivered in strict accordance with a pre-arranged timetable agreed by program management.

182
Program managers, experience has shown, commonly complain that monitoring and evaluation units do not provide information that is either relevant. or timely. This is a reflection of mutually reinforcing faults by both parties. On the one hand, management may perceive the unit to be imposed from outside or may not understand what the unit can or should do to assist them. On the other hand, monitoring and evaluation units frequently embark on work programs which disregard the limitations imposed by available resources and, consequently, deliver results with long delays and consequential loss of credibility. Moreover, unit staff often lack the proper professional Qualifications and hence produce poorly focused or irrelevant material. Ineither case it leads to the unit being disregarded and disowned. and hence to disillusionment and disinterest by unit staff. More seriously, MEUs sometimes fail to become part of the management structure because they do not maintain an adequate dialogue with management and, therefore. fail to comprehend what information is needed.
Program management and M&E staff must be alert to these potential difficulties and work closely together to a void them. If monitoring functions are not integrated with management then the unit will be left with only the evaluation functions and will become isolated and suspected of being an unsym-pathetic critic.
In short. the ground rules for the successful implementation of the unit's monitoring functions are;
(a) to be receptive to program management's information requirements;
(b) to define in discussion with management an agreed reporting timetable;
(c) to obtain the necessary data in time to avoid delays in analysis and reporting;
(d) to analyze these data as they are accumulated;
(e) to present the results objectively with clear recommendations about actions that seem necessary and, in accordance with the agreed timetable;
(f) to discuss the results with program management; and
(g) to be responsive to the changing needs of management as the social forestry program develops.
These simple ground rules require a single-minded approach to implementation and effective staff control. They also require careful liason with other sections of the program. especially those who are to supply the unit with raw data (e.g.. range and nursery staff. accounting staff. etc.). This will ensure that goodwill is not lost and that returns are submitted promptly when they are due. Forms that are to be completed by other staff should be carefully designed and easy to read. Adequate instructions and guidance on their completion must be provided and realistic deadlines established. To do less than this is to invite failure.
2. Tbe IlDplelDeDtatloD aDd MaDaaelDeDt of the MaiD OD-aolna Evaluation Activities
We have defined the unit's main on-going evaluation activities to be the farm forestry and village woodlot sample surveys. It is one thing to

183
understand the purpose and methods of designing a sample and constructing a questionnaire. Quite another, to put a complex, widespread survey into operation in the field with at least a reasonable chance that it will ultimately produce information of sufficient quality (accuracy and validity) to be used in the analysis to answer the questions posed at the outset.
Different surveys require different methods of implementation, organization and management. In the context of the sample surveys related to the on-going evaluation of farm forestry several interrelated steps must be undertaken. Some of these are overlapping and can be performed by different people during the same week or month. Resulting issues of time management and work programming are more comprehensively examined later in this chapter. Here, the major steps involved in undertaking the farm forestry surveys are considered together with what must be done if each step is to be properly completed. The major steps in the process and the elapsed time each is likely to require are as follows;
(a) test the questionnaire (2 weeks);
(b) reproduce the questionnaire in bulk (4 weeks);
(c) design the sample (2 weeks);
(d) select the sample (8 weeks);
(e) train field staff (2 weeks);
(f) make all logistical arrangements (2 weeks);
(g) undertake and supervise field work (8 weeks);
(h) execute data processing and analysis (8 weeks); and
(i) write and issue report(s) (6 weeks).
The procedures involved in designing and testing the questionnaire were discussed in detail in Chapter IV. The time required for this should not be underestimated. Once finalized, the questionnaire must be reproduced in sufficient quantity to fully match the number of expected respondents, and to allow a margin for those that will be used in training, additional reference copies, and loss through spoilage. Typically, a margin of about 10 percent is sufficient to meet these additional requirements. It is highly desirable for the questionnaire to be printed rather than cyclostyled. Printing improves legibility, has a generally superior appearance and, as a result, usually inspires investigators to neatness and completeness.
Simultaneous with the above, the design of the sample should be undertaken as outlined in Chapter VI. Immediately thereafter, the longer process of sample selection must begin. Although a brief description of the sampling design was provided in Chapter III, and more details were presented in Chapter VI, there are several practical matters that require further elaboration.
The first step is to create a complete list of all nurseries for each zone in the· state together with the number of deliveries (distribution serial numbers) contained in each register. Once the nursery monitoring system is in operation this should be a simple matter of updating the unit's nursery records, but prior to that the lists must be specially created. For this purpose A Statement 0/ Seedling Recipients should be sent to each District

184
or, if necessary, each nursery to obtain the name, location and total number of deliveries by year for each nursery in the District. For the . first year, the field staff may be required to visit some Districts and nurseries to obtain this information. Field staff and their supervisors must be scrupulous in ensuring that the information collected at this stage is complete and, in particular, that the number of deliveries for each year in each nursery are accurate. 11
The next step is to assemble this information at headquarters and arrange it in the form of a stratified sampling frame. That is to say, for each zone, all registers of equal age should be grouped together and arranged in ascending order of size as measured by the number of individual deliveries. If computer facilities are available, the computer program described in Chapter VI or a similar one should be used. This program automatically sorts the registers in ascending order and selects the registers and serial numbers of each delivery to be sampled. If the sample is to be drawn by hand, the procedures set out in Chapter VI, to select the serial numbers of the deliveries (farmers) to be sampled should be followed.
The actual matching of selected (sampled) deliveries to those in the selected (sampled) registers, and hence respondent selection, must be done by the interviewers during the survey field work. The logical process would be for an interviewer to visit one of the selected nurseries allocated to him, identify the selected register of deliveries, select the respondents, organize the respondents into a schedule of visits (such that travel time is, as far as possible, minimized), and then commence the interviews. Senior M&E staff must prepare detailed and precise guidelines, in the form of a field manual, covering all actions necessary to successfully complete this succession of tasks--these guidelines are, of course, likely to vary from state to state. Although the sampling design for the woodlot survey is different from that for the farm forestry survey, there arc many aspects that are similar. Hence, similar detailed guidelines for investigators should also be prepared for this survey (see also Chapter VI),
With the Questionnaire ready and the sample of registers selected, field staff can be trained in the specific purposes of the sample survey: the techniques to be employed and all aspects of the questionnaire. Such training should last about two weeks and be sharply focused on the purposes of the sample survey and the particular techniques that will be used. Y
A structured interview. as proposed for the farm forestry and village woodlot surveys, is only as good ~s the questions it contains and the abilities of the interviewers to ask the questions and to faithfully record the answers. Question writing is almost an art form, requiring a good sense of language as it is spoken and of the ways in which intended respondents view the topic in question, The asking of the questions requires yet other skills.
11 As noted in Chapter VI, ideally, only deliveries to individual farmers should be included in this total. In practice, however, it is likely that deliveries to institutions and repeat deliveries to farmers in the same year will be included in the nursery registers. Until such time as separate lists are maintained by nurseries for each category of delivery, it will be necessary to make do with these lists.
1..1 This applies to the first time the farm forestry or the village woodlot survey is undertaken. In subsequent rounds the training period could be' shortened to about one week providing the same field staff continue to be employed.

185
First and foremost is a good command of both the spoken and written language. Second, the interviewers need to be impressed with the necessity of asking questions as printed in the questionnaire or in a neutral, standardized form in order to provide the same stimulus to all respondents and thereby help minimize non-sampling error. Third, interviewers need confidence in themselves and in the utility of the study. Fourth, they must be precise and thorough. Fifth, they should be friendly, courteous and inspire trust. Finally, in the context of the survey work outlined in this Guide, they must have a thorough grounding in the principles of forestry and the objectives and mechanics of social forestry. It should not be difficult to find interviewers with the above qualifications by carefully screening junior field staff or employing and training suitable candidates from inside or outside the department on a temporary basis.
The training of interviewing staff for structured interviews ordinarily involves the following steps. First, recruiting interviewers with the characteristics listed above. Second, intensive short-term training in the purposes of the survey, the intent of questions, the necessity of asking the questions as printed and the importance of carefully recording the responses. A useful training device is to set up role-playing simulations in which prospective interviewers interview each other before their peers, with the instructor commenting on proper procedures and mistakes. Third, it is useful to send interviewers out with a "practice" interview and to thoroughly go over their returned questionnaires with them, noting and correcting any errors. Field interviewers should also be given careful instruction in how to prompt a respondent and how to politely probe a respondent's answer (by further subsidiary questions) to either amplify or verify the response. The structure of a suitable very intensive one week training course is given in Figure 8.1. Such a course could easily be modified to span two weeks if .1ecessary.
It is strongly recommended that periodically all field staff involved in conducting surveys be brought together by the field supervisors for one day at times when surveys are not being undertaken. At such meetings, information and experiences in undertaking field work can be discussed and shared, new ideas and techniques explored, and information regarding future work disseminated.
In addition to participating in the training arranged for interviewers, field supervisors should be given specific and careful instruction in the management of the surveys and investigations entrusted to them. They should be counselled in their duties and taught how to encourage good work from their staff as well as how to effectively discipline poor performers.
The organizational and logistical arrangements for both the farm forestry survey and the village woodlot survey must be carefully thought out and implemented. Interviewers must be given approximately equal work loads, and efficient procedures for distributing blank and returning completed questionnaires must be evolved. In situations where questionnaires have to be carried over long distances, simple but sturdy containers should be provided in order to protect them from loss and damage. If interviewers are not allocated motorcycles, they and their supervisors should be divided into teams and be allocated a jeep and a driver. Each team should be allocated a fixed number of nursery registers, suitably ordered to make a convenient "touring" circuit. The logistics then become simple as each team would proceed, in order, to their nurseries and at each, identify the respondents, complete .the interviews and then move on to the next assigned nursery register. The above may appear to be elementary procedures and precautions, but it is suprising

186
Figure B.1. OUTLINE OF FIELD STAFF TRAINING WORKSHOP (FIVE DAYS)
DAY 1
DAY 2
DAY 3
DAY 4
DAY 5
Morning - Background, purpose and objectives of social forestry;
Afternoon - General orientation, scope of work, allocation of tasks;
- Procedures for selection of respondents from nursery registers.
Morning - Introduction to techniques of observation and interview;
- How and how not to ask Questions and gather information;
Cultural aspects of questioning respondents
Afternoon - Practice session
Morning - Introduction to schedules, and how they should be filled in;
- How to deal with non-responses and non-cooperation;
- Detailed explanation of the purpose and difficulties of each Question;
Afternoon Role playing with Questionnaires;
- Practice with setting up interviews.
Morning - Explanation of how to lay sub-plots and 'count and .measure trees;
- Calculation of averages;
- Use of random numbers and conversion of local units;
Afternoon - Practice session (outside) in laying sub-plots.
Morning - How to weigh forest produce;
- Use of scales and balances;
- Rounding to nearest whole numbers.
Afternoon - Practice session (outside) with scales and balances and samples of forest produce.

187
how many sample surveys are executed in an unsatisfactory way, or are completed after long delays, or fail, because inadequate attention is paid beforeand to these basic issues.
Once the survey begins, and if all preparatory steps have been properly taken, operations should go smoothly. Nevertheless, interviewers must be supervised and problems will arise. Supervision plays an essential role in the conduct of any sample survey. It is at once a method of maintaining data quality, reducing non-sampling error, solving the particular problems of interviewers and mollifying the occasional distressed respondent. It is also a disciplinary tool to ensure that interviewers perform their tasks correctly and on time and do not fabricate data. If a supervisor is to perform these duties properly, apart from being suitably experienced and able to control and organize junior staff, he must not be overburdened. A supervisor is responsible for checking all work completed by his interviewers each day and should be present for at least one interview per interviewer each week. It is also recommended that higher level headquarters staff should, as a broad rule of thumb, aim to spend at least one-half of their time in the field when a survey is in progress advising field staff, solving the more difficult supervisory problems and forming a firsthand impression of the quality of the survey work and farmers' reactions to the social forestry program.
The primary responsibility for the quality of the field work and the resulting data rests with the supervisors. No questionnaire should be released from the field to headquarters before it has been thoroughly vetted by the appropriate supervisor. Part of this quality control work should be interview validation. This should take the form of the supervisor undertaking checks, for a small subsample of respondents, to ensure that the correct respondent has been interviewed and that key data is correct. He should also watch his interviewers conduct interviews and periodically undertake an interview himself either to demonstrate how it should be done or to completely verify a suspect return. When questionnaires are checked (as far as possible this should be done in the presence of the interviewer), a cursory perusal seeking completeness and neatness is not enough. Key questions should be carefully scrutinized and the answers cross-verified. Finally, supervisors should add explanatory notes to the questionnaire whenever this might avoid confusion or improve understanding during data processing.
Long before all the field work for the sample survey is over, completed questionnaires should be passed to headquarters for preliminary checking and cataloging. This may produce questions which can be dealt with while staff are still in the field. At the ,end of the sample survey, field staff should return to headquarters to assist with data processing. This work is described in some detail in Chapter IX. Nevertheless, one important matter remains--the training of field staff in what is expected of them when they embark on data processing and tabulation. This training should be provided before they commence such work and be undertaken by the unit's statistician. It should be brief. one or two days is probably ample. and stress the need for precision and promptness. The final steps that complete the survey cycle are analysis and report writing. These. too. are described in Chapter IX.
Whilst the foregoing has been written with the farm forestry survey in mind. many of the precepts and practices that have been recommended and. as intermittantly noted. apply fully to the village woodlot surveys. Nevertheless. there are a few supplementary matters which deserve specific mention in relation to the village woodlot survey.

188
First, the serial list of possible respondent households and village leaders from which the sample will be chosen should be prepared by the MItE staff alone. They should resist the temptation to let village officials determine who should be on the list or the order of listing.
Second. before respondents are interviewed in any village. the field supervisor should arrange a meeting with the villagers where data collection is planned. This meeting should be attended by both traditional and elected leaders as well as government officials. The nature and purpose of the survey should be explained and Questions answered. If possible. at this meeting the villagers should also be shown how some of them may be selected for the purpose of answering Questions. Experience has shown that the concept of random selection is best explained by reference to lotteries.
Third, as far as possible, household interviews, particularly of poor households, should be conducted in the absence of other officials. There should, in short. be a concerted effort on the part of the unit field staff to reduce to the minimum any influences which might inhibit respondents and contaminate their answers. Since most households below the poverty line earn a substantial portion of their livelihood through services, they should be interviewed at times which do not infringe on their working day and thus result in hurried and thoughtless responses.
3. The Implementation and Management of Other Evaluation Activities, Particularly Special Studies
The remaining evaluation activites of the unit relate to the monitoring and evaluation of strip plantations, RDF, other plantations, tree pallas and the execution of special studies either by the unit itself or by specially commissioned outside agencies. As far as the work related to other plantations or tree pattas is concerned, the guidelines discussed above can, with suitable modification, be used. Special studies do, however, call for additional comment if they are to be successfully organized and implemented~,
Special studies are not a superficial adjunct to the work program, but a tool of high flexibility and versatility. They can be used to respond to particular Questions posed by management or to gain a deeper insight into particular program components or problems, or to address issues which lie outside of the essential activities delineated in this Guide. As implied above, they may be small, Quick and specific or larger and longer and employ more refined research techniques. In general, it is strongly recommended that special studies conducted by the MEU itself should be small in scale and short in duration. More ambitious undertakings should be contracted out to Qualified institutions or individuals. Some. comments on these two situations follow.
Special studies undertaken by the MEU should not disrupt the main (essential) work program. That program is flexible and it should not be difficult to fit special investigations into periods when there are few other conflicting activities (see section 4 below). Moreover, they should only be undertaken in response to either clearly articulated requests from management or demonstrable laps in knowledge identified by the unit itself. Such studies should underlo the same careful process of desiln and planning that has been applied to the main elements of the work prolram in this Guide. Within the unit it is also advisable to clearly allocate responsibilities for each study. Such accountability tends to encourale interest and productivity in the staff desilnated to work on a particular study.

189
The unit should adopt a different approach to studies commissioned from outside individuals or institutions. Outsiders should bo used for work which the unit lacks the resources and specialized skills to undertake itself. This does not, however, imply that the unit is absolved from responsibility for such studies. On the contrary, it should be actively involved in designing and planning them, monitor their progress and provide overall management. Ultimately, the unit must be responsible for the results. This can be achieved if the following simple steps, in chronological order, are followed (note that "consultant" is equivalent to "institution");
(a) preparing terms of reference for the assignment;
(b) preparing a cost estimate--the budget;
(c) preparing a. short list of possible consultants;
(d) inviting consultants on the short list to submit proposals;
(e) evaluating the proposals and selecting a consultant; and,
(f) negotiating a contract with the selected consultant.
The terms of reference (TOR) are the initial statement of what is required and, with any subsequent modifications, eventually form an integral part of the contract. The TOR should therefore be as clear and precise as the assignment will allow. Normally they should contain the following;
(a) a precise statment of the objectives of the assignment;
(b) the scope and timing of the services to be provided;
(c) the inputs (if any) to be provided by the unit; and
(d) particulars of the output (i.e., reports) required of the consultant.
The unit should prepare a budget for the study which is based on its perception of a "fair price" for the work and (for its own use) the cost and probable timing of any required unit inputs. This initial budget should be used eitber in negotiating the final contract or to place an upper bound on what the unit is prepared to pay.
The short list of possible consultants should include only those who have a proven record in the matter proposed for study or who otherwise demonstrate a high level of past or potential competence. To those consultants a letter of invitation to bid for the assignment should be sent. The letter must include the TOR.
In evaluating the resulting offers, the quality and thoroughness of the proposal should be given the greatest weight, within, that is, a reasonable range of prices. If necessary, the consultants should be asked to amplify their proposal (e.g., explain their proposed methodology) in more detail.
Once a consultant has been selected, primarily on technical grounds, the unit should formally negotiate and agree a contract which contains full details of the assignment and the fees to be paid. Obviously, suitable conditions governing performance and the timing of payments should be included.

190
Once the contract °has been agreed and work commenced, the unit should maintain a constant dialogue with the consultants and review progress with them Oat frequent intervals. When the study has been completed, the draft report should be carefully reviewed by the unit and, in discussion with the consultants, ammendments to style or substance introduced. Thereafter, the unit must accept the responsibility for interpreting the report to management and identifying policy or procedural changes that appear necessary as a result.
Finally, it goes almost without saying that these procedures apply equally to the use of academic institutions, private firms or individuals, although in the latter case the procedures may be somewhat less formal.
4. Overall Management and Work Planning
To execute the monitoring and evaluation program according to· the precepts of this Guide requires a high degree of single-mindedness and a refusal on the part of all involved to be diverted to other tasks. Each year requires that a detailed plan of action be drawn up and diligently executed. One year passes inexorably to the next and early slippage will become not only cumulative but compounded, to the point where the system becomes unmanageable.
The most straightforward mechanism for dealing with this problem is the careful construction of a work program. This can be accomplished by preparing suitable bar-charts. The value of such charts cannot be overemphasized. They require, right at the outset, that a clear decision be made about which main tasks are to be undertaken and when. Once this has been settled and the approximate timing of each determined, then each main activity and all related sub-activities must be listed and the elapsed time needed for their execution estimated. With this list, it is easy to identify those activities which are "critical" in the sense that one activity cannot be undertaken until one or more other activities have been completed. The resulting list of critical activities must then be ordered in correct sequence on the barchart. Non-critical activities must be fitted in so that they support and do not hinder the completion of the main elements. It is recommended that such a timetable be prepared initially for two consecutive years and revised, updated and extended at the end of each annual cycle and before the start of the next.
This process is illustrated in Figures 8.2 and 8.3. In Figure 8.2 the main components of the M&E work program are laid out for a typical year. In one sense, however, this picture is not typical as a year when both the farm forestry survey and the village woodlot survey are undertaken is illustrated. In practice, this will occur only in every fourth year or possibly, not at all. Nevertheless, the incorporation of both surveys in this "typical" year serves to illustrate the feasibility of the proposed work program when there is maximum activity. In years when only one major survey is undertaken there will obviously be more "slack" time. This, as argued previously, should be used to undertake special studies.
Figure 8.3 is spread over two years and exemplifies the more detailed planning that is necessary in order to construct a working timetable. Again, this process is illustrated by choosing a situation where the unit is starting operations for the first time and hence, activities are at a maximum. By doing so it is possible to show the several initial steps that are necessary to launch each activity. These initial steps will be much reduced or be completely eliminated in later years.

191
These illustrative bar-charts should not be taken as actual timetables to be applied in practice. Each State MEU must construct an individual work plan suited to its particular circumstances. For example, the annual work programme should be adjusted to reflect different planting seasons. For instance, it has been recommended that the Farm Forestry survey be conducted during April and May on the assumption that the majority of the years planting was done durin8 the previous June to September. This of course allows about eight months to pass before survival rates arc assessed. In states where the main planting season is not June to September the work plan must be rescheduled accordingly. This is easily done, in Figure 8.2 for example, by rearranging the months at the head of the chart so that the first month named is the third month before the start of the main planting season. Thus if the main planting season begins in November the first month named would be August. This strategy preserves a common period of about eight months, irrespective of the timing of the planting season, before seedling survival is assessed and hence has the advantage of rendering survival rates for different States comparable.
Penultimately, each unit must discuss and agree its work program with departmental management in order to ensure that the delivery of reports is consistent with management's needs. Finally, and as stated at the outset, even well prepared work plans will mean nothing unless they arc realistic and managed with the professionalism that should be the hallmark of monitoring and evaluation.

Figure 8.2: TYPICAL ANNUAL TIMETABLE FOR MAIN COMPONENTS OF M&E WORK PROGRAM (in a year when both Farm Forestry and Village Woodlot Surveys are undertaken)
MAIN COMPONENTS OF M6E WORIC PROGRAM MAR APR MA Y JUN JUL AUG SEP OCT NOV DEC JAN FEB MAR
I. MoDtbly FiDaDcial Prolress Report (Telex)
,2. CompiiatioD or ScedliDa Production aDd DistributiOD Data rrom Quarterly Nursery Returns
3. Quarterly GOI MoDitoriDI Report
4. ADDua. CompiiatioD or PlaDtatioD Returns
S. Scali-ADDua. Price Bulletio
6. ADoua. MoDitoriDlaDd Evaluation Report
7. Farm Forestry Survey
I. Villale Woodlot Survey
NOTBS
I. ""''''' ,~_ I'ro.Peu hpo" (Tduj. To be despatched to the NWDB (GOI) .. _ al poaiblc after the cad of tbe moatb.
2. C_".,.,. 0/ S.ellll". ,.rodlU:,ioll IUId Dis,ribu,ion OD'D. Quanerly rentr .. Iro .. allrlCria arc to be lubmined to tbe MEU at the close of each qurlU. TIle MEU a .. I)'_ tbac data by the eDd of the followiDa month.
J. QvGTU," GOI /IItHlilDrill, Report. To be prepared and submitted 10 .... ~ac_at aad the NWDB (GO I) b)' the cad of the moath followina the close 01 t.. qurter.
4. A~ COlflpiialioll 0/ """"iOll Re,,,rru. Returas arc due at the MEU at tJac cad 01 tlae pIa_ti.a acasoa aad mlllt be aaaJyzed in time for iaclusion ia tJac A __ • MAE Repon aad tlae appropriate Quarterly GOI Report.
-
- -- -
s. S.",j-A_IIGI Prke BMlle,;& To be prepared aDd releated b), the MEU i. ~ moathl: ahowa. Alter.aliyc till-moathl, i.teryall could be uted.
6. AnnllGl /IIoni,o,in. IUfd £.111_;011 Repor,. To be prepared at the cad of llae caleadar year aad lubmiued to maaaaemeat b), tbe ead of Jaauar)'.
7. For", Forestry S", •• y. EJapacd haac will be lonaer the fint itme thia ia uadertakea.
I. Villa.e Woodlo, S",.,ey. Preparatioa aad Cltccutioa are iaterruptccl i. order aot to coanict with Farm Foresu, Survey field work.

I.
1.
:I.
.. So
6-
T.
..
&ure 8.3 POSSIBLE START-UP TIMETABLE WHEN M&E OPERATIONS BEG, IN YEAR THREE OF SOCIAL FORESTRY PROGRAM
YEAR 3 YEAR 4
OPERATION M A M J J A S 0 N D J F M A M J J A S
IIONTIILY nM~L paOCaE5S TELEX .) Pnd_--",For_, -.) _ ... 0...-..- --c) ......... NU .... YaaTVItM .) Pnd_"-- -., ___ N..-,. l1li11
c) CeIIecl ___
- - - -II) ~~~ •• -y - - - -.) ~----ry -I'LANTATION aau ... .) Pnd.-F_ .) 1 __ Depew_.' .... OI~r Starr - ---"""'-c) CelIecI .... ns II) ~A_aa1"_ry --
i -QUA.TalLY GOa 1I0.UToaING aEPoaT I .) ____ ~i •• F ... _, - f
.) __ Da ..... _
c) a-ti, ... .,... , - - - - -AlII-ANNUAL pala aULLETIN : .) Pnd_,,--, - I .) '-"- ..... , -
0
c) CeIIecI Data - - -II) .... _ ... Ietia - - -AJQIfUAL ...... POaT .) _All Data -. ) Data AaaI~." a_. Wri.i •• -c) ___ Pnd ..... DiNri .... io. -.A_ I'OaUTaY au.y.y .) o.ip. T_ ~-.. u. -. ) ____ ~-.. H • -c) DaMp ...... -II) --- ...... - --- 0-.) Tnia ..... SIaII -I) ........ -., F .... W ... . ) Tn .... I. Data Pr_i •• -i) Da. Pr~ •• Aulyaia j) ___ ~ ......... _io. -YILLAGa WOOItLOT aU.YEY . ) Daip. T_ Qtoatioauir • -.) ....... _~Uih -c) Dlaipa. .... -tI) ..-. a.ap&c --c) Trai. F .... l1li11 -I) lAaiMica -. ) FicIcIW .... . ) Trailoi .. r ... Data Pw_i •• i) Data ~ ... Au,,..i. j)
a_ ~nt_ ... __ i_
N D J F
- -- -
- -
-- -


195
IX. THE USE OF MICROCOMPUTERS, DATA PROCESSING ANALYSIS, AND PRESENTATION
Previous chapters have concentrated heavily on how to collect relevant data for the monitoring and on·going evaluation of social forestry activities. Before they are useful. these data must be transformed into information that is clear. accurate and timely so that it can effectively informs and guides management actions and policy decisions. This chapter discusses the pro· duction of useful information through efficient and accurate data processing. analysis and presentation.
1. The Role of Microcomputers
In the last two years in India. as throughout most of the world. the cost of microcomputers has fallen dramatically. As a result. their use has greatly increased. While the 1983 workshop in Hyderabad that discussed this Guide agreed that most States would have to rely on manual data processing for the time being. the 1986 workshop in Bangalore resolved that microcomputer facilities should be installed and used for the purposes of monitoring and evaluation from the outset. In accordance with this resolution. this chapter and the accompanying Annexes also provide detailed guidance on the use of a low cost microcomputer system for most of the steps involved in data proces· sing. analysis. and presentation. Since there may be some delay before all M&E Units have an operational computer system. alternative methods of hand tabulation using calculators are also discussed.
Data processing with microcomputers greatly increases the speed. accuracy. and depth of analysis - necessary steps in the production of useful and timely information. Table 9.1 lists many of the elements of monitoring and evaluation described in the Guide and shows whether they are or are not amenable to electronic processing by microcomputer.
Table 9.1: MICROCOMPUTERS AND M&E DATA
Steps Involved in Collecting, Processing, Analysing and Disseminating M&E Data.
1. Design of Data Collection Instruments 2. Sample Design 3. Sample Selection 4. Data Filing and Retrieval S. Data Editing and Checking 6. Preparation of Variables 7. Initial Exploratory Tabulations 8. Cross· Tabulations '& Other Simple Analyses 9. Interpretation of Outputs 10. Statistical Testing II. Econometric Analysis 12. Preparation of Graphs and Other Displays 13. Report Writing 14. Information Dissemination
Can a Microcomputer Help?
Yes No Yes Yes Yes Yes Yes Yes No Yes Yes Yes Yes No

196
As Table 9.1 indicates, microcomputers can be used to improve or help almost every stage of the monitoring and evaluation process. They cannot, however, help with the design of sample surveys, the interpretation of outputs or with information dissemination. The drawing of conclusions from the processed data and disseminating these conclusions to management and others are roles that the human analyst must play. Microcomputers are not substitutes for common sense. Clear thinking by M&E staff must prevail. The computer does not think, it merely assists in the process of data handling and manipulation by performing certain tasks -- all of which could be performed manually--with great rapidity and accuracy.
Although this Guide strongly endorses the earliest possible introduction of microcomputers for monitoring and evaluation, there are several issues which should be considered prior to instaIling computing facilities. Firstly, there must be interested personnel who can be trained in operating and supervising the system within the MEU and who would be fully responsible for these activities. AdditionaIly, some sort of technical back-up service (perhaps provided by a part-time consultant) is usually required to support and help develop the system's software and range of operations. Secondly. the installation of a computer system does not obviate the need to maintain a capacity to process data manuaIly and should not be used as an excuse for delaying data processing if appropriate software is not available or there is a physical breakdown. Thirdly, it is important to conclude a maintenance contract with the supplier and to have easy access to repair services and, ideally, to have a second microcomputer which can serve as a back-up system as well as cater for periods of peak demand. Fourthly, errors in data organization and variable definitions are not usually tolerated by computers and hence, careful planning and data handling are essential in order to maximize the benefits of computer processing. In any system poor data will produce poor (invalid) results: with electronic processing the use of poor data is usually more obvious and difficult to correct.
Additional guidance on the resources required to install a microcomputer system is given later in the chapter and specifications for recommended hardware and software, tailored to the M&E work outlined in this Guide, are listed in Annex I to this chapter.
2. Data Preparation: FlUnK, Coding, Entry, and Editing
The systematic collection of data requires an equally systematic approach to data processing. The first step is the establishment of a simple but efficient system of data retrieval. This is little more than the organization and maintainance of a filing system such that any questionnaire or return from past or present surveys can be retrieved and studied speedily and on demand. A physical filing system structured by type of surveyor report, by District or Zone, and by year is the minimum that is required. Each questionnaire or report should be serially numbered and a master list maintained. This physical system can then serve as a back-up to a system ofelectronic data storage which should be structured according to the same overall categories (i.e.type of survey, year, zone) and use precisely the same serial numbers for each questionnaire so that the paper and the electronic records can be retrieved and checked against each other.
For both the physical and (if installed) microcomputer storage systems, precautions must be taken against loss and spoilage. One of the most effective precautions is to appoint one person as custodian of the files and to be responsible for accepting, cataloluing and releasing records and main-

197
taining a detailed account of the whereabouts of any given questionnaire or electronic disk at any given time. With electronic records~ it is essential that two back-up copies of the data are maintained, particularly where power supplies are uncertain, so that even if there is a power failure during the copying of a back-up file (writing to disk) and the data is lost, another copy is available.
As all data is initially received in physical (paper) form, the first task after they are received from the field must be to number them and log them into the filing system. Afterwards they can be released for final coding and editing. These latter steps must always be completed before data or records are entered in the electronic storage system.
Most of the responses in the proforma questionnaires set out in earlier chapters have already been pre-coded. However, each MEU will have to devise additional codes for data particular to their circumstances, for any additional questions which may have been added and for responses to open ended questions. For example, consecutive code numbers will have to be assigned separately to each Zone, District, Nursery, and species encountered -- starting in each case with 1 (or, more precisely, with 01 or 001 depending on the number of digits required) and continuing to the last item on the list of possible responses. Whenever possible lists of these codes should be provided to all surveyors ahead of time so that responses can be coded in the field (see discussion of field investigators manual in Chapter VI). In the case of open ended questions, this generally will not be possible. Hence, these responses should be listed, grouped and assigned a code following receipt of all questionnaires at headquarters.
With computer processing, the most difficult and important coding issue concerns missing data. Each software package (program) usually has its own conventions for coding responses for which there is no answer either because the question was not applicable or because no answer was obtained. The officer in charge of data analysis must decide, based on the type of analysis intended, whether a missing response is logically a zero or should be treated as a missing value which should be set aside (exluded) from a particular tabulation or calculation. An answer which is logically zero should be coded as such (i.e. "0"), while a missing data response should be coded according to the default conventions of the processing software being used. While data base management software will often allow an alphabetic character to be used (i.e. "m" for missing), statistical software usually requires a particular number such as "999" or "-9" or even "-99.99" but sometimes such programs will accept blanks. If the missing data coding convention is not known before the survey begins, it is recommended that the letter "M" or "MM" or "MMM" etc. be used in the questionnaires to reduce confusion. These can later be recoded according to the requirements of the software.
As discussed in Chapter VIII, field supervisors are responsible for checking all questionnaires and reports to ensure that all responses have been correctly recorded prior to submitting them to the MEU. Nevertheless, it is important that MEU staff conduct additional checks on all questionnaires as they are received so that any remaining errors can be immediately corrected while investigators' memories are fresh. Additionally, as field staff return to headquarters following the completion of a survey. their first job should be to check the completed questionaires. At this point however, responsibilities should be inter-changed. No investigator should be allowed to check his own work. Generally three kinds of errors are encountered. First, are simple and obvious errors of commission--a figure written in one place that clearly should have been written in another. the omisssion of a decimal point. a badly

198
formed number or character which may be misleading, etc. These can normally be corrected at headquarters. Second, are more serious errors of commission-a major inconsistency, or obviously impossible answer. Such errors require consultation with field staff and may also necessitate, in the case of systema·tic occurence in a survey questionnaire, a repeat visit to the respondent. As already noted in Chapter VIII, it is the duty of field supervisors to keep such errors to a minimum. Third, are errors of omission--questions or data items that should have been answered but have not. These too may require a "call back" to the source of the information: the nursery for a nursery return, the respondent for a survey questionnaire. Such call backs are expensive and time consuming, hence they should be undertaken only when the erroneous or missing data are indispensible to meaningful analysis. Other cases should be treated as missing observations, either because the data are absent or because they are erroneous and cannot be used.
The process of editing data is a delicate one requIring integrity and consistent judgement. Treating similar types of error differently is worse than not treating them at all. Senior staff of the MEU should themselves examine and edit a sample of the completed questionnaires so that they gain a firsthand impression of the quality of the data and are thus able to give others instructions that will allow them to consistently detect accidental or deliberate errors and omissions.
The next step is to hand tabulate the raw data, or if computer facilities are available, to directly enter the data into the computer. Hand tabulation is best accomplished with large sheets of graph paper in which the variables (question numbers) are written above columns of the appropriate width, and the serial numbers of the completed questionnaires are listed in the first column. Under this system, each row contains the answers from an individual farmer or villager. The completed tabulations can then be checked against the originals and photocopied for safe keeping.
With a microcomputer and interactive software, electronic data entry is easily accomplished by directly entering the data through the keyboard. The most important considerations are the filing system for raw data and the methods used for editing and checking. To make future data retrieval and data manipulation easy, it is recommended that data be entered into a standard data base management software package (such as dBaseIII), although some statistical software packages do allow for some data entry and manipulation. Writing a separate software program for data entry is not recommended as it will inevitably constrain future manipulation by commercially available analysis packages and will reduce compatability as well as increase expense. By coding data, as far as possible, down the the right margin of the questionnaire (as in Chapters VI and VII) or by writing screen input programs, data can be easily entered directly from the questionnaires and stored in interlinked files.
The type of electronic filing system to be used should be carefully considered with expert advice taken at the outset. Whenever there can only be a single response per variable, as is the case with the whole of the Woodlot Survey and with Sections 1-4 and 8·10 of the Farm Forestry Survey, the size of the file is determined by software limits on the number of variables (fields) allowable. However, where there can be more than one response per variable, such as with QS.2, Q6.1, and Q7.1 of the Farm Forestry Questionnaire, 'separate files must be established, each of which must contain the serial number of the questionnaire or record (e.g. FARMNUM) as the first variable. In the coded farm forestry questionnaire presented in Chapter VI, six separate files are marked on the proforma. Since there are no special data problems with the

199
woodlot survey, separate files can be established whenever desired or required by the analytical software employed.
In the case of data obtained through the Nursery and Plantation Returns, as well as that required by the GOI Quarterly Monitoring Report, it is recommended that an electronic spreadsheet program such as Lotus 1-2-3 be used to record the data received. Such programs allow automatic retabulation of results as additional information is received and entered.
Following the entry of data, the next task is to conduct a final data editing or cleaning. Several alternative methods of automatic data editing can be used. If data have been entered using a data base management program as recommended, a subprogram can be written to check each entry to ensure that it falls within a reasonable range of values and that it corresponds to other variables to which it is logically related. For example, it could be decided that when a figure of more than 20 is encountered as the value for the variable "household size" the program would inform the computer operator to double check the input information. Similarly, the program could be designed to check whether the number of seedlings surviving is always less than or equal to the number planted. If even greater reliability is desired, all of the data can be entered a second time by a second operator and the resulting data files automatically compared to identify differences. As with all data processing operations, the personnel in charge of data entry should be familiar with the data being entered and use common sense to help them identify any questionable results which they can then check with those responsible for da ta collection.
3. Variable Preparation: Computation and Transformation
It will have been noticed that for the construction of many of the tables outlined in earlier chapters and for other possible forms of analysis which may be desired, it is necessary to construct higher level variables from the raw data presented in the various proformas. An obvious example of this is the need to compute survival percentages for each farmer's seedlings by dividing the number of seedlings surviving by the number planted. A less obvious example might be the desire to construct an index variable of villager participation in village woodlots by, say, adding one for every positive response to questions 3.1-3.5 of the VWQ, summing them, and treating the result as a single indicator of participation. With regard to monitoring data from nurseries and plantations, there is a similar need to construct variables such as the average survival of seedlings in government plantations by District or the percentage of fodder trees distributed by District, etc. Since these kinds of variables are a kind of intermediate result (as well as being directly useful) which will be used in later analysis, they need to be computed at the outset and stored in a logical position in the data file.
If a microcomputer is employed, such variables can be constructed either by using the editing and file manipulation routines available in the data base and statistical packages or by writing separate programs. Often all that is required is a transformation of existing data. For example, in order to construct a single variable of the number of Livestock Units per household, all that is required is a command which multiplies the number of each different kind of livestock by the chosen equivalent livestock unit value and the summation of the result. This might be written as follows: LSU - (1.2*BUFF)+ (l.CATTLE)+(.3*GSHEEP). While this kind of variable transformation is easily executed, it requires considerable careful planning and forethought. This is yet another argument for the use of standardized questionnaires, hardware and

200
software so that a basic set of software routines (programs) can be developed which will require only minor modifications in order to be used by each State MEU.
4. TabulatloD aDd IDltlal ADalysls
Following the construction of variables the analyst should commence analysis through exploratory manipulations of the data obtained in the field. This process is accomplished by critically examining the data through the use of simple techniques of analysis. The main tools are the construction of simple tables, graphs, averages, and distributions, and selected cross-tabulations.
Chapters VI and VII contain sets of suggested initial tabulations which will allow tentative answers to many of the questions being asked through the farm forestry and village woodlot surveys. These tables, by no means cover all of the tables which the data analyst will want to construct and examine. Depending on which issues are of particular concern to management and policy makers, additional tables which arrange the data in other, perhaps more revealing ways, should be developed. The analyst should, drawing on his own experience of field conditions and constantly search for explanatory relationships in the data which will allow more formal hypotheses to be postulated and tested.
Alternatively, it is likely that some of the suggested tables will have to be eliminated from the final analysis if the data are not available or sub-sample sizes are too small to permit meaningful conclusions. In such cases, however, higher order techniques (e.g. regression analysis) may be necessary. As a rule of thumb, if the number of observations in a sub-sample falls below 25 then calculations based on them are unlikely to have adequate statistical validity. In these cases it may be better to state that the figure is too small to report than to provide information which may be used by managers, untutored in statistical confidence levels, and result in decisions based on spurious accuracy. Likewise, the presentation of figures with more than one decimal place is rarely called for and rounding to the nearest whole number is generally preferable as it is wrong to claim by implication a level of accuracy which is greater than the accuracy of the original data.
The classic and proper way to conduct this initial analysis of the results is to formulate in advance the questions and hypotheses which are to be confirmed or disproved by the analysis. While the questionnaires and data collection proformas have been developed through an iterative process based on a number of explicit and implicit hypotheses and questions, these have not been formally set out. In part, this to encourage each MEU to formulate its own hypotheses on issues important to management and policy makers. Hence, each Unit is encouraged to interact closely with management to enable the most relevant analyses to be identified.
If manual data processing is employed at this stage, all work must proceed from the basic tabulation sheets constructed during data preparation. This work will be straightforward if the initial tables presented in Chapters VI and VII are used as the basic pattern. Calculators will be essential and with them the calculation of standard deviations and other statistical properties quite possible but time consuming. The use of a microcomputer at this stage greatly speeds analysis and vastly increases the amount of exploratory analysis which can be accomplished in a short time. The use of an appropriate statistical software package such as those suggested in Annex I to this chapter is highly recommended for such exploratory analysis. These packages are

201
ter is highly recommended for such exploratory analysis. These packages are menu diven and interactive, meaning that the analyst is required to have only a basic familiarity with computer operations and does not need to know any specialized computer languages. An example of the kind of "menu" used in statistical analysis programs, together with sample computer outputs, is presented in Annex II. This, however, is not to say that the analyst should not understand the analytical procedures being used or the theory on which they are based. Such a lack of understanding is dangerous and may lead to seriously deficient conclusions. Although the principles of statistical analysis can be found in any standard statistics text and need not be repeated here, Annex III to this chapter provides an outline of the concept of sampling error, its size, and how to establish the level of confidence that can be placed in the results.
To the extent that the standard tables recommended in this Guide are used, it will also be useful to automate this process by having a program written which is tied into the filing structure and automatically produces this set of standard tables. If, as proposed, a standard set of programs is prepared for all States using a standard language such as Basic, then it should also be possible for this program to be easily modified to accommodate specific changes required by each State or Agency. The advantages of this procedure are substantial, permitting ready understanding and comparison at the Centre (GOI) and greatly reducing initial software set-up costs to each State.
S. Additional Sta tlstieal Analysis
The valuable data which will be collected by the MEVs provide an excellent opportunity to conduct more sophisticated statistical analyses of the results revealed by the initial analysis and tabulations discussed above. In order to conduct such analyses, some knowledge of more advanced statistical analysis is required and computers are a prerequisite for the timely production of results. In any case, a report based on the initial cross-tabulations and tables should always be quickly prepared and not be held up pending additional analysis as this can always be conducted later.
Among the many parametric and non-parametric statistical techniques that can be usefully employed, perhaps the most powerful is the legitimate use of multi-variate regression analysis. While this method is most easily used with variables that have a continuous scale (such as number of seedlings or percentage survival) there are methods of including dichotomous (i.e. discontinuous) variables in the analysis. These methods can be fruitfully employed to determine the relative contribution of different variables in producing a particular result. For example, regression analysis could be used to determine the characteristics (e.g. landholding. household size. livestock population, etc.) of a farm household that are most important in explaining the numbers of seedlings planted. Similarly, survival percentage, as the dependent variable, may be explained by factors such as the use of inputs. the number of seedlings planted, methods of protection. landholdings, etc. The objective, of course. is to determine the relative importance of these factors in explaining high survival or low mortality.
It is beyond the scope of this Guide to examine the many statistical relationships and tests which the M&E unit could use in more thorough analyses. However, units which have or can obtain the necessary expertise are encouraged to engage in such analysis as time and resources allow. This will strengthen and improve understanding of the conclusions derived from the more

202
straight forward tables discussed above and better inform management actions and policy.
6. Information Presentation and Dissemination
The entire effort of collecting, analyzing and transforming data into usable information will be wasted unless that information is effectively presented and used. The principal means for presenting most M&E information is through written reports, including the annual monitoring report and individual reports on each surveyor special study conducted. To be effective, the text and data in each report must be clearly presented, brief and to the point. Correct interpretation will be impossible if essential information is omitted.
All reports should have an "Introduction" which introduces the subject to be discussed, briefly reviews relevant past reports, summarizes the main findings and sets out the organization of the report. The introduction should always be written last, for only then docs the writer have sufficient perspective to address in summary form the main issues. Where an extended discussion of a problem is necessary but not central to the main issues it should be contained in a separate annex or appendix.
Equally, there should be, at the end, a section entitled "Operational Conclusions and Recommendations". Again, this should be brief and recapitulate the main arguments and conclusions reached in the text. Wherever possible specific recommendations should be made. Where this is not possible, the next steps required, such as the need for further study, should be laid out.
The central part of the report should contain sub-headings as appropriate and be written around the main tables of data, with supporting tables relegated to an annex. With properly prepared tables, the text should simply draw the reader's attention to important results and discuss their implications. A detailed descriptien of the contents of each table is to avoided. In some cases, all that may be necessary is a simple statement such as "Table _ shows that in Zone . seedlings planted by farmers have survival rates which arc well below those elsewhere in the State".
Tables should have precise titles which clearly indicate what the table reports. Every table should show the relevant sample size and if percentage values arc reported, the relevant absolute values should also be given. If tests of significance have been undertaken, the table should contain the confidence level chosen (e.g. 95% or z - 0.05), and where appropriate the number of degrees of freedom, etc. (sec also Annex III to this chapter). Generally, a table should stand by itself; it should be possible to read and understand an entire table without being forced to refer to the text that surrounds it.
Alternatively, important numeric results can be presented graphically following the rules noted above for tables. Pie charts. bar charts. line graphs and the like arc very effective ways of conveying important results to busy administrators and policy makers. If microcomputer facilities have been installed the graphic presentation of results can be easily and quickly accomplished without depending on graphic artists. However. since graphics tend to show differences more dramatically. the evaluator must take care not to distort the findings and to include sufficient labels and title information so that the graph can be understood without detailed reference to the text.

203
Annex IV to this chapter shows some examples of simple graphics that can be generated by using of a multipurpose software package such as Lotus 1-2-3 which was also recommended for the recording of monitoring data and drawing the farm forestry sample. More sophisticated graphs and charts can be produced using specialized software and plotters, but are not likely to be required by most MEUs. lJ
The length of the text in the reports themselves should usually be between 3,000 and 5,000 words, excluding tables. Although it is difficult to state categorically what the length should be, to write much less is to risk failing to fully convey the findings while to write more probably ·guarantees that the report will not be read. If longer reports are necessary, it is essential to extract the main findings and write an executive summary which should be placed at the beginning of the report.
Reports must be timely. There is little point in delivering a report dealing with one survey round after the next round has ended. The submission of an evaluation report must be related to the subject reported and the speed with which decisions and operational changes can be made. Monitoring reports, however, are of greatest utility when submitted regularly so that management knows when to expect "progress updates". The volume of data that has been proposed for collection, the allocation of staff and the range of tabulations in this Guide have been designed so that it should be possible to produce the report pertaining to any given round of survey within six weeks after the end of the field survey and for a monitoring report within two weeks of the receipt of data. Preliminary data releases (basic tabulations) should be made available before that time.
Subject to normal procedures, it is suggested that all reports be sent by the head of the MEU to the project or program chief (e.g. Chief Conservator for Social Forestry) for his comments prior to finalization. Once finalized, the report should be distributed widely both upwards to management and policy makers (e.g. Principal Chief Conservator, Secretary, Minister, etc.) and outwards to field personnel (e.g. Conservators and DFOs) according to an agreed distribution list. Copies should also be sen~ to the NWDB and relevant donor agencies.
Report wntmg is, however, only one means of disseminating M&E information. Of equal importance is the participation of M&E personnel in operational, policy making, and planning meetings and staff working sessions during which they should provide information and arguments relevant to the decisions to be made. In addition, M&E personnel should follow-up their recommendations and findings through meetings with appropriate persons in headquarters and in the field. Often, the most important opportunity for this kind of direct follow-up is during the planning of the next project or phase of the current project. For this reason, it will be fruitful for M&E personnel to closely coordinate their work with that of the planning unit. Additional ways of effectively disseminating selected information can usually be found by working with the publicity and communications unit and the training institutions to ensure that important lessons learnt through M&E are widely known and translated into meaningful action.
lJ Plotters are special printers used with computers to produce high quality line drawings.

204
7. Tralnlnl and Resource Requirements for Computerization
As stressed earlier, the most important resource required for effectively making use of microcomputer facilities is interested manpower trained in the use of a computer. Except for the occasional use of a part-time consultant. the availability of packaged software has eliminated the need for a programmer or full time systems analyst. What is required is one or two trained computer operators (three operators for two systems are recommended) who may also be employed in some other capacity such as assistant statisticians or tabulators. In addition, there must be one senior level member of the MEU who not only has received basic training as a computer user, but also has a strong personal interest in increasing and updating his knowledge. Depending on the organization of the unit. this may be anyone of the Unit's professionals (Le. the statistician, the economist, or the sociologist), although, all of these professionals should attain basic computer literacy. It is also important that the head of the unit become familiar with computer operations so that he can effectively supervise the work to be done.
For these reasons, it will be necessary for both the professional staff and the operators to attend short courses on computer use. Only in unusual cases or, perhaps after several years of computer operation, will it be necessary to include extensive training in a computer programming language (such as BASIC, Fortran, Pascal, C, etc.) Sufficient expertise in such languages would in any case require many months of training and will only be sporadically used. The kind of familiarization course which is recommended here can be accomplished in ten days, although it would be valuable to have further part time consultant support available for a short time after trainees are back on the job. It would also be useful for the main users to receive additional training as their interest and the complexity of work increases.
Almost all micro-computers are capable of performing word processing functions. That is acting as a sophisticated typewriter. The memory capabilities of such word processing systems enable reports to be typed complete with tables, stored, corrected as often as necessary and re-printed. This facility greatly speeds the process of report preparation and improves presentation and accuracy. Accordingly, it is advisable for one or two secretaries to be trained in the use of this facility.
A short outline of an initial computer users training course which should be tailored to the specific needs of each social forestry M&E unit is given in Table 9.1.
In addition to trained manpower, of course, money is also required to purchase and maintain the computer system. Annex I to this chapter provides detailed specifications for the hardware and software recommended, together with approximate costs, valid at the time of writing. As specified, the costs arc modest, amounting to Rs.l70,OOO (approx. USS 13,600) for the purchase of one complete system (with an additional computer for back-up) necessary software, and technical support and roughly Rs.31,OOO (USS 2,500) for maintenance, supplies and support each year thereafter. As with other advanced equipment, a microcomputer should be properly cared for and in many States in India. should be housed in an air-conditioned room which will reduce the temperature, and help to control humidity and dust.

Table 9.1
DAY 1
DAY 1
DAY 3
DAY 4
DAY 5
DAY 6
DAY 7
DAY 8
DAY 9
20S
'TRAINING COURSE IN COMPUTER USE
Mornina: Introduction to computer operations: hardware, software, keyboard, disk drives, DOS (disk operating system), languages, etc.
Afternoon:
Mornina:
Afternoon:
Mornina:
Afternoon:
Mornina:
Afternoon:
Morning:
Afternoon:
Morning:
Afternoon:
Morning:
Afternoon:
Mornina:
Afternoon:
Morning:
Practice.
Use of electronic spreadsheet package (e.g. Lotus 1-2-3).
Practice.
Application of spreadsheet to nursery and plantation returns, GOI monitoring, and sample selection program.
Practice.
Use of data base management package (e.g. dBase 3) without programming language.
Practice.
Application of data base package to data entry, filing, and editing of survey data.
Practice.
Use of statistical package and creation of tables (e.g. S.P.S., NWA Statpack, etc.).
Practice.
Application of statistical package to farm forestry and village woodlot surveys.
Practice.
Production of graphic outputs.
Practice.
Introduction to word processing and report writing.
Afternoon: Practice.
DAY 10 Review and additional practice.

206
Annex 1. SPECIFICATIONS FOR SUGGESTED MICROCOMPUTER HARDWARE AND SOFTWARE
The following general criteria have been used to determine the hardware and software specifications.
o The use of a standard operating system and commercially available software which can be customized to individual requirements while maintaining file compatibility and allowing economies of scale in software support.
o Sufficient resident (i.e. RAM) and storage memory (i.e. disk drives) to handle the statistical analysis of the monitoring data and the data collected through the recommended sample surveys.
o Cheap enough to allow two units to be purchased and thus provide a back-up facility in the event of a breakdown. Speed and efficiency of data entry.
o Reliability and the certainty that service facilities are readily available in country.
Accordingly. the following hardware specifications are recommended:
Mic ro processor:
RAM Memory:
Monitor:
Storage:
Intel 8088, 8086, or 80186 (16 bit IBM standard).
Minimum of 378 Kilobytes, 640 K recommended.
Monochrome with graphics capability.
One or two floppy disk drives for 5-1/4" diskettes (double density. double sided 360 K) and one 10 Megabyte Winchester hard disk drive.
Operating System: MS-DOS.
Printer:
Data Entry:
Electrical:
132 character dot-matrix printer with wide paper throughout.
Standard keyboard plus numeric keypad.
I Kilowatt voltage stabilizer, battery back-up system, and air-conditioner.
Essentially. what is described above is equivalent to the fully configured IBM PC-XT standard. Numerous Indian and foreign manufacturers now supply systems conforming to these specifications with a variety of options for expansion and maintenance.

207
Suggested software is listed below. It is recommended that the NWDB issue guidelines designed to insure that each State purchase compatible software, regardless of which packages are selected. A greatly preferable procedure would be the centralized procurement of the initial hardware and software and the centralized development of any additional software.
Package
Data Base Management:
Financial Spreadsheet
Surlley Statistics
SillIiculture Research
Word Processor:
Languages:
Main Characteristics
Able to handle over 500,000 records and 100 fields using hard disk virtual memory; own programming language; compatible with spreadsheet and statistical package. Recommended: dBase III from Aston-Tate Company. (Alternatives: R:Base, CONDOR III).
Integrated and compatible with DBM & Graphics (above); multiple column width; simple statistics, sort capability; minimum 150 columns by 150 rows. Recommended: Lotus 1-2-3 from Lotus Development. (Alternatives: Framework, Multiplan).
Able to handle 5,000 cases and 100 variables using the hard disk virtual memory; all major statistical tests, complete file handling and data manipulation, compatible with DBM and spreadsheet. Recommended: SPSS which reQuires minimum of 378 K RAM and hard disk. (Alternate SLMicro, STAT PRO» Also recommended one smaller package designed for use with floppy disks. Recommended: SPS or ST A TPAC. (Alternatives: ABSTA T, Microstat~ Systat).
For research plot analysis, MSTA T is recommended.
Ideally, the. word processor should be comp,atible with the DBM and spreadsheet packages. For this reason, Symphony from LotusDevelopmentis recommended as it already includes Lotus 1-2-3 in an integrated package. (Alternatives: Wordstar or Perfect Writer or Microsoft Word). It may also be desirable to obtain a local language word processor using recommended standard character codes.
For special applications, the following languages (depending on the knowledge of the programmer) could also be obtained: BASIC, FORTRAN, PASCAL.

208
Estimated base costs in India are given below.
Year 1
Hardware (one system as recommended) Second computer for data entry/backup Software packages and miscellaneous items Software support
Year 2 Onwards (Per Year)
Maintenance (12% of hardware) Supplies hi Software support £I
Rupees
100,000 40,000 18,000 12,000
170,000 If
Rupees
16,800 6,000 8,000
30,800 per year
Ii If set-up costs, initial maintenance, shipping, handling and installation are provided by a fully qualified agency, the total installed cost of the system will be about Rs 200,000. Neither this figure or the Rs 170,000 given above includes the cost of developing supporting software or providing training through the Centre (NWDB).
hi Includes diskettes, printer paper and ribbons, etc. " To cover programme modifications and technical backstopping using expert
consultants.

209
ADDex II. MENU FOR STATISTICAL ANALYSIS AND SAMPLE OUTPUTS.
( IBM-FC) STATISTICAL PROCESSING SYSTEM (TM) Version ~.O
IHHHHHrlHHHHHHHHHMHMHHHHHHHHHHHHHHHHHHHHHHHHHHHHHHHHHNHHHHHHHHHHHHHHHH"HHHff"HHH~;
(c) 1984 Southeast Technical Associat.s,Inc.1 ALL RIGHTS RESCRVlD Fortions copyrighted by: DATABASi:, Inc., Mt. Flea.ani, MI 488~S
AuthorsIG.J. euhy~ff, R.C. ~ir., R.B. Hull IV, H.M. Rauscher, E. M:lenra HHilrlHHH"1HHHHHHHHHHHHHHH~HHHNHHHHH'UfHHHHHHHHffHHHHHHHHHMHHHHHHHMHHHHHHHHHHHHH~~H,
FILE CREATION AIJD MArJF'ULATION 2 DESCRIFTIVE STATISTICS AND PLOTS 3 PARAMETF(IC AND NONPARAMETRIC COnRELATION 4 REGRESSION ANALYSIS 5 t TESTS AND ANOV~ DESIGNS b TEST DISTRIBUTIONS: t, F, Chi square 7 CROSSTABS: R X C CONTINGENCY TABLES 8 MONTE CARLO DISTRIBUTIONS 9 MULTIVARIATE ANALYSES
10 UNIVAR, BIVAR, TRIVAR (QUALITATIVE ANALYSES) 11 F'REF'ARE/LlNI: S. P. S. FILES TO A MAINFRAME 12 EXIT TO BASIC INTERPRETER 13 EXIT TO DISK OPERATING SYSTEM 14 User Definable
SELECTION':' 1
Conversion 5.0 by G.J. Buhyoff, R.C. Virk ~ R. B. Hull IV
FILE OF'ERATI ONS FILE: (I Retlll-n to mai n S. F'. S. menu 1 Input data matrix 2 Write file to di.k 3 Select ob.ervation. 4 Strip variabl •• S Delete ob.ervation.
List file to screen List file to printer Review variable label.
OBS. = I) VAR.,
6 7 8 9 A B C o E F G H J K L.
Edit file CHOICE?
NOTEI
Transpose HIe Transform file data Vertical file merge Horizontal file merge Rank order fi Ie data Recode variable. Form indices Add vector of 1'. Reord.r observation.
Kill/.ra.e data fil.s Li.t disk directory
Oth.r'program mOdule. are u.ed. Be sure to SAVE your data on di.k!

210
--> PROG:TABOUT FILE:FF2.0UT DATE:02-06-1986 ID:FARM FORESTRY: TABLE FF2 PAGE I
Rowa: LAND_OPERATED , Colullln5: YEAR
1980 1981 1982 1983 198 .. -ROW TOTS-
50.0 50.0 0.0 0.0 0.0 • 100.0 LANDLESS 2 2 0 0 0 • ,
10.0 7.' 0.0 0.0 0.0 • 5.3 ---------- ---------- ---------- ---------- ---------- ----------
30.0 30.0 0.0 '0.0 0.0 • 100.0 .01-1 3 3 0 , 0 • 10
15.0 II. I 0.0 26.7 0.0 • 13.3 ---------- ---------- ---------- ---------- ---------_._---------
21.2 I 39.' 12.1 21.2 6.1 - 100.0 1-2 7 13 , 7 2 - 33
35.0 '8.1 80.0 '6.7 25.0 -"".0
26.3 31.6 5.3 15.8 21.1 • 100.0 2-3 5 6 I 3 , - 19
25.0 22.2 20.0 20.0 50.0 - 25.3 ---------- ---------- ---------- ---------- ---------- ----------
33.3 33.3 0.0 11.1 22.2 • 100.0 3-5 3 3 0 I 2 - 9
15.0 11.1 0.0 I 6.7 25.0 -12.0
26.7 36.0 6.7 I 20.0 10.7 - 100.0 -COL TOTS- 20 27 5 15 8 • 75
100.0 1100.0 I 1 00 . 0 I 100.0 1100.0 -100.0
--> PROG:TABOUT FILE:FF2.0UT DATE:02-06-1986 IO:FARM FORESTRY: TABLE FF2 PAGE I
Rowa: LAND_OPERATED , Col",,,,n.: YEAR
1980 1981 1982 1983 1984 -ROW TOTS-
lANDLESS 2 2 0 0 I .. .'1-1 3 3 0 .. • II 1-2 7 13 .. 7 2 33 2-3 5 6 1 3 .. 19 3-5 3 3 0 1 2 9
ICOl TOTS' 2. 27 5 IS 8 75

211
--> PROG:TABOUT FILE:"'a.out DATE:02-06-1986 ID:'ar~ forestry: table FFl1a PAGE 1
Rows: OCCUPATION \ Colu~ns: YEAR
FARMING
DAIRYING
1980 1981 1982 1983 1984 •••••••••• •••••••••• •••••••••• •••••••••• •••••••••• • •••••••••
25.7 18
90.0
35.7 25
92.S
7.1 I I 5 1100.0
20.0 14
93.3
11.4· 100.0 8 • 70
1100.0 • 93.3 ---------- ---------- ---------- ---------- ---------- ----------
0.0
0.0 I o
100.0 1
3.7
0.0 o
0.0
0.0 o
0.0
0.0 • 100.0 0·,
0.0 • 1.3 ---------- ---------- -.-------- ---------- ---------- ----------
50.0 25.0 I 0.0 25.0 I 0.0 • 100.0 LABORING 2 1 0 1 0· 4
10.0
0.0 SKIL.LAB. 0
0.0
0.0 GOVT.EMP. 0
0.0
0.0 OTHER 0
0.0
3.7 0.0
0.0 o
0.0
0.0 o
0.0
0.0 0
0.0
0.0 o
0.0
0.0 o
0.0
0.0 0
0.0
I
6.7 0.0· 5.3
0.0 o
0.0
0.0 o
0.0
0.0 0
0.0 I
0.0 • 0.0 0·0
0.0 • 0.0
0.0 • 0.0 o • 0
0.0 • 0.0
0.0 • 0.0 0 • 0
0.0 • 0.0 ---------- ---------- ---------- ---------- ---------- ----------
26.7 36.0 6.7 20.0 10.7 • 100.0 -COL TOTS· 20 27 5 15 8 • 75
100.0 i 100.0 1100.0 i 100.0 1100.0 ·'00.0
--) PROG:TABOUT FILE:"'a.out DATE:02-0S-1986 ID:f.r~ forestry: table f',. PAGE 1
Rows: OCCUPATION \ Colu~ns: YEAR
1980 1981 1982 1983 1984 •••••••••• •••••••••• •••••••••• •••••••••• •••••••••• • •••••••••
FARMING 18 25 5 14 8 70 DAIRYING 0 1 0 0 I 1 LABORING 2 1 0 1 0 4 SKIL.LAB. 0 I I 1 I 0
·60VT.EMP. 0 I e e e I OTHER I I e I I 1
---------- ---------- ---------- ---------- ---------- -----------COL TOTS- 21 27 5 15 8 75

212
--> PROG:TABOUT FIlE:fflb.out OATE:02-06-1986 IO:far~ forestry: table fflb PAGE 1
Rows: OFFICE BEARER \ eolu~ns: '(EAR
1980 1981 1982 1983 1984 -ROW TOTS-
100.0 0.0 0.0 0.0 0.0 - 100.0 YES , 0 0 0 0 - I
5.0 0.0 0.0 0.0 0.0 - 1.3 ---------- ---------- ---------- ---------- ---------- ----------
25.7 36.5 6.8 20.3 10.8 - 100.0 NO 19 27 5 15 8 - 74
95.0 1100.0 1100.0 1100.0 1100.0 - 98.7
2S.7 36.0 6.7 20.0 10.7 - 100.0 -COL TOTS- 20 27 5 15 e - 75
100.0 1100.0 1 100.0 1 100.0 1 1 00.0 -I 00 . 0
--> PROG:TABOUT FIlE:fflb.out OATE:02-0S-1986 10:f.r~ forestry I table fflb PAGE 1
Rowe: OFFICE BEARER \ Colu~ns: YEAR
1980 1981 1982 1983 1984 -ROW TOTS-
YES 1 e 0 0 0 1 NO 19 27 5 15 8 74
---------- ---------- ---------- ---------- ---------- --------COL TOTS- 20 27 5 15 8 75

213
Annex III. THE RELIABILITY OF AND DIFFERENCES BETWEEN ESTIMATES
In Chapter VI (Annex I) the concept of sampling error (as measured by the standard error) was used to calculate the probable accuracy of different sample sizes. The sampling error is, however, only a part, albeit an important part, of the total error surrounding estimates derived from sample surveys. The remaining eror is usually termed the non-sampling error and arises from inaccuracies in the responses induced by variability in the way the survey is conducted, e.g., differences in the behavior and demeanor of interviewers, or editors or non-response. For many sample surveys the nonsampling error is never calculated, often because it is impossible to do so. Whether the size of this non-sampling error is or is not estimated it is nevertheless present and hence adds, a possibly small, additional clement of doubt to the estimates derived from the sample surveys. It is, therefore, important to comment clearly and concisely in any report on whether all or only particular parts of the survey suffered. To report the standard error of the estimate (especially if it is small) in the knowledge that there was other known (but measured) bias present is to convey an unjustified sense of precision.
The sampling error is the error in an estimate that arises by chance because a sample rather than the whole population of interest has been observed. This component of error, measured by the standard error of the estimate, can be estimated from the sample data if the sample design recommended for the farm forestry survey in Chapter VI is followed.1/ The estimated standard error should be reported, at least for the more important statistics, so that users of the information have some idea of the reliability that can be attributed to the reported statistics.
Frequently however it will be necessary to state the degree of reliability more formally. This may be done by calculating a confidence interval at some level of confidence, using the estimated value of the statistic and its standard error. For example, if an estimate x is estimated to have a standard error s, it may be concluded that there is approximately a 9S percent probability that the value which x is intended to estimate is between x-2s and x+2s. Or, if a lower level of confidence wili suffice, it may be concluded that there is approximately a 68 percent probability that the value which x is intended to estimate is between x-s and x+s. Such statements are valid if the sample on which the estimate is based is not very small, say larger than 30 sampling units, and may also be fair approximations for somewhat smaller sample sizes.
During analysis attention will often focus on the difference between two estimates. For example, XI may be the estimated area planted to seedlings in one year and x2 a similar estimate for another year. The standard errors of these estimates may be denoted by sl and s2' respectively. In the sample design recommended in Chapter VI, the estimates Xl and x~ arc statistically independent, so that the estimated standard error of the dIfference denoted as sd is given by,
1/ The same holds for estimates derived from the responses of villagers in the village Woodlot Survey (because villagers are chosen randomly.) It docs not hold for the purposively selected village leaders.

214
The same would hold if x land x2 are estimates of a mean or a proportion in two different zones of a State. or for that matter, two different States.
The usefulness of the sample estimate of a difference depends jointly upon its sampling error and the substantive importance of any given true difference. For example, suppose that if the percentage of farmers growing trees for sale is S percentage points higher in Zone I than in Zone 2. a change of policy could be justified. Further suppose that the sample estimates are 30 percent (Zone 1) and 20 percent (Zone 2), and that the estimated standard errors are S percent and 4 percent respectively. Then the estimated difference is 10 percent (30 percent minus 20 percent) and the estimated standard error of the difference is.
sd • j"'(-.0-5)-2-+-(-.0-4-)2-. .064
The 9S percent confidence interval is given by,
.I 0 - 2 x .064 • -.028 and .I 0 + 2 x .064 • .228
Thus with 9S percent confidence the difference is between a negative 2.8 percent and a positive 22.8 percent. Reducing the level of confidence, to 68 percent the difference is between 3.6 percent and 16.4 percent. Thus for both levels of confidenoe the sample does not provide convincing evidence that the percentage is S points or more higher in Zone I than in Zone 2. so that more evidence is required to justify a change in policy. If, however, a policy change could be justified by a difference of 2.5 percent and if the standard errors were 3 percent and 2 percent, the standard error of the differences would be,
sd • j(.03)2 + (.02)2 - .036
It is then possible to conclude with 9S percent confidence that the difference is between 2.8 percent and 17.2 percent, and that the sample does provide evidence sufficien t to justify a policy change.
If more evidence is needed, it may be possible to obtain such evidence from sources of information other than the survey, or it may require that the sample sizes in subsequent rounds of the survey should be increased in order to reduce the sampling errors.
The use of formal statistical tests gets to the very heart of monitoring and evaluation; that is the nature of the decisions that are to be made by management on the basis of the available evidence. This, in effect. is the realm of decision theory. In the present context, this is not a complex matter but it does require a clear appreciation of the relationship of data reliability to management decisions. What is at issue is the relative costs of deciding to make a change in policy or practice when it should not have been changed versus leaving that policy or practice unchanged when change was required. If the costs of a change are high, it is necessary to have' considerable confidence in the evidence upon which the decision is to be made. In other words, confidence intervals should be calculated at the 9S percent or even the 99 percent level. Alternatively, if the costs of making a change are low (a simple procedural change that would yield a modest improvement at little cost or which if not undertaken would not be serious), then less confidence in the evidence is necessary: the 90 percent. the 7S percent or even the 68 percent level will suffice.
In certain circumstances, it may also be necessary to establish

21S
whether one estimate is significantly different from another. The procedures for doing so arc available in any standard statistical text boak and need not, therefore, be repeated here. Three related matters do, however, merit comment.
The first is merely a reminder that testing for significant differences between estimates requires different tests for different classes of parameter. If, for example, the object is to establish whether an estimated mean from one sample is different from the estimated mean of another sample, e.g., whether the average area planted to seedlings in year one is different from the average area planted in year two), then the relevant test is the "z" test for differences. Another example would be the proportion of farmers growing trees for sale in zone one compared to the corresponding proportion in zone two.
Second, it is always necessary to establish whether a one or twotailed test should be used. A two-tailed test allows for the possibility that the change (difference) could have been either positive or negative (up or down), whilst a one-tailed test is applied if the change is in one direction only. Common sense will usually tell us which test is appropriate. The critical values of "z" are, of course, different for one and two-tailed tests.
Third, if the tests arc to be conducted on estimates derived from small samples, (less than 30 observations), then the "z" tests above must be modified, as they arc based on the assumptions of normality in large samples. This modification is normally undertaken by using a "t" test which allows the small size of the sample to be taken into account. This adjustment is commonly referred to as the number of degrees of freedom associated with the test, and the critical "t" values vary according to the number of degrees of freedom (i.e., the sample size).

216
Annex IV. EXAMPLES OF 'SIMPLE COMPUTER GRAPHICS.
11)0 -r-------------------------------------------------------------------, :iO-
7'7":: fJ:I-,/ ..•... ...•...•....•
e-:, - :::::.:~.:: . •...•. , ... '.
Ai::' ..... ... . ", ..... ~. .'
.3:1 - , ...• < .... .. > .... :...... 20 ~:::::~:::.
7 .. >.<:.
4
-r'::-
::~;::';> •...•....•...
" ",
:.> .. :: ....
~ I· .. • •.• , ••••
7
'·b. af Oistrict
10 1 1
DISTHIBl)TIO~~ OF F.A.~~M Tr'PES

2J7
~).JP:\/IV'.A.L F~A.TES At'~D t\lO. SEEDLlt'·lGS TAJ:·::Et·,·, !fl" cw.TEGO"' .. OF FJlRtAE:~
~i ~, ~.
~:I
l' '7C' ", . ..
o!) 0:' .! ~ !CI
."
e 4(1
~~
-e ":' > .~
r1I 21:'
10
0 LJ,o, "jCl..E!.rS MEIlUM
St)H'VI\/,AL BY NlJM BEHS 0 F SEEDLI t",JGS lAI<Et AND cw.TEGO~'" OF' FIII'-MEI'I!
!CI~--------------------------------.-----------------,
7CI
_. _____ . _2D. -+.-_"'-"'~r"'_""T"'_.-.rlr-.!....,.r-"I-_"'_-""~-"'_' _--r..:1-.• '_--'_, r-;.,,_-,._''-_, r ... -__ r-. re-r_-,,, .. --t .•. _ ... _ "._
\,II \,II,,, \,II. \,II, 0.1:1 .... ,4 , • ,0;,
CThCIIU~rd.) A'¥IMfI! II!I!DUIGS TA~N !lEft "'A.ftM!J'

218
rVo: Il J-l.oB
SEEDLI~JG DISTRIStJTION S"'f' DISTRIC:T
SDoAL" (1 O,7~)
,.L ~ l' I tt, _
-~3~
Z~ ... '-b~{4,7!11:) --.•. --,....~ tAUJ~1 (4, 7~)
~ . ,,""N"" (". "") // OH!I'\AGOP, (e,8~)
,,'
PU~IO (7.4';:)
