monitoring and mentoring - need mentoring teacher... · monitoring and mentoring introduces...
TRANSCRIPT
OFF
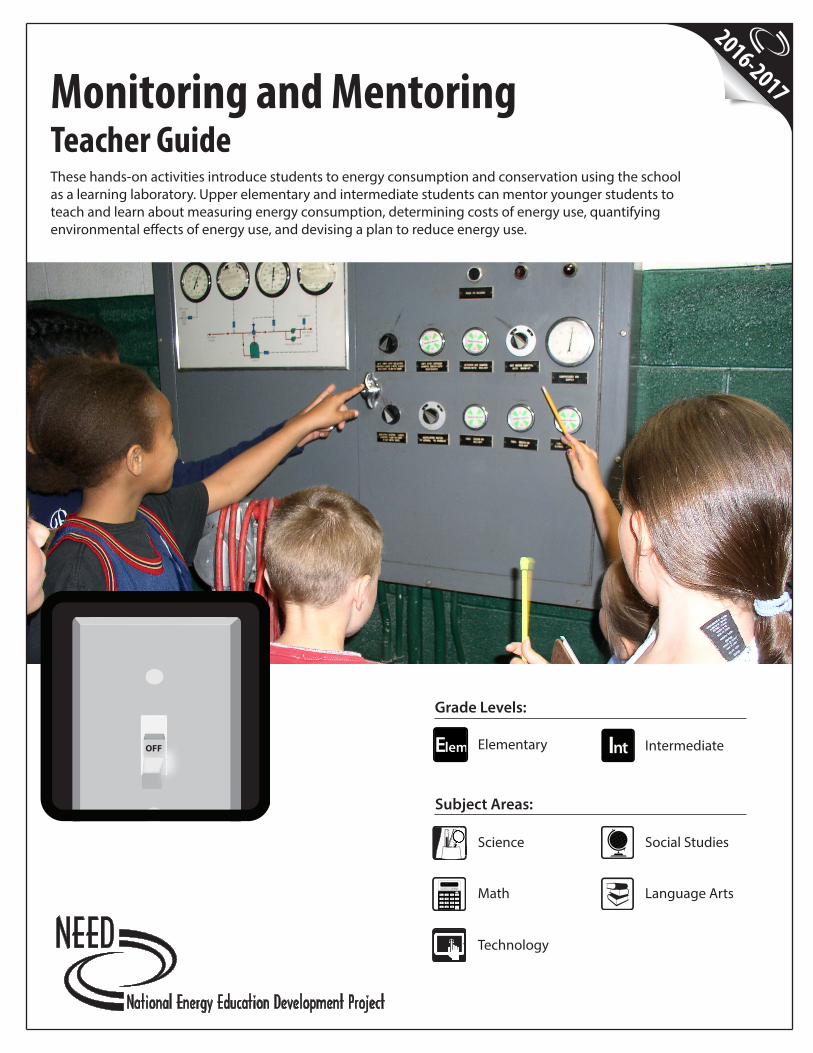
Monitoring and MentoringTeacher GuideThese hands-on activities introduce students to energy consumption and conservation using the school as a learning laboratory. Upper elementary and intermediate students can mentor younger students to teach and learn about measuring energy consumption, determining costs of energy use, quantifying environmental effects of energy use, and devising a plan to reduce energy use.
Science
Pri
Ele
IntSec
Subject Areas:
Language Arts
Intermediate
Social Studies
Grade Levels:
Math
Technology
Elementary
2016-2017
Elem
2 Monitoring and Mentoring Teacher Guide
Teacher Advisory BoardShelly BaumannRockford, MI
Constance BeattyKankakee, IL
Amy Constant - SchottRaleigh, NC
James M. BrownSaratoga Springs, NY
Nina CorleyGalveston, TX
Regina DonourWhitesburg, KY
Linda FonnerNew Martinsville, WV
Samantha Forbes
Vienna, VA
Michelle Garlick
Bob Hodash
DaNel HoganTucson, AZ
Greg HolmanParadise, CA
Matthew InmanSpokane, WA
Barbara LazarAlbuquerque, NM
Robert LazarAlbuquerque, NM
Leslie LivelyPorters Falls, WV
Jennifer Mitchell - Winterbottom Pottstown, PA
Mollie MukhamedovPort St. Lucie, FL
Don Pruett Jr.Sumner, WA
Joanne SpazianoCranston, RI
Tom SpencerChesapeake, VA
Jennifer Trochez MacLeanLos Angeles, CA
Wayne YonkelowitzFayetteville, WV
Jen VarrellaFort Collins, CO
Robert GriegolietNaperville, IL
Erin GockelFarmington, NY
Long Grove, IL
Printed on Recycled Paper
NEED Mission StatementThe mission of The NEED Project is to promote an energy conscious and educated society by creating effective networks of students, educators, business, government and community leaders to design and deliver objective, multi-sided energy education programs.
Permission to CopyNEED curriculum is available for reproduction by classroom teachers only. NEED curriculum may only be reproduced for use outside the classroom setting when express written permission is obtained in advance from The NEED Project. Permission for use can be obtained by contacting [email protected].
Teacher Advisory Board In support of NEED, the national Teacher Advisory Board (TAB) is dedicated to developing and promoting standards-based energy curriculum and training.
Energy Data Used in NEED MaterialsNEED believes in providing teachers and students with the most recently reported, available, and accurate energy data. Most statistics and data contained within this guide are derived from the U.S. Energy Information Administration. Data is compiled and updated annually where available. Where annual updates are not available, the most current, complete data year available at the time of updates is accessed and printed in NEED materials. To further research energy data, visit the EIA website at www.eia.gov.
1.800.875.5029www.NEED.org
© 2016
©2016 The NEED Project 8408 Kao Circle, Manassas, VA 20110 1.800.875.5029 www.NEED.org 3
Table of Contents �Standards Correlation Information 4
�Materials 5
�Teacher Guide 6
�Answer Keys 7
�Energy Efficiency Bingo Instructions 8
�Conservation in the Round 10
�Background Reading 11
�Home and Classroom Energy Use 12
�United States Energy Consumption by Source, 2014 13
�Sample Kitchen Diagram 14
�Reading Meters 15
� Insulation Investigation 17
�Facts of Light 19
�Light Bulb Comparison 21
�Comparing Light Bulbs Answer Key 22
�The Light Meter 23
�Flicker Checker 24
�Electrical Devices and Their Impacts 26
�EnergyGuide Labels 28
�Sample EnergyGuide Label 30
�Comparing EnergyGuide Labels 31
�Kill A Watt® Investigations 32
�Kill A Watt® Monitor Instructions 33
�School Building Survey 34
�School Energy Consumption Survey 36
�Digital Thermometer 38
�Humidity/Temperature Pen 39
�Building Buddies 40
�Monitoring and Mentoring Calendar 42
�Energy Efficiency Bingo 45
�Conservation in the Round Cards 46
�Evaluation Form 51
Monitoring and MentoringTeacher Guide
OFF
Monitoring and Mentoring Kit �1 Incandescent bulb �1 Compact fluorescent light bulb (CFL) �1 Light emitting diode bulb (LED) �1 Kill A Watt® monitor �5 Sets of radiation cans (2 per set) �10 Lab thermometers �5 Sets of insulation materials (3 ft per set) �3 Student thermometers �1 Indoor/outdoor thermometer �1 Light meter �1 Flicker Checker �1 Waterproof digital thermometer �1 Digital humidity/temperature pen �1 9-volt battery (for light meter) �30 Student Guides �1 Building Buddies Teacher Guide �1 Building Buddies Student Guide
4 Monitoring and Mentoring Teacher Guide
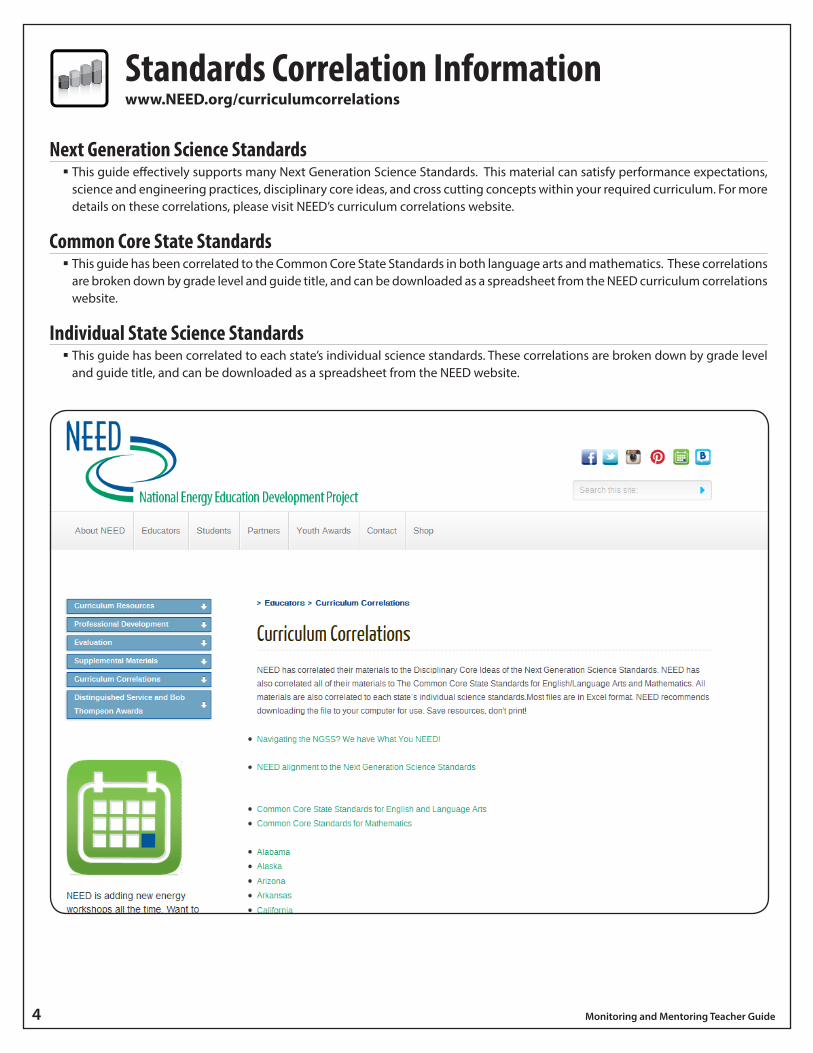
Standards Correlation Informationwww.NEED.org/curriculumcorrelations
Next Generation Science Standards � This guide effectively supports many Next Generation Science Standards. This material can satisfy performance expectations, science and engineering practices, disciplinary core ideas, and cross cutting concepts within your required curriculum. For more details on these correlations, please visit NEED’s curriculum correlations website.
Common Core State Standards � This guide has been correlated to the Common Core State Standards in both language arts and mathematics. These correlations are broken down by grade level and guide title, and can be downloaded as a spreadsheet from the NEED curriculum correlations website.
Individual State Science Standards � This guide has been correlated to each state’s individual science standards. These correlations are broken down by grade level and guide title, and can be downloaded as a spreadsheet from the NEED website.
©2016 The NEED Project 8408 Kao Circle, Manassas, VA 20110 1.800.875.5029 www.NEED.org 5
OFF
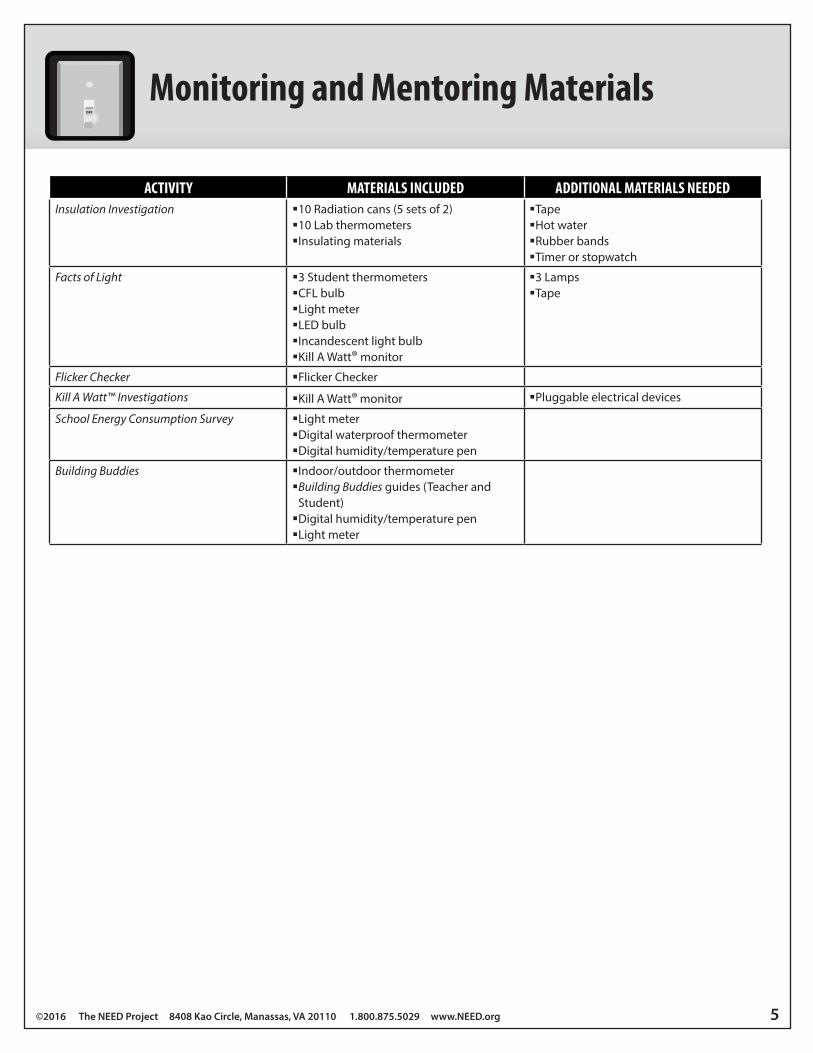
Monitoring and Mentoring Materials
ACTIVITY MATERIALS INCLUDED ADDITIONAL MATERIALS NEEDEDInsulation Investigation �10 Radiation cans (5 sets of 2)
�10 Lab thermometers �Insulating materials
�Tape �Hot water �Rubber bands �Timer or stopwatch
Facts of Light �3 Student thermometers �CFL bulb �Light meter �LED bulb �Incandescent light bulb �Kill A Watt® monitor
�3 Lamps �Tape
Flicker Checker �Flicker Checker
Kill A Watt™ Investigations �Kill A Watt® monitor �Pluggable electrical devices
School Energy Consumption Survey �Light meter �Digital waterproof thermometer �Digital humidity/temperature pen
Building Buddies �Indoor/outdoor thermometer �Building Buddies guides (Teacher and Student) �Digital humidity/temperature pen �Light meter
6 Monitoring and Mentoring Teacher Guide
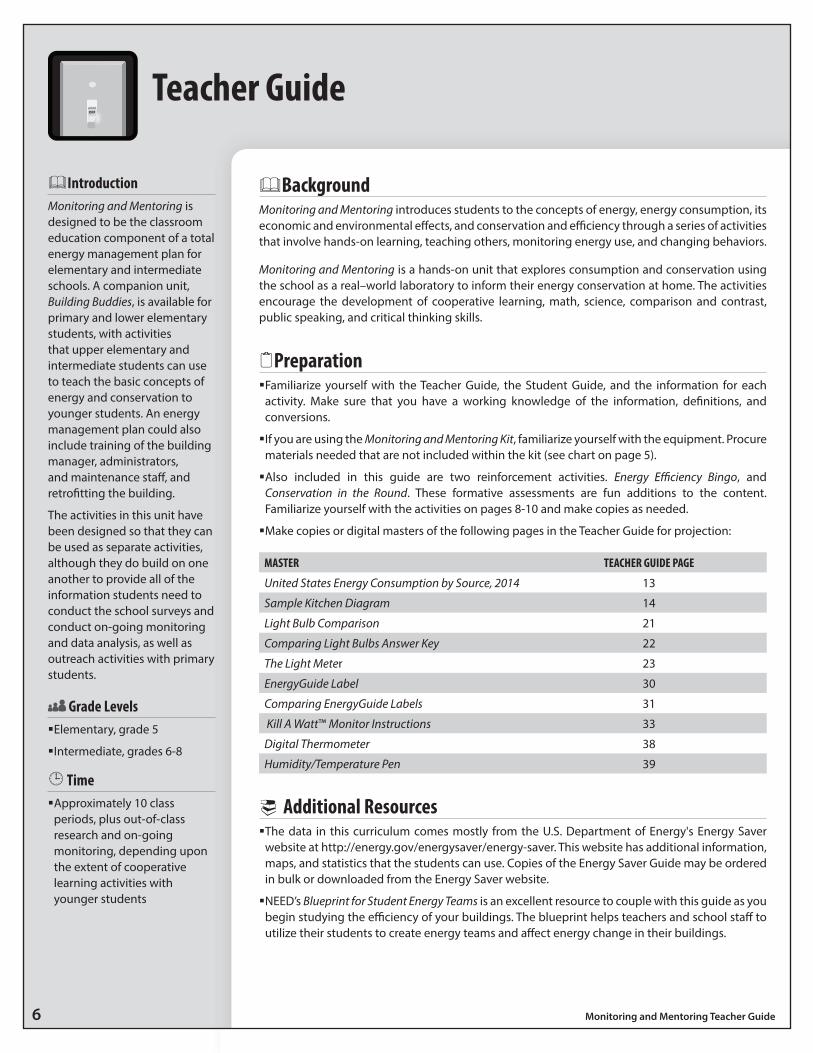
&BackgroundMonitoring and Mentoring introduces students to the concepts of energy, energy consumption, its economic and environmental effects, and conservation and efficiency through a series of activities that involve hands-on learning, teaching others, monitoring energy use, and changing behaviors.
Monitoring and Mentoring is a hands-on unit that explores consumption and conservation using the school as a real–world laboratory to inform their energy conservation at home. The activities encourage the development of cooperative learning, math, science, comparison and contrast, public speaking, and critical thinking skills.
2Preparation �Familiarize yourself with the Teacher Guide, the Student Guide, and the information for each activity. Make sure that you have a working knowledge of the information, definitions, and conversions.
�If you are using the Monitoring and Mentoring Kit, familiarize yourself with the equipment. Procure materials needed that are not included within the kit (see chart on page 5).
�Also included in this guide are two reinforcement activities. Energy Efficiency Bingo, and Conservation in the Round. These formative assessments are fun additions to the content. Familiarize yourself with the activities on pages 8-10 and make copies as needed.
�Make copies or digital masters of the following pages in the Teacher Guide for projection:
MASTER TEACHER GUIDE PAGE
United States Energy Consumption by Source, 2014 13
Sample Kitchen Diagram 14
Light Bulb Comparison 21
Comparing Light Bulbs Answer Key 22
The Light Meter 23
EnergyGuide Label 30
Comparing EnergyGuide Labels 31
Kill A Watt™ Monitor Instructions 33
Digital Thermometer 38
Humidity/Temperature Pen 39
Additional Resources �The data in this curriculum comes mostly from the U.S. Department of Energy's Energy Saver website at http://energy.gov/energysaver/energy-saver. This website has additional information, maps, and statistics that the students can use. Copies of the Energy Saver Guide may be ordered in bulk or downloaded from the Energy Saver website.
�NEED’s Blueprint for Student Energy Teams is an excellent resource to couple with this guide as you begin studying the efficiency of your buildings. The blueprint helps teachers and school staff to utilize their students to create energy teams and affect energy change in their buildings.
OFF
Teacher Guide
&IntroductionMonitoring and Mentoring is designed to be the classroom education component of a total energy management plan for elementary and intermediate schools. A companion unit, Building Buddies, is available for primary and lower elementary students, with activities that upper elementary and intermediate students can use to teach the basic concepts of energy and conservation to younger students. An energy management plan could also include training of the building manager, administrators, and maintenance staff, and retrofitting the building.
The activities in this unit have been designed so that they can be used as separate activities, although they do build on one another to provide all of the information students need to conduct the school surveys and conduct on-going monitoring and data analysis, as well as outreach activities with primary students.
Grade Levels �Elementary, grade 5
�Intermediate, grades 6-8
Time �Approximately 10 class periods, plus out-of-class research and on-going monitoring, depending upon the extent of cooperative learning activities with younger students
©2016 The NEED Project 8408 Kao Circle, Manassas, VA 20110 1.800.875.5029 www.NEED.org 7
Answer Keys
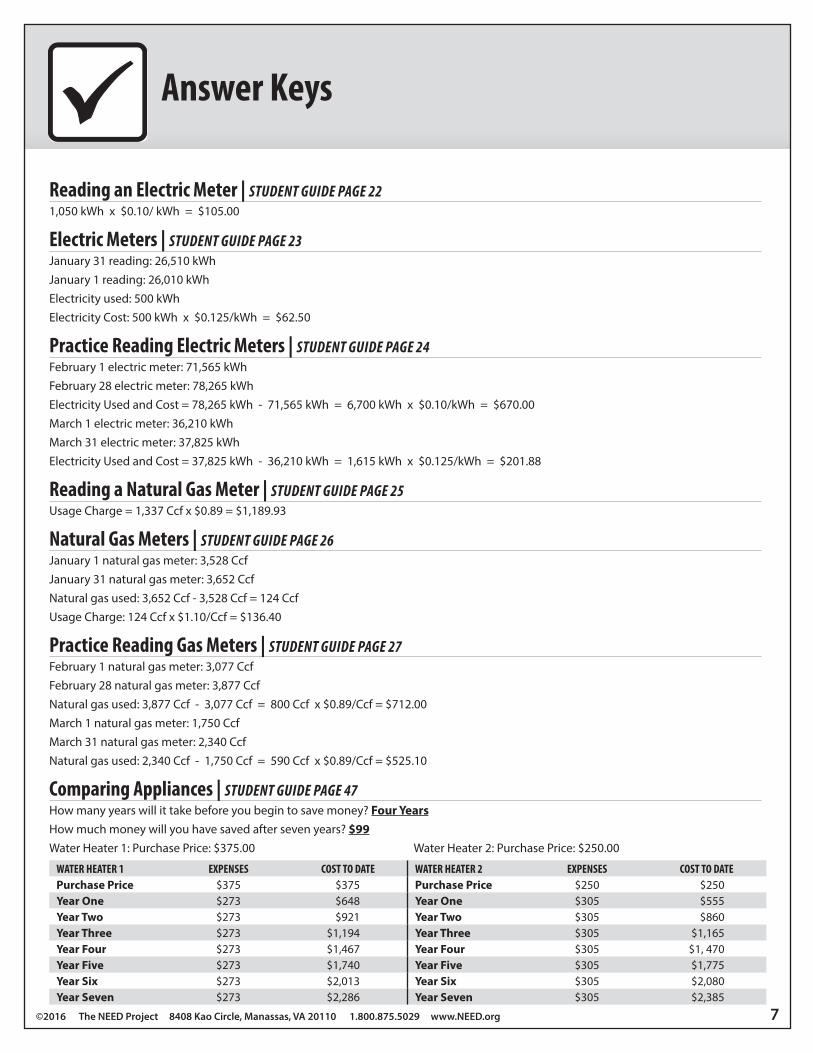
Reading an Electric Meter | STUDENT GUIDE PAGE 221,050 kWh x $0.10/ kWh = $105.00
Electric Meters | STUDENT GUIDE PAGE 23January 31 reading: 26,510 kWhJanuary 1 reading: 26,010 kWhElectricity used: 500 kWhElectricity Cost: 500 kWh x $0.125/kWh = $62.50
Practice Reading Electric Meters | STUDENT GUIDE PAGE 24February 1 electric meter: 71,565 kWh February 28 electric meter: 78,265 kWhElectricity Used and Cost = 78,265 kWh - 71,565 kWh = 6,700 kWh x $0.10/kWh = $670.00March 1 electric meter: 36,210 kWh March 31 electric meter: 37,825 kWh Electricity Used and Cost = 37,825 kWh - 36,210 kWh = 1,615 kWh x $0.125/kWh = $201.88
Reading a Natural Gas Meter | STUDENT GUIDE PAGE 25Usage Charge = 1,337 Ccf x $0.89 = $1,189.93
Natural Gas Meters | STUDENT GUIDE PAGE 26January 1 natural gas meter: 3,528 CcfJanuary 31 natural gas meter: 3,652 CcfNatural gas used: 3,652 Ccf - 3,528 Ccf = 124 CcfUsage Charge: 124 Ccf x $1.10/Ccf = $136.40
Practice Reading Gas Meters | STUDENT GUIDE PAGE 27February 1 natural gas meter: 3,077 Ccf February 28 natural gas meter: 3,877 Ccf Natural gas used: 3,877 Ccf - 3,077 Ccf = 800 Ccf x $0.89/Ccf = $712.00March 1 natural gas meter: 1,750 Ccf March 31 natural gas meter: 2,340 CcfNatural gas used: 2,340 Ccf - 1,750 Ccf = 590 Ccf x $0.89/Ccf = $525.10
Comparing Appliances | STUDENT GUIDE PAGE 47How many years will it take before you begin to save money? Four YearsHow much money will you have saved after seven years? $99Water Heater 1: Purchase Price: $375.00 Water Heater 2: Purchase Price: $250.00
WATER HEATER 1 EXPENSES COST TO DATE WATER HEATER 2 EXPENSES COST TO DATEPurchase Price $375 $375 Purchase Price $250 $250Year One $273 $648 Year One $305 $555Year Two $273 $921 Year Two $305 $860Year Three $273 $1,194 Year Three $305 $1,165Year Four $273 $1,467 Year Four $305 $1, 470Year Five $273 $1,740 Year Five $305 $1,775Year Six $273 $2,013 Year Six $305 $2,080Year Seven $273 $2,286 Year Seven $305 $2,385
8 Monitoring and Mentoring Teacher Guide
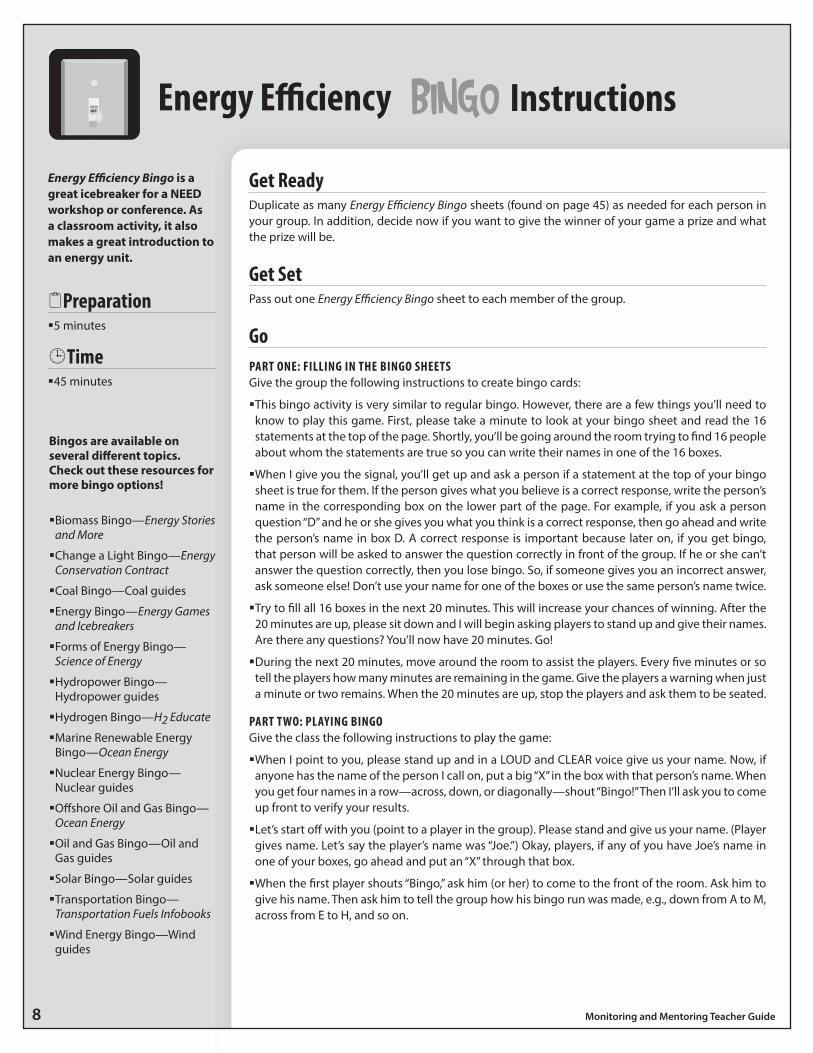
Get ReadyDuplicate as many Energy Efficiency Bingo sheets (found on page 45) as needed for each person in your group. In addition, decide now if you want to give the winner of your game a prize and what the prize will be.
Get SetPass out one Energy Efficiency Bingo sheet to each member of the group.
GoPART ONE: FILLING IN THE BINGO SHEETSGive the group the following instructions to create bingo cards:
�This bingo activity is very similar to regular bingo. However, there are a few things you’ll need to know to play this game. First, please take a minute to look at your bingo sheet and read the 16 statements at the top of the page. Shortly, you’ll be going around the room trying to find 16 people about whom the statements are true so you can write their names in one of the 16 boxes.
�When I give you the signal, you’ll get up and ask a person if a statement at the top of your bingo sheet is true for them. If the person gives what you believe is a correct response, write the person’s name in the corresponding box on the lower part of the page. For example, if you ask a person question “D” and he or she gives you what you think is a correct response, then go ahead and write the person’s name in box D. A correct response is important because later on, if you get bingo, that person will be asked to answer the question correctly in front of the group. If he or she can’t answer the question correctly, then you lose bingo. So, if someone gives you an incorrect answer, ask someone else! Don’t use your name for one of the boxes or use the same person’s name twice.
�Try to fill all 16 boxes in the next 20 minutes. This will increase your chances of winning. After the 20 minutes are up, please sit down and I will begin asking players to stand up and give their names. Are there any questions? You’ll now have 20 minutes. Go!
�During the next 20 minutes, move around the room to assist the players. Every five minutes or so tell the players how many minutes are remaining in the game. Give the players a warning when just a minute or two remains. When the 20 minutes are up, stop the players and ask them to be seated.
PART TWO: PLAYING BINGOGive the class the following instructions to play the game:
�When I point to you, please stand up and in a LOUD and CLEAR voice give us your name. Now, if anyone has the name of the person I call on, put a big “X” in the box with that person’s name. When you get four names in a row—across, down, or diagonally—shout “Bingo!” Then I’ll ask you to come up front to verify your results.
�Let’s start off with you (point to a player in the group). Please stand and give us your name. (Player gives name. Let’s say the player’s name was “Joe.”) Okay, players, if any of you have Joe’s name in one of your boxes, go ahead and put an “X” through that box.
�When the first player shouts “Bingo,” ask him (or her) to come to the front of the room. Ask him to give his name. Then ask him to tell the group how his bingo run was made, e.g., down from A to M, across from E to H, and so on.
Instructions
Energy Efficiency Bingo is a great icebreaker for a NEED workshop or conference. As a classroom activity, it also makes a great introduction to an energy unit.
2Preparation �5 minutes
Time �45 minutes
BINGOEnergy Efficiency
�Biomass Bingo—Energy Stories and More
�Change a Light Bingo—Energy Conservation Contract
�Coal Bingo—Coal guides
�Energy Bingo—Energy Games and Icebreakers
�Forms of Energy Bingo— Science of Energy
�Hydropower Bingo— Hydropower guides
�Hydrogen Bingo—H2 Educate
�Marine Renewable Energy Bingo—Ocean Energy
�Nuclear Energy Bingo— Nuclear guides
�Offshore Oil and Gas Bingo—Ocean Energy
�Oil and Gas Bingo—Oil and Gas guides
�Solar Bingo—Solar guides
�Transportation Bingo— Transportation Fuels Infobooks
�Wind Energy Bingo—Wind guides
Bingos are available onseveral different topics.Check out these resources formore bingo options!
OFF
©2016 The NEED Project 8408 Kao Circle, Manassas, VA 20110 1.800.875.5029 www.NEED.org 9
Instructions
ENERGY EFFICIENCY
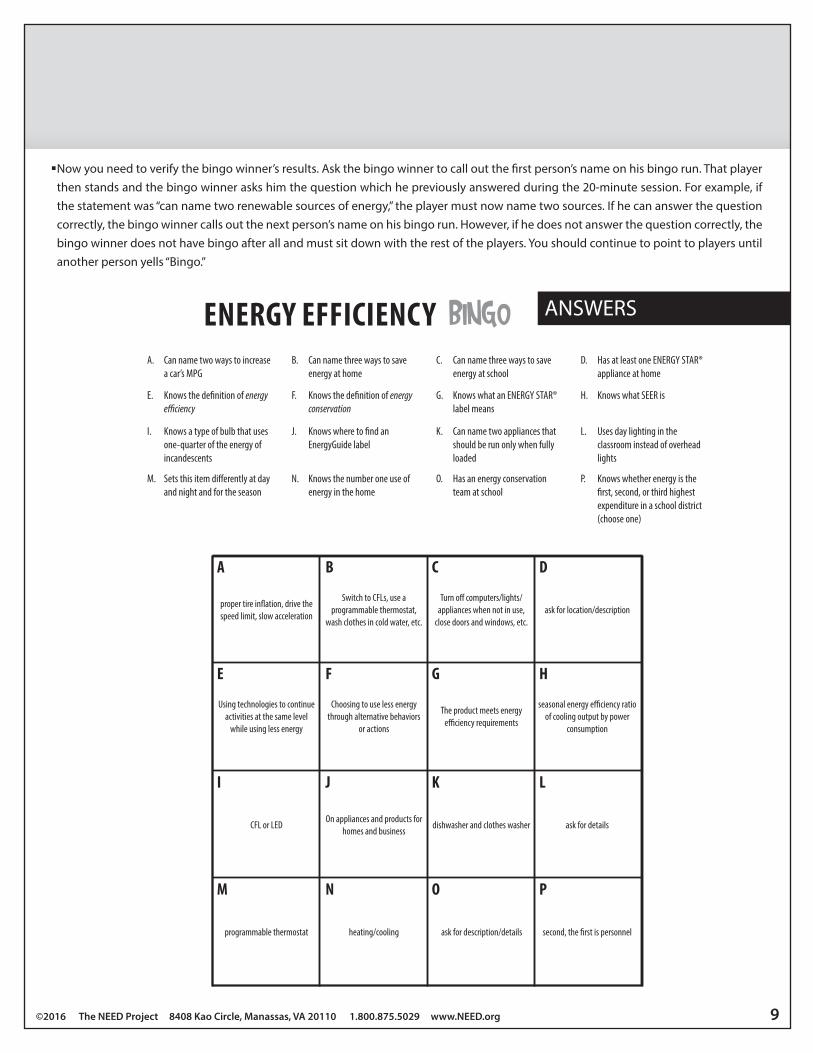
proper tire inflation, drive the speed limit, slow acceleration
Using technologies to continue activities at the same level
while using less energy
CFL or LED
programmable thermostat
Switch to CFLs, use a programmable thermostat,
wash clothes in cold water, etc.
Choosing to use less energy through alternative behaviors
or actions
On appliances and products for homes and business
heating/cooling
Turn off computers/lights/appliances when not in use,
close doors and windows, etc.
The product meets energy efficiency requirements
dishwasher and clothes washer
seasonal energy efficiency ratio of cooling output by power
consumption
ask for details
second, the first is personnel
A
E
I
M
B
F
J
N
C
G
K
O
D
H
L
P
ask for location/description
BINGO ANSWERS
A. Can name two ways to increase a car’s MPG
B. Can name three ways to save energy at home
C. Can name three ways to save energy at school
D. Has at least one ENERGY STAR® appliance at home
ask for description/details
�Now you need to verify the bingo winner’s results. Ask the bingo winner to call out the first person’s name on his bingo run. That player then stands and the bingo winner asks him the question which he previously answered during the 20-minute session. For example, if the statement was “can name two renewable sources of energy,” the player must now name two sources. If he can answer the question correctly, the bingo winner calls out the next person’s name on his bingo run. However, if he does not answer the question correctly, the bingo winner does not have bingo after all and must sit down with the rest of the players. You should continue to point to players until another person yells “Bingo.”
E. Knows the definition of energy efficiency
F. Knows the definition of energy conservation
G. Knows what an ENERGY STAR® label means
H. Knows what SEER is
I. Knows a type of bulb that uses one-quarter of the energy of incandescents
J. Knows where to find an EnergyGuide label
K. Can name two appliances that should be run only when fully loaded
L. Uses day lighting in the classroom instead of overhead lights
M. Sets this item differently at day and night and for the season
N. Knows the number one use of energy in the home
O. Has an energy conservation team at school
P. Knows whether energy is the first, second, or third highest expenditure in a school district (choose one)
10 Monitoring and Mentoring Teacher Guide
Get Ready �Copy the Conservation in the Round cards on pages 46-48 onto card stock and cut into individual cards.
�Make an additional copy to use as your answer key. This page does not need to be cut into cards.
� Have the class refer to the informational text in the Student Guides for quick reference, or refer to the Intermediate Energy Infobook.
Get Set �Distribute one card to each student. If you have cards left over, give some students two cards so that all of the cards are distributed.
�Have the students look at their bolded words at the top of the cards. Give them five minutes to review the information about their words from their Student Guides.
Go �Choose a student to begin and give the following instructions:
�Read the question on your card. The student with the correct answer will stand up and read the bolded answer, “I have _____.”
�That student will then read the question on his/her card, and the round will continue until the first student stands up and answers a question, signaling the end of the round.
�If there is a disagreement about the correct answer, have the students listen to the question carefully looking for key words (forms versus sources, for example) and discuss until a consensus is reached about the correct answer.
Alternative Instructions �Give each student or pair a set of cards.
�Students will put the cards in order, taping or arranging each card so that the answer is directly under the question.
�Have students connect the cards to fit in a circle or have them arrange them in a column.
Conservation in the Round
Conservation in the Round is a quick, entertaining game to reinforce information about energy sources, forms of energy, and general energy information from the Monitoring and Mentoring student informational text or the Intermediate Energy Infobook.
Grades �5–12
2 Preparation �5 minutes
Time �20–30 minutes
“In the Rounds” are available on several different topics. Check out these guides for more, fun “In the Round” examples!
�Coal in the Round—Coal guides
�Energy in the Round—Energy Games and Icebreakers
�Forms of Energy in the Round—Science of Energy guides
�Hydrogen in the Round—H2
Educate
�Oil and Gas Industry in the Round—Fossil Fuels to Products, Exploring Oil and Gas
�Solar Energy in the Round—Energy From the Sun
�Transportation Fuels in the Round—Transportation Fuels Infobooks
�Uranium in the Round—Nuclear guides
e
©2016 The NEED Project 8408 Kao Circle, Manassas, VA 20110 1.800.875.5029 www.NEED.org 11
tOverviewThe informational text in the Student Guide provides background information on energy consumption, conservation, and efficiency to give students a foundation for exploring and understanding the activities. Graphic organizers are included in the Student Guide to help students recognize and categorize the important information in the text.
Objectives �Students will be able to identify and describe energy use in their lives.
�Students will be able to define energy.
�Students will be able to identify and organize important information from nonfiction text.
Time �One 45-minute class period
&Introduction �Introduce the unit by asking the class to brainstorm a list of all of the ways energy is being used in the classroom. Write the list on the board. Make sure that heating/cooling, lighting, and running appliances and electronics are listed.
�Ask students to explain how they think energy efficiency might be different from energy conservation. Project or show the Efficiency vs. Conservation chart on page 11 of the Student Guide and record student ideas as they have a preliminary discussion.
�Discuss why everyone should be concerned about saving energy—natural resources, economics, environmental impacts.
�Ask students to point out ways they waste energy and ways that energy is wasted in the school.
�Explain the objectives of the Monitoring and Mentoring unit and their first assignment to gain information.
�Review Energy Definitions and Conversions on page 10 of the Student Guide.
Procedure1. Direct the students to the graphic organizers on pages 11-16 of the Student Guide. Review each organizer and explain that they will
write important facts in the organizers as they read the informational text.
2. Preview the headings of the informational text on pages 2-9 of the Student Guide with the students. Point out that they will need to decide what the important information is in each section and in which graphic organizer it should be placed.
3. Assign the students to read the informational text, completing the graphic organizers as they read.
4. Revisit the Effiiciency vs. Conservation chart with students after reading. Correct any misconceptions, provide more examples of each, and ask students to discuss how efficiency and conservation are related and must work together to be effective.
5. Review each organizer as a class, directing students to fill in facts they might have omitted. Remind students that the organizers will be helpful references as they proceed through the unit.
OPTIONAL: This activity can also be completed as a jigsaw. In this method students should be assigned topics to become experts on. They will read the entire informational text looking for information on their topic. Then, they will instruct others on their topic and highlight the important information they learned and recorded on their graphic organizer.
OFF
Background Reading
12 Monitoring and Mentoring Teacher Guide
tOverviewThe students will complete Energy Systems and Sources and Home Energy Use Surveys with their families to begin to understand the energy sources they use at home, how they use energy at home, as well as how they waste and save energy at home. The students will also draw diagrams of their kitchens and classrooms, using symbols to indicate energy–related structures and devices.
Concepts �We use 10 sources for energy in the United States. These 10 sources are used differently for heating, cooling and electricity in the home and school.
�Understanding how we use energy and how much energy we use can help us conserve.
Objective �Students will be able to list and identify the sources of energy used at home and school to heat, cool, cook, and power machines.
Time �One 45-minute class period, plus homework
2Preparation �Make copies or project the United States Energy Consumption by Source, 2014 and the Sample Kitchen Diagram on pages 13-14 of the Teacher Guide.
Procedure1. Use the United States Energy Consumption by Source, 2014 master to review the sources of energy and how they are used.
2. Review the Energy Systems and Sources and the Home Energy Use Survey on pages 17-18 of the Student Guide and assign as homework.
3. Have the students compare their answers to a buddy's. Have the class compile the data from their Energy Systems and Sources and Home Energy Use Surveys, then determine the most and the least common answers. Discuss the variety of the class results and what they indicate about energy use in your area. Discuss ways energy is wasted and conserved by households, as indicated by the results.
4. Have the students go to page 19 of the Student Guide. Use the Sample Kitchen Diagram to explain the diagram and the symbols in the legend.
5. Have the students go to page 20 of the Student Guide. Instruct the students to examine the classroom and draw sketches of the room on notebook paper, then transfer their drawings to the grid in their Student Guides, using the symbols on the legend. If you like, draw a master diagram of the classroom on large paper or an interactive board for display.
6. Instruct the students to draw kitchen diagrams on page 21 of the Student Guide as homework.
7. Discuss and review.
Extension �Have the class create graphical representations of their survey data and incorporate statistical terms such as mean, median, mode, and range.
OFF
Home and Classroom Energy Use

©2016 The NEED Project 8408 Kao Circle, Manassas, VA 20110 1.800.875.5029 www.NEED.org 13
MASTER
United States Energy Consumption by Source, 2014
e*Total d
oes n
ot ad
d to
100% d
ue to
ind
epen
den
t rou
nd
ing.
Data: En
ergy In
form
ation
Ad
min
istration
BIOMASS
4.8%U
ses: heating, electricity,transportation
COAL 18.0%
Uses: electricity,
manufacturing
GEOTHERMAL
0.2%U
ses: heating, electricity
HYDROPOWER
2.5%U
ses: electricity
PETROLEUM
34.9%U
ses: transportation,m
anufacturing
PROPANE 1.6%
Uses: heating,
manufacturing
URANIUM
8.3%U
ses: electricity
WIND
1.7%U
ses: electricity
SOLAR 0.4%
Uses: heating, electricity
RENEWABLE
NONRENEWABLE
U.S. Energy Consumption by Source, 2014
NATURAL GAS 27.5%
Uses: heating,
manufacturing, electricity
14 Monitoring and Mentoring Teacher Guide
MASTER
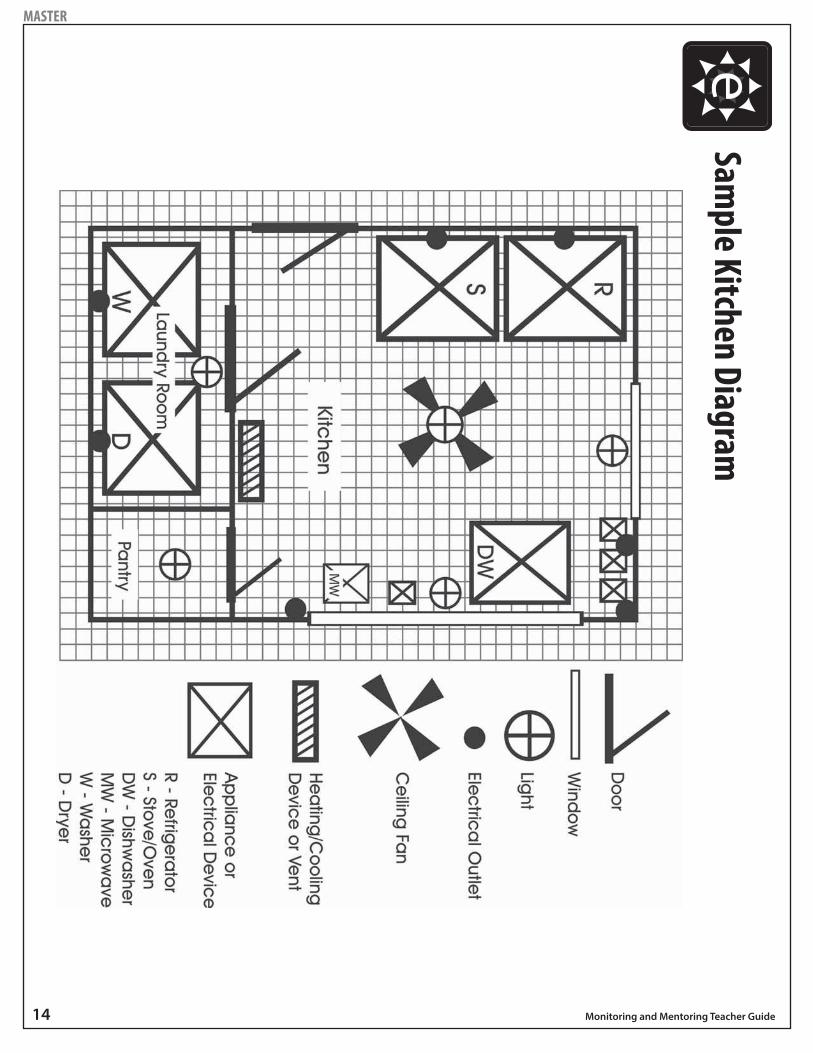
Sample Kitchen Diagram
e
PAGE 16 M
onitoring & Mentoring Student
©2009 TH
E NEED
PRO
JECT • P.O
. BOX 10101 • M
ANASSAS, VA 20108 • 1-800-875-5029
Kitchen & Classroom
Diagrams
ENER
GY U
SE AT HO
ME &
SCHO
OL D
IAGR
AMS
Your assignment is to draw
a diagram of your kitchen at hom
e and your classroom at school like the exam
plebelow
. Begin by m
aking sketches of the rooms on notebook paper. W
hen you think your sketches are accurate,draw
your diagrams on the grids on the next tw
o pages. Use the sym
bols below to indicate w
indows, doors,
electrical outlets, lights, ceiling fans, and appliances and other electrical devices.
The sample diagram
below is of a kitchen w
ith a laundry room and pantry. It has three doors, tw
o window
s, andseven electric outlets. There are tw
o lights in the kitchen area and one ceiling fan with a light, one light in the
pantry, and one light in the laundry room. There are tw
o labeled appliances in the pantry (washer and dryer) and
four labeled appliances in the kitchen (refrigerator, stove, dishwasher, and m
icrowave). There are also four sm
allerappliances in the kitchen that are not labeled. They are a disposal, a coffee m
aker, an electric can opener, and atoaster.
©2016 The NEED Project 8408 Kao Circle, Manassas, VA 20110 1.800.875.5029 www.NEED.org 15
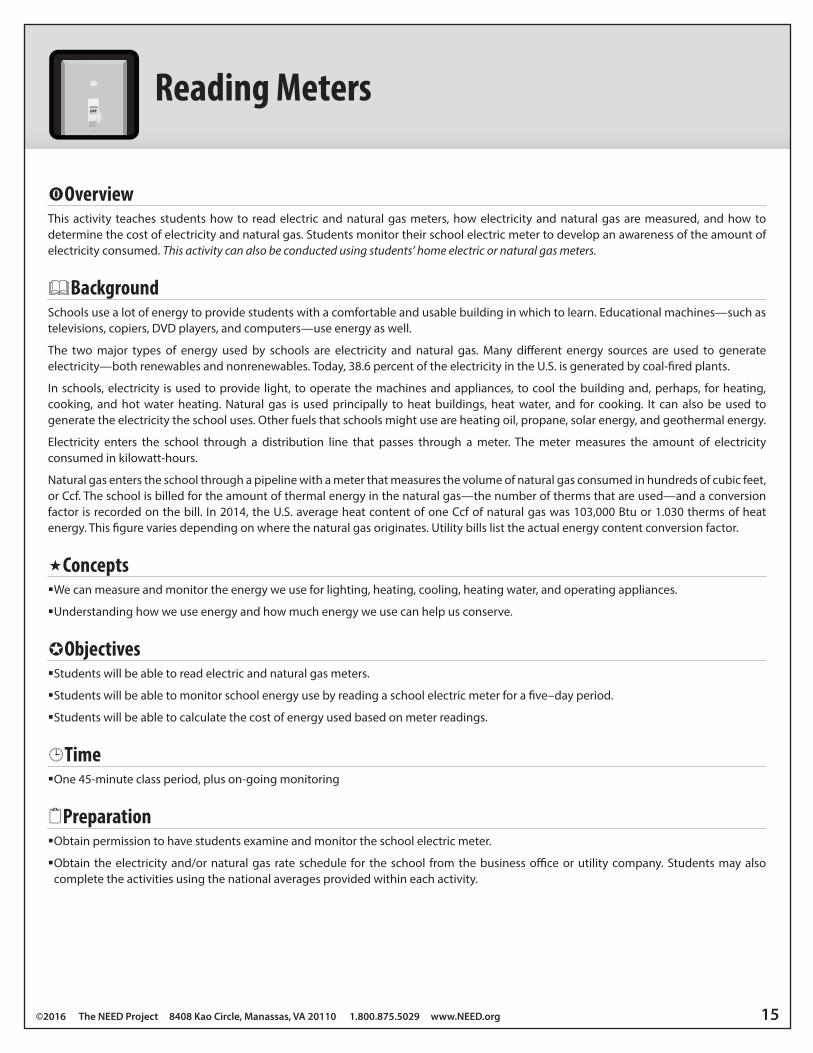
tOverviewThis activity teaches students how to read electric and natural gas meters, how electricity and natural gas are measured, and how to determine the cost of electricity and natural gas. Students monitor their school electric meter to develop an awareness of the amount of electricity consumed. This activity can also be conducted using students’ home electric or natural gas meters.
&BackgroundSchools use a lot of energy to provide students with a comfortable and usable building in which to learn. Educational machines—such as televisions, copiers, DVD players, and computers—use energy as well.
The two major types of energy used by schools are electricity and natural gas. Many different energy sources are used to generate electricity—both renewables and nonrenewables. Today, 38.6 percent of the electricity in the U.S. is generated by coal-fired plants.
In schools, electricity is used to provide light, to operate the machines and appliances, to cool the building and, perhaps, for heating, cooking, and hot water heating. Natural gas is used principally to heat buildings, heat water, and for cooking. It can also be used to generate the electricity the school uses. Other fuels that schools might use are heating oil, propane, solar energy, and geothermal energy.
Electricity enters the school through a distribution line that passes through a meter. The meter measures the amount of electricity consumed in kilowatt-hours.
Natural gas enters the school through a pipeline with a meter that measures the volume of natural gas consumed in hundreds of cubic feet, or Ccf. The school is billed for the amount of thermal energy in the natural gas—the number of therms that are used—and a conversion factor is recorded on the bill. In 2014, the U.S. average heat content of one Ccf of natural gas was 103,000 Btu or 1.030 therms of heat energy. This figure varies depending on where the natural gas originates. Utility bills list the actual energy content conversion factor.
Concepts �We can measure and monitor the energy we use for lighting, heating, cooling, heating water, and operating appliances.
�Understanding how we use energy and how much energy we use can help us conserve.
Objectives �Students will be able to read electric and natural gas meters.
�Students will be able to monitor school energy use by reading a school electric meter for a five–day period.
�Students will be able to calculate the cost of energy used based on meter readings.
Time �One 45-minute class period, plus on-going monitoring
2Preparation �Obtain permission to have students examine and monitor the school electric meter.
�Obtain the electricity and/or natural gas rate schedule for the school from the business office or utility company. Students may also complete the activities using the national averages provided within each activity.
OFF
Reading Meters
16 Monitoring and Mentoring Teacher Guide
Procedure1. Introduce the activity to the class, discussing the tasks that use electricity and natural gas at home and at school.
2. Go to page 22 of the Student Guide—Reading an Electric Meter—and review the information with the students.
3. Have the students complete the Electric Meters activity on page 23 of the Student Guide. Review with the class. Note that this activity represents a residential reading, and uses a different rate/kWh.
4. Assign page 24 of the Student Guide—Practice Reading Electric Meters—as homework. Make sure students pay attention to the differing rates. Review the answers with the class.
5. Conduct the natural gas meter activities on pages 25-27 of the Student Guide as you did the electric meter activities. Make sure you point out the differences in the meter face, if any, and how natural gas is metered and billed. Also, there are differing rates for commercial and residential natural gas. Be sure students take note of this.
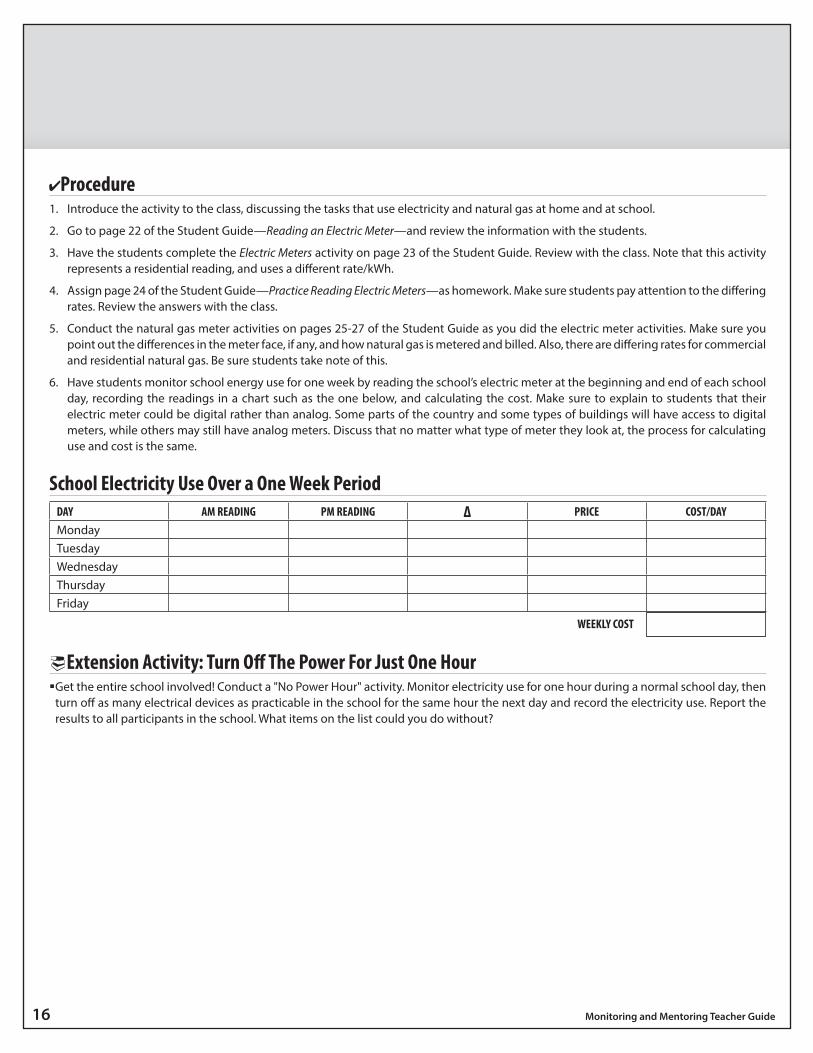
6. Have students monitor school energy use for one week by reading the school’s electric meter at the beginning and end of each school day, recording the readings in a chart such as the one below, and calculating the cost. Make sure to explain to students that their electric meter could be digital rather than analog. Some parts of the country and some types of buildings will have access to digital meters, while others may still have analog meters. Discuss that no matter what type of meter they look at, the process for calculating use and cost is the same.
School Electricity Use Over a One Week PeriodDAY AM READING PM READING ∆ PRICE COST/DAYMondayTuesdayWednesdayThursdayFriday
Extension Activity: Turn Off The Power For Just One Hour �Get the entire school involved! Conduct a "No Power Hour" activity. Monitor electricity use for one hour during a normal school day, then turn off as many electrical devices as practicable in the school for the same hour the next day and record the electricity use. Report the results to all participants in the school. What items on the list could you do without?
WEEKLY COST
©2016 The NEED Project 8408 Kao Circle, Manassas, VA 20110 1.800.875.5029 www.NEED.org 17
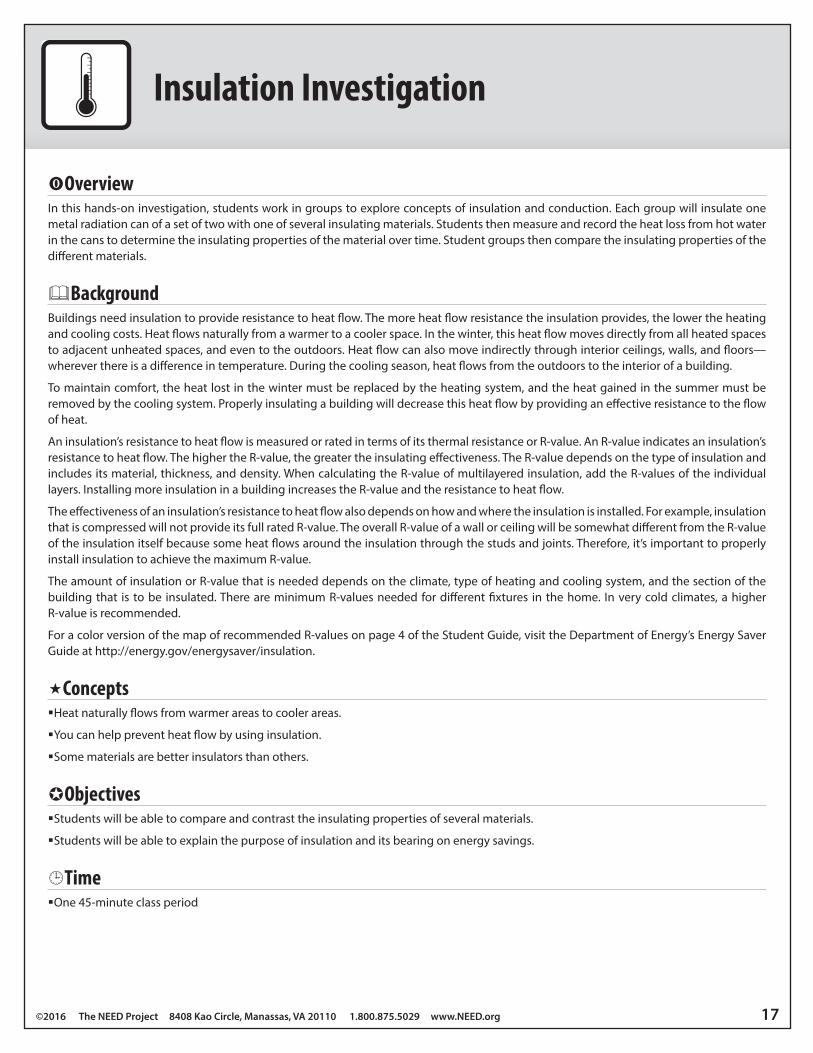
tOverviewIn this hands-on investigation, students work in groups to explore concepts of insulation and conduction. Each group will insulate one metal radiation can of a set of two with one of several insulating materials. Students then measure and record the heat loss from hot water in the cans to determine the insulating properties of the material over time. Student groups then compare the insulating properties of the different materials.
&BackgroundBuildings need insulation to provide resistance to heat flow. The more heat flow resistance the insulation provides, the lower the heating and cooling costs. Heat flows naturally from a warmer to a cooler space. In the winter, this heat flow moves directly from all heated spaces to adjacent unheated spaces, and even to the outdoors. Heat flow can also move indirectly through interior ceilings, walls, and floors—wherever there is a difference in temperature. During the cooling season, heat flows from the outdoors to the interior of a building.
To maintain comfort, the heat lost in the winter must be replaced by the heating system, and the heat gained in the summer must be removed by the cooling system. Properly insulating a building will decrease this heat flow by providing an effective resistance to the flow of heat.
An insulation’s resistance to heat flow is measured or rated in terms of its thermal resistance or R-value. An R-value indicates an insulation’s resistance to heat flow. The higher the R-value, the greater the insulating effectiveness. The R-value depends on the type of insulation and includes its material, thickness, and density. When calculating the R-value of multilayered insulation, add the R-values of the individual layers. Installing more insulation in a building increases the R-value and the resistance to heat flow.
The effectiveness of an insulation’s resistance to heat flow also depends on how and where the insulation is installed. For example, insulation that is compressed will not provide its full rated R-value. The overall R-value of a wall or ceiling will be somewhat different from the R-value of the insulation itself because some heat flows around the insulation through the studs and joints. Therefore, it’s important to properly install insulation to achieve the maximum R-value.
The amount of insulation or R-value that is needed depends on the climate, type of heating and cooling system, and the section of the building that is to be insulated. There are minimum R-values needed for different fixtures in the home. In very cold climates, a higher R-value is recommended.
For a color version of the map of recommended R-values on page 4 of the Student Guide, visit the Department of Energy’s Energy Saver Guide at http://energy.gov/energysaver/insulation.
Concepts �Heat naturally flows from warmer areas to cooler areas.
�You can help prevent heat flow by using insulation.
�Some materials are better insulators than others.
Objectives �Students will be able to compare and contrast the insulating properties of several materials.
�Students will be able to explain the purpose of insulation and its bearing on energy savings.
Time �One 45-minute class period
Insulation Investigation
18 Monitoring and Mentoring Teacher Guide
Materials �10 Radiation cans (5 sets of 2) �10 Lab thermometers �Insulating materials for five centers �5 Rolls of tape �Hot water �Timer or stopwatch �Rubber bands
2Preparation �Set up five centers, each with 2 radiation cans of the same color, 2 lab thermometers, 1 type of insulating material, 1 roll of tape, and a few rubber bands.
�Divide the class into five groups.
Procedure1. Review the Insulation Investigation on pages 28-29 of the Student Guide with the students. Have them write a hypothesis after reviewing
the procedure.
2. Assign the groups to their centers.
3. Explain that the groups must insulate only the sides of one of their cans.
4. Provide the groups with hot water when all of the groups have completed insulating their cans.
5. Begin timing when all of the groups are ready and have recorded the beginning temperatures. Direct the groups to record the temperatures of the water in the cans at two-minute intervals.
6. After 20 minutes, have the students calculate the differences in temperatures (∆T) for both cans from the beginning temperatures to the final temperatures.
7. Have the students complete the Data and Conclusion sections of the lab sheet.
8. Compare the insulating properties of the different insulating materials as a class, using the results of all of the groups.
9. Direct students to read Heat Loss on page 30 of the Student Guide to complete their conclusions.
Synthesis �Discuss or have students write about the role and value of insulation in homes and schools.
Extension: Energy House �Conduct NEED’s Energy House activity, available online at www.NEED.org, in which students buy materials and insulate a cardboard house.
©2016 The NEED Project 8408 Kao Circle, Manassas, VA 20110 1.800.875.5029 www.NEED.org 19
tOverviewThese activities teach students how to compare the energy-related properties of different types of light bulbs. Students develop an awareness and understanding of life cycle cost analysis.
&BackgroundTen years ago, we used a lot of energy in the form of electricity to make light to be able to see. Thirty percent of the electricity schools used was for lighting, and homes used about 14 percent of their electricity consumption for lighting. That’s because homes, schools, and other commercial buildings used a lot of incandescent lighting. These inefficient bulbs were perfected by Thomas Edison in 1879 and didn’t change much for the next 125 or more years! These bulbs were surprisingly inefficient, converting up to 90 percent of the electricity they consumed into heat.
The Energy Independence and Security Act of 2007 changed the standards for the efficiency of light bulbs used most often. As of 2014, most general use bulbs must be 30 percent more efficient than traditional, inefficient incandescent bulbs. What do the new standards mean for consumers? The purpose of the new efficiency standards is to give people the same amount of light using less energy. Most incandescent light bulbs have since been phased out and are no longer available for sale. This has resulted in significant energy savings for homes and schools. Newer, efficient lighting now accounts for only 17 percent of the electricity used in schools, and eleven percent used in homes.
There are several lighting choices on the market that meet the new efficiency standards. Energy-saving incandescent, or halogen, bulbs are different than traditional, inefficient incandescent bulbs because they have a capsule around the filament (the wire inside the bulb) filled with halogen gas. This allows the bulbs to last three times longer and use 25 percent less energy.
Compact fluorescent light bulbs (CFLs) provide the same amount of light as incandescent bulbs, but use up to 75 percent less energy and last ten times longer. CFLs produce very little heat. Using CFLs can help cut lighting costs and reduce environmental impacts. Today’s CFL bulbs fit almost any socket, produce a warm glow and, unlike earlier models, no longer flicker and dim. CFLs have a small amount of mercury inside and should always be recycled rather than thrown away. Many retailers recycle CFLs for free.
Light emitting diodes, better known as LEDs, are gaining in popularity. Once used mainly for exit signs and power on/off indicators, improved technology and lower prices are enabling LEDs to be used in place of incandescents and CFLs. LEDs are one of the most energy-efficient lighting choices available today. LEDs use 75 percent less energy than traditional incandescents, and have an average lifespan of at least 25,000 hours. The cost of LEDs has dropped in the last five years and may continue to drop. They use even less energy than CFLs, save more electricity, and produce fewer carbon dioxide emissions. The U.S. Department of Energy estimates that widespread adoption of LED lighting by 2027 would reduce lighting electricity demand by 33 percent. This would avoid construction of 40 new power plants.
Concepts �Lighting consumes a significant amount of energy.
�New technologies in lighting can reduce energy consumption.
�Life cycle costs should be considered in lighting decisions, not just purchase price.
�Light bulbs produce heat as well as light.
�We can use technologies to measure the energy consumed and light output of light bulbs.
Objectives �Students will be able to compare and describe the heat and light output of incandescent, compact fluorescent, and light emitting diode bulbs.
�Students will be able to describe the difference in the energy consumption of incandescent, compact fluorescent, and light emitting diode bulbs.
Time �Two 45-minute class periods
Facts of Light
20 Monitoring and Mentoring Teacher Guide
Materials
*NOTE: These activities can be done with one lamp if three lamps are not available. Students will need to conduct three separate trials rather than all three simultaneously.
2Preparation �Make copies or project the Light Bulb Comparison, Comparing Light Bulbs Answer Key, and The Light Meter explanation on pages 21-23.
�Set up the equipment needed to complete the investigations in the room at a place where all of the students can see them*.
�Divide the students into four groups. Assign one group to participate in each of the investigations and report the results to the class.
*NOTE: It is important to retain the packaging from the bulbs used in the investigations, as students will use the stated output information on the packaging during investigations.
Procedure1. Introduce the activity to the class, discussing the importance of lighting to our way of life. Use the Energy Definitions and Conversions on
page 10 of the Student Guide to review the information the students need to understand to complete the activities, if necessary.
2. Review with the students the Facts of Light on page 31 of the Student Guide.
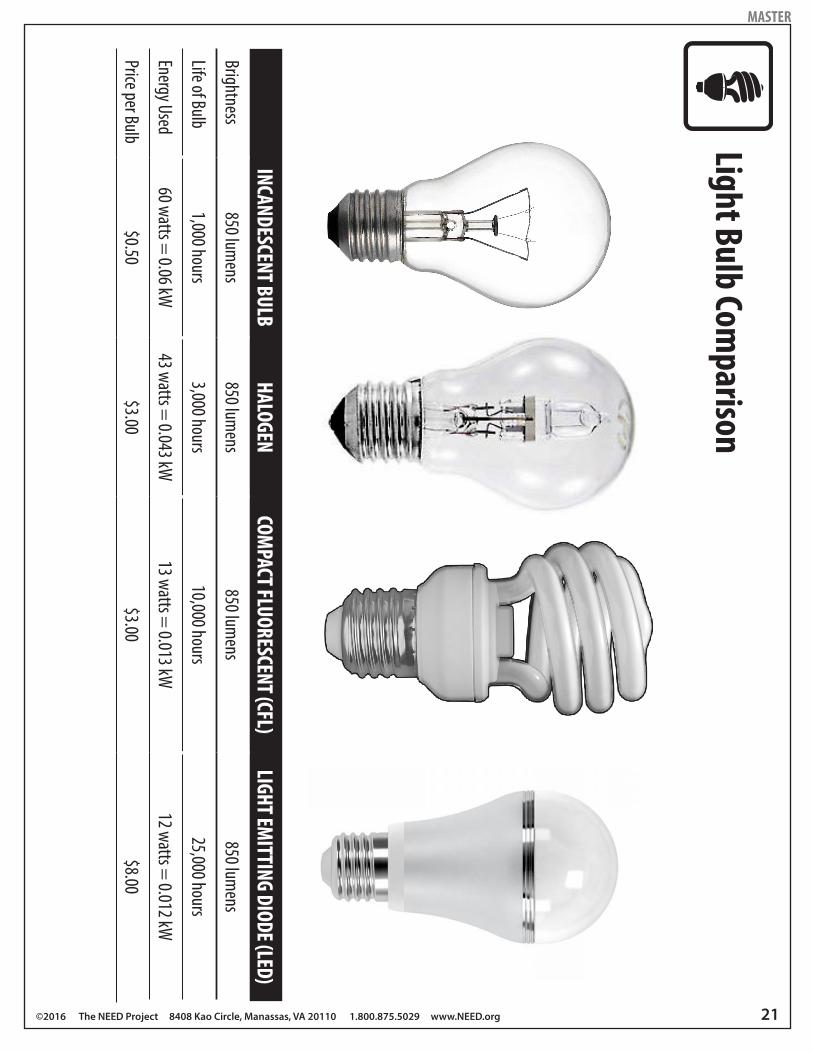
3. Review the Comparing Light Bulbs activity on page 32 of the Student Guide with the students. Review the instructions as a class. Use the Light Bulb Comparison master if necessary. Substitute the cost per kWh for your area. Discuss the difference between the commercial and residential rates and decide which one to use. Have them complete the activity.
4. Discuss the meaning of life cycle costs compared to purchase price, using the Comparing Light Bulbs Answer Key to assist the discussion.
5. Review The Light Meter explanation on page 33 of the Student Guide. Use The Light Meter master to explain its operation and the different ways that light is measured. Discuss Recommended Light Levels on page 34 of the Student Guide.
6. Have the assigned group of students complete the Light Level Investigation on page 35 and report the results to the class.
7. Review the investigation. If you have time, allow different groups of students to use the light meter to measure different areas, so that all of the students become familiar with its operation. Have the students report their results to the class.
8. Have the students compare their results to the Recommended Light Levels on page 34 of the Student Guide. Have the students individually complete the Conclusion section.
9. Review the Light Bulb Investigation 1 on page 36 of the Student Guide with the students. Have all students write their hypotheses in their Student Guides.
10. Have the assigned group of students complete the investigation and report the results to the class. If you have time, allow another group of students to conduct the same activity and compare the results. Have each student individually complete the Conclusion section.
11. Review the Light Bulb Investigation 2 on page 37 of the Student Guide with the students. Have all students write their hypotheses in their Student Guides.
12. Have the assigned group of students complete the investigation and report the results to the class. If you have time, allow another group of students to conduct the same activity and compare the results. Have each student individually complete the Conclusion section.
13. Review the Light Bulb Investigation 3 on page 38 of the Student Guide with the students. Have all students write their hypotheses in their Student Guides.
14. Have the assigned group of students complete the investigations and report the results to the class. If you have time, allow another group of students to conduct the same activity and compare the results. Have each student individually complete the Conclusion section.
Extensions �Have the students develop a marketing plan to convince people to use CFLs or LEDs. Students can make posters, flyers, radio announcements, and television infomercials to explain the benefits of using efficient lighting.
�Have students combine their results from Light Bulb Investigation 1 with their findings from Comparing Light Bulbs. Ask students to explain why these findings are related. If time allows, ask students to extend Light Bulb Investigation 1 further to include more types of lighting.
�3 Lamps* �3 Student thermometers
�1 Compact fluorescent bulb �1 Light meter
�1 Light emitting diode bulb �1 Incandescent light bulb
�1 Kill A Watt™ monitor �Tape
©2016 The NEED Project 8408 Kao Circle, Manassas, VA 20110 1.800.875.5029 www.NEED.org 21
MASTER
Light Bulb Comparison
INCANDESCENT BULBHALOGEN
COMPACT FLUORESCENT (CFL)
LIGHT EMITTING DIODE (LED)
Brightness850 lum
ens850 lum
ens850 lum
ens850 lum
ens
Life of Bulb1,000 hours
3,000 hours10,000 hours
25,000 hours
Energy Used60 watts =
0.06 kW43 watts =
0.043 kW13 watts =
0.013 kW12 watts =
0.012 kW
Price per Bulb$0.50
$3.00$3.00
$8.00
22 Monitoring and Mentoring Teacher Guide
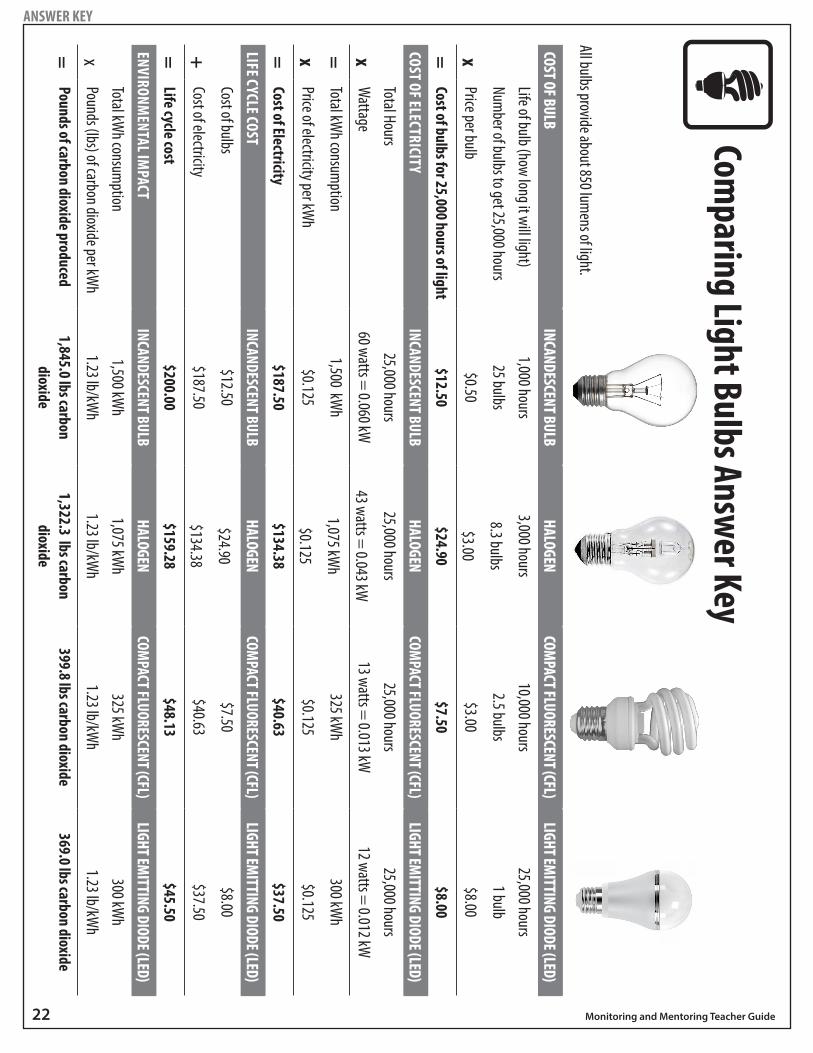
Comparing Light Bulbs Answer Key
ANSWER KEY
COST OF BULBINCANDESCENT BULB
HALOGENCOM
PACT FLUORESCENT (CFL)LIGHT EM
ITTING DIODE (LED)
Life of bulb (how long it will light)1,000 hours
3,000 hours10,000 hours
25,000 hoursNum
ber of bulbs to get 25,000 hours25 bulbs
8.3 bulbs2.5 bulbs
1 bulb
xPrice per bulb
$0.50$3.00
$3.00$8.00
=Cost of bulbs for 25,000 hours of light
$12.50$24.90
$7.50$8.00
COST OF ELECTRICITYINCANDESCENT BULB
HALOGENCOM
PACT FLUORESCENT (CFL)LIGHT EM
ITTING DIODE (LED)
Total Hours25,000 hours
25,000 hours25,000 hours
25,000 hours
xW
attage60 watts =
0.060 kW43 watts =
0.043 kW13 watts =
0.013 kW12 watts =
0.012 kW
=Total kW
h consumption
1,500 kWh
1,075 kWh
325 kWh
300 kWh
xPrice of electricity per kW
h$0.125
$0.125$0.125
$0.125
=Cost of Electricity
$187.50$134.38
$40.63$37.50
LIFE CYCLE COSTINCANDESCENT BULB
HALOGENCOM
PACT FLUORESCENT (CFL)LIGHT EM
ITTING DIODE (LED)
Cost of bulbs$12.50
$24.90$7.50
$8.00
+Cost of electricity
$187.50$134.38
$40.63$37.50
=Life cycle cost
$200.00$159.28
$48.13$45.50
ENVIRONMENTAL IM
PACTINCANDESCENT BULB
HALOGENCOM
PACT FLUORESCENT (CFL)LIGHT EM
ITTING DIODE (LED)
Total kWh consum
ption1,500 kW
h1,075 kW
h325 kW
h300 kW
h
xPounds (lbs) of carbon dioxide per kW
h1.23 lb/kW
h1.23 lb/kW
h1.23 lb/kW
h1.23 lb/kW
h
=Pounds of carbon dioxide produced
1,845.0 lbs carbon dioxide
1,322.3 lbs carbon dioxide
399.8 lbs carbon dioxide369.0 lbs carbon dioxide
All bulbs provide about 850 lumens of light.
©2016 The NEED Project 8408 Kao Circle, Manassas, VA 20110 1.800.875.5029 www.NEED.org 23
MASTER
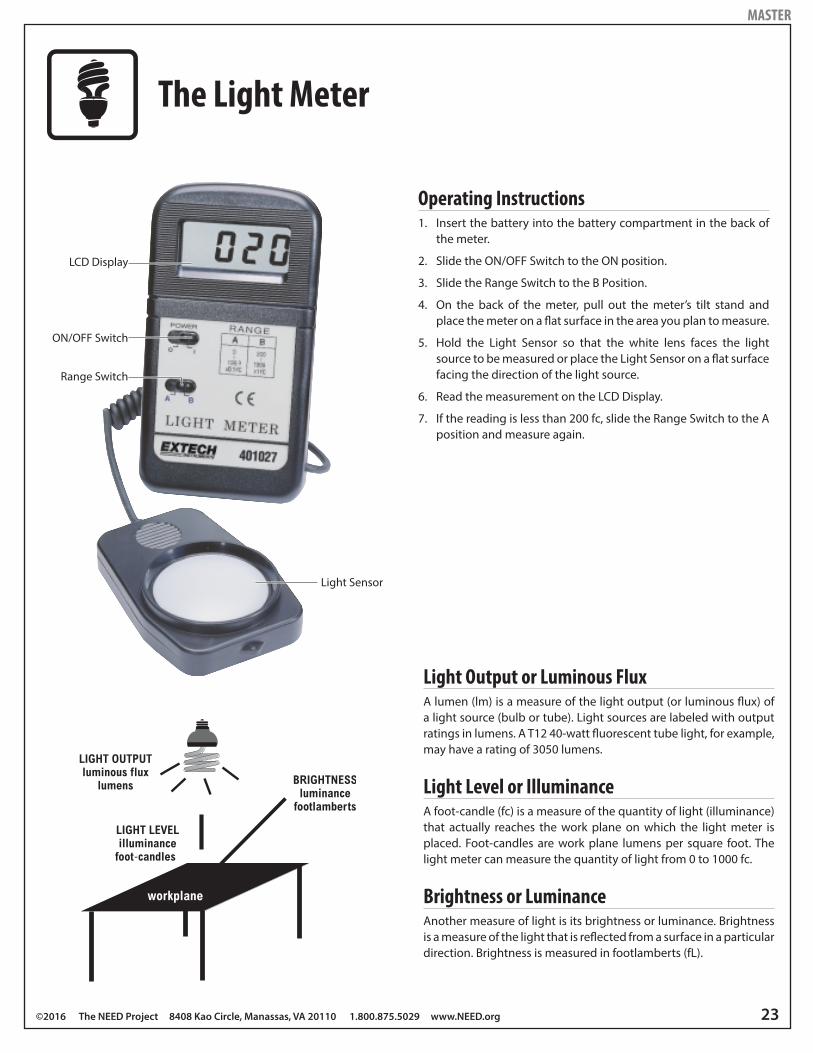
The Light Meter
Operating Instructions1. Insert the battery into the battery compartment in the back of
the meter.
2. Slide the ON/OFF Switch to the ON position.
3. Slide the Range Switch to the B Position.
4. On the back of the meter, pull out the meter’s tilt stand and place the meter on a flat surface in the area you plan to measure.
5. Hold the Light Sensor so that the white lens faces the light source to be measured or place the Light Sensor on a flat surface facing the direction of the light source.
6. Read the measurement on the LCD Display.
7. If the reading is less than 200 fc, slide the Range Switch to the A position and measure again.
Light Output or Luminous FluxA lumen (lm) is a measure of the light output (or luminous flux) of a light source (bulb or tube). Light sources are labeled with output ratings in lumens. A T12 40-watt fluorescent tube light, for example, may have a rating of 3050 lumens.
Light Level or IlluminanceA foot-candle (fc) is a measure of the quantity of light (illuminance) that actually reaches the work plane on which the light meter is placed. Foot-candles are work plane lumens per square foot. The light meter can measure the quantity of light from 0 to 1000 fc.
Brightness or LuminanceAnother measure of light is its brightness or luminance. Brightness is a measure of the light that is reflected from a surface in a particular direction. Brightness is measured in footlamberts (fL).
LCD Display
ON/OFF Switch
Range Switch
Light Sensor
24 Monitoring and Mentoring Teacher Guide
tOverviewMost commercial buildings use fluorescent tube lighting. This activity teaches students to determine if a building is using the most energy efficient lighting. The Flicker Checker differentiates between fluorescent lights with magnetic and electronic ballasts.
&BackgroundThe most important difference between incandescent and fluorescent light bulbs is the process by which they produce light. Incandescent bulbs produce light by passing current through a wire. The wire, often made of tungsten, is a resistor. A resistor is a device that turns electrical energy into heat and light energy.
The wire inside an incandescent light bulb is a special type of resistor called a filament. Many incandescent bulbs have clear glass so you can see the filament. In addition to the wire, the bulb contains a gas called argon. The argon gas helps the bulb last longer. If the wire were exposed to air, it would oxidize and the wire would burn out faster. The argon does not react with the metal like air does. The argon also helps the filament become a better resistor—it actually helps it produce more light than air would. Resistors emit more heat than light. In an incandescent light bulb, 90 percent of the energy from the electricity is turned into heat and only 10 percent of the energy is turned into light.
A fluorescent bulb produces light differently. It produces light by passing an electric current through a gas. The electrons in the molecules of gas become excited because of the electrical energy and some escape from the gas molecules. They bounce around and crash into the walls of the tube. The walls of the tubes are painted with a material that gives off light (it fluoresces) when electrons hit it. If you have ever seen the inside of a fluorescent tube, the glass is coated with white powdery material. This powder is what fluoresces (gives off light).
The part of a fluorescent light bulb that sends the current through the gas is called a ballast. There is a part of the ballast at each end of the tube. The ballast is an electromagnet that can produce a large voltage between the two parts. It is this voltage that gives the electrons of the gas molecules the energy inside the tube.
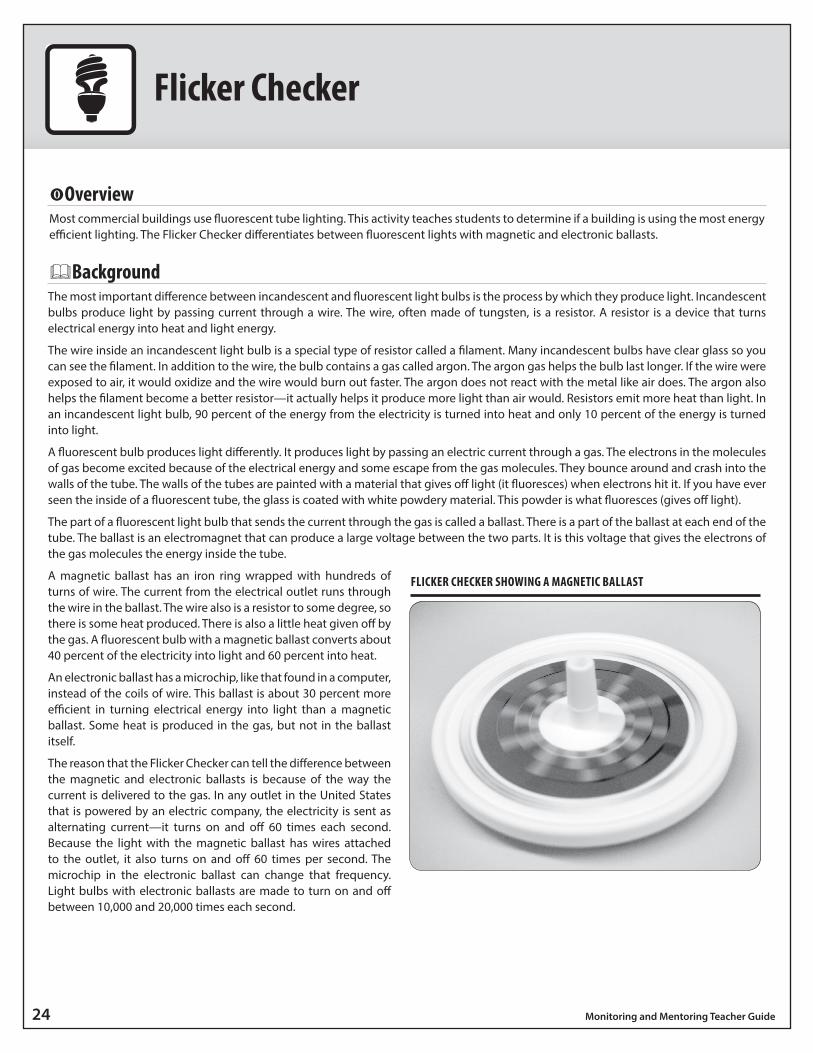
A magnetic ballast has an iron ring wrapped with hundreds of turns of wire. The current from the electrical outlet runs through the wire in the ballast. The wire also is a resistor to some degree, so there is some heat produced. There is also a little heat given off by the gas. A fluorescent bulb with a magnetic ballast converts about 40 percent of the electricity into light and 60 percent into heat.
An electronic ballast has a microchip, like that found in a computer, instead of the coils of wire. This ballast is about 30 percent more efficient in turning electrical energy into light than a magnetic ballast. Some heat is produced in the gas, but not in the ballast itself.
The reason that the Flicker Checker can tell the difference between the magnetic and electronic ballasts is because of the way the current is delivered to the gas. In any outlet in the United States that is powered by an electric company, the electricity is sent as alternating current—it turns on and off 60 times each second. Because the light with the magnetic ballast has wires attached to the outlet, it also turns on and off 60 times per second. The microchip in the electronic ballast can change that frequency. Light bulbs with electronic ballasts are made to turn on and off between 10,000 and 20,000 times each second.
Flicker Checker
FLICKER CHECKER SHOWING A MAGNETIC BALLAST
©2016 The NEED Project 8408 Kao Circle, Manassas, VA 20110 1.800.875.5029 www.NEED.org 25
Concepts �Lighting consumes a fair amount of electricity in school buildings—about 17 percent.
�Many commercial buildings, including schools, use fluorescent tube lighting.
�New fluorescent lighting technologies can reduce energy consumption.
�Simple tools can help students determine the kind of lighting used in a building.
Objectives �Students will be able to determine the type of ballast used in fluorescent lighting in buildings.
�Students will use persuasive writing/speaking to encourage others to install the most efficient lighting.
Time �One 45-minute class period
Materials �Flicker Checker
Procedure1. Review the Flicker Checker Investigation on page 39 of the Student Guide, explaining the difference between incandescent and
fluorescent lighting and between magnetic and electronic ballasts.
2. Have the students as a class examine the lighting in several areas of the school, using the Flicker Checker to determine if the fluorescent lights have magnetic or electronic ballasts. It is important to be sure students are testing the device under fluorescent light only, as other lighting types can provide a false reading.
3. Have the students write letters to the principal, energy manager, building manager, or district administration if there are areas that do not have the most efficient lighting installed.
26 Monitoring and Mentoring Teacher Guide
tOverview These activities teach students how to read and interpret the energy information on the nameplates of electrical appliances and machines, to determine the amount of electricity consumed by those appliances over time, to calculate the cost of the electricity used, and to determine the amount of carbon dioxide produced by the energy use. Students develop an awareness of school and personal electricity consumption and its effect on the environment.
&BackgroundElectric NameplatesEvery appliance and machine in the United States that uses electricity has a nameplate with the voltage required and the wattage. Sometimes, the current is listed instead of the voltage. If any two of the three measurements are listed, the third can be determined using the following formula: wattage = current x voltage.
Often, you will see the letters UL on the nameplate. The UL mark means that samples of the product have been tested to recognized safety standards and found to be reasonably free from fire, electric shock, and related safety hazards.
Using the data on the nameplate, the amount of time the appliance is used, and the cost of electricity, you can determine the cost of operating the appliance. To determine the cost to operate an appliance for one hour, use this formula:
cost per hour = wattage (kW) x cost/kWh.
Environmental EffectsCarbon dioxide (CO2) is a greenhouse gas. Human activities have dramatically increased its concentration in the atmosphere. Since the Industrial Revolution, the level of CO2 in the atmosphere has increased by over 40 percent. Generating electricity accounts for a large portion of CO2 emissions in the U.S. Some electricity generation—such as hydropower, solar, wind, geothermal, and nuclear—does not produce carbon dioxide because no fuel is burned.
A large amount of the nation’s electricity (38.6 percent), however, comes from burning coal. Another 30.1 percent comes from burning natural gas, petroleum, and biomass. There is a direct correlation between the amount of electricity we use and the amount of CO2 emitted into the atmosphere. On average, generating a kilowatt-hour (kWh) of electricity from fossil fuels produces 1.23 pounds of CO2, which is emitted into the atmosphere.
Concepts �The electrical appliances and machines we use consume a lot of energy and affect the environment.
�We can determine the amount of electricity that appliances use, the cost, and the amount of CO2 emitted.
Objectives �Students will be able to determine and list the energy requirements of electrical appliances.
�Students will be able to calculate the cost of using electrical devices.
�Students will be able to determine the environmental impact of using electrical devices.
Time �Three 45-minute class periods, plus homework
Electrical Devices and Their Impacts
©2016 The NEED Project 8408 Kao Circle, Manassas, VA 20110 1.800.875.5029 www.NEED.org 27
Procedure1. Introduce the activity to the class, using the Energy Definitions and Conversions on page 10 of the Student Guide to review the information
the students will need to complete the activity.
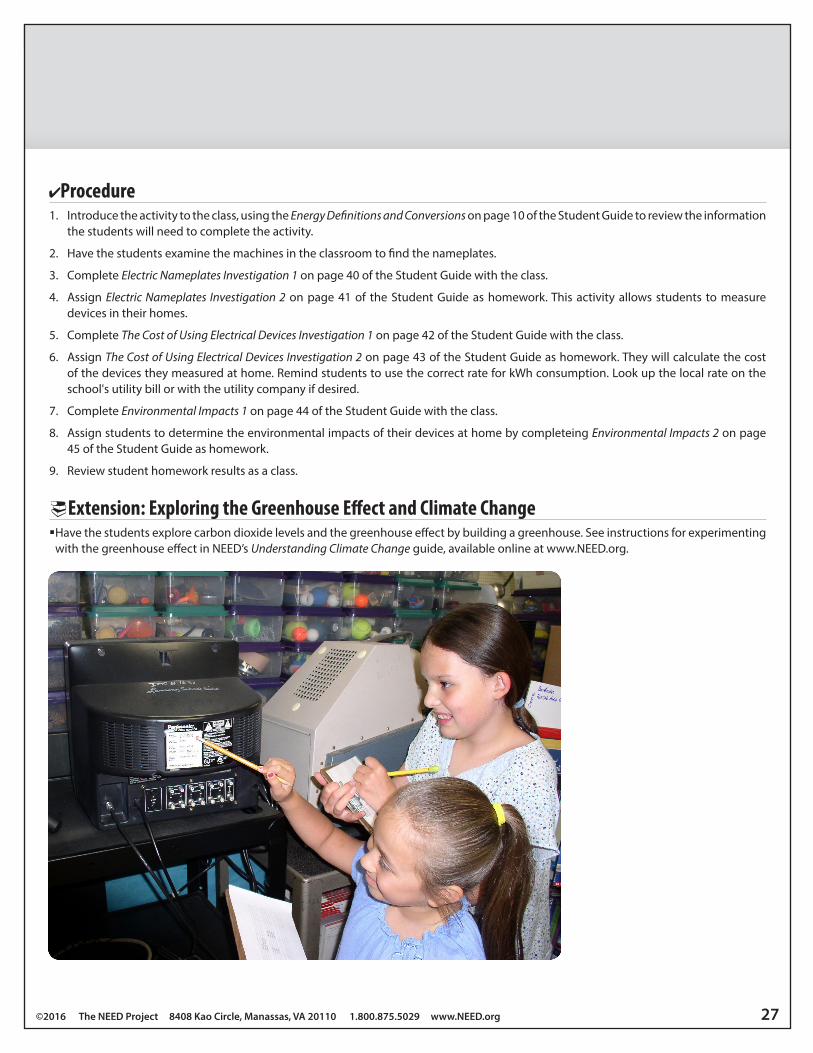
2. Have the students examine the machines in the classroom to find the nameplates.
3. Complete Electric Nameplates Investigation 1 on page 40 of the Student Guide with the class.
4. Assign Electric Nameplates Investigation 2 on page 41 of the Student Guide as homework. This activity allows students to measure devices in their homes.
5. Complete The Cost of Using Electrical Devices Investigation 1 on page 42 of the Student Guide with the class.
6. Assign The Cost of Using Electrical Devices Investigation 2 on page 43 of the Student Guide as homework. They will calculate the cost of the devices they measured at home. Remind students to use the correct rate for kWh consumption. Look up the local rate on the school's utility bill or with the utility company if desired.
7. Complete Environmental Impacts 1 on page 44 of the Student Guide with the class.
8. Assign students to determine the environmental impacts of their devices at home by completeing Environmental Impacts 2 on page 45 of the Student Guide as homework.
9. Review student homework results as a class.
Extension: Exploring the Greenhouse Effect and Climate Change �Have the students explore carbon dioxide levels and the greenhouse effect by building a greenhouse. See instructions for experimenting with the greenhouse effect in NEED’s Understanding Climate Change guide, available online at www.NEED.org.
28 Monitoring and Mentoring Teacher Guide
OFF
EnergyGuide Labels
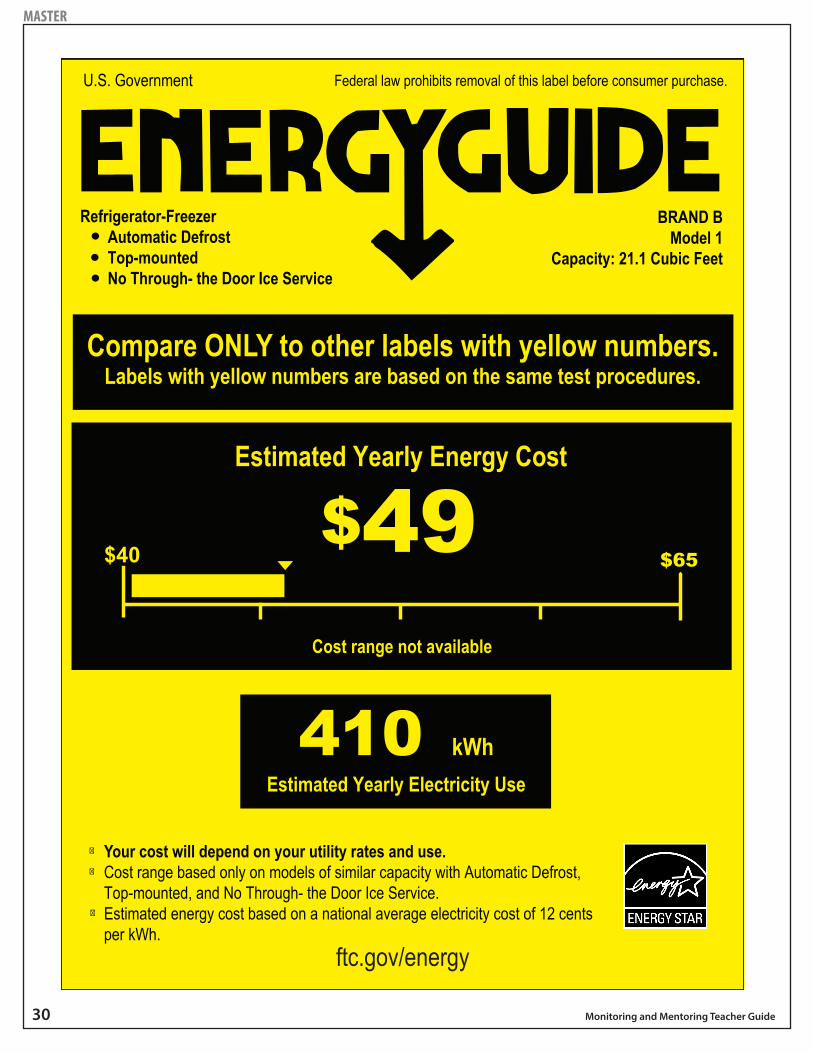
tOverviewThis activity teaches students to read and compare the EnergyGuide labels required on most large appliances—such as refrigerators, furnaces, water heaters, and air conditioners. Students develop an awareness of life cycle cost analysis, payback period, and efficient technologies.
&BackgroundThe Federal Government requires that appliance manufacturers provide information about the energy efficiency of their products to consumers so that they can compare the life cycle cost of the appliances, as well as the purchase price. The life cycle cost of an appliance includes the purchase price plus the operating cost over the expected life of the appliance.
The law requires that manufacturers place EnergyGuide labels on all new refrigerators, freezers, water heaters, dishwashers, clothes washers, room air conditioners, central air conditioners, heat pumps, furnaces, and boilers. The EnergyGuide labels list the manufacturer, the model, the capacity, the features, the average amount of energy the appliance will use a year, its comparison with similar models, and the estimated yearly energy cost.
For refrigerators, freezers, water heaters, dishwashers, and clothes washers, the labels compare energy consumption in kWh/year or therms/year. For room air conditioners, central air conditioners, heat pumps, furnaces, and boilers, the rating is not in terms of energy consumption, but in energy efficiency ratings, as follows:
�EER–Energy Efficiency Rating (room air conditioners)
�SEER–Seasonal Energy Efficiency Rating (central air conditioners)
�HSPF–Heating Season Performance Factor (with SEER heat pumps)
�AFUE–Annual Fuel Utilization Efficiency (furnaces and boilers)
The estimated annual operating cost is based on recent national average prices of electricity and/or natural gas and assumes typical operating behavior. For example, the cost for clothes washers assumes a typical washer would be used to wash eight loads of laundry per week.
Concepts �Some appliances are more energy efficient than others.
�The energy efficiency of major appliances can be quantified.
�The Federal Government requires that most major appliances carry labels to inform consumers of their energy efficiency ratings.
�Efficient appliances are usually more expensive to buy than less efficient models, but the life cycle cost of efficient appliances is usually much less than the less expensive appliances.
�Payback period is the operating time for an energy efficient appliance before the higher up-front (purchase) cost is recouped by lower energy costs.
Objectives �Students will be able to read and interpret the information on EnergyGuide labels.
�Students will be able to compare the life cycle costs and payback periods for appliances using the information on their EnergyGuide labels.
Time �One 45-minute class period
©2016 The NEED Project 8408 Kao Circle, Manassas, VA 20110 1.800.875.5029 www.NEED.org 29
2Preparation �Make copies or project the EnergyGuide Label and Comparing EnergyGuide Labels masters on pages 30-31.
Procedure1. Introduce the activity to the class, using the EnergyGuide Label master and/or page 46 of the Student Guide—Reading EnergyGuide
Labels. Discuss why the Federal Government would be involved in labeling the efficiency of appliances. Note the differences betweeen the labels on both pages.
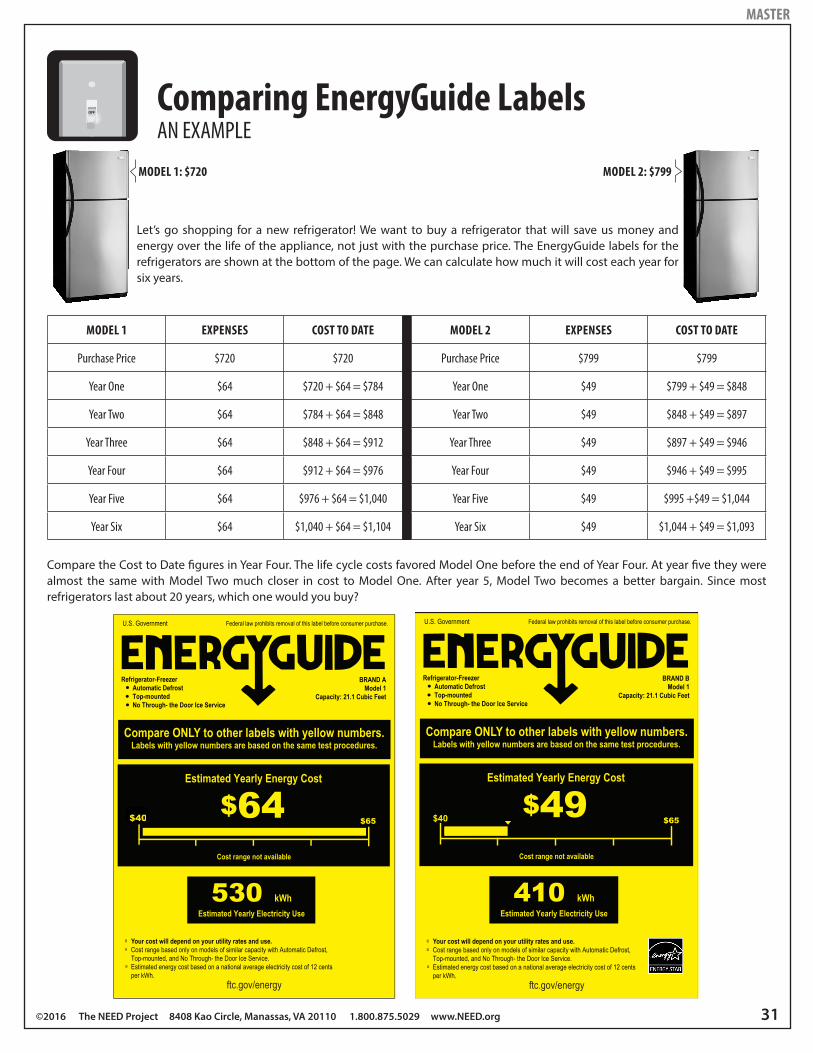
2. Review Comparing EnergyGuide Labels, using the master on page 31. Review the concept of life cycle cost and explain the concept of payback period. Discuss with the class how the chart shows that even though Model 2 is more expensive to buy, it is a better bargain because of the lower energy costs. Explain that the payback period for this refrigerator is six years, because at that time, you will start spending less.
3. Have the students individually complete the Comparing Appliances activity on page 47 of the Student Guide. They will be using the principles discussed before, but now with a water heater. Review. Answers can be found on page 7.
Extension Activity �Take the students on a field trip or photo field trip or encourage them to visit a big box or appliance store. They should examine and compare the EnergyGuide labels on large appliances and the energy nameplates on small appliances and machines. Have them take notes or pictures to compare when they return to class.
30 Monitoring and Mentoring Teacher Guide
MASTER
©2016 The NEED Project 8408 Kao Circle, Manassas, VA 20110 1.800.875.5029 www.NEED.org 31
MASTER
OFFComparing EnergyGuide Labels
Let’s go shopping for a new refrigerator! We want to buy a refrigerator that will save us money and energy over the life of the appliance, not just with the purchase price. The EnergyGuide labels for the refrigerators are shown at the bottom of the page. We can calculate how much it will cost each year for six years.
MODEL 1 EXPENSES COST TO DATE MODEL 2 EXPENSES COST TO DATE
Purchase Price $720 $720 Purchase Price $799 $799
Year One $64 $720 + $64 = $784 Year One $49 $799 + $49 = $848
Year Two $64 $784 + $64 = $848 Year Two $49 $848 + $49 = $897
Year Three $64 $848 + $64 = $912 Year Three $49 $897 + $49 = $946
Year Four $64 $912 + $64 = $976 Year Four $49 $946 + $49 = $995
Year Five $64 $976 + $64 = $1,040 Year Five $49 $995 +$49 = $1,044
Year Six $64 $1,040 + $64 = $1,104 Year Six $49 $1,044 + $49 = $1,093
Compare the Cost to Date figures in Year Four. The life cycle costs favored Model One before the end of Year Four. At year five they were almost the same with Model Two much closer in cost to Model One. After year 5, Model Two becomes a better bargain. Since most refrigerators last about 20 years, which one would you buy?
MODEL 1: $720 MODEL 2: $799
AN EXAMPLE

32 Monitoring and Mentoring Teacher Guide
tOverview These activities teach students how to use a Kill A Watt® monitor to measure and monitor the electric power consumption of electrical machines and devices. These activities are very similar to those in the nameplates investigation, but expand on the skills used by incorporating a measurement tool and examining devices in various modes of operation.
Concepts �The electrical devices and machines we use consume energy.
�We can monitor the amount of electricity that machines use and calculate the cost.
�Some machines use more electricity in active mode than in idle mode.
�We can monitor the difference in electricity usage between active and idle modes and calculate the cost.
�Some machines use electricity even when they are turned off.
�We can monitor the electricity usage of machines that are turned off and calculate the cost.
Objectives �Students will be able to use a Kill A Watt® monitor to gather electric consumption data from a variety of electrical devices in the school in active and idle modes, as well as when they are turned off.
�Students will be able to calculate the cost of using electrical devices.
Time �Three 45-minute class periods
Materials �Kill A Watt® monitor
�Pluggable electrical devices
2Preparation �Practice using the Kill A Watt® monitor until you are confident with its functions.
�Make copies or project the Kill A Watt® Monitor Instructions on page 33.
Procedure1. Have the students go to page 48 of the Student Guide—Kill A Watt® Monitor.
2. Explain what a Kill A Watt® monitor does and review the operating instructions, using the master to show the parts of the monitor. Demonstrate the operation of the monitor to the students.
3. Review Kill A Watt® Investigation 1 on page 49 of the Student Guide with the students. With the students’ help, select several electrical devices to monitor.
4. Divide the class into groups and assign each group to monitor one of the selected devices for a six-minute period. Have each group share its results with the rest of the class.
5. Have the students complete the computations and answer the conclusion questions.
6. Review with the class.
7. Repeat the process for Kill A Watt® Investigation 2 and Kill A Watt® Investigation 3 on pages 50–51 of the Student Guide.
8. Discuss how to save energy when using electrical devices, incorporating the data that has been gathered.
Kill A Watt® Investigations
©2016 The NEED Project 8408 Kao Circle, Manassas, VA 20110 1.800.875.5029 www.NEED.org 33
Kill A Watt® Monitor Instructions
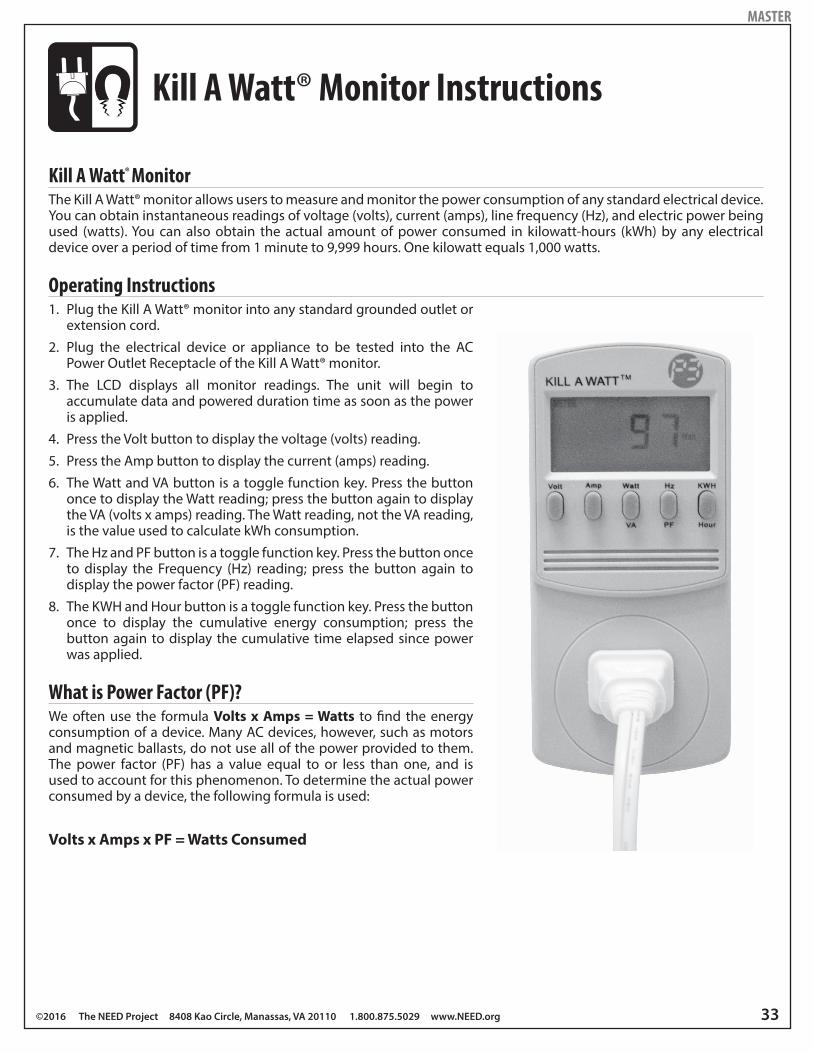
Kill A Watt® MonitorThe Kill A Watt® monitor allows users to measure and monitor the power consumption of any standard electrical device. You can obtain instantaneous readings of voltage (volts), current (amps), line frequency (Hz), and electric power being used (watts). You can also obtain the actual amount of power consumed in kilowatt-hours (kWh) by any electrical device over a period of time from 1 minute to 9,999 hours. One kilowatt equals 1,000 watts.
Operating Instructions1. Plug the Kill A Watt® monitor into any standard grounded outlet or
extension cord.2. Plug the electrical device or appliance to be tested into the AC
Power Outlet Receptacle of the Kill A Watt® monitor.3. The LCD displays all monitor readings. The unit will begin to
accumulate data and powered duration time as soon as the power is applied.
4. Press the Volt button to display the voltage (volts) reading.5. Press the Amp button to display the current (amps) reading.6. The Watt and VA button is a toggle function key. Press the button
once to display the Watt reading; press the button again to display the VA (volts x amps) reading. The Watt reading, not the VA reading, is the value used to calculate kWh consumption.
7. The Hz and PF button is a toggle function key. Press the button once to display the Frequency (Hz) reading; press the button again to display the power factor (PF) reading.
8. The KWH and Hour button is a toggle function key. Press the button once to display the cumulative energy consumption; press the button again to display the cumulative time elapsed since power was applied.
What is Power Factor (PF)?We often use the formula Volts x Amps = Watts to find the energy consumption of a device. Many AC devices, however, such as motors and magnetic ballasts, do not use all of the power provided to them. The power factor (PF) has a value equal to or less than one, and is used to account for this phenomenon. To determine the actual power consumed by a device, the following formula is used:
Volts x Amps x PF = Watts Consumed
MASTER
34 Monitoring and Mentoring Teacher Guide
OFF
School Building Survey
tOverviewIn this activity, students investigate the construction of their school, the fuels the school uses to meet its energy needs, the amount of energy the school uses, and the ways that the school’s energy consumption is managed and controlled. The students brainstorm and recommend ways that the school can save energy.
&BackgroundSchools use a lot of energy to create a safe, comfortable, and productive environment for students to learn. Schools use energy to maintain comfortable temperatures, produce light, heat water, cook food, operate vehicles, and run hundreds of electrical machines and appliances–televisions, public address systems, scoreboards, computers, copiers, alarm systems, exit signs, etc. Most of the energy consumed by schools is supplied by electricity (54%) and natural gas (35%).
When an energy survey of a building is conducted, four main areas are included:
Building Envelope: The building envelope is the physical structure—the walls, windows, roof, doors, floor, stairwells, ceiling, and insulation. The design and construction of the structure is a major factor in heating, cooling, and lighting costs.
Heating/Cooling Systems: Heating and cooling the building is the largest single expense of the school. Most schools are heated with natural gas, some with electricity or heating oil. Electricity is usually used for cooling. Maintenance and temperature control of these systems makes a significant impact on energy costs. These systems are often referred to as HVAC systems.
Water Heating: Water heaters provide hot water for classrooms, lavatories, showers, laboratories, snack bars, and kitchens. They are usually fueled by natural gas or electricity. Insulation, maintenance, and control of temperature and water flow can reduce energy costs for the school.
Lighting: Electricity is used to provide artificial lighting to classrooms, gyms, auditoriums, corridors, offices, sports fields, and parking areas. Maximizing the use of natural light and installing efficient fluorescent lighting systems can significantly reduce energy costs. Controlling light intensity, turning off unnecessary lights, and proper system maintenance can also make an impact on lighting costs for the school.
Concepts �Schools use a lot of energy to produce a safe, comfortable learning environment.
�Many factors determine the amount of energy a school uses.
�Schools can reduce energy consumption by converting older systems using energy efficient technologies, instituting energy conservation measures, and educating students, administrators, and staff.
�Reducing energy use saves schools money that can be used for other programs and helps protect the environment.
Objective �Students will conduct an energy survey of the school building and develop recommendations to save energy in the school building, based on their observations.
Time �Two–three 45-minute class periods
©2016 The NEED Project 8408 Kao Circle, Manassas, VA 20110 1.800.875.5029 www.NEED.org 35
2Preparation �Obtain permission to conduct the survey, if necessary, from staff members, administrators, and facilities staff.
�Arrange for the building supervisor or principal to visit the class to provide the information in the General Information section of the survey.
�Arrange for a member of the maintenance or facilities staff to take the class on a tour of the building to explain the heating/cooling systems and to answer questions on the survey.
Procedure1. Preview the School Building Survey on pages 52-53 of the Student Guide with the students. As you go over the questions on the survey,
decide as a class who might best answer each question.
2. Have the building supervisor or principal visit the class to discuss the questions in the General Information section of the survey.
3. Take a tour of the building and grounds with a maintenance or facilities staff member answering the questions in the Building Envelope section. Have the staff person return to the class to discuss any remaining questions on the survey.
4. Discuss the findings with the class and brainstorm a list of ways the school could conserve energy.
5. Have the students draw diagrams of the school on the blank grid on page 54 of the Student Guide, indicating the energy information they discovered on their tour, and using any symbols used in earlier activities.
6. Place the students in groups of four and have each group develop a presentation to explain their findings and recommendations using the organizer on page 57 of the Student Guide. Presentations can be done in many mediums or formats including digital presentations, videos, display boards, or even skits.
36 Monitoring and Mentoring Teacher Guide
OFF
School Energy Consumption Survey
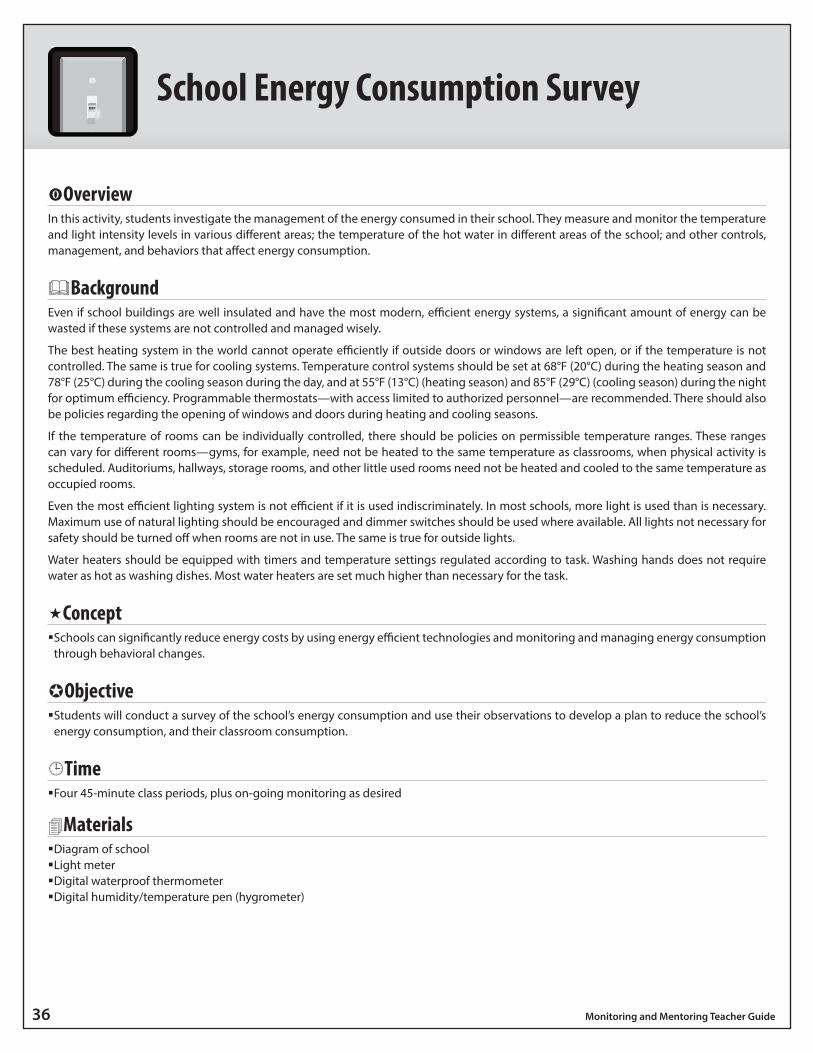
tOverviewIn this activity, students investigate the management of the energy consumed in their school. They measure and monitor the temperature and light intensity levels in various different areas; the temperature of the hot water in different areas of the school; and other controls, management, and behaviors that affect energy consumption.
&BackgroundEven if school buildings are well insulated and have the most modern, efficient energy systems, a significant amount of energy can be wasted if these systems are not controlled and managed wisely.
The best heating system in the world cannot operate efficiently if outside doors or windows are left open, or if the temperature is not controlled. The same is true for cooling systems. Temperature control systems should be set at 68°F (20°C) during the heating season and 78°F (25°C) during the cooling season during the day, and at 55°F (13°C) (heating season) and 85°F (29°C) (cooling season) during the night for optimum efficiency. Programmable thermostats—with access limited to authorized personnel—are recommended. There should also be policies regarding the opening of windows and doors during heating and cooling seasons.
If the temperature of rooms can be individually controlled, there should be policies on permissible temperature ranges. These ranges can vary for different rooms—gyms, for example, need not be heated to the same temperature as classrooms, when physical activity is scheduled. Auditoriums, hallways, storage rooms, and other little used rooms need not be heated and cooled to the same temperature as occupied rooms.
Even the most efficient lighting system is not efficient if it is used indiscriminately. In most schools, more light is used than is necessary. Maximum use of natural lighting should be encouraged and dimmer switches should be used where available. All lights not necessary for safety should be turned off when rooms are not in use. The same is true for outside lights.
Water heaters should be equipped with timers and temperature settings regulated according to task. Washing hands does not require water as hot as washing dishes. Most water heaters are set much higher than necessary for the task.
Concept �Schools can significantly reduce energy costs by using energy efficient technologies and monitoring and managing energy consumption through behavioral changes.
Objective �Students will conduct a survey of the school’s energy consumption and use their observations to develop a plan to reduce the school’s energy consumption, and their classroom consumption.
Time �Four 45-minute class periods, plus on-going monitoring as desired
Materials �Diagram of school �Light meter �Digital waterproof thermometer �Digital humidity/temperature pen (hygrometer)
©2016 The NEED Project 8408 Kao Circle, Manassas, VA 20110 1.800.875.5029 www.NEED.org 37
2Preparation �Arrange for the school district’s energy manager or other expert to speak to the class about what is being done in the district to conserve energy.
�Obtain permission for the students to survey and monitor classrooms and non-class areas of the school building.
�Draw master diagrams of the school on the blank grid (pages 43-44 of the Teacher Guide), numbering the common areas and non-class rooms, then make copies of the diagrams, or project as needed.
�Divide the class into six groups, assigning each group two classrooms, one common area, and one non-class area or office to monitor, using the diagram of the school. Choose areas from each side of the building, upstairs and downstairs, to get a wide sampling.
NOTE: If the entire school is participating, have students monitor only their own classroom and a primary buddies’ classroom, along with the common areas and non-class rooms. See page 40 for a description of primary buddies.
�Decide the time frame in which the students will be monitoring their areas. You can choose to have the students monitor the areas only once, every day for a week, or once a week or month. Make copies of the Recording Form on page 56 of the Student Guide for each group of students, depending on the amount of monitoring the students will be doing.
Procedure1. Have the students read School Energy Consumption Survey on page 55 of the Student Guide. Discuss each of the four areas highlighted.
Have the students brainstorm a list of questions for the energy manager.
2. Have the energy manager or another expert make a presentation to the students, and answer their questions.
3. Explain to the students they will be monitoring areas of the school in groups, then review the Recording Form to inform them of the information they will be gathering and the tools they will be using.
4. Demonstrate how to operate the digital waterproof thermometer and the digital humidity/temperature pen, using the masters if necessary (pages 38-39). Review use of the light meter, if necessary.
NOTE: Only the digital waterproof thermometer can be used for measuring the temperature of water. The digital humidity/temperature pen can only be used to measure air temperature and should not be allowed to get wet.
5. Allow each group 5-10 minutes to collect the data on the Recording Form.
6. Analyze the results, looking for explanations of variations. Is it hotter on the south side of the building, in upstairs rooms? Discuss the findings and brainstorm ways to conserve energy. Draw up a list of recommendations to present to the school administration and the energy manager.
7. Have each student individually design a Plan to Save Energy for the spaces they studied using the Findings and Recommendations form on page 57 of the Student Guide. Using the students’ answers, brainstorm with the class to develop a master plan to save energy in the school.
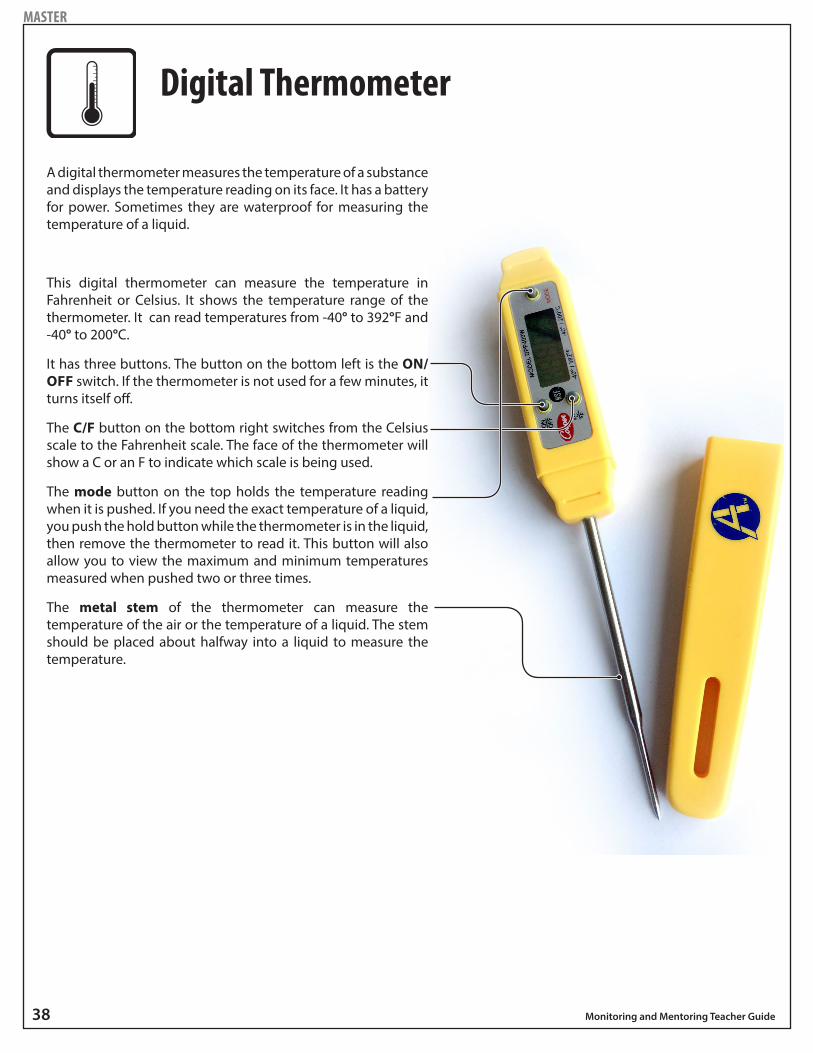
38 Monitoring and Mentoring Teacher Guide
MASTER
Digital Thermometer
A digital thermometer measures the temperature of a substance and displays the temperature reading on its face. It has a battery for power. Sometimes they are waterproof for measuring the temperature of a liquid.
This digital thermometer can measure the temperature in Fahrenheit or Celsius. It shows the temperature range of the thermometer. It can read temperatures from -40° to 392°F and -40° to 200°C.
It has three buttons. The button on the bottom left is the ON/OFF switch. If the thermometer is not used for a few minutes, it turns itself off.
The C/F button on the bottom right switches from the Celsius scale to the Fahrenheit scale. The face of the thermometer will show a C or an F to indicate which scale is being used.
The mode button on the top holds the temperature reading when it is pushed. If you need the exact temperature of a liquid, you push the hold button while the thermometer is in the liquid, then remove the thermometer to read it. This button will also allow you to view the maximum and minimum temperatures measured when pushed two or three times.
The metal stem of the thermometer can measure the temperature of the air or the temperature of a liquid. The stem should be placed about halfway into a liquid to measure the temperature.
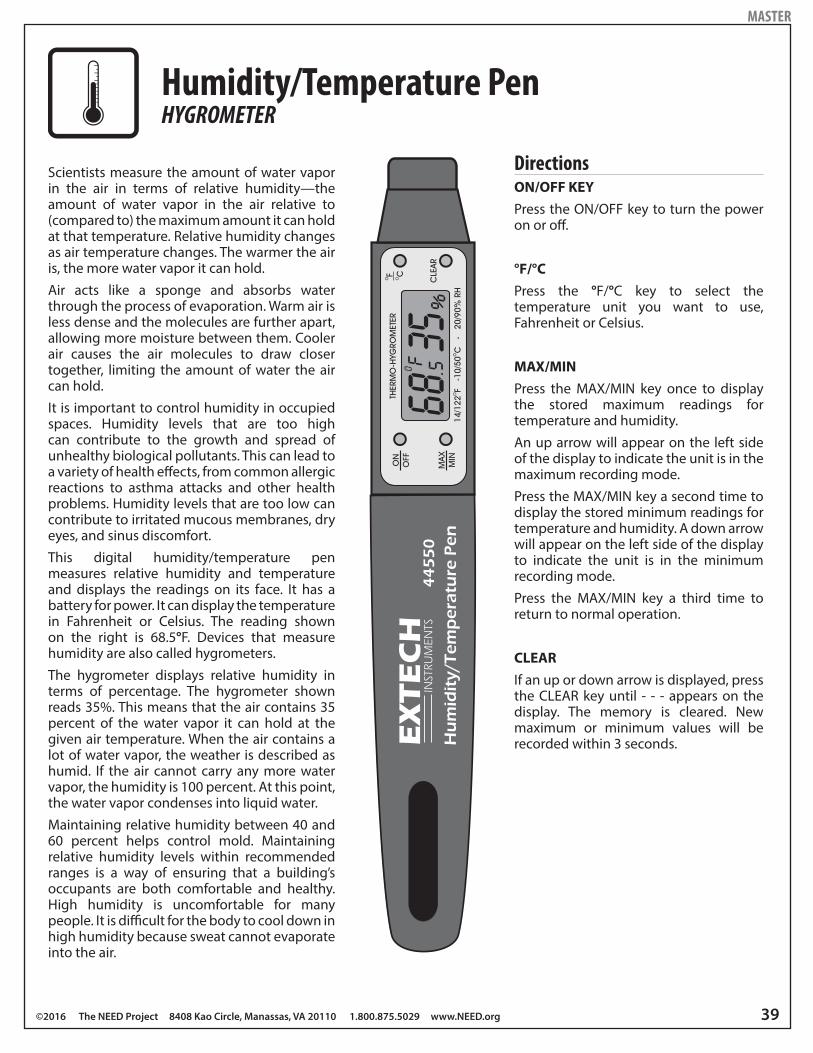
©2016 The NEED Project 8408 Kao Circle, Manassas, VA 20110 1.800.875.5029 www.NEED.org 39
Humidity/Temperature PenHYGROMETER
Scientists measure the amount of water vapor in the air in terms of relative humidity—the amount of water vapor in the air relative to (compared to) the maximum amount it can hold at that temperature. Relative humidity changes as air temperature changes. The warmer the air is, the more water vapor it can hold.Air acts like a sponge and absorbs water through the process of evaporation. Warm air is less dense and the molecules are further apart, allowing more moisture between them. Cooler air causes the air molecules to draw closer together, limiting the amount of water the air can hold. It is important to control humidity in occupied spaces. Humidity levels that are too high can contribute to the growth and spread of unhealthy biological pollutants. This can lead to a variety of health effects, from common allergic reactions to asthma attacks and other health problems. Humidity levels that are too low can contribute to irritated mucous membranes, dry eyes, and sinus discomfort. This digital humidity/temperature pen measures relative humidity and temperature and displays the readings on its face. It has a battery for power. It can display the temperature in Fahrenheit or Celsius. The reading shown on the right is 68.5°F. Devices that measure humidity are also called hygrometers.The hygrometer displays relative humidity in terms of percentage. The hygrometer shown reads 35%. This means that the air contains 35 percent of the water vapor it can hold at the given air temperature. When the air contains a lot of water vapor, the weather is described as humid. If the air cannot carry any more water vapor, the humidity is 100 percent. At this point, the water vapor condenses into liquid water.Maintaining relative humidity between 40 and 60 percent helps control mold. Maintaining relative humidity levels within recommended ranges is a way of ensuring that a building’s occupants are both comfortable and healthy. High humidity is uncomfortable for many people. It is difficult for the body to cool down in high humidity because sweat cannot evaporate into the air.
DirectionsON/OFF KEYPress the ON/OFF key to turn the power on or off.
°F/°CPress the °F/°C key to select the temperature unit you want to use, Fahrenheit or Celsius.
MAX/MINPress the MAX/MIN key once to display the stored maximum readings for temperature and humidity. An up arrow will appear on the left side of the display to indicate the unit is in the maximum recording mode.Press the MAX/MIN key a second time to display the stored minimum readings for temperature and humidity. A down arrow will appear on the left side of the display to indicate the unit is in the minimum recording mode.Press the MAX/MIN key a third time to return to normal operation.
CLEARIf an up or down arrow is displayed, press the CLEAR key until - - - appears on the display. The memory is cleared. New maximum or minimum values will be recorded within 3 seconds.
MASTER
40 Monitoring and Mentoring Teacher Guide
OFF
Building Buddies
tOverviewThe Building Buddies activities in the Monitoring and Mentoring program include daily monitoring of energy use by students in the classroom, as well as working with buddies in younger grades so that older students can learn through teaching, using the Building Buddies curriculum.
&BackgroundThe Building Buddies program is designed to be an on-going activity that promotes awareness of the ways schools use energy and the behaviors that can conserve energy in the school. The program is designed so that every student can participate in learning about energy, monitoring classroom temperatures and energy usage, and taking positive actions to conserve energy.
The monitoring component of the program—the Monitoring and Mentoring Calendar—incorporates weather conditions, temperature readings in both Fahrenheit and Celsius scales, relative humidity, and light output, as well as self-evaluation of behaviors.
For Single Classroom Use Hang a copy of the Monitoring and Mentoring Calendar in the classroom each week. Assign two students each day to complete the calendar and be responsible for managing energy usage during the day—turning off lights, turning off machines when not in use, checking faucets, etc.
For Use With a Primary ClassConduct the Building Buddies monitoring activities in the classroom and coordinate with a primary teacher to organize mentoring activities.
For a Total School Program Conducting a total school program requires the coordination of activities with all teachers, as well as administration and maintenance personnel. It is suggested that a group of primary and upper level teachers develop a plan to incorporate the activities into a program that will meet the needs of your school. Many of the activities are math intensive. You may find that third or fourth graders will be more comfortable with the primary program, depending on their ability levels.
Concepts �Schools use a lot of energy to provide a safe, comfortable learning environment and to provide broad educational experiences.
�Students can incorporate simple behavioral techniques to save energy at school.
Objectives �Students will be able to list and describe the ways we can save energy at school.
�Students will work with and teach other students to save energy based on their observations.
Time �Five minutes a day to monitor energy use in the classroom, plus time to work with primary buddies
�One 45-minute class period per month to analyze data
Materials �Copies of Monitoring and Mentoring Calendar �Indoor/outdoor thermometer �Building Buddies Teacher and Student Guides �Humidity/temperature pen �Light meter
©2016 The NEED Project 8408 Kao Circle, Manassas, VA 20110 1.800.875.5029 www.NEED.org 41
2Preparation �Make one copy of the Monitoring and Mentoring Calendar on page 42 for the classroom for each week.
�Arrange for your students to work with a younger age classroom, coordinating times, procedures, activities, and copies of primary materials from the Building Buddies curriculum.
Procedure1. Introduce the daily monitoring activity using the Monitoring and Mentoring Calendar.
2. Assign two students to complete the calendar and monitor energy use each day.
3. Introduce the mentoring component of the program, explaining that the students will work with primary buddies to complete the activities in the Building Buddies program.
4. Distribute the materials that have been copied from the Building Buddies guide to familiarize students with the activities they will be completing with their buddies. Review the materials with the students until you are confident they understand the activities and procedures.
5. Have your students work with their primary buddies to complete the activities, as you have coordinated them with the primary teacher. As an extension, have the students use other NEED primary activities to teach primary students about the energy sources and energy trade-offs.
6. Have the students analyze the data from the Monitoring and Mentoring Calendar once a month throughout the year, evaluating the effects of weather, outside temperature, and relative humidity.
Extension �Have students catalog and graph the data from their Monitoring and Mentoring Calendar using spreadsheet software.
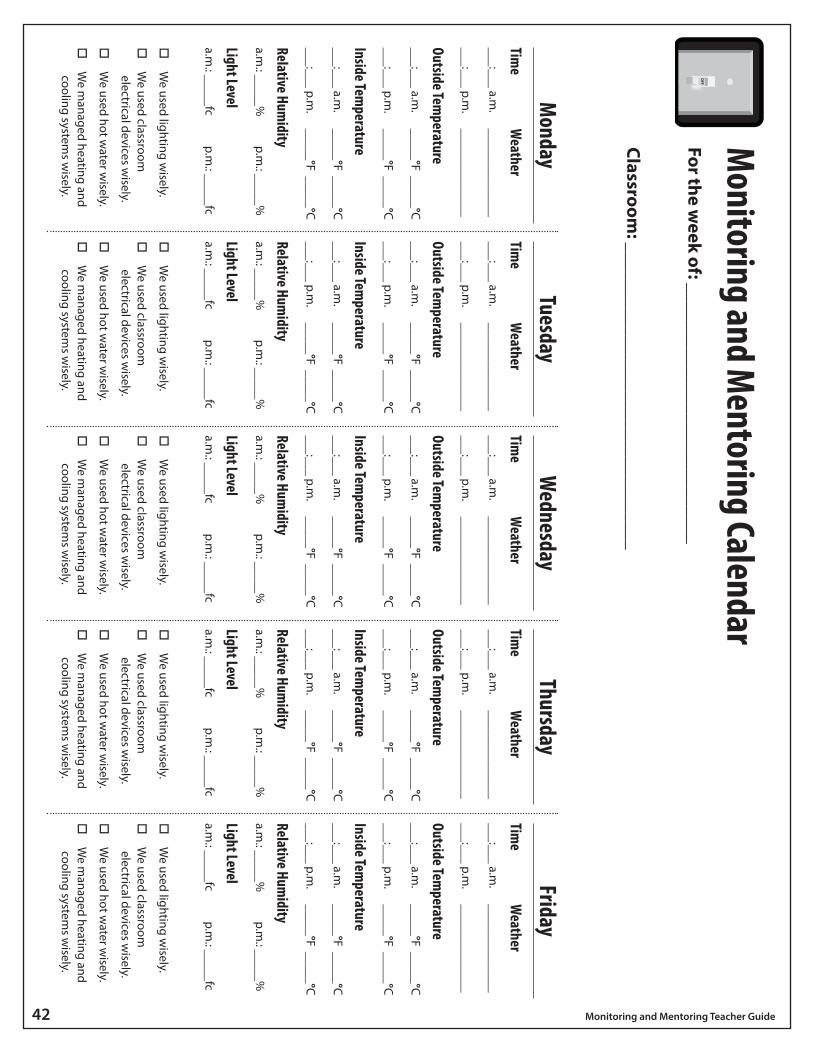
42 Monitoring and Mentoring Teacher Guide
Monday
Time
Weather
___:___ a.m.
______________
___:___ p.m.
______________
Outside Temperature
___:___ a.m.
_____°F _____°C
___:___ p.m.
_____°F _____°C
Inside Temperature
___:___ a.m.
_____°F _____°C
___:___ p.m.
_____°F _____°C
Relative Humidity
a.m.: _____%
p.m
.: _____%
Light Levela.m
.: _____fc p.m
.: _____fc
We used lighting w
isely.
We used classroom
electrical devices wisely.
We used hot w
ater wisely.
We m
anaged heating and cooling system
s wisely.
TuesdayTim
e W
eather___:___ a.m
. ______________
___:___ p.m.
______________
Outside Temperature
___:___ a.m.
_____°F _____°C
___:___ p.m.
_____°F _____°C
Inside Temperature
___:___ a.m.
_____°F _____°C
___:___ p.m.
_____°F _____°C
Relative Humidity
a.m.: _____%
p.m
.: _____%
Light Levela.m
.: _____fc p.m
.: _____fc
We used lighting w
isely.
We used classroom
electrical devices wisely.
We used hot w
ater wisely.
We m
anaged heating and cooling system
s wisely.
Wednesday
Time
Weather
___:___ a.m.
______________
___:___ p.m.
______________
Outside Temperature
___:___ a.m.
_____°F _____°C
___:___ p.m.
_____°F _____°C
Inside Temperature
___:___ a.m.
_____°F _____°C
___:___ p.m.
_____°F _____°C
Relative Humidity
a.m.: _____%
p.m
.: _____%
Light Levela.m
.: _____fc p.m
.: _____fc
We used lighting w
isely.
We used classroom
electrical devices wisely.
We used hot w
ater wisely.
We m
anaged heating and cooling system
s wisely.
ThursdayTim
e W
eather___:___ a.m
. ______________
___:___ p.m.
______________
Outside Temperature
___:___ a.m.
_____°F _____°C
___:___ p.m.
_____°F _____°C
Inside Temperature
___:___ a.m.
_____°F _____°C
___:___ p.m.
_____°F _____°C
Relative Humidity
a.m.: _____%
p.m
.: _____%
Light Levela.m
.: _____fc p.m
.: _____fc
We used lighting w
isely.
We used classroom
electrical devices wisely.
We used hot w
ater wisely.
We m
anaged heating and cooling system
s wisely.
FridayTim
e W
eather___:___ a.m
. ______________
___:___ p.m.
______________
Outside Temperature
___:___ a.m.
_____°F _____°C
___:___ p.m.
_____°F _____°C
Inside Temperature
___:___ a.m.
_____°F _____°C
___:___ p.m.
_____°F _____°C
Relative Humidity
a.m.: _____%
p.m
.: _____%
Light Levela.m
.: _____fc p.m
.: _____fc
We used lighting w
isely.
We used classroom
electrical devices wisely.
We used hot w
ater wisely.
We m
anaged heating and cooling system
s wisely.
OFF
Monitoring and M
entoring CalendarFor the w
eek of: ____________________________
Classroom: _________________________________
©2016 The NEED Project 8408 Kao Circle, Manassas, VA 20110 1.800.875.5029 www.NEED.org 43
44 Monitoring and Mentoring Teacher Guide
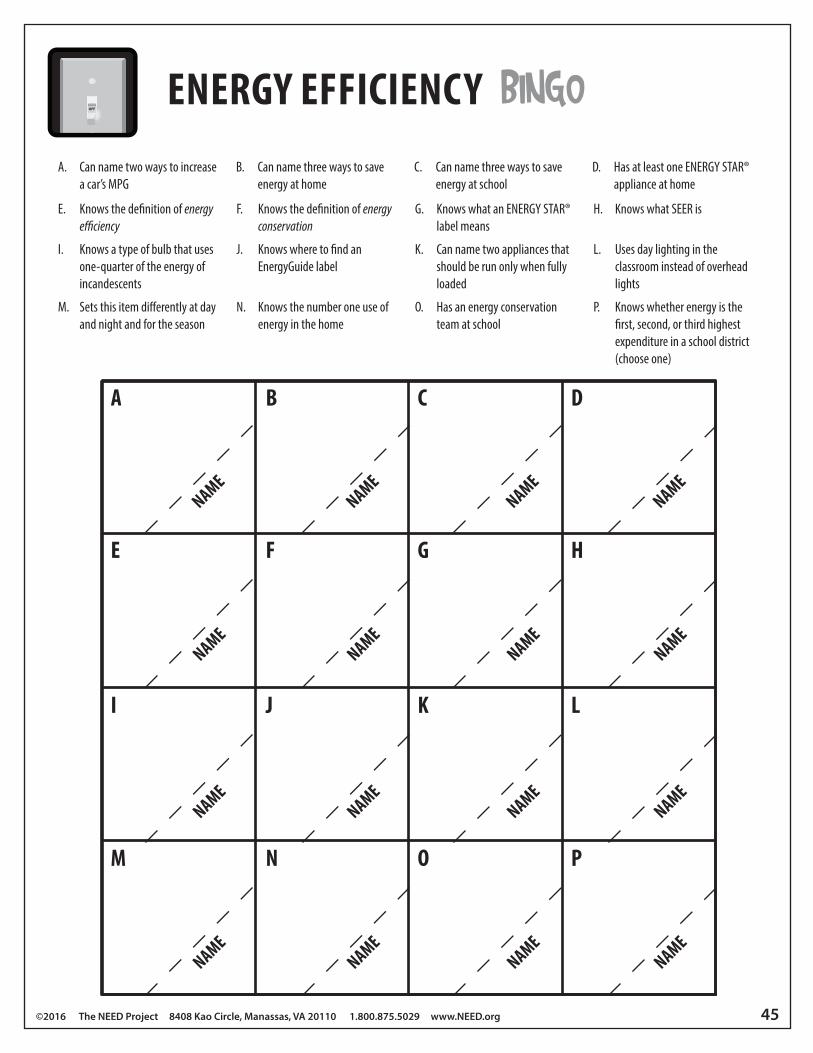
©2016 The NEED Project 8408 Kao Circle, Manassas, VA 20110 1.800.875.5029 www.NEED.org 45
ENERGY EFFICIENCY
NAME
NAME
NAME
NAME
NAME
NAME
NAME
NAME
NAME
NAME
NAME
NAME
NAME
NAME
NAME
NAME
A
E
I
M
B
F
J
N
C
G
K
O
D
H
L
P
BINGOOFF
A. Can name two ways to increase a car’s MPG
B. Can name three ways to save energy at home
C. Can name three ways to save energy at school
D. Has at least one ENERGY STAR® appliance at home
E. Knows the definition of energy efficiency
F. Knows the definition of energy conservation
G. Knows what an ENERGY STAR® label means
H. Knows what SEER is
I. Knows a type of bulb that uses one-quarter of the energy of incandescents
J. Knows where to find an EnergyGuide label
K. Can name two appliances that should be run only when fully loaded
L. Uses day lighting in the classroom instead of overhead lights
M. Sets this item differently at day and night and for the season
N. Knows the number one use of energy in the home
O. Has an energy conservation team at school
P. Knows whether energy is the first, second, or third highest expenditure in a school district (choose one)
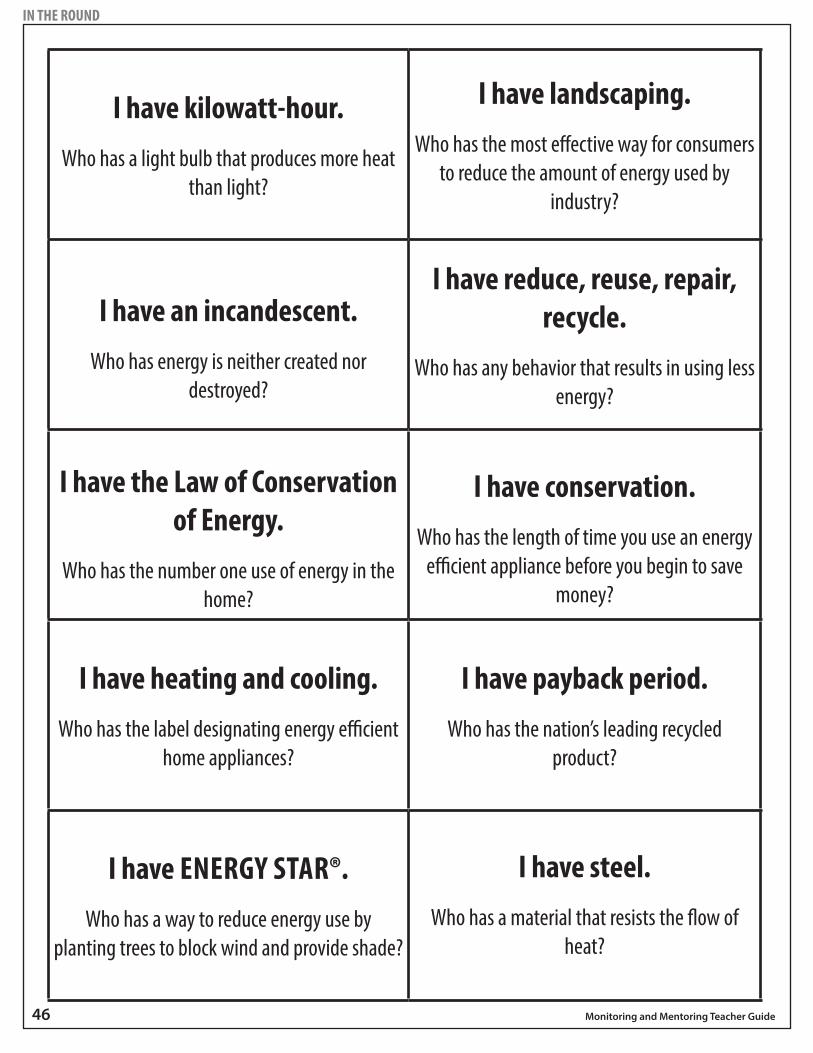
46 Monitoring and Mentoring Teacher Guide
I have kilowatt-hour.Who has a light bulb that produces more heat
than light?
I have landscaping.Who has the most effective way for consumers
to reduce the amount of energy used by industry?
I have an incandescent.Who has energy is neither created nor
destroyed?
I have reduce, reuse, repair, recycle.
Who has any behavior that results in using less energy?
I have the Law of Conservation of Energy.
Who has the number one use of energy in the home?
I have conservation.Who has the length of time you use an energy
efficient appliance before you begin to save money?
I have heating and cooling.Who has the label designating energy efficient
home appliances?
I have payback period.Who has the nation’s leading recycled
product?
I have ENERGY STAR®.Who has a way to reduce energy use by
planting trees to block wind and provide shade?
I have steel.Who has a material that resists the flow of
heat?
IN THE ROUND
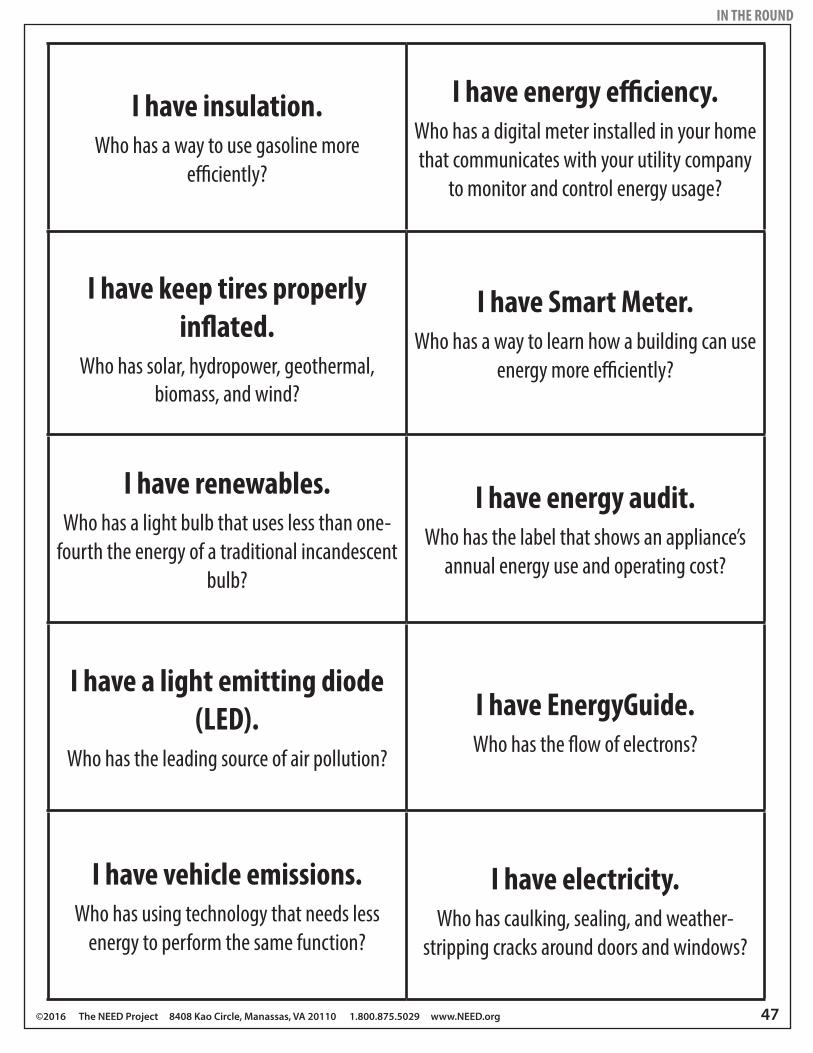
©2016 The NEED Project 8408 Kao Circle, Manassas, VA 20110 1.800.875.5029 www.NEED.org 47
I have insulation.Who has a way to use gasoline more
efficiently?
I have energy efficiency.Who has a digital meter installed in your home that communicates with your utility company
to monitor and control energy usage?
I have keep tires properly inflated.
Who has solar, hydropower, geothermal, biomass, and wind?
I have Smart Meter.Who has a way to learn how a building can use
energy more efficiently?
I have renewables.Who has a light bulb that uses less than one-
fourth the energy of a traditional incandescent bulb?
I have energy audit.Who has the label that shows an appliance’s
annual energy use and operating cost?
I have a light emitting diode (LED).
Who has the leading source of air pollution?
I have EnergyGuide.Who has the flow of electrons?
I have vehicle emissions.Who has using technology that needs less
energy to perform the same function?
I have electricity.Who has caulking, sealing, and weather-
stripping cracks around doors and windows?
IN THE ROUND
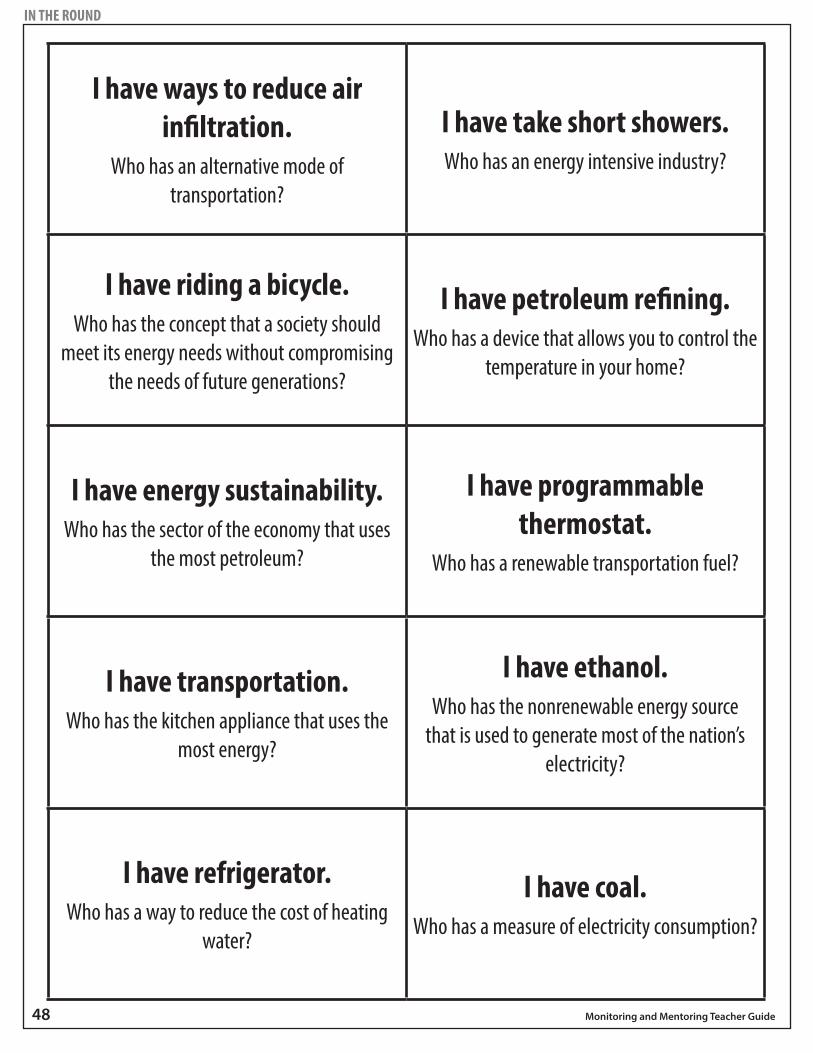
48 Monitoring and Mentoring Teacher Guide
I have ways to reduce air infiltration.
Who has an alternative mode of transportation?
I have take short showers.Who has an energy intensive industry?
I have riding a bicycle.Who has the concept that a society should
meet its energy needs without compromising the needs of future generations?
I have petroleum refining.Who has a device that allows you to control the
temperature in your home?
I have energy sustainability.Who has the sector of the economy that uses
the most petroleum?
I have programmable thermostat.
Who has a renewable transportation fuel?
I have transportation.Who has the kitchen appliance that uses the
most energy?
I have ethanol.Who has the nonrenewable energy source
that is used to generate most of the nation’s electricity?
I have refrigerator.Who has a way to reduce the cost of heating
water?
I have coal.Who has a measure of electricity consumption?
IN THE ROUND
©2016 The NEED Project 8408 Kao Circle, Manassas, VA 20110 1.800.875.5029 www.NEED.org 49
SOCIAL MEDIAStay up-to-date with NEED. “Like” us on Facebook! Search for The NEED Project, and check out all we’ve got going on!
Follow us on Twitter. We share the latest energy news from around the country, @NEED_Project.
Follow us on Instagram and check out the photos taken at NEED events, instagram.com/theneedproject.
Follow us on Pinterest and pin ideas to use in your classroom, Pinterest.com/NeedProject.
NEED’S SMUGMUG GALLERYhttp://need-media.smugmug.com/
On NEED’s SmugMug page, you’ll � nd pictures of NEED students learning and teaching about energy. Would you like to submit images or videos to NEED’s gallery? E-mail [email protected] for more information. Also use SmugMug to � nd these visual resources:
VideosNeed a refresher on how to use Science of Energy with your students? Watch the Science of Energy videos. Also check out our Energy Chants videos! Find videos produced by NEED students teaching their peers and community members about energy.
Online Graphics LibraryWould you like to use NEED’s graphics in your own classroom presentations, or allow students to use them in their presentations? Download graphics for easy use in your classroom.
E-Publications The NEED Project o� ers e-publication versions of various guides for in-classroom use. Guides that are currently available as an e-publication will have a link next to the relevant guide title on NEED’s curriculum resources page, www.NEED.org/curriculum.
NEED’s Online Resources
Supplemental MaterialsLooking for more resources? Our supplemental materials page contains PowerPoints, animations, and other great resources to compliment what you are teaching in your classroom! This page is available under the Educators tab at www.NEED.org.
The BlogWe feature new curriculum, teacher news, upcoming programs, and exciting resources regularly. To read the latest from the NEED network, visit www.NEED.org/blog_home.asp.
Evaluations and AssessmentBuilding an assessment? Searching for standards? Check out our Evaluations page for a question bank, NEED’s Energy Polls, sample rubrics, links to standards alignment, and more at www.NEED.org/evaluation.
NEED Energy BooklistLooking for cross-curricular connections, or extra background reading for your students? NEED’s booklist provides an extensive list of � ction and non� ction titles for all grade levels to support energy units in the science, social studies, or language arts setting. Check it out atwww.NEED.org/booklist.asp.
U.S. Energy GeographyMaps are a great way for students to visualize the energy picture in the United States. This set of maps will support your energy discussion and multi-disciplinary energy activities. Go to www.NEED.org/maps to see energy production, consumption, and reserves all over the country!
50 Monitoring and Mentoring Teacher Guide
Youth Awards Program for Energy Achievement
All NEED schools have outstanding classroom-based programs in which students learn about energy. Does your school have student leaders who extend these activities into their communities? To recognize outstanding achievement and reward student leadership, The NEED Project conducts the National Youth Awards Program for Energy Achievement.
This program combines academic competition with recognition to acknowledge everyone involved in NEED during the year—and to recognize those who achieve excellence in energy education in their schools and communities.
What’s involved? Students and teachers set goals and objectives, and keep a record of their activities. Students create a digital project to submit for judging. In April, digital projects should be uploaded to the online submission site.
Want more info? Check out www.NEED.org/Youth-Awards for more application and program information, previous winners, and photos of past events.
©2016 The NEED Project 8408 Kao Circle, Manassas, VA 20110 1.800.875.5029 www.NEED.org 51
Monitoring and MentoringEvaluation Form
State: ___________ Grade Level: ___________ Number of Students: __________
1. Did you conduct the entire unit? Yes No
2. Were the instructions clear and easy to follow? Yes No
3. Did the activities meet your academic objectives? Yes No
4. Were the activities age appropriate? Yes No
5. Were the allotted times sufficient to conduct the activities? Yes No
6. Were the activities easy to use? Yes No
7. Was the preparation required acceptable for the activities? Yes No
8. Were the students interested and motivated? Yes No
9. Was the energy knowledge content age appropriate? Yes No
10. Would you teach this unit again? Yes No Please explain any ‘no’ statement below.
How would you rate the unit overall? excellent good fair poor
How would your students rate the unit overall? excellent good fair poor
What would make the unit more useful to you?
Other Comments:
Please fax or mail to The NEED Project 8408 Kao Circle Manassas, VA 20110 FAX: 1-800-847-1820
National Sponsors and Partners
Air Equipment Company
Albuquerque Public Schools
American Electric Power
Arizona Public Service
Armstrong Energy Corporation
Barnstable County, Massachusetts
Robert L. Bayless, Producer, LLC
BP America Inc.
Bellefonte Area School District
Blue Grass Energy
Boys and Girls Club of Palm Beach County
Cape Light Compact–Massachusetts
Central Falls School District
Chugach Electric Association, Inc.
Citgo
Columbia Gas of Massachusetts
ComEd
ConEdison Solutions
ConocoPhillips
Constellation
David Petroleum Corporation
Desk and Derrick of Roswell, NM
Direct Energy
Dominion
Dominion Nuclear
Donors Choose
Duke Energy
East Kentucky Power
Elba Liquifaction Company
E.M.G. Oil Properties
Encana Cares Foundation
Energy Future Holdings
Energy Market Authority – Singapore
Escambia County Public School Foundation
Eversource
Exelon Foundation
First Roswell Company
Foundation for Environmental Education
FPL
The Franklin Institute
Government of Thailand–Energy Ministry
Green Power EMC
Guilford County Schools – North Carolina
Gulf Power
Gerald Harrington, Geologist
Harvard Petroleum
Hawaii Energy
Houston Museum of Natural Science
Idaho National Laboratory
Illinois Clean Energy Community Foundation
Independent Petroleum Association of New Mexico
James Madison University
Kentucky Department of Energy Development and Independence
Kentucky Power – An AEP Company
Kentucky Utilities Company
Kinder Morgan
Leidos
Linn County Rural Electric Cooperative
Llano Land and Exploration
Louisville Gas and Electric Company
Massachusetts Division of Energy Resources
Mississippi Development Authority–Energy Division
Mojave Environmental Education Consortium
Mojave Uni�ed School District
Montana Energy Education Council
The Mountain Institute
National Fuel
National Grid
National Hydropower Association
National Ocean Industries Association
National Renewable Energy Laboratory
NextEra Energy Resources
New Mexico Oil Corporation
New Mexico Landman’s Association
Nicor Gas
Nisource Charitable Foundation
Noble Energy
Nolin Rural Electric Cooperative
Northern Rivers Family Services
North Carolina Department of Environmental Quality
North Shore Gas
NRG Energy, Inc.
NRG Battle of the Regions Donors
O�shore Technology Conference
Ohio Energy Project
Opterra Energy
Paci�c Gas and Electric Company
PECO
Pecos Valley Energy Committee
Peoples Gas
Petroleum Equipment and Services Association
Phillips 66
PNM
Providence Public Schools
Read & Stevens, Inc.
Renewable Energy Alaska Project
Rhode Island O�ce of Energy Resources
Robert Armstrong
Roswell Geological Society
Salt River Project
Salt River Rural Electric Cooperative
Saudi Aramco
Schlumberger
C.T. Seaver Trust
Shell
Shell Chemicals
Sigora Solar
Society of Petroleum Engineers
Society of Petroleum Engineers – Middle East, North Africa and South Asia
Solar City
David Sorenson
Tennessee Department of Economic and Community Development–Energy Division
Tesoro Foundation
Tri-State Generation and Transmission
TXU Energy
United Way of Greater Philadelphia and Southern New Jersey
University of North Carolina
University of Tennessee
U.S. Department of Energy
U.S. Department of Energy–O�ce of Energy E�ciency and Renewable Energy
U.S. Department of Energy–Wind for Schools
U.S. Energy Information Administration
Yates Petroleum Corporation
©2016 The NEED Project 8408 Kao Circle, Manassas, VA 20110 1.800.875.5029 www.NEED.org