monitoring fatigue crack growth using nonlinear ultrasonic ... · pdf filetechnique in...
TRANSCRIPT

Cheng, J., Potter, J., Croxford, A., & Drinkwater, B. (2017). Monitoringfatigue crack growth using nonlinear ultrasonic phased array imaging. SmartMaterials and Structures, 26(5), [055006]. DOI: 10.1088/1361-665X/aa6787
Publisher's PDF, also known as Version of record
License (if available):CC BY
Link to published version (if available):10.1088/1361-665X/aa6787
Link to publication record in Explore Bristol ResearchPDF-document
This is the final published version of the article (version of record). It first appeared online via IOP athttp://iopscience.iop.org/article/10.1088/1361-665X/aa6787. Please refer to any applicable terms of use of thepublisher.
University of Bristol - Explore Bristol ResearchGeneral rights
This document is made available in accordance with publisher policies. Please cite only the publishedversion using the reference above. Full terms of use are available:http://www.bristol.ac.uk/pure/about/ebr-terms

This content has been downloaded from IOPscience. Please scroll down to see the full text.
Download details:
IP Address: 137.222.138.50
This content was downloaded on 13/04/2017 at 14:37
Please note that terms and conditions apply.
Monitoring fatigue crack growth using nonlinear ultrasonic phased array imaging
View the table of contents for this issue, or go to the journal homepage for more
2017 Smart Mater. Struct. 26 055006
(http://iopscience.iop.org/0964-1726/26/5/055006)
Home Search Collections Journals About Contact us My IOPscience
You may also be interested in:
Monitoring fatigue crack growth and opening using antenna sensors
I Mohammad and H Huang
A novel closure based approach for fatigue crack length estimation using the acoustic emission
technique in structural health monitoring applications
Daniel Gagar, Peter Foote and Philip Irving
High frequency guided ultrasonic waves for hidden fatigue crack growth monitoring in multi-layer
model aerospace structures
Henry Chan, Bernard Masserey and Paul Fromme
Simultaneous Measurements of Harmonic Waves at Fatigue-Cracked Interfaces
Hyunjo Jeong and Dan Barnard
Development and field application of a nonlinear ultrasonic modulation technique for fatigue crack
detection without reference data from an intact condition
Hyung Jin Lim, Yongtak Kim, Gunhee Koo et al.
Numerical simulation and experimental validation of a large-area capacitive strain sensor for
fatigue crack monitoring
Xiangxiong Kong, Jian Li, Caroline Bennett et al.
Multiplexing passive wireless antenna sensors for multi-site crack detection andmonitoring
X Xu and H Huang
Slip localization and actuation of the crack nucleation mechanism in AA 7075-T651
J D Hochhalter, D J Littlewood, R J Christ Jr et al.
Monitoring fatigue crack growth usingnonlinear ultrasonic phased array imaging
Jingwei Cheng, Jack N Potter, Anthony J Croxford andBruce W Drinkwater
Department of Mechanical Engineering, University of Bristol, Queen’s Building, University Walk, BristolBS8 1TR, United Kingdom
E-mail: [email protected]
Received 30 November 2016, revised 10 March 2017Accepted for publication 17 March 2017Published 10 April 2017
AbstractNonlinear imaging techniques have recently emerged which have the potential to detect materialdegradation and challenging defects, such as closed cracks. This paper describes an investigationinto the performance of nonlinear ultrasonic imaging (NUI) for the monitoring of the early stagesof fatigue crack growth. This technique, in conjunction with conventional array imaging, isapplied to the periodic monitoring of steel compact tension specimens subjected to high cyclefatigue loading. The detection limits of these techniques are investigated. Their abilities tolocalise and detect small cracks are further quantified with the aid of micrography. The resultssuggest that NUI is more sensitive than conventional ultrasonic imaging to the microscalechanges occurring at the early stages of failure, i.e. detectability starts c. 15% of fatigue life. Inaddition to early detection, the potential for NUI to deliver accurate sizing of fatigue cracks andmonitor crack propagation is also presented.
Keywords: monitoring, fatigue crack, ultrasonic phased array, nonlinear imaging
(Some figures may appear in colour only in the online journal)
1. Introduction
Crack growth generated by fatigue loading causes the failureof many aged engineering structures. Early detection istherefore important to plan maintenance and guarantee thesafety of structures. Conventional ultrasonics using variousarrangements of transmitting and receiving transducersrepresents a suite of approaches to crack detection and sizingthat are widely used in industry. However, it is well knownthat these techniques are inaccurate if the crack is small orpartially closed [1–3]. This means that the detection of fatiguein its early stages is not currently possible and necessarilynon-destructive inspection is focussed on monitoring crackstowards the middle and end of a component’s fatigue life. Theconsequence is that inspection intervals must be shortened
and/or designs must have higher margins of safety, reducingstructural efficiency and adding cost.
Nonlinear ultrasonic techniques have shown the potentialto detect cracks at a much earlier stage and have sensitivity topartially-closed defects [4, 5]. Work [6–10] has consideredthe use of harmonic generation and frequency modulation toidentify the nonlinear components of signals reflected fromfatigue cracks. However, despite significant research efforts[11–26] these techniques have yet to become accepted byindustry. This is in part due to the impracticality of thecomplicated bespoke setups required for the localisation ofelastic nonlinearity. Recent advances have however enablednonlinear phased array imaging, allowing nonlinearity to beisolated spatially whilst requiring a similar experimental setupto conventional linear array imaging.
The present paper uses an off-the-shelf phased array tocreate much higher resolution nonlinear images than waspreviously possible. In addition a diffuse field nonlinearmetric is explored and shown to have high sensitivity to thenonlinear signals. More specifically, the paper builds on therecently developed nonlinear ultrasonic imaging (NUI)
Smart Materials and Structures
Smart Mater. Struct. 26 (2017) 055006 (10pp) https://doi.org/10.1088/1361-665X/aa6787
Original content from this work may be used under the termsof the Creative Commons Attribution 3.0 licence. Any
further distribution of this work must maintain attribution to the author(s) andthe title of the work, journal citation and DOI.
0964-1726/17/055006+10$33.00 © 2017 IOP Publishing Ltd Printed in the UK1

technique [27] and explores its potential for early crackdetection and monitoring. The NUI technique uses an array tocreate a spatial map of nonlinearity by focusing on each pixelin the image. The array is used to focus in two modes: par-allel, in which the elements are fired near simultaneously withan applied delay law, resulting in high intensity focus at thepixel location; and sequential in which the elements are firedseparately and the interference effects of focusing achievedsynthetically through a post-processing operation. The tworesulting fields would be identical if linear superposition heldand so any differences can be used as a measure of non-linearity. Importantly, this difference is also insensitive toother sources of nonlinearity such as instrumentation non-linearity and nonlinear contact-acoustic effects at the array-specimen interface as these occur before the ultrasoundinteracts with the sample. The imaging metric used is thedifference in statistical diffuse energy for fields generatedthrough sequential and parallel focusing at each pixel loca-tion. In this context, the diffuse acoustic regime is that whichis created after long times in which the ultrasonic waves arespatially uncorrelated and uniformly distributed in the sample.Previous work described NUI [27] and showed its potentialfor the detection of small defects within aluminium speci-mens. In the present paper we explore its sensitivity to verysmall defects within noisier materials (e.g. mild steel) andquantify the earliest point at which detection is achieved in afatigue test. We also explore the accuracy of crack sizingachievable. The NUI technique is implemented alongside aconventional linear imaging technique, termed total focusingmethod (TFM) [28] for comparison purposes. Indeed, weshow that the same array used with a standard commerciallyavailable array controller can be used to produce co-locatedlinear and nonlinear images. In this way, the nonlinear imagecan be seen as providing complementary information, whichcan be used in conjunction with the conventional linearinformation.
2. Linear (TFM) and nonlinear (NUI) imaging
In a typical commercially available array controller twoalternative modes of operations are possible. In parallel mode,independently controlled circuits allow the firing of trans-mitter elements in a pre-set sequence termed a delay law.Similarly these, or other, delays can be applied to the receivedsignals on reception to form an image. The use of this modeof parallel firing and delays on transmission results in a highintensity beam forming in the specimen that can be con-trollably translated, steered or focused. Alternatively,sequential transmission and capture can be used and the time-domain signals from all the individual combinations oftransmitter–receiver pairs captured one after the other. This socalled full matrix capture (FMC) [28] data can then be post-processed to form an image. The key difference here is that,as the signals from individual elements are transmittedseparately, in this sequential mode the high amplitude focus is
not physically generated in the sample. If the test structure istime invariant and the principle of linear superposition holds,these two modes of operation yield identical images.
The NUI technique capitalises on the physical differencein amplitude of the waves at the focal point if the parallel andsequential modes are compared. It is apparent that the pres-sure amplitude, A, at the focus, is of the order of N timeshigher in the parallel case, where N is the number of elementsin the array. Considering the case of classical third orderstrain energy, since the amplitude of any second harmonicwave generated is proportional to A2 and the energy of thewave is proportional to A2, the amount of energy in the sec-ond harmonic wave, is proportional to A4. Furthermore, sincethe energy is conserved, the amount of energy lost from thefundamental will be N3 times higher in the parallel case. Notethat in practice higher harmonics could exist and these wouldresult in further energy loss from the fundamental. In the NUItechnique the energy in the fundamental is measured as theintegral of A2 over some time window which is set to bewithin the diffuse field, i.e. at a time after which the energy isuniformly distributed within the sample.
The requirement to measure the energy of the diffusefield means that the selection of reception start time tr (thetime instant when each element starts to receive signals) andwindow length T (the time length corresponding to durationof the time domain signal each receiver acquires) is parti-cularly important. There are two competing effects. First,the acoustic field only slowly tends to the diffuse fieldcondition with time. Second, as wave propagation is dis-sipative, the signal-to-noise ratio will decrease with time.Ultimately, compromise values of tr and T must be foundsuch that a diffuse field condition is achieved and theamplitude is acceptable, i.e. the signal-to-noise ratio issufficient.
Assuming fn,m(t) are the time-domain received signals foreach combination of transmit (n) and receive (m) elements inthe sequential case. δn(r) is the transmission delay applied tothe nth element to achieve a focus at a point r. Also, hm(r, t) isthe time-domain signal received on element m for the paralleltransmission of all elements delayed independently by δn(r).The frequency (ω) domain versions of fn,m(t) and hm(r, t)
are given by F f t te dn m t
t Tn m
t, ,
i
r
r
òw = w+ -( ) ( ) and Hm w =( )
h t te d ,t
t Tm
ti
r
r
ò w+ -( ) respectively.
The energy content of the fundamental is then foundfrom integration of the amplitude squared across the fre-quency domain from 2
3 0w to .4
3 0w These integration limits arechosen to exclude nonlinear energy flux within the evaluatedbandwidth. Consequently, the diffuse acoustic energy in thesequential focusing case Es at focal point, r, for an N elementarray is given as:
rE F e d . 1r
m
N
n
N
n ms1
23
43 2
1,
i2
n
0
0
òå åw w w=w
wwd
= =
⎛⎝⎜⎜
⎞⎠⎟⎟( ) ( ) ( )( )
2
Smart Mater. Struct. 26 (2017) 055006 J Cheng et al
Likewise, the parallel transmission energy Ep is calculated asfollows:
r rE H , d . 2m
N
mp1
23
43 2 2
0
0
òå w w w=w
w
=
⎛⎝⎜⎜
⎞⎠⎟⎟( ) ∣ ( )∣ ( )
Finally an image is formed by calculation of the nonlinearmetric γ at a given imaging/focal point r [27]
rr r
r
E E
E. 3
s p
sg =
-( )
( ) ( )( )
( )
The nonlinear metric γ at every focal point r is used toproduce a full nonlinear image in the x–z plane (seefigure 1(a) for axis definition). Alongside this a conventionalTFM image of the same size is produced in order to visualisethe linear features of the specimen, which the nonlinearimaging technique cannot display. The TFM image, I(x, z), isgiven by:
I x z
gx x z x x z
c
,
,
4n m
n m,
2 2 2 2
å=- + + - +⎛
⎝⎜⎜
⎞⎠⎟⎟
( )
( ) ( )
( )
where gn,m is the Hilbert transform of, fn,m, the position offocal point r is defined in terms of x and z coordinates, c is thespeed of sound and the summation is performed over alltransmitters and receivers.
3. Experimental procedure
Mild steel ASTM A36 (c= 5924 m s−1) compact tension(CT) specimens were manufactured according to the ASTMstandard E647-05. The load limits were then selected toensure that the specimen failed in the high cycle fatigueregime. The maximum stress intensity factor Kmax was
chosen as:
KK
3, 5IC
max = ( )
where KIC=65MNm−3/2 is the nominal fracture tough-ness of this material. The minimum stress intensity factorKmin, using a stress ratio value of R=0.13 (where the stressratio R is the ratio of the minimum and maximum load, Pmin
and Pmax, per cycle), is calculated below:
K RKP
PK . 6min max
min
maxmax= = ( )
Complying with ASTM standard E647-05, the geometryfactor of the CT specimen is known, and hence the stressintensity factor range ΔK can be expressed as:
KP
B W
2
10.886 4.64 13.32
14.72 5.6 , 7
32
2
3 4
a
aa a
a a
D =D +
-+ -
+ -
( )
( )(
) ( )
where P P P ,max minD = - B is the thickness of the specimen(25 mm) and α(= a/W) is the ratio of the distance from theload bearing point to the crack tip (a=22 mm), and thewidth of CT specimen (W=50 mm).
Consequently, the load was varied between 2 and 15 kN(Pmin and Pmax) in a hydraulic testing machine (Instron8800MJ6272, UK) at a frequency of 3 Hz. Furthermore, oncethe test was stopped after a prescribed number of cycles,metallographic preparation was completed around the cracktip by fine grinding using silicon carbide paper as well asfurther fine polishing using polishing cloth with a 3 μmmonocrystalline diamond suspension. After polishing to amirror finish, the microstructure around the tip was observedby a microscope (Zeiss Axio Imager 2, Germany) and hencethe crack length was monitored periodically during the fati-gue test.
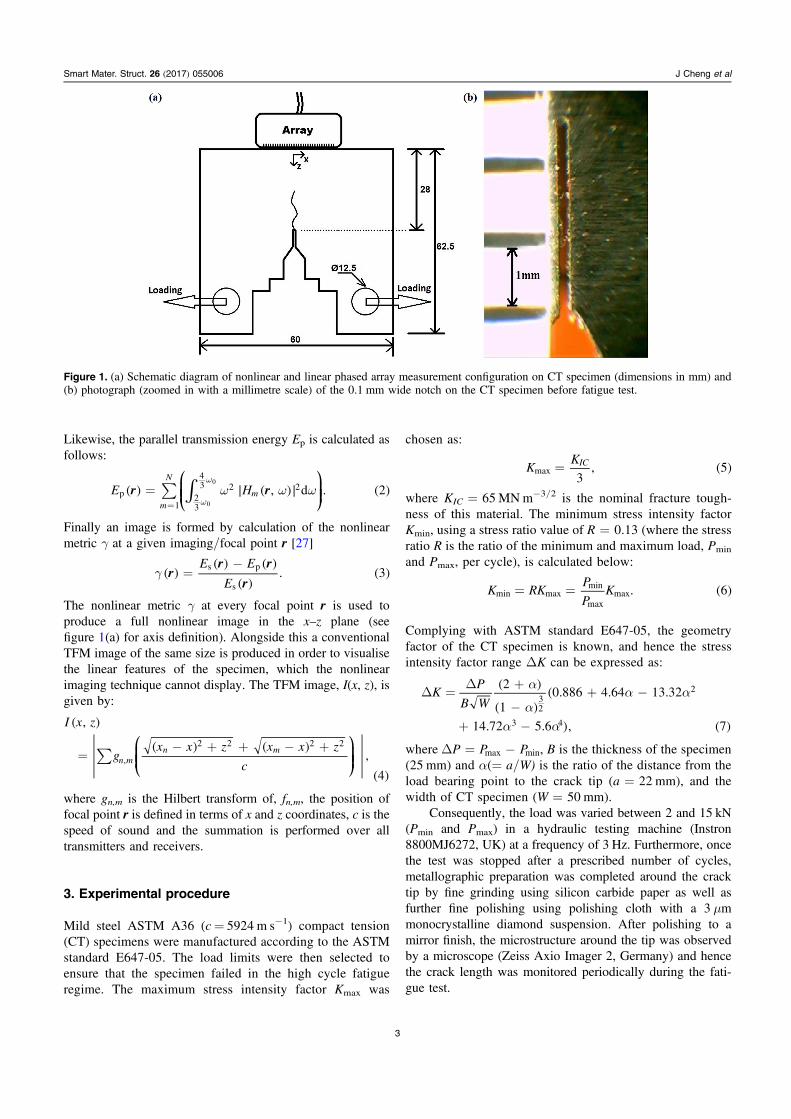
Figure 1. (a) Schematic diagram of nonlinear and linear phased array measurement configuration on CT specimen (dimensions in mm) and(b) photograph (zoomed in with a millimetre scale) of the 0.1 mm wide notch on the CT specimen before fatigue test.
3
Smart Mater. Struct. 26 (2017) 055006 J Cheng et al

The ultrasonic inspections using NUI and TFM imagingwere made by positioning an array on the top face above theend of notch as shown in figure 1(a). All the inspections wereimplemented with a 64 element ultrasonic array (Imasonic,France) with nominal centre frequency of 5MHz, (−6 dBbandwidth 86% of the centre frequency), and pitch of0.63 mm, as well as an array controller (Peak NDT Micro-pulse FMC, UK). It should be noted that the reception starttime, tr, depends on the geometry of specimen, random noiseand material properties, since the time to reach the diffusefield varies with these. By observing the performance of NUIon the known nonlinear and linear features of this CT spe-cimen during experiments, appropriate parameters for theNUI imaging were chosen as window length, T of 0.12 mswith the reception start time, tr, at 0.1 ms, providing a com-promise between diffusivity and signal to noise ratio. Theinitial notch was generated by electrical discharge machiningto create a stress concentration and is shown in figure 1(b). Inaddition, the TFM imaging technique was performed on theside of specimen parallel to the crack face. This provides thebest case scenario for linear inspection, however we note thatthis arrangement is often not practically realisable due toaccess limitations.
4. Experimental results
4.1. Life monitoring
A mild steel CT specimen was subjected to cyclic loading inorder to ascertain the performance of NUI and TFM imagingwith crack growth. The fatigue test continued until the spe-cimen failed, as indicated by an opening angle, 5°, in order toestimate the life span based on the specified high cycle fatigueloading. This allows linear and nonlinear metrics to be relatedto the fatigue life in addition to crack size.
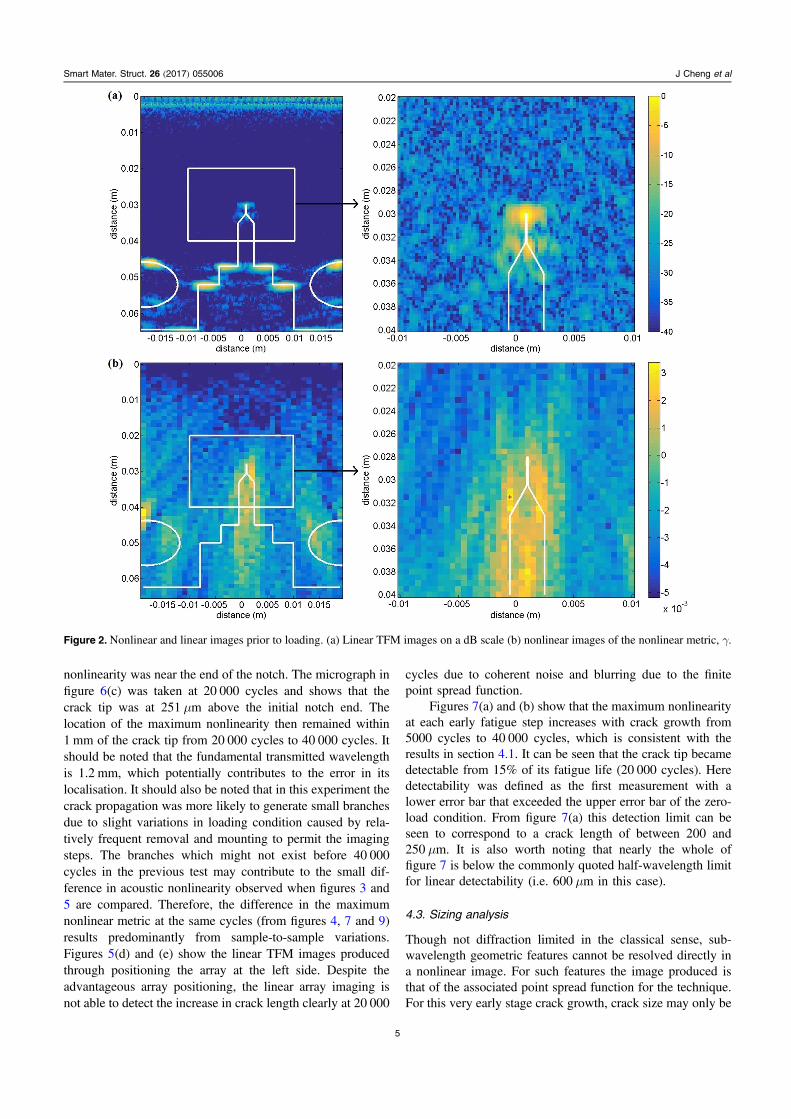
Before the start of fatigue test, the specimen wasinspected using linear TFM and the NUI technique, shown infigures 2(a) and (b) to understand the background noise leveland the characteristics of the baseline geometric features.
The grain structure of mild steel contributes to energyabsorption, increasing the effect of incoherent noise on dif-fuse field measurements as well as generating coherent noisein linear images in comparison to finer grained materials suchas aluminium. Therefore, the background levels presented infigures 2(a) and (b), will inevitably mask some nonlinear andlinear features and set detection thresholds. It is likely thattime-variant perturbations to the system, for example throughenvironmental changes, between parallel and sequentialacquisitions also contribute to the nonlinear backgroundlevels. Additionally, incoherent noise has a proportionallylarger contribution to the, lower amplitude, sequential mea-surements. This leads to imperfect subtraction of parallel/sequential fields, reducing the ability to suppress linear fea-tures (e.g. planar surfaces and large holes), as is evident bythe presence of background response coinciding with linearfeatures. As would be expected, the linear TFM image infigure 2(a) shows the linear scattering from the geometric
features of the specimen and the amplitude in figure 2(b)gives an indication of how well these features are supressed.
The fatigue experiments were stopped at the completionof 20 000, 30 000, 50 000, 70 000, 90 000 and 130 000 cyclesin order to perform the imaging, with eventual failureoccurring at 135 500 cycles. Figures 3(a)–(c), cover the per-iod up to 50 000 cycles, which is thought to correspond tocrack nucleation and initial growth. In this initial fatigueregion the amplitude of the nonlinear metric can be seen toincrease relative to the maximum background level with themaximum nonlinearity occurring in the vicinity of theinitiation notch. Figures 3(d)–(f) show the position of max-imum nonlinearity (indicated by the red cross) moving aheadof the initiation notch, suggesting more extensive cracking. Inall cases, it is likely that the nonlinear response observed (upto four times the maximum background level) is pre-dominantly a consequence of contact-acoustic effects [15].Figure 3(f) shows that at 130 000 cycles the position ofmaximum nonlinearity has reached 2 mm from the starternotch tip and its amplitude has decreased somewhat relativeto earlier points in the fatigue life. This late-life amplitudeeffect is likely a consequence of the crack beginning to openas the sample nears failure, resulting in fewer contact pointsand reduced instances of nonlinear contact acoustic effects.The sample failed shortly after commencing cycling beyond130 000 cycles.
A linear TFM image was performed with the arraylocated on the top of the sample and this revealed no sig-nificant changes in linear scattering above the end of theinitiation notch throughout the crack growth. This demon-strates a clear example of the NUI technique having increasedsensitivity over a high performance traditional linear techni-que (i.e. TFM).
As shown in figure 4, the relationship between change inthe maximum acoustic nonlinearity and fatigue life demon-strates that the acoustic nonlinearity generally increases untilit reaches around 70% of fatigue life. Error bars denote asingle standard deviation of peak nonlinear amplitude. Thisstandard deviation is calculated for multiple image acquisi-tions (between 3 and 5) at each sample point, then averagedover all points. The error bars provide a measure of repeat-ability for a specimen in a given state, but not between dif-ferent specimens.
4.2. Early detection investigation
The previous study evaluated the efficacy of imagingthroughout the whole fatigue life. A further test was con-ducted in order to more closely study early stages of crackgrowth and explore the limits of detectability. The loadingstep was reduced to 5000 cycles in order to ensure the earlystage damage is monitored and detection performance couldbe investigated.
The results in figures 5(a)–(c) demonstrate nonlinearfeatures consistent with those seen in section 4.1. Initially thecrack, which was barely visible in figure 6(a), could not bedetected with NUI or the TFM technique. The earliestdetection was at 20 000 cycles where the maximum
4
Smart Mater. Struct. 26 (2017) 055006 J Cheng et al
nonlinearity was near the end of the notch. The micrograph infigure 6(c) was taken at 20 000 cycles and shows that thecrack tip was at 251 μm above the initial notch end. Thelocation of the maximum nonlinearity then remained within1 mm of the crack tip from 20 000 cycles to 40 000 cycles. Itshould be noted that the fundamental transmitted wavelengthis 1.2 mm, which potentially contributes to the error in itslocalisation. It should also be noted that in this experiment thecrack propagation was more likely to generate small branchesdue to slight variations in loading condition caused by rela-tively frequent removal and mounting to permit the imagingsteps. The branches which might not exist before 40 000cycles in the previous test may contribute to the small dif-ference in acoustic nonlinearity observed when figures 3 and5 are compared. Therefore, the difference in the maximumnonlinear metric at the same cycles (from figures 4, 7 and 9)results predominantly from sample-to-sample variations.Figures 5(d) and (e) show the linear TFM images producedthrough positioning the array at the left side. Despite theadvantageous array positioning, the linear array imaging isnot able to detect the increase in crack length clearly at 20 000
cycles due to coherent noise and blurring due to the finitepoint spread function.
Figures 7(a) and (b) show that the maximum nonlinearityat each early fatigue step increases with crack growth from5000 cycles to 40 000 cycles, which is consistent with theresults in section 4.1. It can be seen that the crack tip becamedetectable from 15% of its fatigue life (20 000 cycles). Heredetectability was defined as the first measurement with alower error bar that exceeded the upper error bar of the zero-load condition. From figure 7(a) this detection limit can beseen to correspond to a crack length of between 200 and250 μm. It is also worth noting that nearly the whole offigure 7 is below the commonly quoted half-wavelength limitfor linear detectability (i.e. 600 μm in this case).
4.3. Sizing analysis
Though not diffraction limited in the classical sense, sub-wavelength geometric features cannot be resolved directly ina nonlinear image. For such features the image produced isthat of the associated point spread function for the technique.For this very early stage crack growth, crack size may only be
Figure 2. Nonlinear and linear images prior to loading. (a) Linear TFM images on a dB scale (b) nonlinear images of the nonlinear metric, γ.
5
Smart Mater. Struct. 26 (2017) 055006 J Cheng et al

inferred from the amplitude of nonlinear response, asdemonstrated in the previous section. As crack lengthincreases beyond the order of half a wavelength, the region ofnonlinear contrast within the image increases in size, allowingfor direct sizing of defects from nonlinear images.
This section investigates the sizing of small cracks whichcorresponded here to loading from between 40 000 and100 000 cycles. Figures 8(a)–(d) show the nonlinear imagesin this loading range at increments of 20 000 cycles.Noticeably, the maximum magnitude of the nonlinear metricincreases almost linearly with crack growth from 40 000cycles to 100 000 cycles (as shown in figures 9(a) and (b)).
The position of peak nonlinear amplitude and the actualcrack tip location as measured from micrographs are indicatedin figure 8 as red and black crosses respectively. The locationof highest nonlinearity is consistently at approximately 1 mmbelow the actual crack tip. This is not necessarily indicative ofthe location of maximum nonlinear response. When focusingat the crack tip, less of the crack lies under the footprint of thefocal region, reducing the measured nonlinear response.Aside from this offset, the location of peak nonlinearity isseen to correspond very closely with the actual crack tiplocation measured from surface micrographs, as is shown infigure 9(c).
5. Conclusions
The experimental results presented show that monitoringfatigue crack growth in mild steel using the NUI techniquewas effective from 15% fatigue life. The NUI technique wasperformed using a commercially available array and arraycontroller. The same instrumentation was also used tosimultaneously produce traditional high resolution linearTFM images. These linear images did not reveal any detect-able changes in these early stages of fatigue. The amplitude ofnonlinearity was shown to be a measure of progress of thevery early stages of fatigue crack growth. The experimentsshowed that statistically significant amplitude increases weremeasureable for cracks of 250 μm length and greater. Ascrack growth continued the location of maximum nonlinearitywas used to measure the extent of the cracking. For theselarger cracks the NUI technique becomes a form of nonlinear
Figure 3. Nonlinear images in nonlinear metric γ at (a) 20 000, (b) 30 000, (c) 50 000, (d) 70 000, (e) 90 000, and (f) 130 000 cycles. Notethat the red cross represents position of the maximum γ.
Figure 4. Maximum nonlinear metric, γ, as a function of % fatiguelife (error bar represents an averaged standard deviation).
6
Smart Mater. Struct. 26 (2017) 055006 J Cheng et al

Figure 5. Nonlinear images in nonlinear metric γ at (a) 5000, (b) 20 000 and (c) 40 000 cycles. Note that the red cross represents position ofthe highest γ. Linear images with array located on the left hand side of the sample at (d) 0 and (e) 20 000 cycles.
Figure 6. Micrographs of the fatigue crack at (a) 5000, (b) 15 000, and (c) 20 000 cycles. Note that the scale is different in each image.
7
Smart Mater. Struct. 26 (2017) 055006 J Cheng et al

Figure 7. Maximum nonlinear metric γ during fatigue as a function of (a) crack length and (b) number of fatigue cycles (error bars representan averaged standard deviation).
Figure 8. Nonlinear images in nonlinear metric γ at (a) 40 000, (b) 60 000, (c) 80 000, and (d) 100 000 cycles. Note that the red cross andblack cross represent positions of the highest γ and the micrographically measured crack tip respectively.
8
Smart Mater. Struct. 26 (2017) 055006 J Cheng et al

imaging, mapping out the extent of a given crack. As thesame instrumentation is used, linear and nonlinear images canbe produced simultaneously, and these contain com-plementary information. The linear images will revealessentially geometric information from sample boundariesand large defects, whereas the NUI images will reveal non-linear features such as partially-closed cracks and crack tips.The NUI results were obtained with the array positioneddirectly above the crack, an orientation that typically results inpoor linear imaging as the signals reflected directly from thecrack tip are small. We note however that the orientation usedin NUI is beneficial as it reduces access limits relative totraditional linear array imaging (which would typically beperformed as an angle inspection). The NUI techniquetherefore both improves sensitivity and reduces access lim-itations making it a viable prospect for in situ or permanentfatigue monitoring of, for example, pipework or pressurevessel welds.
Acknowledgments
This work was supported through the core research programwithin the UK Research Centre in NDE (RCNDE) funded bythe Engineering and Physical Sciences Research Council(EPSRC; grant number EP/L022125/1). Data necessary tosupport the conclusions are included in the paper.
References
[1] Tsuda H, Lee J and Guan Y 2006 Fatigue crack propagationmonitoring of stainless steel using fiber Bragg gratingultrasound sensors Smart Mater. Struct. 15 1429–37
[2] Thomas R, Drinkwater B W and Liaptsis D 2005 The refectionof ultrasound from partially contacting rough surfacesJ. Acoust. Soc. Am. 117 638–45
[3] Papazian J M et al 2007 Sensors for monitoring early stagefatigue cracking Int. J. Fatigue 29 1668–80
[4] Nagy P B 1998 Fatigue damage assessment by nonlinearultrasonic materials characterization Ultrasonics 36 375–81
[5] Brotherhood C J, Drinkwater B W and Dixon S 2003 Thedetectability of kissing bonds in adhesive joints usingultrasonic techniques Ultrasonics 41 521–9
[6] Su Z, Zhou C, Hong M, Cheng L, Wang Q and Qing X 2014Acousto-ultrasonics-based fatigue damage characterization:linear versus nonlinear signal features Mech. Syst. SignalProcess. 45 225–39
[7] Lim H J, Song B, Park B and Sohn H 2015 Noncontact fatiguecrack visualization using nonlinear ultrasonic modulationNDT&E Int. 73 8–14
[8] Fierro G P M and Meo M 2015 Residual fatigue life estimationusing a nonlinear ultrasound modulation method SmartMater. Struct. 24 025040
[9] Lim H J and Sohn H 2015 Fatigue crack detection usingstructural nonlinearity reflected on linear ultrasonic featuresJ. Appl. Phys. 118 244902
[10] Amura M, Meo M and Amerini F 2011 Baseline-freeestimation of residual fatigue life using a third order acousticnonlinear parameter J. Acoust. Soc. Am. 130 1829–37
[11] Jhang K-Y 2009 Nonlinear ultrasonic techniques for non-destructive assessment of micro damage in material: areview Int. J. Precis. Eng. Manuf. 10 123–35
[12] Matlack K H, Kim J-Y, Jacobs L J and Qu J 2015 Review ofsecond harmonic generation measurement techniques formaterial state determination in metals J. Nondestruct. Eval.34 273
[13] Kim J-Y, Jacobs L J, Qu J and Littles J W 2006 Experimentalcharacterization of fatigue damage in a nickel-basesuperalloy using nonlinear ultrasonic waves J. Acoust. Soc.Am. 120 1266–73
[14] Solodov I Y and Korshak B A 2001 Instability, chaos, and‘memory’ in acoustic-wave-crack interaction Phys. Rev.Lett. 88 014303
[15] Cantrell J H and Yost W T 2001 Nonlinear ultrasoniccharacterization of fatigue microstructures Int. J. Fatigue 23487–90
[16] Averkiou M A, Roundhill D N and Powers J E 1997 A newimaging technique based on the nonlinear properties oftissues Proc. IEEE Ultrasonics Symp. pp 1561–6
[17] Cai A, Sun J and Wade G 1992 Imaging the acoustic nonlinearparameter with diffraction tomography IEEE Trans.Ultrason. Ferroelectr. Freq. Control 39 708–15
[18] Gong X, Zhang D, Liu J, Wang H, Yan Y and Xu X 2004Study of acoustic nonlinearity parameter imaging methodsin reflection mode for biological tissues J. Acoust. Soc. Am.116 1819–25
[19] Ulrich T J, Johnson P A and Guyer R A 2007 Interactiondynamics of elastic waves with a complex nonlinearscatterer through the use of a time reversal mirror Phys. Rev.Lett. 98 104301
Figure 9.Maximum nonlinear metric γ during fatigue as a function of (a) actual crack length and (b) number of fatigue cycles. (c) Measuredcrack length from the NUI image (notch end to position of maximum nonlinear metric γ) during fatigue as a function of micrographicallymeasured crack length (error bar represents an averaged standard deviation).
9
Smart Mater. Struct. 26 (2017) 055006 J Cheng et al

[20] Solodov I, Wackerl J, Pfleiderer K and Busse G 2004Nonlinear self-modulation and subharmonic acousticspectroscopy for damage detection and location Appl. Phys.Lett. 84 5386–8
[21] Ohara Y, Mihara T, Sasaki R, Ogata T, Yamamoto S,Kishimoto Y and Yamanaka K 2007 Imaging of closedcracks using nonlinear response of elastic waves atsubharmonic frequency Appl. Phys. Lett. 90 011902
[22] Croxford A J, Wilcox P D, Drinkwater B W and Nagy P B2009 The use of non-collinear mixing for nonlinearultrasonic detection of plasticity and fatigue J. Acoust. Soc.Am. 126 117–22
[23] Ohara Y, Horinouchi S, Hashimoto M, Shintaku Y andYamanaka K 2010 Nonlinear ultrasonic imaging method forclosed cracks using subtraction of responses at differentexternal loads Ultrasonics 51 661–6
[24] Yan Z and Nagy P B 2000 Thermo-optical modulation forimproved ultrasonic fatigue crack detection in Ti-6Al-4VNDT&E Int. 33 213–23
[25] Jiao J P, Drinkwater B W, Neild S A and Wilcox P D 2009Low-frequency vibration modulation of guided waves toimage nonlinear scatterers for structural health monitoringSmart Mater. Struct. 18 065006
[26] Mi B, Michaels J E and Michaels T E 2005 An ultrasonicmethod for dynamic monitoring of fatigue crack initiationand growth J. Acoust. Soc. Am. 119 74–85
[27] Potter J N, Croxford A J and Wilcox P D 2014 Nonlinearultrasonic phased array imaging Phys. Rev. Lett. 113144301
[28] Holmes C, Drinkwater BW andWilcox P D 2005 Post-processingof the full matrix of ultrasonic transmit-receive array data fornon-destructive evaluation NDT&E Int. 38 701–11
10
Smart Mater. Struct. 26 (2017) 055006 J Cheng et al