monitoring for healthy rivers
TRANSCRIPT
1
MRWC
Millers River Watershed Council, Inc.
100 Main Street, Athol, MA 01331 978-248-9491
MRWC Bacteria Monitoring Program
2013 Report: Millers & Otter Rivers
Monitoring for healthy rivers.
Prepared by: Keith Davies
1/12/14
QC Review by Ivan Ussach, MRWC Coordinator

2
Table of Contents
Page:
1. Executive Summary 3
2. Introduction 4
3. Project Approach 6
Purpose 6 Objectives 7 Methods 8 Monitoring sites 10
4. Results 12
Bacteria 12 Weather 13 Field sheets 14 QC/objectives 15
5. Conclusions/Discussion 17
2013 discussion/conclusions 18 2014 efforts 19
Appendices Appendix 1 – 2011 & 2012 results 20
Maps Watershed Overview – Sample sites 5 Tables Sampling Sites 10 Bacteria Data 12 Weather Data 13
Field Sheet Summary 14 River Temperatures 15 QC Samples 16
A digital version of this report can be found at www.millerswatershed.org

3
Executive Summary In 2013 the Millers River Watershed Council (MRWC) successfully conducted its
third bacteria monitoring season. A group of dedicated volunteers and two staff
executed this program by monitoring a total of ten sites on the Millers and Otter rivers.
Seven distinct sampling events were completed during the major recreational contact
season.
This program has been building a baseline to address a lack of water quality data
on bacteria concentrations in the rivers and streams of the Millers Basin. Water-based
recreational activities (and physical contact or exposure levels) are determined to be
appropriate based on the concentration of bacteria in the river or water body. The
Massachusetts Department of Environmental Protection (MassDEP) has developed
guidelines for making such determinations.
By conducting a continuing annual program of volunteer monitoring, MRWC
aims to provide watershed residents and visitors with practical information concerning
the safety of using and enjoying local rivers. Results were posted regularly on
www.connecticutriver.us through a partnership with CRWC and PVPC. The data
collected was determined to be of reliable quality and consistent with all state standards
for water quality monitoring.
Third-year results indicate a generally healthy river system for a variety of types
of recreation: the one concern is with limiting primary contact after a heavy rainstorm; a
typical finding in many watersheds. Often in areas located downstream of urban centers,
which collect greater amounts of stormwater runoff, it is not unusual for bacterial
concentrations to run high.
The continued success of this monitoring program illustrates the value and
importance of volunteer activities to protecting public health. As MRWC continues its
efforts to promote public recreation and enjoyment of local rivers through a series of
“Blue Trails,” this volunteer monitoring program should increase in importance and
engage more residents to be “the eyes and ears” of the watershed. Such stewardship
efforts are vital to maintaining the health and resiliency of our watershed and the many
communities that call it home.

4
Introduction
As part of promoting a series of recreational “Blue Trails” within the watershed,
MRWC determined that it would be beneficial to maintain a “complementary” bacteria
monitoring program. This program serves several purposes: first, to gauge general water
quality and river health; and second, to inform the public on the safety of recreational
activities on/in the river. For people to enjoy our rivers with piece of mind, it is
particularly important to determine if Blue Trail and other segments meet the MassDEP
water quality contact standards.
MRWC’s program uses a QAPP (Quality Assurance Project Plan) from which to
conduct consistent operation of this effort. A QAPP is a formal monitoring plan with
ample quality control that is approved by MassDEP. The data from such a program, if
followed carefully, is accepted and trusted by the state, and thus provides reliable
information which can be used to foster river protection and inform the public. In the
spring of 2011, MassDEP approved MRWC’s biomonitoring QAPP.
MRWC relies on fundraising to help support program costs, mainly laboratory
analyses of samples and some monitoring equipment. MRWC is grateful for support
from the Greater Worcester Community Foundation, the Connecticut River Watershed
Council (CRWC) and the individuals/businesses who contributed to Adopt-A-Sample."
MRWC used the CRWC lab in Greenfield for sample analysis. Sampling kits were
organized for each sample site.
Another key step was to find volunteer samplers. Outreach brought nine people
forward to help. All received training in proper sampling techniques, and bi-weekly
sampling began on June 12, 2013 and ran through September 4th. In all we conducted
seven sampling events at ten (10) sampling sites on the Millers and Otter Rivers.
Volunteers also noted temperature and other site conditions observed during each
sampling event. Weather conditions within 48 hours of sampling events were recorded.
The 2013 sampling year was a strong success. Funding limited MRWC to 10 sites,
5 fewer than 2012, but we continued with 7 sampling events. Volunteer samplers did
well and there were few complications. Reporting on line also worked well. This
experience illustrates MRWC commitment to monitoring and will guide any
enhancements to MRWC’s monitoring program as we look continually to optimize the

5
choice of monitoring sites, and encourage more people to explore the Watershed and its
rivers.

6
2013 Bacteria sample sites in the Millers Basin.
Dark blue river = Millers River
Light Blue river = Otter River
Special thanks to our volunteers!
Paul Goyetche, Diane Nassif, Bill Belco, Sean Grimley, David & Monique Brule,
Leah Berlin, Josh Lebelle, Sean Ashcraft/Peak Expeditions
Acronyms: CRWC = Connecticut River Watershed Council PVPC = Pioneer Valley Planning Commission DSH = Daniel Shays Highway
MassDEP = MA Department of Environmental Protection

7
Project Approach
Purpose (taken from MRWC QAPP) Quote from MassDEP’s 2000 Millers River Water Quality Assessment Report: “There is a lack of bacteria data throughout the watershed limiting the assessment of recreational uses.” “Primary and Secondary Contact Recreational Summary - Rivers: The majority of the river miles (92%) are currently not assessed for the Primary and Secondary Contact Recreational Uses because of the lack of current bacteria data.”
The Millers River and its watershed offers many fine recreational and nature
viewing opportunities. Unfortunately there is a lack of water quality data to determine if
the river is meeting the state’s surface water quality standards (SWQS). Many years ago,
the river struggled with point source pollution, such as sewage discharges, which in time
have been largely dealt with. Recreational activities are related to either primary or
secondary contact standards, which are closely tied to the bacterial condition of the
waters. Bacterial data for the Millers and Otter Rivers has been too limited to make a
clear contact standard determination. Having adequate bacteria data to make a clear
determination would inform people whether water recreation is safe and healthy.
MassDEP-Division of Watershed Management, (DWM), sampled the Millers
River Watershed in 2005 as part of a five-year rotating basin schedule. DWM sampled
selected sites in the Millers in 2011 and MRWC will review this data as available. Only
five sites in the Millers basin have received periodic sampling on a regular basis. These
are the MassDEP CERO SMART (Strategic Monitoring and Assessment for River basin
Teams) sites and are typically sampled every 10 weeks.
In order to provide a more adequate data set with which to determine whether
standards are being attained, having more sites sampled at more regular
intervals, in season, offers the means to make a clear determination. Sampling at 4-7
sites on the Otter River and 8-12 sites on the Millers, 6-8 times at each, during the prime
contact months, May through September, should offer an adequate baseline. Funding
may limit the ability to cover this broad range continually, so MRWC will focus on key
areas and target additional sites when possible.

8
An expanded data set will give a broad collection of locations and time periods,
more wet/dry event information to review, and even a means to begin to consider source
issues. Additional new data will help MRWC and MassDEP to make accurate water
quality determinations for the Millers Basin.
Definitions: (MassDEP)
PRIMARY AND SECONDARY CONTACT RECREATIONAL USE (DEP)
The Primary Contact Recreational Use is supported when conditions are suitable (fecal
coliform bacteria densities, turbidity and aesthetics meet the SWQS) for any
recreational or other water related activity during which there is prolonged and intimate
contact with the water and there exists a significant risk of ingestion. Activities include,
but are not limited to, wading, swimming, diving, surfing and water skiing.
The Secondary Contact Recreational Use is supported when conditions are suitable for
any recreational or other water use during which contact with the water is either
incidental or accidental. These include, but are not limited to, fishing, boating and
limited contact related to shoreline activities.
Stakeholders for this project include residents, visitors to, and recreational users
of the Millers River Watershed; municipalities, and state, regional and federal
environmental agencies. The data produced in this study will be shared with all
stakeholders, to aid them in making personal decisions on safe use of the river for
recreational purposes; understanding causes and effects of weather, land use and other
human activities on water quality; and developing management strategies for
preservation/restoration of watershed health. All data that are reported will be
compared with Massachusetts surface water quality standards.
Objectives:
Since the main stem of the Millers River and one of its major tributaries, the
Otter River, have not been extensively nor annually monitored by MassDEP for bacteria
loading, this project is meant to complement MassDEP’s limited monitoring program by
conducting bacteria sampling on waters not monitored by MassDEP in order to facilitate
the ability to make water quality standard attainment determinations for primary
and/or secondary contact on a regular annual basis.

9
This monitoring program is intended to:
Advance improvement of the water quality of rivers and streams in the Millers
River Watershed that may be impaired due to bacterial contamination. Steps
towards achieving this goal may entail locating sources of bacteria contamination
within targeted sub-watersheds and recommending appropriate action to initiate
remediation.
Contribute to ongoing and future assessments of whether bacterial
contamination impairs the river’s ability to support primary and secondary
contact recreation.
Convey this information to local, state and federal agencies and to river users
through ‘rapid response’ analysis and communication. 24 hour turnaround of
sampling results enables quick public notice.
Methods MRWC’s formal QAPP document describes the various considerations,
procedures, reasonings, and details of the monitoring processes. How we conducted
2012 worked out as follows.
Once adequate funding was secured, MRWC began to assemble needed
equipment and select a qualified lab. Sampling kits in accordance with our bacteria SOP
(MWWP R-3) were assembled for each volunteer and each site. Coolers and ice pack
sets were acquired. A sampling pole, 42 inches long with a spring clamp attached to one
end, was fabricated for each volunteer. This pole enabled the sampler to reach out into
the current and grab a sample from a deeper point in the stream and lessen edge effects.
Each volunteer received training in sample collection, data form completion,
appropriate sample care (keeping sample cold), hold time requirements, label
completion, safety concerns/requirements, Quality Control (QC) requirements, and
sample delivery logistics. Volunteers followed a preset sampling schedule and were
reminded of sampling events 3-4 days ahead of time and regularly resupplied with
sample bottles and forms if needed. Sampling was done, rain or shine, considering
safety, and fortunately no events were cancelled.

10
Collection was done via a “grab” type sampling procedure using a sampling pole.
Samples were collected in 100 ml sterile bottles prepared with thiosulfate – as a
precaution against chlorine that could be present in the water sampled below a water
treatment plant and which would affect sampling results. Bottles were labeled with date
and time of collection and put on ice in a cooler immediately after collection. Volunteers
also completed a field sheet and internal MRWC Chain of Custody (CoC). Samples were
then brought to a central meeting place where a MRWC runner collected all samples
into a single iced cooler and transported all samples to the lab for analysis. Once there,
samples were checked in and temperature and time recorded. Samples were analyzed
for bacteria using a Colilert system.
Typically only 24 hours elapsed until the lab report was issued. Data was then
posted on line (www.ConnecticutRiver.us) through a partnership with CRWC and PVPC,
then tabulated by event date and site.
Temperature was sampled using a conventional non-mercury stick thermometer
which was placed in the flow and permitted to equilibrate for two minutes before
reading. Temperatures were recorded on a field sheet with other site observations.
Meanwhile, the project coordinator had downloaded weather/rain data from
NOAA/NWS for sites at both the Orange and Fitchburg airports for both the 24 and 48
hours previous to the sampling event. These airports are closest to our monitoring sites.
Rainfall was recorded and tabulated for analysis. Wet weather can elevate bacteria, so
viewing this data is important. River flows were also downloaded from available USGS
stations in South Royalston, Erving, and Gardner.
QC samples were collected and prepared and sent to the lab: a duplicate at each
sampling event and a total of three blanks (distilled pure water samples) during the
sampling season. Comparing these results gives a sense of the quality of our sampling
and the lab’s analysis.
With all this information collected and tabulated, we are able to review the rivers’
contact standards.

11
2013 Monitoring sites
In 2013 MRWC reduced the number of sites from 2012, but maintained key
baseline data points along MRWC “Blue Trails,” two river sections within the Millers
River Watershed; one on the Millers River and one on the Otter River. Since MRWC
encourages river discovery/recreation, it was deemed prudent to continue the
investigation of how well the Blue Trail segments meet “contact standards.”
Table 1: Sampling Sites (First Letter: M=Millers, O=Otter) Site ID# Location Latitude Longitude Notes
MOSF1 New Boston Rd-ORSF
42°38'44.38"N 72° 5'55.38"W Upstream side of bridge in Otter River State Forest
MCM1 Cass Meadow 42°35'36.71"N 72°14'20.95"W Park at Rich Env Park, sample at boat launch, in current, not eddy
MFW1 Fielding Way 42°34'33.33"N 72°15'33.18"W Park near cemetery, walk down old road to site. Site is upstream DSH
MORF1 Orange Riverfront Park
42°35'19.52"N 72°18'29.33"W Sample from boat ramp
MWO1 West Orange 42°35'54.23"N 72°20'29.28"W Park along 2A, walk under RR bridge, sample downstream side of north bank
MMF1 Millers Falls 42°34'45.16"N 72°29'27.05"W Sample along south bank, downstream of paper mill bridge, off Newton St
MCf1 Millers confluence w/CT River
42°35'44.91"N 72°29'45.02"W off Rt 2, sample along bank, upstream of bike bridge, Dorsey Rd
OR2A1 Rt 2A crossing 42°33'52.10"N 72° 0'42.32"W Sample upstream side, west bank
OR101 Rt 101 Crossing 42°34'25.97"N 72° 0'58.43"W Sample on west bank, downstream side of bridge, park in lot
OBW1 Baldwinville 42°36'23.51"N 72° 4'30.34"W Park behind Legion Hall, sample upstream, east bank of bridge
The table above lists the 2013 sites. A number of sites straddle the “Millers River
Blue Trail” and some sites are located both upstream and downstream where potential
paddling trails and fishing areas are planned or exist. The Otter River sites mostly
bracket the headwaters section of the Otter River where MRWC is creating a headwaters
blue trail. The Baldwinville site is near the intended second phase of the Otter River
Blue Trail. The Rt 2A, 101, and 202 sites all present some degree of urban runoff
influence. The location of these sites offers a good balance of data from both urban and
non-urban conditions.

12
Results
Bacteria
The table below notes the bacteria levels for the 2013 sampling season. A detailed
discussion and interpretation of these results is presented in the Conclusions section.
Most dry weather sampling events met mean primary contact standards. Secondary
standards were met in all dry events. Single day results in general were good.
7/24/13 Samples for the 3 Otter River sites showed sign of some form of
unknown precipitate (likely Iron, magnesium, or H2S) which discolored samples
during analysis thus making the reliability of the results uncertain. Investigation
yielded no causes.

13
Weather
Weather was recorded from the Orange and Fitchburg Airports for the 24 & 48
hour periods prior to the sampling event. During these time periods, streams are most
greatly affected by stormwater runoff, which can illustrate runoff’s impacts on water
quality.
It was wet in the early summer as illustrated by the high river flow rates. Late
summer flows began to approach normal.

14
Field sheets
The table below summarizes general field “Aesthetic” observations noted during
sampling events. Presented below are visual color and “nose” odor observations.
In general, both the Millers and Otter Rivers appear to have a tint, often
described as a weak tea color. This is common in many New England rivers and relates
to the presence of natural tannins from plant decay. It is also heartening that there
were very little or NO water ODORS observed throughout the summer
season.
These general observations are useful as they can be compared from person to
person, year to year and give some continuity to the monitoring. A long term record can
help clarify if any changes occur.

15
Table: 2012 River Temperatures
na = no data.
The river temperatures in late June and July exceeded cold water fishery standards,
which, is considered 68 degree F. Most dates have consistent readings and at a glance
appear similar to 2012 readings. All thermometers were QC checked.
QC Objectives (Quality Control = QC)
MRWC set a number of QC objectives for the sampling program. A review of
these objectives, presented below, will determine how well the program performed this
season.
Completeness:
MRWC completed 69 out of 70 planned bacteria samplings; >99% achieved. This
met our goal of 80+%. We missed 2 field duplicates and 2 blank samples.
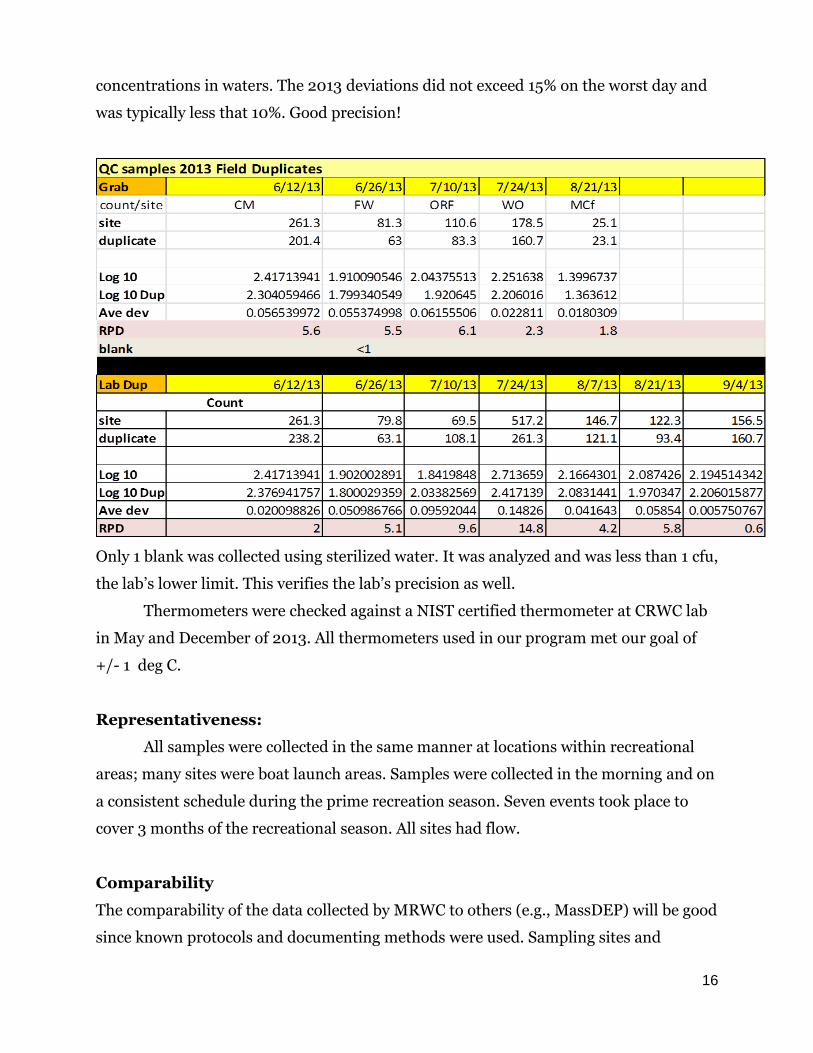
Precision:
MRWC’s goal for precision was <30% deviation on duplicates when analyzing
log10 of the values. Log10 smoothing of values considers the randomness of bacteria
16
concentrations in waters. The 2013 deviations did not exceed 15% on the worst day and
was typically less that 10%. Good precision!
Only 1 blank was collected using sterilized water. It was analyzed and was less than 1 cfu,
the lab’s lower limit. This verifies the lab’s precision as well.
Thermometers were checked against a NIST certified thermometer at CRWC lab
in May and December of 2013. All thermometers used in our program met our goal of
+/- 1 deg C.
Representativeness:
All samples were collected in the same manner at locations within recreational
areas; many sites were boat launch areas. Samples were collected in the morning and on
a consistent schedule during the prime recreation season. Seven events took place to
cover 3 months of the recreational season. All sites had flow.
Comparability
The comparability of the data collected by MRWC to others (e.g., MassDEP) will be good
since known protocols and documenting methods were used. Sampling sites and
17
procedures are well documented so that future surveys can produce comparable data by
following similar procedures and using same sites.
Training:
All volunteers received training in sampling, sample handling, recording,
labeling, and safety procedures.
Sample Handling/Hold Times:
All samples were transported on ice packs, in coolers, and were received amply
chilled. All samples were delivered to the lab within the six hour maximum hold-time
limit. A few samples were delivered so soon that they had little time to chill. There were
a few writing legibility issues in noting sample IDs on forms and these were successfully
sorted out.
These results indicate that the QC objectives for 2013 were met.

18
Conclusions/Discussion
2013 discussion
The spring of 2013 was not unusually wet, but June saw rains nearly twice the
norm. River levels were high throughout the summer and did not begin to approach
normal flows till mid/late August. By chance, most of our sampling dates fell in periods
with little or no rain. The two WET event dates did have the highest average bacteria
counts of our sampling season. All sites met secondary standards, wet or dry, with half
the sites having a geometric mean for the summer as primary contact attainment. The
only times where a site failed the single primary sample limit of 235 cfu were on days
deemed as wet weather, after a rain. This confirms the recommendation that primary
contact, swimming and such, be avoided immediately after rain events.
The data from the 2013 sampling season allows the following observations:
o Dry weather events met primary contact standards at most sites and
secondary contact standards for all sites.
o The poorest day for bacteria was a wet event with the most rain recorded
within 24 hours. (7/24/13)
o Cass Meadow and Fielding Way sites continue to have highest geometric
means. These sites are near an urban area: Athol.
o The site at New Boston Rd, ORSF, had a secondary use geomean possibly
due to the higher summer flows and the nearby wetlands and animal
activity.
o Other sites with a secondary rating were near urban areas.
o River Temperatures appeared similar to 2012.
o There were no unusual odor or color observances.
The state has established the use of the geometric mean to review bacteria data
sets for determination of standard attainment. Use of the geometric mean is generally
advised for bacteria data to attain a log normal distribution by reducing skew effects.

19
2013 Conclusions
Immediately following a heavy rain storm, river areas in and immediately below
urban areas may not be suitable for primary contact, but secondary contact may be
acceptable. In dry weather conditions, these rivers appear acceptable for primary and
secondary contact recreation.
Communities wishing to meet primary contact standards should consider
implementing (and maintaining) a comprehensive stormwater management program.
MassDEP, the Mass Watershed Coalition, and the Mass Association of Conservation
Commissions can offer information on other programs. Such programs would offer
improvements in water quality that would benefit both people and river health.
2014 efforts
The data from this third year of monitoring will add to the baseline of data and
help MRWC and the community, broaden its understanding water quality trends.
Continuing to add to this baseline will be helpful. At a minimum, MRWC hopes to
sample many of the same sites again in 2014, 6-8 times using the same procedures.
Regular and consistent monitoring will enable MRWC to keep the public well-informed,
while developing a clearer water quality history from which to determine trends and
identify problems and remedial actions.
With possible new segments of the Blue Trail Network, MRWC will seek funding
to restore sampling in Winchendon/Waterville and Erving.
MRWC may also wish to have funding resources to perform some “source”
tracking if areas are discovered to have high e-coli readings. Source tracking would
entail immediate follow up sampling after a high reading in and around a high reading
site. This may also include “bracketing” the site by sampling areas above and below any
suspected bacteria sources that could contribute to the concern. Reserve funding for up
to 20 samples would be beneficial for such an effort.
Funding will determine the final scope of sampling in 2014; between grants and
another “Adopt a Sample” campaign we hope to sample at least 12-13 sites.
Maintaining/Recruiting volunteers will begin in the late winter of 2014 with
training slated for the late spring. MRWC will likely begin 2014 sampling in June.
MRWC sees this program as an important resource in advancing watershed
protection and community engagement.
20
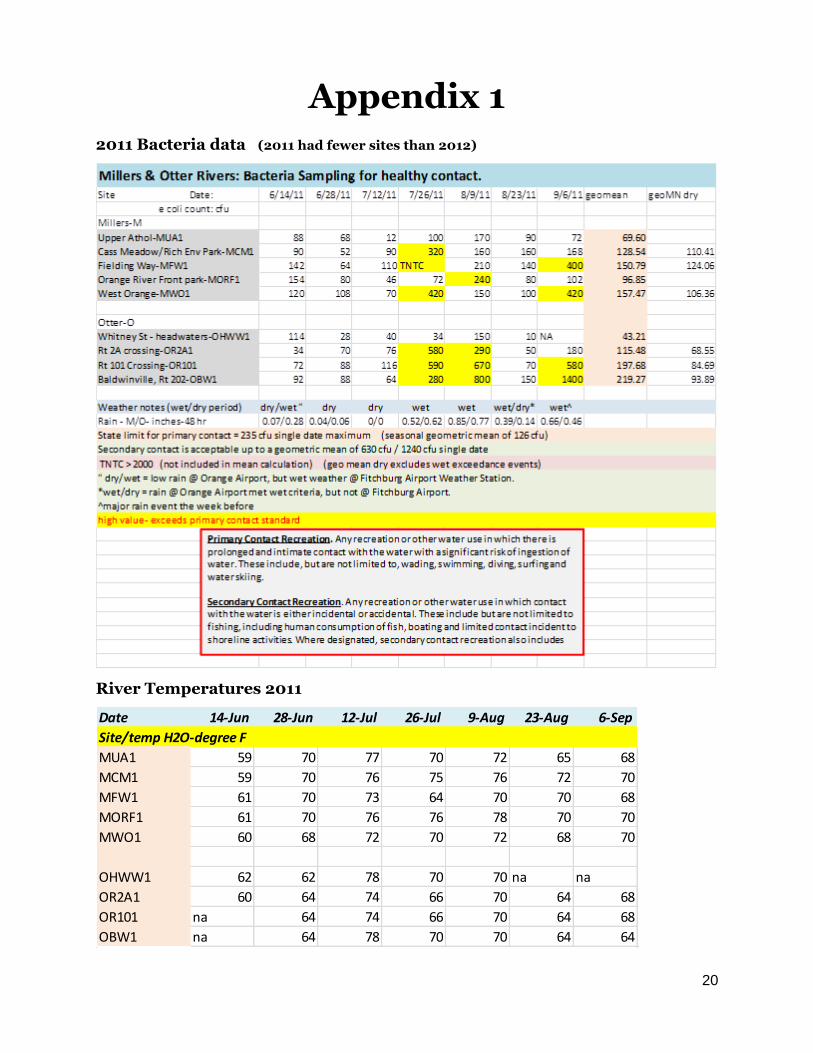
Appendix 1 2011 Bacteria data (2011 had fewer sites than 2012)
River Temperatures 2011
Date 14-Jun 28-Jun 12-Jul 26-Jul 9-Aug 23-Aug 6-Sep
Site/temp H2O-degree F
MUA1 59 70 77 70 72 65 68
MCM1 59 70 76 75 76 72 70
MFW1 61 70 73 64 70 70 68
MORF1 61 70 76 76 78 70 70
MWO1 60 68 72 70 72 68 70
OHWW1 62 62 78 70 70 na na
OR2A1 60 64 74 66 70 64 68
OR101 na 64 74 66 70 64 68
OBW1 na 64 78 70 70 64 64

21

22
MRWC
Thermometer Quality Check Report
2013 Bac-T program used “T” probes
Pre-season check Date: 5-22-13 QC used: CRWC lab NIST QC by: K Davies Probe ID Probe temp Nist Temp Probe temp2 Nist temp2 Notes
T-1 72.5 22.6/72.7 53 10.9/51.7 pass T-3 72.5 22.6/72.7 53 10.9/51.7 pass
T-4 72.5 22.6/72.7 53 10.9/51.7 pass
T-5 22.5 22.6/72.7 11.1 10.9/51.7 pass
T-6 72.4 22.6/72.7 52 10.9/51.7 pass
T-11 72.0 22.6/72.7 52 10.9/51.7 pass
D-14052 23.0 22.6 11.5 10.9 pass
D-14056 22.5 22.6 11.2 10.9 pass
D-20480 22.7 22.6 11.5 10.9 pass
D-20473 22.7 22.6 11.4 10.9 pass
D-20448 22.5 22.6 11.2 10.9 pass
Post-season check Date: 12/3/13 QC used: CRWC lab NIST QC by: K Davies Probe ID Probe temp Nist Temp Probe temp2 Nist temp2 Notes
T-1 67 19.6/67.3 37 3/37.4 pass T-3 67 19.6/67.3 37 3/37.4 pass
T-4 67 19.6/67.3 37 3/37.4 pass
T-5 19.5/67 19.6/67.3 3/37 3/37.4 pass
T-6 67 19.6/67.3 37 3/37.4 pass
T-11 67 19.6/67.3 37 3/37.4 pass
D-14052 20 19.6 3.3 3 pass
D-14056 19.7 19.6 3.0 3 pass
D-20480 19.9 19.6 3.0 3 pass
D-20473 19.8 19.6 3.0 3 pass
D-20448 19.7 19.6 3.1 3 pass
All Temps C/F, T= spirit thermometers, D= digital thermometers QC limit per QAPP = 1 deg C precision, 0.5 deg C accuracy