monitoring for management of protected areas - an … for management of protected areas - an...
TRANSCRIPT

1
Module 6
Monitoring for Management of Protected Areas - An
Overview
Madhu Rao, Emma J Stokes and Arlyne Johnson
2
Table of Contents
1. WHY MONITOR? 3
(A) THE ROLE OF MONITORING IN THE PROJECT MANAGEMENT CYCLE 6 I. MONITORING ALLOWS US TO ASSESS THE STATUS OF THREATS AND CONSERVATION TARGETS. 8 II. EVALUATING THE EFFECTIVENESS OF MANAGEMENT INTERVENTIONS. 8 III. INFORMING AND IMPROVING MANAGEMENT PRACTICE THROUGH AN ADAPTIVE MANAGEMENT
PROCESS. 9 (B) MONITORING PROVIDES INFORMATION FOR DECISION-MAKING 9
2. WHAT TO MONITOR? 10
A. LEVELS OF MONITORING 10 I. MEASURING CONSERVATION TARGETS (IMPACT MONITORING) 10 II. MEASURING CHANGES IN THE LEVELS OF THREATS (OUTCOME MONITORING) 10 III. MEASURING THE IMPLEMENTATION OF INTERVENTIONS (PERFORMANCE MONITORING) 10 (B) SETTING PRIORITIES AND ALLOCATING RESOURCES FOR MONITORING 11
3. DEVELOPING A MONITORING FRAMEWORK (COVERED IN MODULE 2) 14
(A) DEFINING CLEAR GOALS AND MONITORING OBJECTIVES FOR TARGETS, THREATS AND
INTERVENTIONS 15 (B) ESTABLISHING INDICATORS AND APPROPRIATE MONITORING METHODS 16 (C) PLANNING A SCHEDULE, AND IDENTIFYING THE ACTORS AND FUNDING SOURCES 20 (D) PUTTING IN PLACE APPROPRIATE DATA MANAGEMENT AND PROCESSING SYSTEMS 22
4. CLOSING THE LOOP - COMMUNICATING THE RESULTS 23

3
1. Why monitor?
The term ‘monitoring’ has been used to describe many types of activities. It can be defined
as the process of gathering information about variables such as rate of loss of forest cover or
quantity of wildlife poached per month within a system of interest, such as a protected
area1. Monitoring information is used to characterize the status of the protected area at
different points in time for the purpose of assessing the state and drawing inferences about
changes in state over time (Yoccoz et al. 2001). A simple example of monitoring is the
gauge on the dash of your vehicle that shows how much fuel is remaining in the fuel tank.
In this case, the fuel is the variable that you are interested in monitoring to assess the status
of your vehicle as you travel.
Likewise, in natural resource management monitoring is a critical component of an
informed process for making decisions.
i) First, monitoring is important for decision-making, as when managers need to know
the state of the protected area before deciding on the appropriate course of action
during the management cycle. For example, managers need to know if the protected
area is intact or degraded. They also need to know the level of illegal hunting in the
protected area.
ii) Second, monitoring is critical for evaluating the effectiveness of management actions
in the protected area relative to objectives (see below for definition of objectives).
iii) Third, in an adaptive management setting, monitoring provides the feedback loop for
learning about the protected area (Nichols and Williams 2006). Given the limited
resources for conservation and the urgency of many conservation problems, donors,
managers and scientists are increasingly keen to ensure that conservation funds are
spent on management actions that are most effective in reducing threats to
biodiversity. Monitoring is critical to determine trends in biological diversity over
1 Although monitoring information can be used to characterize the status of any system of interest, for the application of this module for training protected area staff in Lao PDR, we will primarily refer to a protected
area as the system of interest.
4
space and time with an emphasis on evaluating the effectiveness of management
actions and policies.
Scientific and Management Objectives for Monitoring
The rationale underlying many monitoring programs is that additional information about
any system will be useful. This general approach typically does not result in effective
management decisions for conservation and has been strongly criticized (Yoccoz et al. 2001,
Legg & Nagy 2006). A more useful and cost-effective approach is to clearly specify the
objectives of a monitoring program. Such objectives can be usefully categorized into two
general classes – scientific and management objectives (Yoccoz et al. 2001).
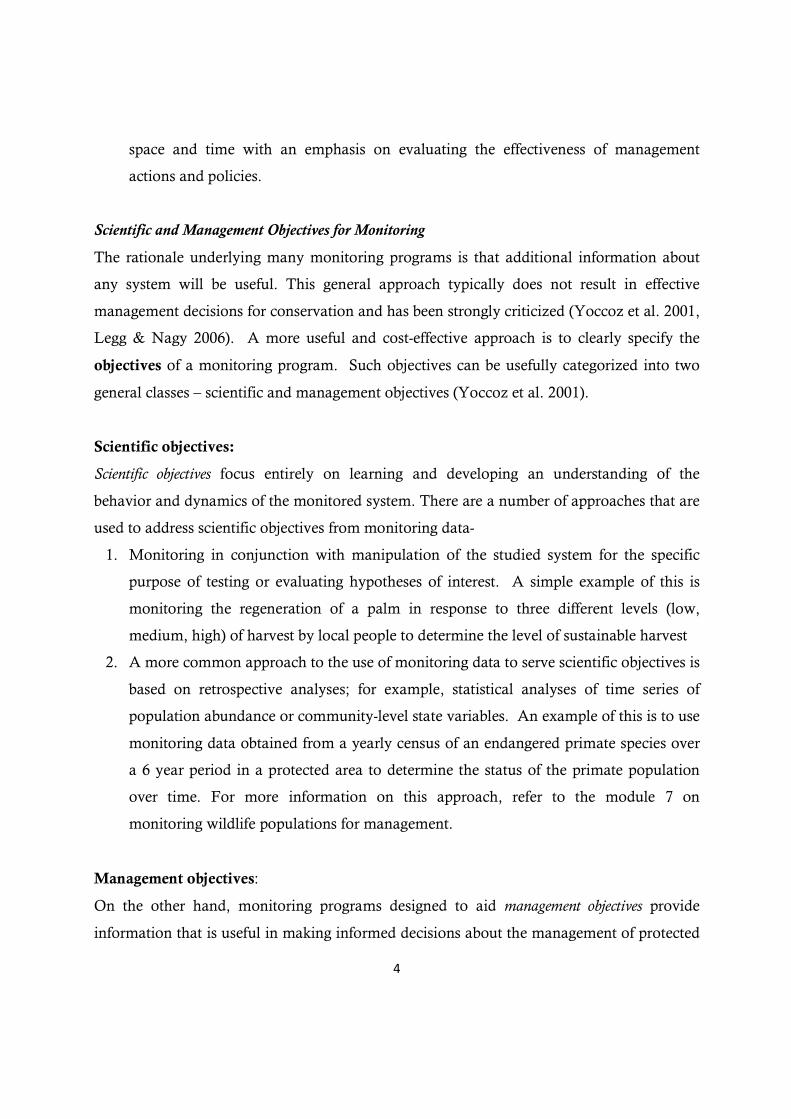
Scientific objectives:
Scientific objectives focus entirely on learning and developing an understanding of the
behavior and dynamics of the monitored system. There are a number of approaches that are
used to address scientific objectives from monitoring data-
1. Monitoring in conjunction with manipulation of the studied system for the specific
purpose of testing or evaluating hypotheses of interest. A simple example of this is
monitoring the regeneration of a palm in response to three different levels (low,
medium, high) of harvest by local people to determine the level of sustainable harvest
2. A more common approach to the use of monitoring data to serve scientific objectives is
based on retrospective analyses; for example, statistical analyses of time series of
population abundance or community-level state variables. An example of this is to use
monitoring data obtained from a yearly census of an endangered primate species over
a 6 year period in a protected area to determine the status of the primate population
over time. For more information on this approach, refer to the module 7 on
monitoring wildlife populations for management.
Management objectives:
On the other hand, monitoring programs designed to aid management objectives provide
information that is useful in making informed decisions about the management of protected

5
areas. The content of this module will focus on this category of monitoring. Monitoring
programs developed in conjunction with management typically serve two specific functions:
1. Identifying the system state. For example, if the size of a population that is
harvested for subsistence food by local people (e.g., muntjac) is believed to be too
small, then management actions should be directed at increasing numbers, and
2. Providing information on the system response to management actions. [The use of
data from monitoring programs to learn about system response to management actions is
similar to the use of monitoring data to distinguish between two competing scientific objectives
(see above). Management actions are viewed as manipulations of interest, and system responses
identified by monitoring are compared with a priori predictions of alternative hypotheses
about system response.] For example, monitoring the number of poaching incidents in response
to two different management actions: (i) Guards conduct 25 days of foot patrols per month
covering 40% of the protected area and (ii) Establishment of 6 guard posts at trailheads along
the border of the core zone.
Scientists and managers of natural areas need to work together to design and implement
effective monitoring programs. Managers need to ask scientists to provide:
i) clear directions as to what they want measured and how, which is also defined as
monitoring metrics),
ii) the level of change expected in a given period of time to define the management
objectives, and
iii) how to prioritize management tasks in order to have the largest positive impact on the
viability of the conservation targets they are managing (Barrows and Allen 2007).
For example, managers need to know how to measure changes in the populations of
tigers in a protected area; do they monitor tigers or prey or both and how? In the Nam
Et-Phou Louey National Protected Area, with advice from scientists, the NPA is
regularly conducting camera trap surveys to monitor change in tiger abundance to assess
if the NPA has reached it’s stated objective of increasing tigers by 50% over a period of
ten years. Overall, monitoring must be guided by scientific principles in order to provide
information that is statistically defensible and useful for managers responsible for
managing biodiversity.

6
(a) The role of monitoring in the project management cycle
In relation to the project management cycle, monitoring is defined as the periodic collection
and evaluation of data relative to stated project goals, objectives and activities. Many refer
to this process as Monitoring and Evaluation, which can be abbreviated as “M&E”. It is an
essential part of good conservation management and a key component of the Project
Management Cycle (Refer to Module 2, see Figure 1 below).
Figure 1: The Wildlife Conservation Society’s interpretation of the conservation management cycle as developed by the Living Landscapes Program (CITE).
Using a hypothesis-driven scientific approach, monitoring designs need to embrace the
scientific method, provide insights into the ecological processes at work within natural
Define the Context: Set Conservation Goal, Select Conservation Target, Rank and Map Threats
Design Approach and Measures of Success
Build a Conceptual Model, Set Desired state of Targets (PTLs)
Review Progress and Revise Approach
Implement Actions and Measure Effectiveness
Prioritize Interventions, Build Monitoring Frameworks
Spatial Modeling
Landscape Species Selection
Spatial priorities are not well known
Site-based project and/or umbrella role of species confirmed

7
systems, and importantly, point directly to if, when, and how active management may need
to be employed in order to prevent the loss of biodiversity. A conceptual model provides the
scientific basis for developing monitoring plans and is viewed as the foundation of all
project design, management, and monitoring activities (See Module 2). These models define
hypotheses about linkages between changes in the state of biodiversity components, threats
and management actions or interventions.
A conceptual model explicitly identifies the components of biodiversity that need to be
conserved (Conservation targets), what human and natural factors threaten these targets
(direct threats), the roles that resource users, managers and policy makers play that lead to
or facilitate the direct threats (indirect threats) and the interventions that will be
implemented in order to reduce threats.
Monitoring plays a key role in helping us review our assumptions of how, where and why
we intervene – by evaluating the causal linkages between the interventions, threats and the
conservation targets in a conceptual model for a project. Monitoring allows hypotheses
related to the causal linkages to be evaluated, accepted or rejected. For example, killing of
elephants with automatic guns is a direct threat to the viability of the Asian elephant
population, a conservation target in the Nam Kading NPA. One indirect threat that can
lead to the killing is when farmers and their crops are repeatedly threatened by the
elephants. Two interventions that NPA management is doing to reduce these threats are to,
i) train crop protection methods to farmers to use in their existing agricultural fields and to,
ii) enforce land use zoning to prevent further expansion of agricultural fields into existing
elephant habitat (See Figure 2)

8
Objective: By 2010, the Asian
elephant population will not decrease in
NK NPA
Figure 2: Schematic of a causal linkage
In example above, we need to monitor to assess if the establishment of crop protection
systems and land use zoning actually reduces the threat of human-elephant conflict and
killing of elephants and thus helps maintain the elephant population within and around
Nam Kading NPA.
Overall, there are at least three reasons why monitoring is important:
i. Monitoring allows us to assess the status of threats and conservation targets.
In particular, we need to understand whether threats are decreasing or increasing and
whether wildlife populations are increasing, remaining stable or declining. [Managers
need to know the system state before deciding on the appropriate course of action during
the ensuing project management cycle.] For example, in the Nam Kading NPA in Lao
PDR, a project with the conservation target of maintaining the elephant population in and
around the NPA needs to monitor the status of threats to elephant populations (hunting
and human-elephant conflict) as well as the status of the elephant populations (See
Appendix 1).
ii. Evaluating the effectiveness of management interventions.
Monitoring helps us identify which actions lead to the success or failure of a particular
conservation approach and evaluate and revise assumptions as to why and where
conservation efforts are needed. For example, referring back to the conceptual model for

9
the Nam Kading NPA, we want to know whether the two interventions designed to
reduce the threat of elephant-human conflict i.e. training crop protection methods to
farmers in existing agricultural fields and enforcing land use zoning to prevent expansion
of agricultural fields into elephant habitat are (i) effective in reducing human-elephant
conflict (measured as crop loss, injury to humans or elephants), and (ii) Is one approach
more effective than the other in reducing human elephant conflict?
iii. Informing and improving management practice through an adaptive management process.
Monitoring helps us learn from the experience of implementing the chosen management
interventions and to modify management interventions accordingly. Thus, monitoring
plays a key role in the process known as adaptive management- which is a dynamic
process that involves the integration of monitoring results back into project design and
implementation. For example, in the conceptual model for the Nam Kading NPA,
monitoring may show a further decline in the population density of elephants in the PA
due to increased levels of hunting where elephant crop raiding is occurring. This
monitoring result indicates the need to review the threat of hunting more carefully and the
interventions meant to reduce human-elephant conflict.
(b) Monitoring provides information for decision-making
Monitoring is only relevant when it provides information for decision-making. Monitoring
that does not provide relevant information for decision-making is not useful for
management and is inefficient because it uses human and fiscal resources that could be
directed elsewhere. (Gibbs et al. 1999). Thus monitoring is useful only if it leads to
improved management decisions and therefore, a key component of any monitoring plan is
a mechanism to use the new information to guide management decisions. Specific
questions to ask are:
i) Do the data indicate that the conservation interventions are being implemented well?
ii) Are threats being reduced?
iii) Is the status of conservation targets improving?
10
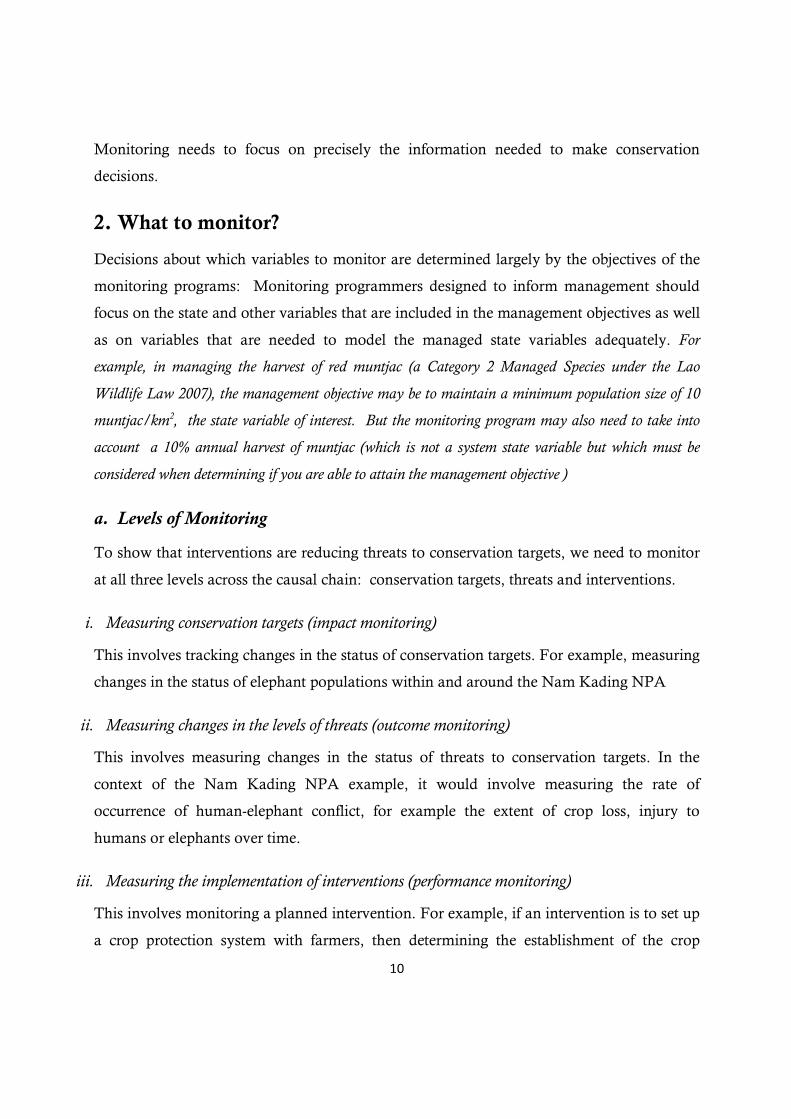
Monitoring needs to focus on precisely the information needed to make conservation
decisions.
2. What to monitor?
Decisions about which variables to monitor are determined largely by the objectives of the
monitoring programs: Monitoring programmers designed to inform management should
focus on the state and other variables that are included in the management objectives as well
as on variables that are needed to model the managed state variables adequately. For
example, in managing the harvest of red muntjac (a Category 2 Managed Species under the Lao
Wildlife Law 2007), the management objective may be to maintain a minimum population size of 10
muntjac/km2, the state variable of interest. But the monitoring program may also need to take into
account a 10% annual harvest of muntjac (which is not a system state variable but which must be
considered when determining if you are able to attain the management objective )
a. Levels of Monitoring
To show that interventions are reducing threats to conservation targets, we need to monitor
at all three levels across the causal chain: conservation targets, threats and interventions.
i. Measuring conservation targets (impact monitoring)
This involves tracking changes in the status of conservation targets. For example, measuring
changes in the status of elephant populations within and around the Nam Kading NPA
ii. Measuring changes in the levels of threats (outcome monitoring)
This involves measuring changes in the status of threats to conservation targets. In the
context of the Nam Kading NPA example, it would involve measuring the rate of
occurrence of human-elephant conflict, for example the extent of crop loss, injury to
humans or elephants over time.
iii. Measuring the implementation of interventions (performance monitoring)
This involves monitoring a planned intervention. For example, if an intervention is to set up
a crop protection system with farmers, then determining the establishment of the crop

11
protection system (warning systems and deterrents in agricultural fields) is equivalent to
monitoring the intervention.
It is important to measure all three components along a causal chain in order to be able to
conclusively determine that a positive change in the status of a conservation target resulted
from a reduction in a particular threat due to a specific intervention. By monitoring
elephant population densities (conservation target), rate of occurrence of human-elephant
conflict (threat) and the implementation of a crop protection system (intervention), we
maybe able to associate an increase in elephant population densities with a reduction in
human-elephant conflict due to the presence of crop protection systems. Although it is often
difficult to conclusively establish the causal links between interventions, threats and
conservation targets especially in large landscapes with multiple stakeholders, monitoring at
these three levels is necessary for us to test the effectiveness of our interventions. (Refer to
Figure 2: Schematic of a causal linkage)
(b) Setting priorities and allocating resources for monitoring
Given that time, financial resources and personnel/staff are limited for almost all
conservation projects, managers must achieve a balance between taking conservation action
(implementing interventions), evaluating the effectiveness of interventions and monitoring
the status of conservation targets and threats. It is often a struggle to make decisions
regarding the allocation of limited resources among these competing needs.
Time-scale issues and Tradeoffs
As conservation of wildlife and their habitats is our objective, then we need to monitor their
changing status over time. Even in the absence of human pressures, there is natural
variation in wildlife populations and habitat quality over time that makes it very difficult to
detect changes solely attributable to the interventions that have been implemented in the
project.

12
Thus, the ways in which biological conservation targets (wildlife and their habitats) change
over time will determine the monitoring effort necessary to detect changes in conservation
targets attributable to human threats. Measuring change in biological conservation targets is
often a long-term effort. However, given the assumed causal connection between the
conservation targets, specific threats and the interventions designed to abate the threats,
monitoring threats (outcome monitoring) and interventions (performance monitoring)
allows us to measure conservation progress over the short to medium term. However, there
are trade-offs that we must be aware of when we decide to use outcome and performance
measures as estimates of progress towards achieving our objective of conserving our
conservation targets. The timeframe needed to see results and the costs of monitoring
decline as we move from monitoring changes in conservation targets to monitoring
reduction in threats to monitoring the implementation of interventions (See Figure 3 below).
However, short and medium-term measures are compromised in their ability to inform us
on the true extent to which our conservation objective is being achieved. Thus the level of
confidence with which we can say that we are achieving success declines as we use short to
medium-term measures. (LLP Bulletin No. 6).
Figure 3: Tradeoffs in costs, time and level of confidence when monitoring project interventions, threats to wildlife and habitats, and the project conservation objective.

13
Given that it is impossible to monitor every intervention, threat and conservation target at
the same intensity or level of precision, it becomes important to set priorities while
allocating resources for monitoring. Decisions can be taken based on the following
questions
(i) Which monitoring information does the project require to fulfill either donor or
institutional requirements? This should be top priority for allocation of monitoring
resources
(ii) What level of precision is needed to ensure that the monitoring results can be effectively
used to influence management decisions?
(iii) What information would be useful to have but would need additional funding?
There will be trade-offs in cost, precision and confidence associated with different
monitoring methods.
There are two key decisions that conservation practitioners need to take in project
implementation.
(1) How should managers allocate resources between implementing interventions and
monitoring the impact of the interventions and,
(2) How should managers subdivide monitoring resources across different levels of
monitoring and types of monitoring indicators.
Salafsky and Salzer 2006 offer a framework to help guide conservation practitioners towards
a logical allocation of resources between implementing interventions (taking action) and
different types of monitoring depending on the situation they are facing. The framework
consists of a decision tree that includes an explicit evaluation of three questions:

14
1. Are there substantial threats facing the conservation targets? For example, are there
substantial threats facing tigers in Nam Kading NPA?
2. Are there clear and feasible interventions (such as enforcement, outreach) known to be
effective at reducing the identified threats?
3. Does the project team have high confidence in their understanding of the overall
conservation situation? For example, does the protected area staff understand the
overall situation related to declining tigers, threats to tigers and potential interventions
that could be used to address the threats and increase tiger populations?
The optimal allocation of resources across implementing interventions and different types of
monitoring indicators at any given natural area will be determined by diverse factors such as
the types of conservation targets, the threats they are facing, level of available resources,
project goal and timeline. The careful allocation of scarce conservation funds towards
interventions and monitoring is critically important for conservation success (Sheil 2001).
In general the following guidelines are provided to help determine investment in monitoring
· Monitoring results should explicitly guide management decisions about a project.
· To be sustainable, monitoring methods need to be kept as simple and low-cost as
possible
· A higher investment in monitoring is needed if (a) the cost of the intervention is high (b)
the threat to the biological target is extremely severe and could result in irreversible
change (for example extinction).
· There are large gaps in our knowledge
If monitoring a target or threat is very expensive or difficult, it is useful to ‘triangulate’ using
easy to monitor proxy variables.
3. Developing a monitoring framework (Referred to in Module 2)
A monitoring framework is an outline of steps that will be taken to monitor the effectiveness
of interventions in reducing threats to conservation targets. The monitoring framework is
tightly linked to the conceptual model of your PA or project.

15
(a) Defining clear goals and monitoring objectives for targets, threats and
interventions
For every element of the conceptual model (conservation target, threats and interventions),
you need to identify the following:
1. A quantitative objective that will be achieved within a given time-frame
2. For conservation targets, a monitoring objective will describe the status (increase,
decrease or maintain at same level) of the wildlife species or habitat that will be
attained over a fixed time-period (for example: increase the population of tigers by
50% over the next 10 years).
3. For threats, a monitoring objective will specify by how much the threat will be
reduced over a certain time-period (for example: to reduce by 90 percent incidents of
illegal hunting inside the park over the next 5 years).
4. For conservation interventions, a monitoring objective will relate to whether a
planned intervention was implemented over a certain time period (for example: to
establish 10 guard posts along the boundary of the park over the next 5 years).
In general, a monitoring objective needs to be:
Impact oriented, representing a change in desired condition or state
Measurable, against a baseline or along a standard scale
Time-bound, achievable within a specific period of time.
Below are three examples of monitoring objectives in Nam Kading NPA, Lao PDR.
· Monitoring Objective 1 (Conservation Target): By 2010, increase the Great Hornbill
population by 35% inside the Nam Kading NPA.
· Monitoring Objective 2 (Direct Threat): By 2010, stop all habitat loss due to shifting
cultivation inside the Nam Kading NPA.

16
· Monitoring Objective 3 (Intervention): By 2010, complete land allocation zoning in all
villages bordering the Nam Kading NPA.
(b) Establishing indicators and appropriate monitoring methods
An indicator is a variable or parameter that will be measured over time in order to
determine if the project is making progress towards the quantitative objective. There could
be one or more indicators for every monitoring objective. Indicators should have the
following characteristics. They should be:
(a) Measurable in either qualitative or quantitative terms. Qualitative data is descriptive such
as narratives from interviews with villages and quantitative is numerical measures (i.e.,
abundance or density). (See Appendix 2 for examples)
(b) Precisely defined. For example, number of white-handed gibbon groups per hectare of
primary forest or Densities (nesting pairs/ km2 of hornbills in the core area).
(c) Consistent over time. If an indicator is expected to provide a reliable measurement of
change in a factor, then it is important that observed effects be due to changes in the
actual condition, not to changes in the indicator. (This criterion generally applies to
proxy indicators as opposed to indicators that measure something directly). Proxy
indicators are used as a substitute for an indicator that cannot be directly measured or
assessed. For example, in families that invest their wealth in livestock such as cows
and goats, the number of cows and goats that a household owns can serve as a proxy
indicator for household wealth. Some other examples of proxy indicators are:
§ For local livelihoods – it is difficult to measure actual household income, so we
can measure the types of items that money is spent on and that represent
increasing wealth, for example construction type of house.
§ For hunting - it is almost impossible to measure the number of animals hunted
each year, so we typically use a proxy or indirect measure of the prevalence of
people hunting or the weapons used to hunt animals with (for example number of
poachers arrested or guns or snares confiscated).

17
§ For tigers – it is almost impossible to measure the number of animals at very low
densities in some sites. So, in order to see if management interventions are
working to recover tigers we can use a proxy measure of the availability of tiger
prey (e.g., muntjac and wild pig) to assess if attempts to recover tigers are on the
right track.
(d) Sensitive. A sensitive indicator will change proportionately and in the same direction as
changes in the condition or item being measured. (As above, this too applies only to
proxy indicators).
Examples of indicators might include:
For Conservation Targets: Density of bamboo species (plants/ha) or Density of Tigers per
100 km2 of the NPA.
For Threats: Number of illegal poaching incidents recorded per km2 of patrolling per
person per day) or area of forest cleared for shifting cultivation over a 6 month period
For Interventions: Number of guard posts established over a 6 month period or km2 of
patrols conducted within the NPA.
How will information be gathered for an indicator? There is usually a wide range of
monitoring methods that can be used to collect data to assess a given indicator. For every
indicator, we need to identify at least one monitoring method. The following criteria should
be considered while selecting a method to measure a given indicator:
Will the method provide accurate and reliable results?
Is the method cost-effective in terms of resource investment? Are there cheaper ways of
getting the same data?
Is the method feasible? i.e. Does the project team have people who can use the method?
Following are examples of indicators and monitoring methods-
Conservation Target: Area of primary forest in a National Protected Area (NPA)

18
Indicator 1: Area in hectares of forest in the core zone of the NPA
Potential Monitoring Method 1: Work with community members to develop sketch maps
of the forest habitat in the reserve
Potential Monitoring Method 2: Use a Global Positioning System and aerial photography
to collect coordinates of forest areas which will be entered into a computer-based GIS.
For the Conceptual Model for Nam Kading NPA, the following could be two indicators
that the project team will measure to assess the status of the conservation target:
Conservation Target: Great Hornbill population in the Nam Kading NPA
Indicator 1: # of Great Hornbill/km2 in the NPA core zone
Indicator 2: Proportion (%) of the NPA core zone where Great Hornbill occurs
Box 1: Example of Monitoring Framework
Conceptual Model Component
Monitoring Objective Indicator Monitoring Method
Conservation Target:
Threats:
Conservation Intervention:
Monitoring Approaches
By definition, monitoring efforts involve making comparisons between a protected areas
impacts and some defined benchmark. There are two main types of comparisons that can be
made:
1. Comparison of a group affected by your PA to itself over time.

19
This comparison involves measuring how a given factor changes as a result of project
activities (tiger densities, level of hunting). The a priori assumption is that the intervention is
influencing the response variable and we monitor progress accordingly towards some
desired state. There are two main ways in which you can make this comparison:
(a) Pre-test/post-test monitoring design:
This involves measuring a group before intervention to establish a baseline, and then re-
measuring the group after intervention.
Example
Management Objective: By the end of 2012, all households will use one-third less wildmeat
(measured in kg per month) than they did in 2010
Management Intervention: Provide alternative sources of protein to households in the form
of small loans to purchase livestock.
Monitoring Strategy: Compare the amount of wildmeat in the diet of households at the
start of the management intervention to the amount of wildlife used at the end of the
stated time period.
Monitoring Method: NPA staff to conduct household surveys to determine wildmeat in
diets during the first month of the management intervention and a similar survey with
the same group of households in the final year of the intervention.
(b) Time-series monitoring design:
This involves collecting data multiple times before and after management intervention to
compare a group of units to itself over time.
Example
Management Objective: By the end of the third year, there are no incidences of poaching of
legally protected species within the core zone of the park.

20
Management Intervention: The NPA team will conduct meetings, awareness campaigns to
educate people on protected species and consequences of illegally hunting protected
species and conduct routine patrols to record illegal poaching.
Monitoring Strategy: Compare the number of recorded cases of illegal poaching of
protected species over time.
Monitoring Method: The NPA team records the number of illegally poached wildlife
during weekly patrol surveys
Comparison of a group affected by your protected area to a group not affected by your
protected area over time. This comparison involves measuring how a given factor changes
in a group affected by the project relative to a similar group that is not influenced by the
project. This type of comparison can help establish causal relationships. This is the
counterfactual approach of measuring effectiveness which basically asks the question ‘what
would happen if we hadn’t intervened’. This requires an experimental approach to
monitoring (or quasi-experimental) where you essentially have a control or non-treatment
group that fits the same general socio-ecological parameters as your intervention site. This is
often not feasible with many types of biologically monitoring due to the cost and time-
period involved to see change, but is occasionally (albeit rarely) used to evaluate
development programs on social parameters which can be evaluated more quickly (Ferraro
and Pattanayak 2006). It can help to establish causal relationships but also helps to review
assumptions of what interventions work.
For example, in the Nam Kading NPA the staff measured and compared changes in villager
knowledge and attitudes towards Great Hornbill conservation over time in villages that
received conservation outreach programs (non-control group) and in villages that had not
received the outreach programs (control group).
(c) Planning a schedule, and identifying the actors and funding sources
Once the monitoring method for every indicator has been identified and agreed upon, it is
important to determine who (individual or institution) will be responsible for gathering the
21
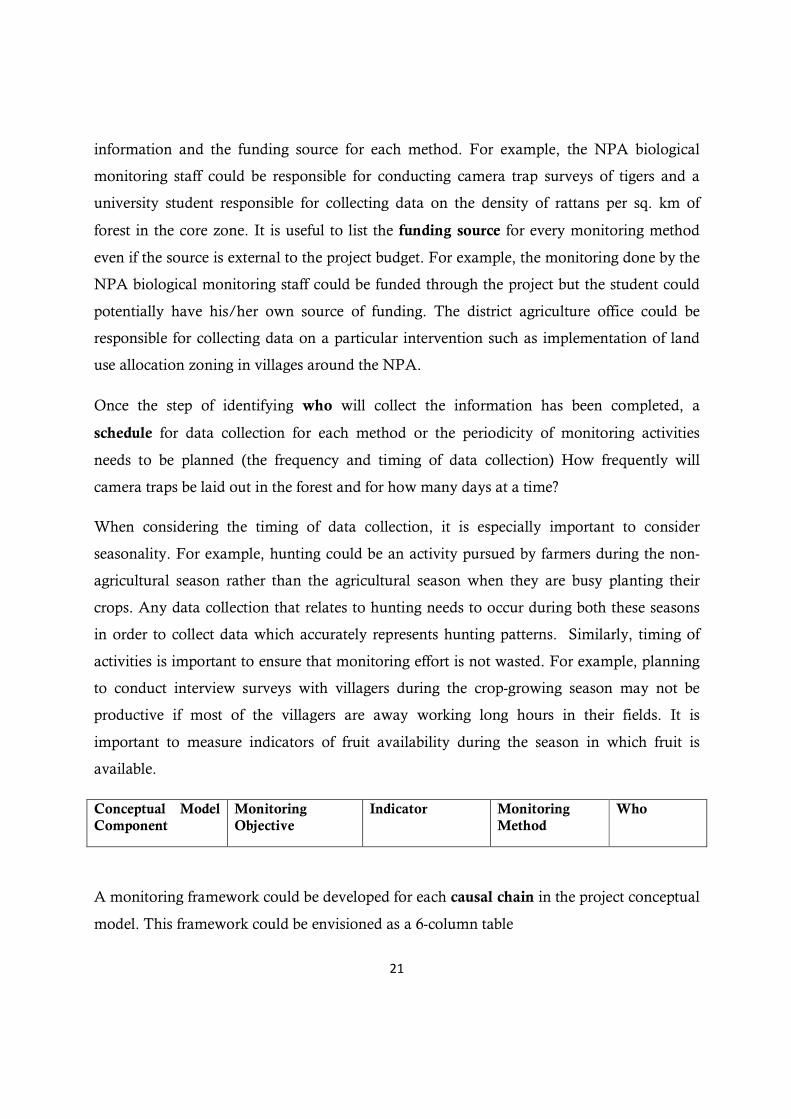
information and the funding source for each method. For example, the NPA biological
monitoring staff could be responsible for conducting camera trap surveys of tigers and a
university student responsible for collecting data on the density of rattans per sq. km of
forest in the core zone. It is useful to list the funding source for every monitoring method
even if the source is external to the project budget. For example, the monitoring done by the
NPA biological monitoring staff could be funded through the project but the student could
potentially have his/her own source of funding. The district agriculture office could be
responsible for collecting data on a particular intervention such as implementation of land
use allocation zoning in villages around the NPA.
Once the step of identifying who will collect the information has been completed, a
schedule for data collection for each method or the periodicity of monitoring activities
needs to be planned (the frequency and timing of data collection) How frequently will
camera traps be laid out in the forest and for how many days at a time?
When considering the timing of data collection, it is especially important to consider
seasonality. For example, hunting could be an activity pursued by farmers during the non-
agricultural season rather than the agricultural season when they are busy planting their
crops. Any data collection that relates to hunting needs to occur during both these seasons
in order to collect data which accurately represents hunting patterns. Similarly, timing of
activities is important to ensure that monitoring effort is not wasted. For example, planning
to conduct interview surveys with villagers during the crop-growing season may not be
productive if most of the villagers are away working long hours in their fields. It is
important to measure indicators of fruit availability during the season in which fruit is
available.
Conceptual Model Component
Monitoring Objective
Indicator Monitoring Method
Who
A monitoring framework could be developed for each causal chain in the project conceptual
model. This framework could be envisioned as a 6-column table

22
Column 1: Component of the conceptual model (type i.e. Threat, conservation target,
intervention)
Column 2: Component Description (Tiger populations)
Column 3: Monitoring Objective
Column 4: Indicator
Column 5: Monitoring Method
Column 6: Who will conduct the monitoring?
Component Type
Component Description
Monitoring Objective
Indicator Monitoring Method
Who
Conservation target
Elephant populations
Maintain the current population of elephants
Elephant density per km2
Dung surveys
Nam Kading Park Staff
(See Appendix 3 & 4 for two examples – Nam Kading for conservation targets and NEPL
NPA for all components)
(d) Putting in place appropriate data management and processing systems
Given that a key ‘output’ of the monitoring process is the generation of qualitative and
quantitative information, it is crucially important to ensure that this information is
appropriately collated and processed. Thus, a significant step in the monitoring process
involves the establishment of appropriate data management and processing systems.
Appendix 5 outlines MIST which is an example of a tool for managing and evaluating law
enforcement monitoring data. The use of standardized systems such as MIST is beneficial as
it can help promote best practices and also facilitate communication of results to managers,
stakeholders and donors (see next section – Closing the loop).

23
4. Closing the loop - communicating the results
The data obtained from implementing the monitoring framework needs to be analyzed and
the results communicated internally as part of the project management cycle and externally
to promote best practices.
(a) Data Analysis: There are two general kinds of analysis for using quantitative and
qualitative data:
i. Describing the data. Every analysis starts by taking the raw data and summarizing the
raw data into a manageable/more meaningful form. This process involves organizing
and characterizing observations. This is where information management tools such as
MIST are particularly useful.
ii. Testing Hypothesis about data. Following the description of the data, the next step is to
use the data to examine the success of your project’s interventions. This process
involves examining how two or more variables differ or how they are related to one
another. Sometimes, we need to measure and predict how changes in one or more
variables are associated with or lead to changes in another.
[For more information on data analysis methods, see Margoluis and Salafsky chapter 7-
Measures of Success]
(b) Communicating results to an internal and external audience
The results from data analysis need to be presented to the project staff, project partners,
other stakeholders in and around the project site, and to external audiences
The first step is to pick a format that is most appropriate for the information that you
want to communicate and the specific audience that you are trying to reach. There are
many different potential audiences who will be interested in the information being
generated by your project. Each of these audiences may require that information be
packaged in a different way. Specific types of communication tools include:

24
Oral presentations, discussion session, informal meetings, reports, press and media
releases, brochures and pamphlets, formal academic papers and books, visual
presentations.
Monitoring should be designed in a way that produces data and information that can be
used to (i) test assumptions, (ii) adapt the project according to the monitoring results and (iii)
share with an external audience lessons learned from implementing the project. It is
particularly important to get monitoring results and analysis back to managers in a timely fashion in
order to effect changes in management approaches as quickly as possible.
(i) Testing Assumptions: Assumptions are represented by the boxes and arrows that show
causal relationships between different factors affecting the target condition. For
example, in the elephant conceptual model for the Nam Kading NPA managers are
assuming that by training farmers to protect their crops from elephants, the farmers
will not use automatic weapons to kill crop-raiding elephants. This also assumes that
farmers will adopt the crop protection methods and that the methods are successful in
keeping elephants from damaging crops and injuring farmers.
Monitoring data allows you to test whether the intervention you have planned is
actually reducing the threat to the conservation target by the desired amount.
(ii) Adapt the project based on the monitoring results.
Once you have formally considered your assumptions, the second step is to use that
information to adapt and improve the project. This is done be revisiting the steps in the
project cycle repeatedly. For example, if your monitoring results show that elephant
abundance continues to decline due to killing of elephants in crop-raiding areas then
we may need to adapt our management intervention. In this case, we should assess
the crop protection methods to determine if the number of crop raiding incidents has
decreased or increased with crop protection in place. If crop raiding has declined but
killing of elephants is continuing then we may need to increase enforcement as a
management intervention to make sure that elephant killing for illegal ivory trade is
not occurring.

25
(iii) Document and share lessons learned from the project
It is important to share results, findings, successes and failures with project staff and to
document these for future reference. In documenting project outcomes, a common
mistake is to focus only on success and to ignore or hide failures. There is more to be
learned from failures than from successes and hence important to acknowledge failures.
The key to a successful project lies in learning from what you are doing whether it
works or not
In addition to helping you improve a specific project, the learning that you have
experienced can be of utility to others who are implementing similar projects, dealing
with similar threats or working in similar contexts.
While the importance of monitoring for achieving effective conservation outcomes is
widely acknowledged, the design of monitoring programs and their impacts on
conservation have been the focus of much criticism. The following is a summary of
the key issues for consideration in designing and implementing a monitoring program
for a site.
Conflicts between scientific ideals and practical realities of monitoring (Refer to
Brashares and Sam 2005)
There are conflicts between the scientific ideals and practical realities of monitoring that
influence the design, implementation and effectiveness of monitoring systems. Most
practitioners agree that in an ideal world, monitoring programs would always be spatially
and temporally comprehensive, rigorous in their treatment of sampling error, and
sustainable over the time scales necessary to examine population and community-level
processes (Yoccoz et al. 2001). However, monitoring of biodiversity and resource use in the
real word is often costly, hard to sustain, especially in developing countries where financial
and technical resources are limited. Moreover, monitoring can be logistically and
technically difficult and is often perceived to be irrelevant by resource managers and local
communities (Sheil 2001). Hence, in situations with limited funding, project managers will
find it challenging to invest in monitoring efforts and thus divert funds away from other

26
interventions such as enforcement or community development activities that are perceived
more important than monitoring. Given that monitoring is an essential step in any
conservation project, it is critical to carefully select who, what and how to monitor using the
criteria described in the following section.
Criteria for good design, implementation and management of a monitoring program
I. Why monitor?
(1) Identify flexible goals and clear objectives for monitoring
(a) Ensure objectives are responsive to management needs
(b) Ensure objectives are developed in a participatory manner with the relevant
stakeholders
(c) Clearly state the time frame for the monitoring program and the time expected to
see results
II. What should be monitored?
(1) Identify the variable(s) to be measured and ensure they meet the following criteria:
(a) Relevant to management
(b) Scientifically defensible and biologically representative
(c) Statistically powerful and interpretable
(d) Measurable and feasible
(e) Easily understood
(2) Identify your target population
(a) Define the scale at which you need to monitor and the scale at which you will
infer your results

27
III. How to monitor?
(1) Develop formal collaborations with statisticians and scientists in developing
monitoring protocols
(2) Develop monitoring methods and data collection protocols
(a) Address sampling bias in selection of sites to be monitored
(b) Address detection error in sampling design
(c) Ensure minimum sample sizes and sampling effort required to achieve objectives
(d) Ensure adequate precision of estimates to permit detection of change over time
(3) Solicit feedback and review of monitoring protocols from experts
(4) Assess and evaluate if the methods are the most cost-effective to address your
monitoring objectives
IV. Other important considerations for management and implementation
(1) Identify the person/persons responsible for implementation
(a) Ensure adequate personnel, skills and training are available for implementation
and data analysis
(2) Secure adequate funding for the duration of the monitoring program, including
design, implementation, analysis and communication of information
(3) Ensure an information management system is in place for managing and
communicating monitoring data
(4) Ensure that monitoring objectives, methods, key assumptions and data recording
protocols are carefully documented and accessible by all stakeholders

28
Literature Cited
Barrows, C.W. and M.F. Allen. 2007. Biological monitoring and bridging the gap between land management and science. Natural Areas Journal 27:194–197.
Brashares JS, Sam MK (2005) How much is enough? Estimating the minimum sampling required for effective monitoring of African reserves. Biodiversity and Conservation 14: 2709-2722.
Conservation Measures Partnership. 2007. Open standards for the practice of conservation. www.conservationmeasures.org
Ferraro PJ, Pattanayak SK (2006) Money for Nothing? A Call for Empirical Evaluation of Biodiversity Conservation Investments. PLoS Biology 4: 482-488.
Legg C, Nagy L (2006) Why most conservation monitoring is, but need not be, a waste of time. Journal of Environmental Management 78: 194-199.
Lyons JE, Runge MC, Laskowski HP, Kendall WL (2008) Monitoring in the Context of Structured Decision-Making and Adaptive Management. The Journal of Wildlife Management 72: 1683-1692.
Margolius, R. and Salafsky, N. (1998). Measures of success: designing, managing and monitoring conservation and development projects. Washington, D.C: Island Press
Nichols JD, Williams BK (2006) Monitoring for conservation. TRENDS in Ecology and Evolution 21: 668-673. Salzer D, Salfasky N (2006) Allocating resources between taking action, assessing status and measuring effectiveness. Nat Areas J 26: 310-316. Sheil, D. 2001. Conservation and biodiversity monitoring in the tropics: realities, priorities and distractions. Conservation Biology 15:1179-1182.
Wilkie, D. and the Living Landscapes Program. (2002b). Monitoring conservation project effectiveness. Bulletin 6, Wildlife Conservation Society, Living Landscapes Program, Bronx, NY.
http://wcslivinglandscapes.com/media/file/LLP_Bulletin6_Monitoring_EN.pdf
Wilkie, D. and the Living Landscapes Program. (2002a). Using conceptual models to set conservation priorities. Bulletin 5, Wildlife Conservation Society, Living Landscapes Program, Bronx, NY.
http://wcslivinglandscapes.com/media/file/LLP_Bulletin5_ConceptualModels_EN.pdf
Yoccoz NG, Boulinier JDNaT (2001) Monitoring of biological diversity in space and time. TRENDS in Ecology & Evolution 16: 446-453.

29
Appendix 1. Conceptual model for Asian Elephant in the Nam Kading NPA (Johnson, Vannalath et al. 2006)
Conceptual model of Asian Elephant (Elephas maximas)
GOALOBJECTIVEDIRECT
THREATSHOWWHOFOR WHATINTERVENTIONS
Elephant -agriculture
conflict
Maintain elephant zone / move
agriculture field
Grow alternative crop that elephant do not like to eat
Train DAFO to collect information
on human-elephant conflict
(HEC)
Education on the importance of the
elephant
Village committee and military to
inform on elephant hunters and traders
ENFORCEMENT
To get elephant out of rice crop
Buy elephant tusks
No way to protect crop from elephant
Villagers
Ivory market in Thailand and
VietnamElephant hunters
Chinese trader
Automatic gun
Elephant ceremony person
Hunting of elephant
By 2010 the Asian elephant
population in and around Nam Kading
National Protected Area
will not decrease
To conserve the globally
significant biodiversity of Bolikhamxay
Province
Study tour / Training in Nakai to see crop protection
method
INDIRECT THREATS
MODIFY LIVELIHOOD PRACTICES
Checkpoints to reduce trade
EXTENSION

30
Appendix 2: Quantitative and Qualitative methods (Margoluis and Salafsky, 1998)
Quantitative Methods: produce data that are easily represented as numbers, such as answers to formal surveys. Qualitative data generally describe formal measurements of variables like income, crop production, or animal population densities.
E.g.
Qualitative Methods: These methods produce data that is not easily summarized in numerical form, such as minutes from community meetings and general notes and observations. Qualitative data normally describe people’s knowledge, attitudes or behaviors.
E.g.

31
Table 1: Quantitative and Qualitative approaches to gathering monitoring information on conservation targets, threats and interventions- what sort of modifications?
Quantitative Qualitative Wildlife Transects
Scent and fur trap stations Camera trapping DNA capture-recapture Radio-telemetry
Ranger or tour operator sighting records Hunter assessment of prey density Opinions of park guards
Habitat Loss Vegetation transects Satellite image analysis Sample plots Km to gather fuel wood
Forester estimate of logged area Farmer estimate of field area Villager elders’ judgment
Species depletion Consumption surveys Catch per unit effort Age and body size Market surveys
Hunter card sort of species biomass Hunter or fisher catch diaries Species ranking of fish catch by fishers Market trader estimate of scarcity Customs confiscations
Pollution Transects Satellite image analysis Aerial photography Sample plots
Oilwatch web reports Complaints to the Environment Ministry
Invasive exotic species
Transects Aerial Photography Sample Plots Necropsies
Park Staff ranking Ranger log book records
Awareness raising
Attitude surveys Behavior observations Nielsen ratings
Local teachers’ perceptions Media reports Focus groups
Economic Alternatives
Household income surveys Consumption surveys Behavioral observation
Community meetings Family interviews Health worker diary
Law enforcement Court records Police reports Camera trapping
Park Staff ranking Community meetings
Training Skills tests Needs assessment Capacity Building Financial audits
Staff evaluations Peer audits Work-plan reviews Institutional ranking
Policy reform Regulatory code reviews Budget for enforcement Court cases held
Lunch with policymaker
Constituency Building
NGO contributor lists Donations
Constituent interviews

32
Component of Conceptual
Model
Landscape Species
Objective Method Indicator Who Comments
Conservation Target
TigerTo raise the population of Tiger by 20% over five years
Camera trappingPatch occupancy - area used
2 Camera trap teams
Density; # of individuals/km2 ; in the future after populations increase
Conservation Target
Southern SerowTo raise the population of Southern Serow by 50% over five years
Camera trappingPatch occupancy - area occupied
2 Camera trap teams
Conservation Target
Eurasian Wild PigTo raise the population of Eurasian Wild Pig by 100% over five years
Camera trappingPatch occupancy - area used
2 Camera trap teams
Conservation Target
White-cheeked Crested Gibbon
To raise the population of White-Cheeked Crested Gibbon by 10% over five years
Dry season forest transects
Patch occupancy - area occupied
4 Forest transect teams
Density; # of individuals/km2 ; in the future after populations increase
Conservation Target
Great HornbillTo raise the population of Great Hornbill by 35% over five years
Dry season forest transects
Patch occupancy - area used
4 Forest transect teams
Density; # of individuals/km2 ; in the future after populations increase
Conservation Target
Asian ElephantTo have no decline in the population of Asian Elephant over five years
Fecal DNA capture-recapture
Density; # of individuals/km2
To be determined
To be initiated in 2009
Appendix 3. Monitoring Framework for Conservation Targets in the Nam Kading National Protected Area (Strindberg, Johnson, et al., 2007)

33
Tiger Monitoring Framework (NEPL NPA 2007) Component of Conceptual Model
Description of Component of Conceptual Model
Objective Method Indicator Who
Conservation Target
Tiger To raise the population of Tigers by 50% by 2015.
Camera trap monitoring
Number of tigers/100 sq km
NPA biological monitoring team
Direct Threat Explosive traps and snares to catch tigers
Eliminate the use of bombs and snares in the NPA core zone
Foot patrols record detection of traps and snares in core zone
Number of bombs and snares encountered per unit effort
Substation patrol team
Indirect Threat
The understanding of the village about rules and regulations is low.
80% of the population of the villages around the core zone (36 villages) will obtain a 70% understanding of the rules and regulations
Pre and post testing, anecdotal observation,
The percentage of people that understand the information presented in various methods.
Outreach team and students.
Intervention Increase the effectiveness of the patrol substations
Every officer in the substation will patrol 24 days/month
Record and follow up the daily work in MIST monitoring forms
Number of days patrolled per officer
Patrol team leader
Intervention Demarcate the core zone and NPA
By end of 2008 the Phou Louey Core Zone will be entirely demarcated with signs every 2km
Record and map location of signs
Number of signs placed around the core zone
Patrolling team, and local people
Appendix 4. Monitoring Framework for Conservation Target, Direct and Indirect Threats and Interventions in the Nam Et-Phou Louey National Protected Area (NEPL NPA, 2007)

Appendix 5: Example MIST enforcement data collection form
34
Road Block, Restaurant, and Market Form
Date Location Patrol Types UTM-E
Team ID. Team Leader Reporter UTM-N
Run No
Time Observation Obs Type Total Random/
suspect check Vehicles No/
Village names Comments
1 7:30 Position Start
2 8:30 Check Motorbike 1 Random ¹ö¸²ñ ¡£ 2233
3 8:30 Trade Wildlife 1 Random ͸¤²½®¾¤ ¡¢ 0001 See Obs form
4 10:15 Trade NTFP 1 Random ¹ö¸²ñ ¡¡ 4400 See Obs form
5 11:45 Position Rest
6 12:15 Position Re-start
7 15:00 Check Truck 1 Random ¡¿Á²¤ ££ 8877
8 15:38 Trade Logging 1 Random ¹ö¸²ñ ¢£ 0123 See Obs form
9 16:09 Check People B. Sakok
10 17:00 Position End
OBSERVATIONS: Human activity: Trade
Position: (1). Position and (2). Check
OBSERVATION TYPES:
TYPE found: Wildlife, Wood, and NTFP
Position Types: (1). Start, Rest, Re-start, End and (2). People, Motorbike, Car, Truck
B. Donkoun 20 Nov 2007
55555555
Road block 222222222
VKMB Vongxay Vongxay

1
Module 6
Monitoring for Management
Exercises
Kelly Spence Arlyne Johnson
Madhu Rao

2
Table of Contents
EXERCISE 1: MONITORING ..................................................................................................................... 3
PART A....................................................................................................................................................... 3 PART B – ADAPTIVE MANAGEMENT (15 MINS)........................................................................................... 4
EXERCISE 2: STARTING TO DEVELOP A MONITORING PLAN........................................................ 5
EXERCISE 3: DEVELOPING A MONITORING PLAN ........................................................................... 7
PART A: WHAT TO MONITOR (10MINS)....................................................................................................... 7 PART B: ...................................................................................................................................................... 8
EXERCISE 4 – INTERVENTIONS AND MONITORING-CASE EXAMPLE ......................................... 9
PART A: MONITORING FRAMEWORK (30MINS)......................................................................................... 12
EXERCISE 5: DEVELOPING A MONITORING FRAMEWORK.......................................................... 15
PART A: MONITORING OBJECTIVE............................................................................................................ 15 PART B: INDICATOR ................................................................................................................................. 16 PART C: MONITORING METHOD............................................................................................................... 17
EXERCISE 6: DEVELOPING A MONITORING FRAMEWORK FOR YOUR PROTECTED AREA. 18
EXERCISE 7: IDENTIFYING SOURCES OF FUNDING...................................................................... 19
Introduction: Monitoring is one method used by managers to determine whether they have achieved the goals and objectives that have been set for a project. In terms of Protected Areas, PA managers want to assess if they are being effective in managing these areas. The following exercises have been devised to help managers think about how best to monitor activities that are implemented in their protected area.

3
Exercise 1: Monitoring
Part A Learning objectives:
· To understand an artificial system and what needs to be monitored · To develop a method for recording the monitoring activity · Overall, to understand the importance of management and effective monitoring
within a protected area Equipment:
· Clear cylinder with 5mm measured marks on it. · 2mm holes with plugs to fit (use toothpicks). · Soup spoon and bowl of water · Paper to record results · Stopwatch · A4 paper for developing data collection sheet
NB: This exercise has to completed outdoors Time: (30 mins) Set up a cylinder with 20 pre-drilled holes in it (holes should be small approx 2 mm round). The cylinder should be clear and with pre-measured marks on it. Each of the 20 holes should be given a number. The holes can be plugged with toothpicks Fill cylinder with water. See photo/diagram below. The activity should continue for 5 minutes The cylinder represents the Protected Area. The water represents the muntjacs in the PA. As a manager you need to manage and monitor the water/resources in the cylinder. People needed:
1. Manager + Assistant Manger – Monitor 2. Hunters (2pple) – remove plugs 3. Enforcement – plug holes 4. Muntjac – replace water (i.e. natural Muntjac population growth)
Instructions to Manager and Assistant: You must record the water reading every 10 seconds and where there is Muntjacs being harvested. Record these results.
Instructions to Hunters: First time each hunter removes half the plugs. Plugs will be replaced by Enforcement officer. After the plugs are replaced you may remove 1 plug every 15 seconds. After 3 minutes an informant leads to 1 hunter’s arrest.
Instructions to Enforcement officer: Do not do anything – you are on holiday! After 2 minutes you may return to work and plug up the holes.
Instructions to Muntjac: You will replenish the resources by using a spoon to transfer water into the cylinder. 1 spoonful every 30 seconds
Well managed
PA needing management
Critical management needed
1 2
3
4 5

4
1. First the team is to develop a monitoring sheet that displays the following information
· Water/Muntjac level measured over time · Where is the leakage/hunting taking place · Who is responsible for the Muntjac depletion · Other information
2. Manager is to monitor the following:
· Record details on the monitoring sheet developed · What is the lowest the resources were recorded at? · What is the highest that the resources were recorded at?
Part B – Adaptive Management (15 mins) In an adaptive management setting, monitoring provides the feedback loop for learning about the protected area Learning objectives: Understanding the role of monitoring to help PA managers learn from the experience of implementing the chosen project interventions and to modify project interventions accordingly – Adaptive management Equipment: Use of experiment above In the activity above we observed and recorded information about what was happening in an artificial system. As managers, recording information is the basis of a monitoring plan. In the following exercise managers need to think about what are some management methods that could be made to the above system which could result in change? E.G. [After 3 minutes an informant leads to your arrest.] Building up an informant network that helps to reduce the hunting threats 1.___________________________________________________________________
2.___________________________________________________________________
3.___________________________________________________________________
4.___________________________________________________________________

5
Exercise 2: Starting to develop a monitoring plan Learning objectives: To ensure that PA managers understand the process of conservation planning for protected areas, in particular, conservation targets, conservation target, etc. Equipment: Conceptual models (a) List the conservation targets of your protected area (2mins)
1. _______________________________________________ 2. _______________________________________________ 3. _______________________________________________
(b) List all the direct threats to the conservation target of your protected area (add
more spaces if needed) (5mins) 1. _______________________________________________
2. _______________________________________________
3. _______________________________________________
4. _______________________________________________
5. _______________________________________________
(c) List all common indirect threats to the conservation target of your protected area
(add more spaces if needed) (10mins) 1. _______________________________________________
2. _______________________________________________
3. _______________________________________________
4. _______________________________________________
5. _______________________________________________
6. _______________________________________________
7. _______________________________________________
8. _______________________________________________
(d) List all common interventions identified for your 3 conservation target (5mins) 1. __________________________________________________________________
2. __________________________________________________________________
3. __________________________________________________________________
4. __________________________________________________________________
5. __________________________________________________________________
6. __________________________________________________________________
7. __________________________________________________________________
8. __________________________________________________________________
9. __________________________________________________________________
10. __________________________________________________________________

6
(e) List specific interventions related to each conservation target (5mins)
(f) With a limited budget prioritize the interventions giving a score in the box provided. For example, give the number 1 for the highest priority, the number 2 for the second highest priority and so on. (10mins)
(g) Select one of your conservation target from your conceptual models and develop a
casual linkage as in the example below (20mins). If you finish, continue to develop a casual linkage for the other two conservation targets
Conservation target 1 1.______________________
2.______________________
3.______________________
4.______________________
5.______________________
Conservation target 2 1.______________________
2.______________________
3.______________________
4.______________________
5.______________________
Conservation target 3 1.______________________
2.______________________
3.______________________
4.______________________
5.______________________

7
Exercise 3: Developing a Monitoring Plan Learning objectives: To develop skills and understanding of the importance of planning in the design of a monitoring system
Part A: What to monitor (10mins) Scientists and managers of natural areas need to work together to design and implement effective monitoring programs. Managers need to ask scientists to provide:
i) clear directions as to what they want measured and how, which is also defined as monitoring metrics.
ii) the level of change expected in a given period of time to define the management objectives, and
iii) how to prioritize management tasks in order to have the largest positive impact on the viability of the conservation targets they are managing (Barrows and Allen 2007).
In general, we can determine what monitoring information we need based on the goal and objectives of each project. Here are some examples from our projects in Laos: As conservation of tigers and their prey is the goal for the NEPL NPA and the reduction of threats are the objectives to reach this goal, our donors and WCS want know the following (see attached Tigers Forever report on our monitoring results as an example): · What is the change in abundance of tigers over time? · What is the change in abundance of prey over time? · What is the change in abundance and distribution of threats (e.g. claw traps, explosive
traps, wire snares, gun shots, illegal access into the TPZ, shifting cultivation, etc) relative to enforcement effort over time (i.e. variable = catch per unit effort)?
Using examples from the Nakai-Nam Theun NPA: · The wildlife monitoring program there is looking at change in abundance and distribution
of selected felids, ungulates, primates and hornbills as a result of enforcement using camera trapping and line transects.
· The principle threat to these species in NNT is illegal hunting and trade. Enforcement monitoring using MIST is now being put into place in the NPA to monitor similar variables as those in NEPL (see above).
· For the Elephant Project, we monitor change in abundance and distribution of human-elephant conflict in response to training and providing equipment for farmers to protect crops from elephants.
(For more details see reports from our wildlife monitoring project in NNT, and our Nakai Elephant Project reports).
1. What is currently monitored in your protected area? Draw a table with information describing what is monitored, why and how. Add more spaces if needed. What is being monitored Why How

8
Part B: Using the casual linkages in Exercise 2 developed for the three conservation targets in your protected area above fill in the following tables. 2. Measuring conservation targets (impact monitoring) (5 mins). Conservation Target Write an example that involves the tracking of changes in the status of all 3 of your conservation target species e.g. Elephant Measure the change in status of elephant populations in
Nam Kading NPA 1.
2.
3.
3. Measuring changes in the levels of threats (outcome monitoring) (5mins). Threat Write down one example for each of the conservation target species that measures the change in the status of the threat e.g. Elephant Measure the rate of Human/Elephant conflict e.g. crop
loss, injury to humans/elephants over time 1.
2.
3.
4. Measuring the implementation of interventions (performance monitoring) (5 mins). Intervention Write down one intervention for each conservation target that could be monitored e.g. Elephant Set up crop protection system with farmers 1.
2.
3.

9
Exercise 4 – Interventions and Monitoring-Case Example Learning objectives: This is a case example for the Irrawaddy Dolphin (Orcaella brevirostris). This exercise is structured to help look at monitoring based on the described interventions developed for this species. Please read the information carefully and then proceed to question 1 about monitoring. Table 1 outlines some approaches that may help decide on appropriate monitoring methods for the interventions. Summary and Background (Smith et. al, 2007) Irrawaddy dolphins inhabiting the Mekong River were Red Listed as ‘critically endangered’ by the World Conservation Union (IUCN) in 2004. Preliminary mark-recapture estimates indicate that the population numbers a minimum of 127 individuals (CV = 0.07; 95% CI = 108 – 146). The range of the population has declined substantially and is now primarily restricted to nine deep water areas in a 190-linear km river segment between Kratie and Khone Falls just upstream of the Lao PDR/Cambodia border. Khone Falls physically obstructs further upstream movement. Based on interview surveys conducted by Baird and Mounsouphom (1994) dolphins are believed to have been once fairly common in the Sekong River and its tributaries as far upstream as the Kalaum District (approximately 950 km upstream of the river mouth in Vietnam). Between January 2001 and June 2005, 48 dead dolphins were documented, 50% adults/juveniles and 50% calves. Anthropogenic factors were implicated in the deaths of 15 adult dolphins (62.5%). Of these, 13 were due to entanglement in fishing gears described as “large mesh gillnets” (6-14 cm mesh size recorded in four cases), one was reported to have been shot, and one was deliberately killed with explosives over concerns about access to fishing rights. Between July 2005 and March 2006 an additional 18 dolphin carcasses were recovered, including two adults, one juvenile and 16 calves. The large number of recent calf mortalities is worrisome and may indicate a problem with environmental contaminants. Analyses of mercury as a possible threat indicated that levels were not high. Other potential threats that warrant further investigation are illegal dynamite and electric fishing, water pollution, and noise, collisions and harassment from dolphin watching and high-speed transport vessels. Gold mining operations along Mekong tributaries are a potential source of mercury (Hg), which could have toxic effects on dolphins. Ten liver samples from three adults and seven calves that died between September 2002 and November 2004 were analyzed by Environment Canada (Burlington, Ontario) for mercury concentrations. With the exception of one dolphin, all samples were found to contain mercury concentrations in the range 0.9-3.7 µg/g (wet weight). One adult female was found to have a considerably higher concentration of liver mercury (67 µg/g). As expected liver mercury residues were consistently higher in adults compared to calves due to the bio-accumulative properties of the trace metal. Blubber mercury concentrations were obtained for seven adult dolphins including the three animals for which liver mercury concentrations were available. At present, given the low concentrations and absence of associated pathology, there is no evidence to suggest that Irrawaddy dolphins in the Mekong River are suffering from the toxic effects of mercury. Further analyses of blubber samples for polychlorinated biphenyls (PCBs) and fluorinated organic compounds will be

10
conducted by Environment Canada and the Canadian National Laboratory for Environmental Testing. Additional human activities that could currently be threatening Irrawaddy dolphins in the Mekong River include illegal fisheries (e.g. electric or dynamite fishing) and collisions with motorized boats. However, at present there is no evidence to implicate any of these activities in dolphin deaths. Threats that have the potential to cause problems in the future include (1) resumption of the use of dolphin body parts for traditional medicine that was previously common in Cambodia; (2) habitat degradation from factors such as deforestation, which leads to increased sedimentation; (3) over-fishing which could affect the availability of dolphin prey; and (4) dam construction which could detrimentally affect ecosystem functioning and fragment populations.

11

12
Table 1: Quantitative and Qualitative approaches to gathering monitoring information on conservation targets, threats and interventions. Quantitative Qualitative Wildlife Transects
Scent and fur trap stations Camera trapping DNA capture-recapture Radio-telemetry
Ranger or tour operator sighting records Hunter assessment of prey density Opinions of park guards
Habitat Loss Vegetation transects Satellite image analysis Sample plots Km to gather fuelwood
Forester estimate of logged area Farmer estimate of field area Villager elders’ judgment
Species depletion
Consumption surveys Catch per unit effort Age and body size Market surveys
Hunter card sort of species biomass Hunter or fisher catch diaries Species ranking of fish catch by fishers Market trader estimate of scarcity Customs confiscations
Pollution Transects Satellite image analysis Aerial photography Sample plots
Oilwatch web reports Complaints to the Environment Ministry
Invasive exotic species
Transects Aerial Photography Sample Plots Necropsies
Park Staff ranking Ranger log book records
Awareness raising
Attitude surveys Behavior observations Nielsen ratings
Local teachers’ perceptions Media reports Focus groups
Economic Alternatives
Household income surveys Consumption surveys Behavioral observation
Community meetings Family interviews Health worker diary
Law enforcement
Court records Police reports Camera trapping
Park Staff ranking Community meetings
Training Skills tests Needs assessment Capacity Building
Financial audits Staff evaluations
Peer audits Work-plan reviews Institutional ranking
Policy reform Regulatory code reviews Budget for enforcement Court cases held
Lunch with policymaker
Constituency Building
NGO contributor lists Donations
Constituent interviews
Part A: Monitoring Framework (30mins) We need to measure the impact of the interventions and whether the interventions are meeting our objectives, and ultimately our goal. Table2 is an incomplete management framework. Using the information given about the dolphin, the conceptual model, and table 1, please complete this monitoring framework.

13
Table 2: Management Framework for Irrawaddy Dolphin (Orcaella brevirostris). (30mins) Component Type
Component Description Objective Method Indicator Who
Conservation target
Irrawaddy Dolphin
By 2015 Irrawaddy Dolphin population inhabiting Mekong River will increase by 30%
Boat-based surveys Photo-ID Telemetry Reports of sightings (interviews) Reports of sightings (public) GIS mapping of habitats Biological surveys
Area occupancy Area occurrence Number of individuals found in the area Number of surveys conducted
Fisheries staff Villagers
Direct threat Accidental entanglement in gillnets
Stop all fishing activities in dolphin critical habitats by 2012
Direct threat
Illegal fishing Reduce illegal fishing and prohibit the use of explosive and electric fishing by 80% by 2010
Indirect threat
Tourism Restrict all tourists to access in certain areas allocated by 2010
Indirect threat
Inadequate capacity of Fisheries offices to manage the problems
Increase aquatic resource conservation management and implementation

14
capacity of all fisheries staff by 100% by 2012
Intervention
Include dolphins in EIA for any river development project
By 2012 reduce potential impacts on dolphin population and its habitat caused by river development projects by 100%
Intervention
Speed restrictions in critical dolphin habitats
Reduce noise pollution and eradicate boat collisions in all dolphin significant habitats by 2015
Smith, B.D., Shore, R.G, Lopez A. (2007). Status and Conservation of Freshwater Populations of Irrawaddy Dolphins. WCS Working Papers No. 31.

15
Exercise 5: Developing a Monitoring framework Learning objectives: Defining clear goals and monitoring objectives for targets, threats and interventions. For every element of the conceptual model (conservation target, threats and interventions), you need to identify the following:
1. A quantitative objective that will be achieved within a given time-frame 2. For conservation targets, a monitoring objective will describe the status
(increase, decrease or maintain at same level) of the wildlife species or habitat that will be attained over a fixed time-period.
3. For threats, a monitoring objective will specify by how much the threat will be reduced over a certain time-period.
4. For conservation interventions, a monitoring objective will relate to whether a planned intervention was implemented over a certain time period.
See examples from Lao PDR.
· # of tigers per 100 sq km (NEPL) · # of prey per sq km (NEPL; this is an index of abundance not actual
abundance). · # of gun shots heard per km patrolled per month (NEPL, NK) · # of crop raiding incidents per month per village (NNT) · # of crop raiding incidents successfully repeled by farmers per month relative
to the number of crop guarding days per village (NNT) · # farmers trained in crop protection methods (NNT) · Proportion of the protected area where large hornbills are present (NK). · Proportion of the protected area where gibbons are present (NK) · # of tiger prey species confiscated per days of patrol effort per month by
Vientiane Capital City enforcement teams (VTE wildlife trade project).
Part A: Monitoring Objective Here is an example of a Monitoring framework Conceptual Model Component
Monitoring Objective
Indicator Monitoring Method
Conservation Target:
Threats:
Conservation Intervention:
We will start to fill this box in one section at a time. Each box will be preceded with an example. Please fill in the blank box below. (10mins) Conceptual Model Component
Monitoring Objective
Conservation Target: Muntjac population Threats: To reduce hunting by 20% in PA Conservation Intervention: Outreach on gun regulations will all villages in and
outside (5km radius) PA

16
Conceptual Model Component
Monitoring Objective
Conservation Target:
Threats:
Conservation Intervention:
Part B: Indicator Measurable – qualitative or quantitative Precisely defined – with multiple individuals collecting information precision is important Consistent over time – If an indicator is expected to provide a reliable measurement of change in a factor, then it is important that observed effects be due to changes in the actual condition, not to changes in the indicator. Sensitive - A sensitive indicator will change proportionately and in the same direction as changes in the condition or item being measured. Example: Indicator (10mins) Conceptual Model Component
Monitoring Objective
Indicator
Conservation Target: Muntjac population Number of Muntjac per km2 Threats: To reduce hunting by
20% in PA Number of people caught hunting in PA, % of snares collected
Conservation Intervention:
Outreach on gun regulations will all villages in and outside (5km radius) PA
% of increased awareness of huniting regulations from Pre and Post testing questionnaire
PA manager to fill in: Conceptual Model Component
Monitoring Objective
Indicator
Conservation Target:
Threats:
Conservation Intervention:

17
Part C: Monitoring Method Example: Monitoring Method (10mins) Conceptual Model Component
Monitoring Objective
Indicator Monitoring Method
Conservation Target:
Muntjac population
Number of Muntjac per km2
Camera trap (?)
Threats: To reduce hunting by 20% in PA
Number of people caught hunting in PA, % of snares collected
Foot patrol and detection of snares in PA
Conservation Intervention:
Outreach on gun regulations will all villages in and outside (5km radius) PA
% of increased awareness of hunting regulations from Pre and Post testing questionnaire
Pre/Post testing
PA manager to fill in: Conceptual Model Component
Monitoring Objective
Indicator Monitoring Method
Conservation Target:
Threats:
Conservation Intervention:

18
Exercise 6: Developing a monitoring framework for your Protected Area Using one of the conceptual model species from your PA, start to develop a monitoring framework for the conservation target (30mins) Component Type
Component Description
Monitoring Objective Indicator Monitoring Method
Who
Conservation target
Elephant populations
Maintain the current population of elephants
Elephant density per km2
Dung surveys Nam Kading Park Staff
Tiger Monitoring Framework (NEPL NPA 2007)
Component of Conceptual Model
Description of Component of Conceptual Model
Objective Method Indicator Who
Conservation Target
Tiger To raise the population of Tigers by 50% by 2015.
Camera trap monitoring
Number of tigers/100 sq km
NPA biological monitoring team
Direct Threat Explosive traps and snares to catch tigers
Eliminate the use of bombs and snares in the NPA core zone
Foot patrols record detection of traps and snares in core zone
Number of bombs and snares encountered per unit effort
Substation patrol team
Indirect Threat
The understanding of the village about rules and regulations is low.
80% of the population of the villages around the core zone (36 villages) will obtain a 70% understanding of the rules and regulations
Pre and post testing, anecdotal observation,
The percentage of people that understand the information presented in various methods.
Outreach team and students.
Intervention Increase the effectiveness of the patrol substations
Every officer in the substation will patrol 24 days/month
Record and follow up the daily work in MIST monitoring forms
Number of days patrolled per officer
Patrol team leader
Intervention Demarcate the core zone and NPA
By end of 2008 the Phou Louey Core Zone will be entirely demarcated with signs every 2km
Record and map location of signs
Number of signs placed around the core zone
Patrolling team, and local people

19
Exercise 7: Identifying sources of funding Time: 20mins This is a brainstorming exercise. Protected Area Managers are not only faced with the many direct and indirect threats to protected areas, but also how they will finance the interventions that will reduce these threats. Below managers should brainstorm known sources of funding. Some examples are given for you
Sources of Funding
Equipment grants: http://www.ideawild.org/apply.html
IUCN, WWF, VFI – projects PAs are working with
UNDP Small Grants
Government and Forestry Development Fund

Component Type
Component Description Objective Method Indicator Who
Conservation target
Irrawaddy Dolphin
By 2015 Irrawaddy Dolphin population inhabiting Mekong River will increase by 30%
Boat-based surveys Photo-ID Telemetry Reports of sightings (interviews) Reports of sightings (public) GIS mapping of habitats Biological surveys
Area occupancy Area occurrence Number of individuals found in the area Number of surveys conducted
Fisheries staff Villagers
Direct threat Accidental entanglement in gillnets
Stop all fishing activities in dolphin critical habitats by 2012
Patrol Visual observation Reports of sightings (interview, public)
Number of gillnets found in the sites Number of patrols conducted Number of dolphins found in gillnets per year compared to baseline numbers
Fisheries staff Patrolling teams Villagers
Direct threat
Illegal fishing Reduce illegal fishing and prohibit the use of explosive and electric fishing by 80% by 2010
Boat-based surveys Patrols
Number of patrols conducted Number of illegal fishing activities
Patrolling teams Diary records from patrolling staff
Indirect threat
Tourism Restrict all tourists to access in certain areas allocated by 2010
Construct “restricted area” signposts at all critical dolphin habitat sites Erect dolphin conservation signs and/or allocate posters near the sites Provide brochures about Irrawaddy dolphin for all tourists Reports from patrolling teams and villagers Tourist interview Attitude surveys
Number of tourists found in restricted areas
Dolphin conservation teams Patrolling teams Villagers
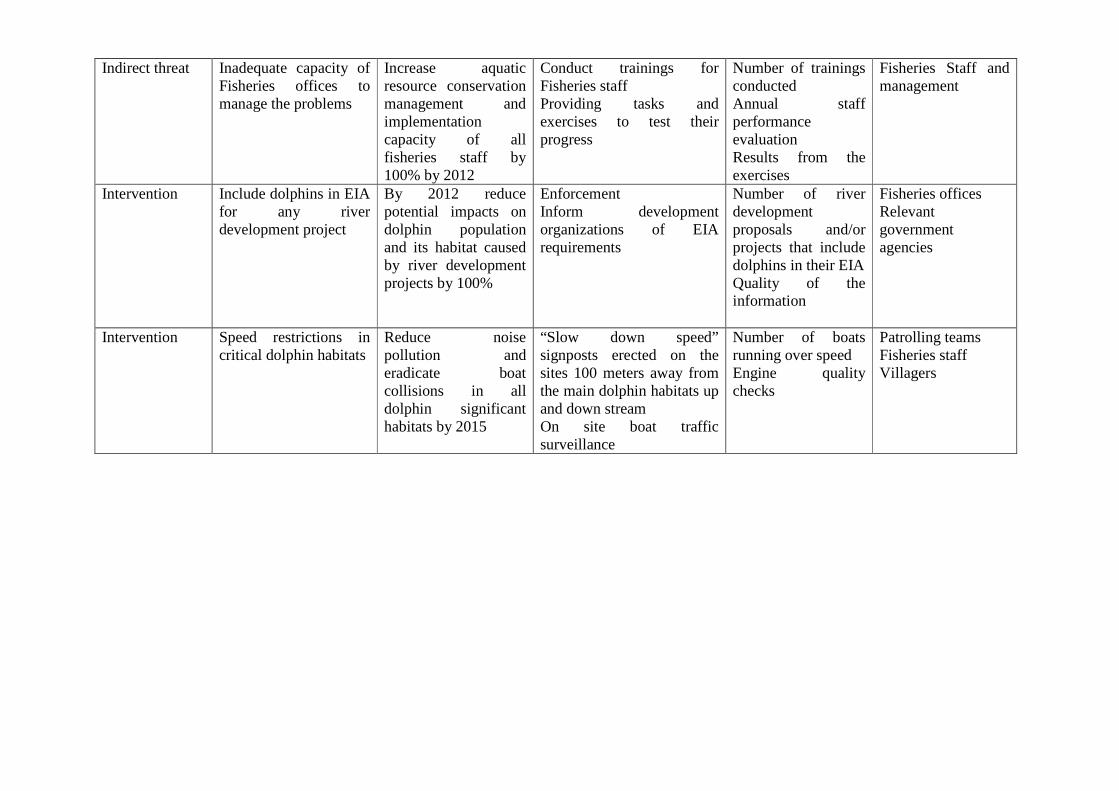
Indirect threat
Inadequate capacity of Fisheries offices to manage the problems
Increase aquatic resource conservation management and implementation capacity of all fisheries staff by 100% by 2012
Conduct trainings for Fisheries staff Providing tasks and exercises to test their progress
Number of trainings conducted Annual staff performance evaluation Results from the exercises
Fisheries Staff and management
Intervention
Include dolphins in EIA for any river development project
By 2012 reduce potential impacts on dolphin population and its habitat caused by river development projects by 100%
Enforcement Inform development organizations of EIA requirements
Number of river development proposals and/or projects that include dolphins in their EIA Quality of the information
Fisheries offices Relevant government agencies
Intervention
Speed restrictions in critical dolphin habitats
Reduce noise pollution and eradicate boat collisions in all dolphin significant habitats by 2015
“Slow down speed” signposts erected on the sites 100 meters away from the main dolphin habitats up and down stream On site boat traffic surveillance
Number of boats running over speed Engine quality checks
Patrolling teams Fisheries staff Villagers

11
Monitoring for Management: Monitoring for Management: An overviewAn overview
Madhu Rao, Emma Stokes, Arlyne Madhu Rao, Emma Stokes, Arlyne Johnson, Kelly SpenceJohnson, Kelly Spence

22
Outline
1.1. The role of monitoring in the project The role of monitoring in the project management cyclemanagement cycle
2.2. What to monitor?What to monitor?3.3. Developing a monitoring frameworkDeveloping a monitoring framework4.4. Closing the loop Closing the loop –– communicating the communicating the
resultsresults

33
Definition of MonitoringDefinition of Monitoring
The process of gathering information about variables (e.g. rate of loss of forest cover) within a system of interest (e.g. a Protected Area).
The information is used to characterize the status of the system (i.e. the protected area) at different points in time.

44
Example of MonitoringExample of Monitoring
Variable: Level of the fuelVariable: Level of the fuelSystem: Car or motorcycleSystem: Car or motorcycle

55
Why Monitor? Why Monitor?
ACTION: Increase patrollingalong the border of the PA
State of the system (What is the level of illegal hunting in a protected area?)
1. Monitoring helps managers in decision-making
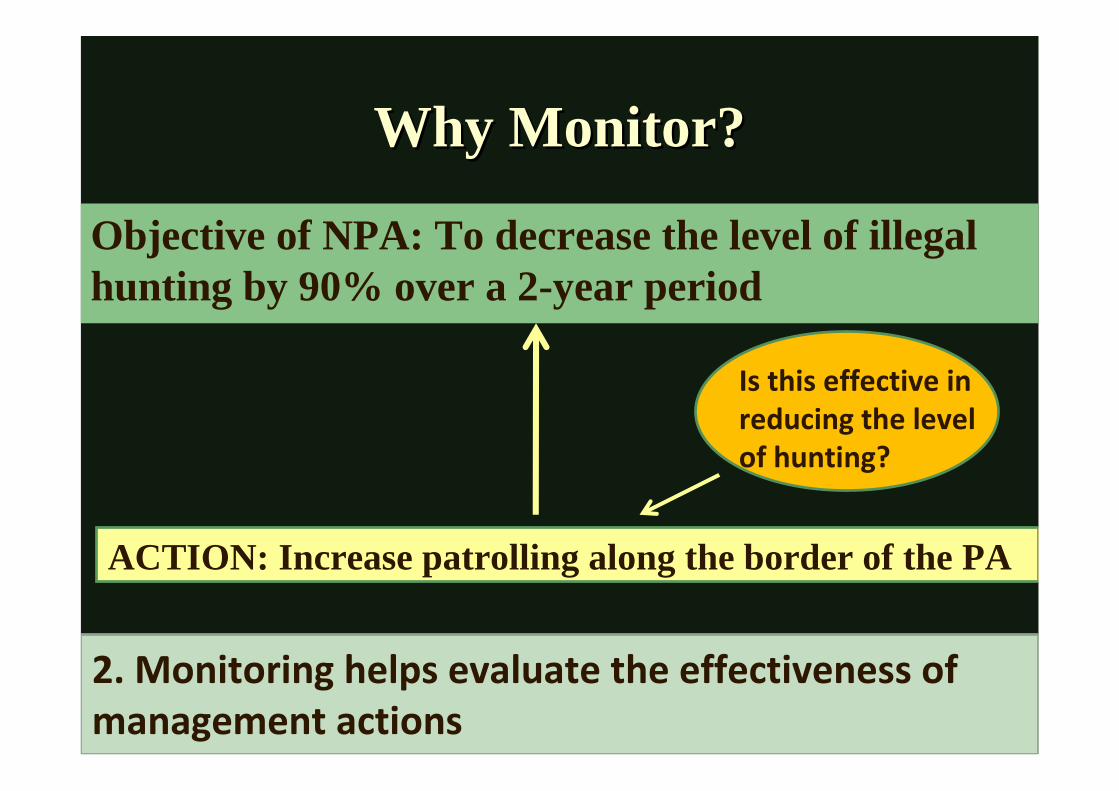
66
Why Monitor?Why Monitor?
Objective of NPA: To decrease the level of illegal hunting by 90% over a 2-year period
ACTION: Increase patrolling along the border of the PA
Is this effective in reducing the level of hunting?
2. Monitoring helps evaluate the effectiveness of management actions

77
Why Monitor?Why Monitor?
MONITORING
3. Monitoring provides the feedback loop for learning about the system (For Adaptive Management)

88
Monitoring ObjectivesMonitoring Objectives
nn Scientific ObjectivesScientific Objectivesnn Management ObjectivesManagement Objectives
Any type of additional information about the PA will be useful for monitoringAny type of additional information about the PA will be useful for monitoring

99
Monitoring : Scientific ObjectivesMonitoring : Scientific Objectives
(1) Monitoring with manipulation of the system
ExampleMonitoring the regeneration of a Palm in response to 3 different (low, medium, high) levels of harvest
(To determine the level of sustainable harvest i.e. how much can be harvested to ensure that regeneration replaces harvest?)

1010
Monitoring: Scientific ObjectivesMonitoring: Scientific Objectives
(2) Use Monitoring data in retrospective analysesE.g: Monitoring data from a yearly census of an endangered primate species over a 6-year period
(To determine the status of the primate population over time- is it decreasing, increasing or remaining stable?)

1111
Monitoring : Management ObjectivesMonitoring : Management Objectives
ACTION: Reduce illegal hunting of muntjacs for trade through patrolling
ACTION: Reduce illegal hunting of muntjacs for trade through patrolling
State of the system (What is the size of the muntjac population harvested for
subsistence food by local people?)
State of the system (What is the size of the muntjac population harvested for
subsistence food by local people?)
1. Monitoring helps managers in decision-making

1212
Monitoring : Management ObjectivesMonitoring : Management Objectives
Size of the Muntjac Population
Action 1: Guards conduct 25 days of foot patrols per month covering 40% of the PA
Action 2: Establish 6 guard posts at trailheads along the border of the core zone
Pop. Size IncreasePop. Size DecreasePop. Size stableMONITORING
MONITORING

1313
ManagersManagers ScientistsScientists
Management objectivesIs it reasonable to expect a 50% increase in the population of tigers over a 10-year period?

1414
ScienceScience------MonitoringMonitoring------ManagementManagement
Statistically defensible Statistically defensible for managers for managers
MONITORING
SCIENTIFIC PRINCIPLES
UsefulUseful

1515
Monitoring in the Project Management Monitoring in the Project Management CycleCycle

1616
Stage 1 Stage 1 -- Define the project site and set Define the project site and set the goal.the goal.
Define the context
What do we want to achieve, where…

1717
Stage 2 Stage 2 -- Design Approach and Rank ThreatsDesign Approach and Rank Threats
Design Approach and Measures of
Success
i) Conceptual modeling
ii) Ranking Threats

1818
Stage 2: Develop a Conceptual ModelStage 2: Develop a Conceptual Model
Goal
Conservation Target
Conservation Target
Threat (Direct)
Threat (Direct)
Threat (Direct)
Threat (Direct)
Threat (Indirect)
Threat (Indirect)
Threat (Indirect)
Intervention
Intervention
Intervention
Intervention

1919
Stage 3 Stage 3 -- Implement actions and measure Implement actions and measure effectivenesseffectiveness
Implement Actions and Measure Effectiveness
-Prioritizing implementation actions
- Monitor

2020
Stage 3 Stage 3 -- Implement actions and measure Implement actions and measure effectivenesseffectiveness
This next stage is divided into 2 parts:This next stage is divided into 2 parts:
1.1. Prioritize Conservation activities / Prioritize Conservation activities / InterventionsInterventions
2.2. Developing monitoring frameworks to Developing monitoring frameworks to determine if actions are successfuldetermine if actions are successful
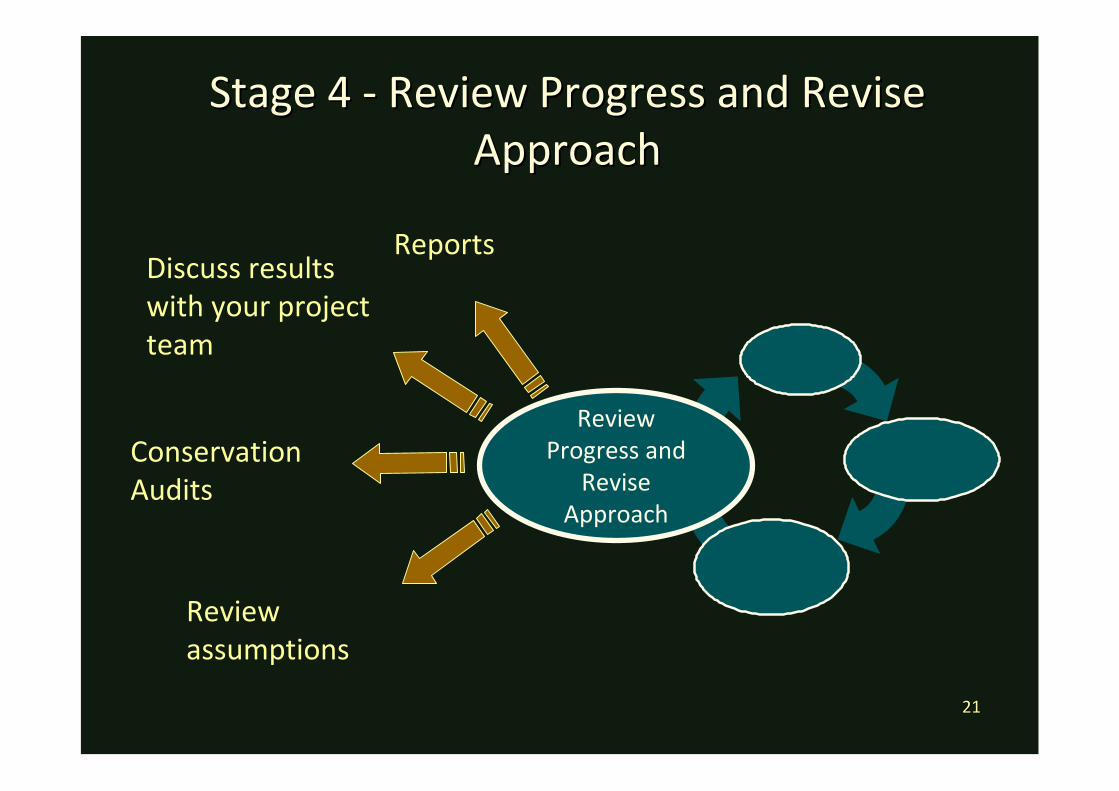
2121
Stage 4 Stage 4 -- Review Progress and Revise Review Progress and Revise ApproachApproach
Review Progress and
Revise Approach
Review assumptions
Discuss results with your project team
Conservation Audits
Reports

2222
Stage 2: Develop a Conceptual ModelStage 2: Develop a Conceptual Model
Goal
Conservation Target
Conservation Target
Threat (Direct)
Threat (Direct)
Threat (Direct)
Threat (Direct)
Threat (Indirect)
Threat (Indirect)
Threat (Indirect)
Intervention
Intervention
Intervention
Intervention

2323
Monitoring: Evaluates the causal linkages Monitoring: Evaluates the causal linkages between interventions, threats and between interventions, threats and
conservation targetsconservation targets
?
?
? ?
Does the establishment of crop protection systems and land use zoning reduce the threat of human-elephant conflict and killing of elephants and thus help maintain the elephant population within and around Nam Kading NPA?

2424
Monitoring is ImportantMonitoring is Important
1. It allows us to assess the status of threats 1. It allows us to assess the status of threats and conservation targetsand conservation targets
In the Nam In the Nam KadingKading NPA NPA
Conservation Target =Conservation Target =
Monitor:Monitor:
Maintaining elephant Maintaining elephant populationpopulation
Status of hunting (as a threat to elephant Status of hunting (as a threat to elephant population); elephant population sizepopulation); elephant population size

2525
Monitoring is ImportantMonitoring is Important
2. It helps us evaluate the effectiveness of management 2. It helps us evaluate the effectiveness of management interventionsinterventions
In Nam In Nam KadingKading::
Intervention 1Intervention 1: Training crop protection methods to farmers: Training crop protection methods to farmers
Intervention 2Intervention 2: Enforcing land use zoning to prevent expansion : Enforcing land use zoning to prevent expansion of agricultural fields into elephant habitatof agricultural fields into elephant habitat
Threat: HumanThreat: Human--elephant conflictelephant conflict
Are interventions effective in reducing humanAre interventions effective in reducing human--elephant conflict?elephant conflict?Is one intervention more effective than the other? Is one intervention more effective than the other?

2626
Monitoring is ImportantMonitoring is Important
3. It informs and improves management practice 3. It informs and improves management practice through an adaptive management processthrough an adaptive management process
For Example: For Example: Nam Nam KadingKading NPANPA-- [Monitoring] [Monitoring] -- further decline in further decline in the population density of elephants due to the population density of elephants due to increased levels of hunting where elephant cropincreased levels of hunting where elephant crop--raiding is occurring. raiding is occurring.
Need to review the threat of hunting and the interventionsNeed to review the threat of hunting and the interventions

2727
Monitoring provides information for decision-making
MonitoringMonitoring Improved Improved Management Management
Do the data indicate that the conservation interventions are being implemented well?
Are threats being reduced?
Is the status of conservation targets improving?

2828
What to Monitor?What to Monitor?
Monitor at all 3 levels across the causal chain:Conservation targets, threats and interventions
n Measuring conservation targets(Impact monitoring)
Example: Measuring changes in the status of elephant populations within and around the Nam Kading NPA

2929
What to monitor?What to monitor?Outcome monitoringOutcome monitoring
Measuring changes in the levels of threats (Outcome monitoring)
For example: Measuring the rate of occurrence of human-elephant conflict, extent of crop loss, injury to humans or elephants over time

3030
What to monitor?What to monitor?Performance MonitoringPerformance Monitoring
Measuring the implementation of interventionsMeasuring the implementation of interventions
Intervention: set up a crop protection system with Intervention: set up a crop protection system with farmers, farmers, Monitoring: have the crop protection systems Monitoring: have the crop protection systems (warning systems and deterrents in agricultural field) (warning systems and deterrents in agricultural field) been established?been established?
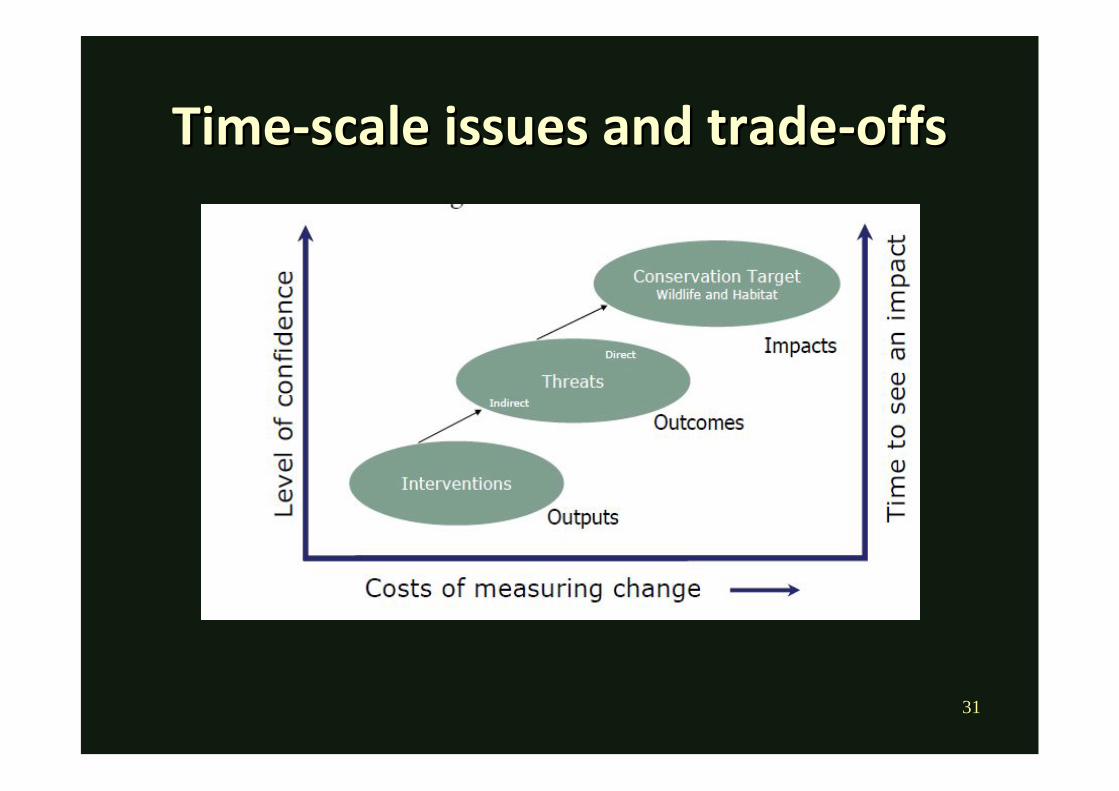
3131
TimeTime--scale issues and tradescale issues and trade--offsoffs
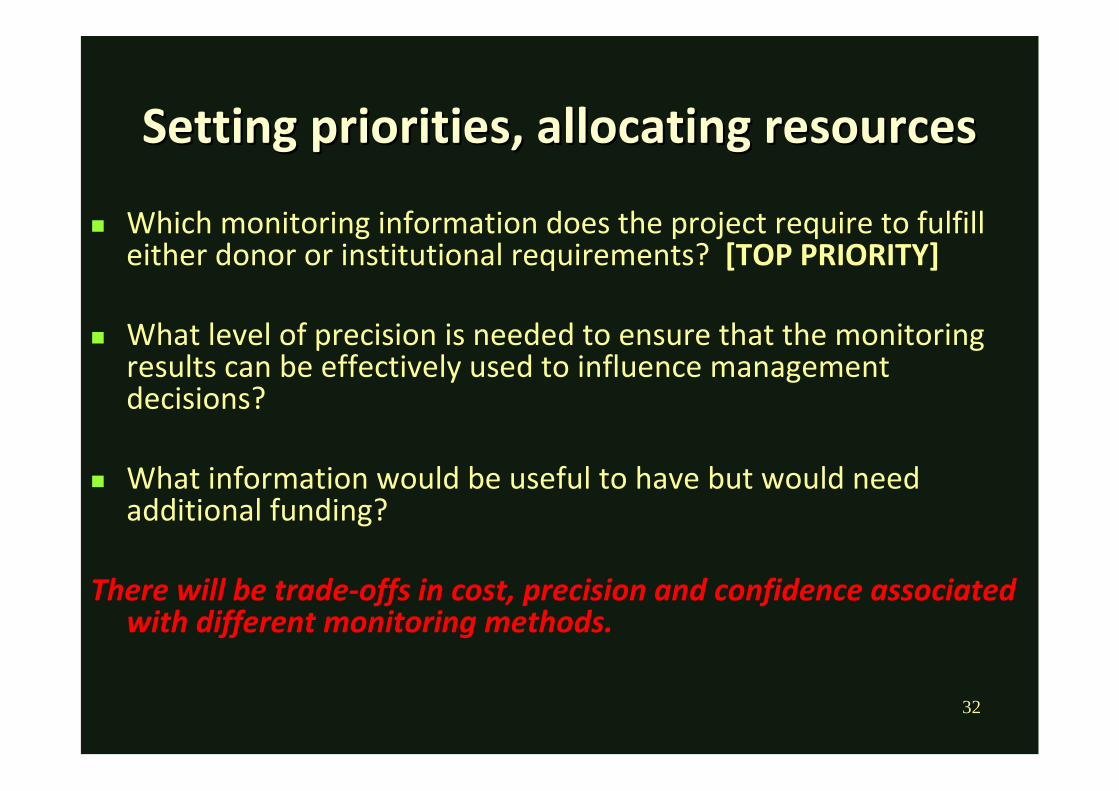
3232
Setting priorities, allocating resourcesSetting priorities, allocating resources
n Which monitoring information does the project require to fulfilleither donor or institutional requirements? [TOP PRIORITY]
n What level of precision is needed to ensure that the monitoring results can be effectively used to influence management decisions?
n What information would be useful to have but would need additional funding?
There will be trade-offs in cost, precision and confidence associated with different monitoring methods.

3333
Decisions for project implementationDecisions for project implementation
(1) How should managers allocate resources between implementing interventions and monitoring the impact of the interventions?
(2) How should managers subdivide monitoring resources across different levels of monitoring and types of monitoring indicators.

3434
Framework for logical allocation of resources Framework for logical allocation of resources between implementation and monitoring between implementation and monitoring
Are there substantial threats facing the conservation targets? Substantial threats facing tigers in NK NPA?
Are there clear and feasible interventions (outreach,enforcement) known to be effective at reducing theidentified threats?
Does the project team have high confidence in their understanding of the overall conservation situation? E.g. Do PA staff understand the overall situation related to declining tigers, threats to tigers and potential interventions that could be used to address the threats and increase tiger populations?

3535
DEVELOPING A MONITORING FRAMEWORK
For every element of the conceptual model (conservation target, threats and interventions), you need to identify the following:
A quantitative objective achieved within a given time-frame
For conservation targets, a monitoring objective will describe the status (increase, decrease or maintain at same level) of the wildlife species or habitat that will be attained over a fixed time-period (for example: increase the population of tigers by 50% over the next 10 years).

3636
DEVELOPING A MONITORING DEVELOPING A MONITORING FRAMEWORK: Monitoring ObjectivesFRAMEWORK: Monitoring Objectives
Threats: how much will the threat be reduced over a certain time-period
(E.g. to reduce by 90 percent incidents of illegal hunting insidethe park over the next 5 years).
Conservation interventions: Was a planned intervention implemented over a certain time period (for example: to establish 10 guard posts along the boundary of the park over the next 5 years).

3737
Monitoring Framework
Component of Conceptual Model
Landscape Species
Objective Method Indicator Who Comments
Conservation Target
Tiger To raise the population of Tiger by 20% over 5 years
Camera trapping
Patch occupancy – area used
2 Camera trap teams
Density; # of individual/km2; in the future after populations increase
Conservation Target
Southern Serow
To raise the population of the Southern Serow by 50% over five years
Camera trapping
Patch occupancy – area used
2 Camera trap teams
Conservation Target
Eurasian Wild Pig
To raise the population of the Eurasian Wild Pig by 100% over five years
Camera trapping
Patch occupancy – area used
2 Camera trap teams
Conservation Target
White-cheeked Crested Gibbon
To raise the population of the White-cheeked Crested Gibbon by 10% over five years
Dry Season forest transects
Patch occupancy – area used
4 Forest transect teams
Density; # of individual/km2; in the future after populations increase
Conservation Target
Great Hornbill To raise the population of the Great Hornbill by 35% over five years
Dry Season forest transects
Patch occupancy – area used
4 Forest transect teams
Density; # of individual/km2; in the future after populations increase
Conservation Target
Asian Elephant To have no decline in the population of Asian Elephant over five years
Fecal DNA capture-recapture
Density: # of individuals/km2
To be determined
To be initiated in 2009
3838
Monitoring ObjectivesMonitoring Objectives

3939
Monitoring Objectives: Nam Monitoring Objectives: Nam KadingKadingNPA, Lao PDRNPA, Lao PDR
Monitoring Objective 1 (Conservation Target)By 2010, increase the Great Hornbill population by 35% inside the Nam Kading NPA.
Monitoring Objective 2 (Direct Threat) By 2010, stop all habitat loss due to shifting cultivation
inside the Nam Kading NPA.
Monitoring Objective 3 (Intervention)By 2010, complete land allocation zoning in all villages bordering the Nam Kading NPA.

4040
INDICATORSINDICATORS
An indicator is a variable or parameter that will be measured over time in order to determine if the project is making progress towards the quantitative objective.
One or more indicators for every monitoring objective.

4141
INDICATORS
Measurable: (either qualitative or quantitative)
Precisely defined: E.g. No. of white-handed gibbon groups per hectare of primary forest or Densities (nesting pairs/km2 of hornbills in the TPZ).
Consistent over time: Observed effects should be due to changes in the actual condition, not to changes in the indicator. (Proxy indicators)
Sensitive: A sensitive indicator will change proportionately and in the same direction as changes in the condition or item being measured. (Proxy indicators)

4242
PROXY INDICATORSProxy indicators are used as a substitute for an indicator that cannot be directly measured or assessed.
E.g. in families that invest their wealth in livestock such as cows and goats, the number of cows and goats can serve as a proxy indicator for household wealth.
For local livelihoods – it is difficult to measure actual household income, so we can measure the types of items that money is spent on and that represent increasing wealth, [e.g. construction type of house]
For hunting - it is almost impossible to measure the number of animals hunted each year, so we typically use a proxy or indirect measure of the prevalence of weapons or people used to hunt animals with (for example number of guns or snares confiscated or number of poachers arrested).

4343
Examples of indicatorsExamples of indicatorsFor Conservation Targets:
Density of bamboo species (clumps/ha) or Density of Tigers per 100 km2 of park
For Threats: Number of illegal poaching incidents recorded per sq.km of patrolling per person per day) or area of forest cleared for shifting cultivation over a 6 month period
For Interventions: Number of guard posts established over a 6 month period or km2 of patrols conducted within the NPA.
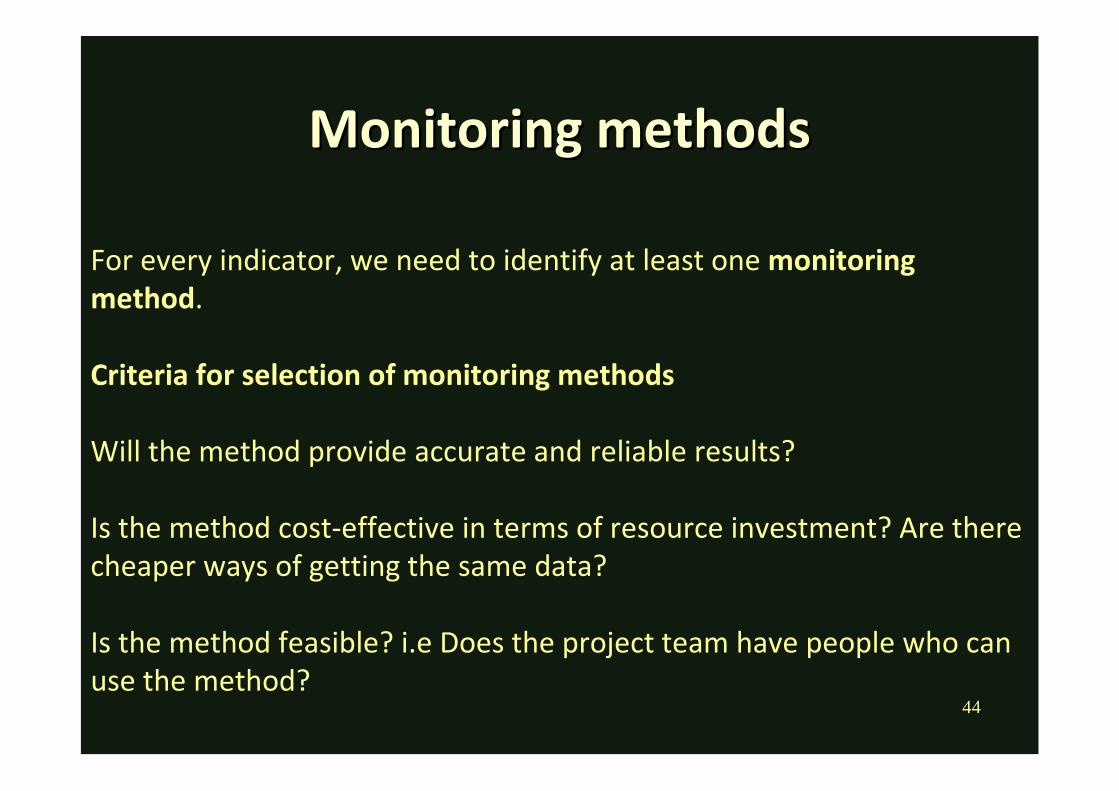
4444
Monitoring methodsMonitoring methods
For every indicator, we need to identify at least one monitoring method.
Criteria for selection of monitoring methods
Will the method provide accurate and reliable results?
Is the method cost-effective in terms of resource investment? Are there cheaper ways of getting the same data?
Is the method feasible? i.e Does the project team have people who can use the method?

4545
Examples of Examples of Indicators and Methodsand Methods
Conservation Target: Area of primary forest in a National Protected Area (NPA)
Indicator 1: Area in hectares of forest in the core zone of the NPA
Potential Monitoring Method 1: Work with community members to develop sketch maps of the forest habitat in the reserve
Potential Monitoring Method 2: Use a Global Positioning System and aerial photography to collect coordinates of forest areas which will be entered into a computer-based GIS.

4646
Monitoring FrameworkMonitoring Framework
Conceptual Model Conceptual Model ComponentComponent
Monitoring Monitoring ObjectiveObjective
IndicatorIndicator Monitoring Monitoring MethodMethod
Conservation Conservation
Target:Target:
Threats:Threats:
Conservation Conservation
Intervention:Intervention:

4747
Monitoring ApproachesMonitoring ApproachesComparison of a group affected by project to itself over time
A. pre-test/post-test monitoring design: This involves measuring a group before intervention to establish a baseline, and then re-measuring the group after intervention.
ExampleObjective: By the end of 3 years, all households will use one-third less wildmeat (measured in kg per month) than they did at the start of the project
Intervention: Providing alternative sources of protein to households in the form of small loans to purchase livestock.
Monitoring Strategy: Compare the amount of wildmeat in the diet of households at the start of the project to the amount of wildlife used at the end of the project.
Monitoring Method: Project staff to conduct households surveys to determine wildmeat in diets during the first month of the project and a similar survey with the same group of households in the final year of the 3-year project.

4848
Monitoring ApproachesMonitoring Approaches
B. Time-series Monitoring Design: Involves collecting data multiple times before and after project intervention to compare a group of units to itself over time
ExampleObjective: By the end of the third year, there are no incidences of poaching of legally protected species within the core zone of the park.
Intervention: The project team will conduct meetings, awareness campaigns toeducate people on protected species and consequences of illegally hunting protected species and conduct routine patrols to record illegal poaching.
Monitoring Strategy: Compare the number of recorded cases of illegal poaching of protected species over time. Monitoring Method: The project team to record the number of illegally poached wildlife during weekly patrol surveys

4949
The Counterfactual ApproachThe Counterfactual ApproachComparison of a group affected by your project to a group not affected by your project over time.
This comparison involves measuring how a given factor changes in a group affected by the project relative to a similar group that is not influenced by the project. This type of comparison -
-Can help establish causal relationships
-What would happen if we had not intervened?
For example, in the Nam Kading NPA the staff measured and compared changes in villager knowledge and attitudes towards Great Hornbill conservation over time in villages that received conservation outreach programs (non-control group) and in villages that had not received the outreach programs (control group).

5050
Identifying the actors and funding sourcesIdentifying the actors and funding sources
Who (individual or institution) will be responsible for gathering the information?
Example: NPA biological monitoring staff -- camera trap surveys of tigers University student -- data on the density of rattans per sq. km of forest in the core zone.
What is the funding source for each method?
For example: The monitoring done by the NPA biological monitoring staff could be funded through the project.

5151
Planning a SchedulePlanning a Schedule
How frequently will camera traps be laid out in the forest?
For how many days at a time?
Seasonality is important!
[Hunting could be an activity pursued by farmers during the non-agricultural season rather than the agricultural season when they are busy planting their crops]

5252
Monitoring FrameworkMonitoring FrameworkComponent Component TypeType
Component Component DescriptionDescription
Monitoring Monitoring ObjectiveObjective
IndicatorIndicator Monitoring Monitoring MethodMethod
WhoWho
Conservation Conservation targettarget
Elephant Elephant populationspopulations
Maintain the Maintain the current current population of population of elephantselephants
Elephant Elephant density per density per kmkm22
Dung surveysDung surveys Nam Kading Nam Kading Park StaffPark Staff

5353
Putting in place appropriate data Putting in place appropriate data management and processing systems management and processing systems

5454
Closing the loop Closing the loop -- communicating the results communicating the results
Data Analysis:
Describing the data.
Testing Hypothesis about data

5555
Communicating Results Communicating Results
Types of communication tools:
Oral presentations, discussion sessions, informal meetings,
Important to get monitoring results and analysis back to managers in a timely fashion in order to effect changes in management approaches as quickly as possible.
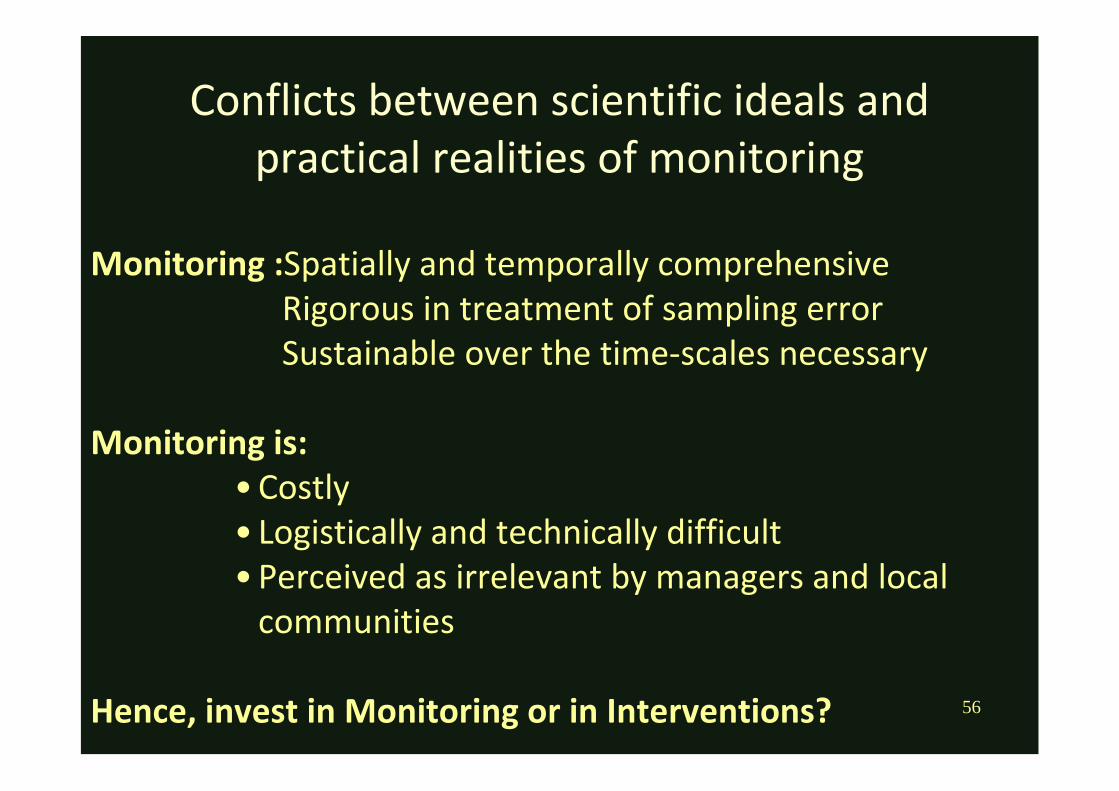
5656
Conflicts between scientific ideals and practical realities of monitoring
Monitoring :Spatially and temporally comprehensiveRigorous in treatment of sampling errorSustainable over the time-scales necessary
Monitoring is: • Costly• Logistically and technically difficult• Perceived as irrelevant by managers and local
communities
Hence, invest in Monitoring or in Interventions?
5757
Criteria for good design, implementation and Criteria for good design, implementation and management of a monitoring programmanagement of a monitoring program
I. Why monitor?Identify flexible goals and clear objectives for monitoring
•Ensure objectives are responsive to management needs
•Ensure objectives are developed in a participatory manner with the relevant stakeholders
•Clearly state the time-frame for the monitoring program and the time expected to see results

5858
II. What should be monitored? Identify the variable(s) to be measured and ensure they meet the following criteria:
- Relevant to management- Scientifically defensible and biologically representative- Statistically powerful and interpretable- Measurable and feasible- Easily understood
Identify your target population - Define the scale at which you need to monitor and the scale at which you will infer your results
Criteria for good design, implementation Criteria for good design, implementation and management of a monitoring programand management of a monitoring program

5959
Criteria for good design, implementation Criteria for good design, implementation and management of a monitoring programand management of a monitoring program
III. How to monitor?1. Develop formal collaborations with statisticians and scientists in
developing monitoring protocols 2. Develop monitoring methods and data collection protocols
• Address sampling bias in selection of sites to be monitored• Address detection error in sampling design• Ensure minimum sample sizes and sampling effort required to achieve objectives• Ensure adequate precision of estimates to permit detection of change over time
3. Solicit feedback and review of monitoring protocols from experts4. Assess and evaluate if the methods are the most cost-effective to
address your monitoring objectives

6060
Criteria for good design, implementation and management of a monitoring program
IV. Other important considerations for management and implementation
1. Identify the person/persons responsible for implementation Ensure adequate personnel, skills and training are available forimplementation and data analysis
2. Secure adequate funding for the duration of the monitoring program, including design, implementation, analysis and communication of information
3. Ensure an information management system is in place for managingand communicating monitoring data
4. Ensure that monitoring objectives, methods, key assumptions and data recording protocols are carefully documented and accessible by all stakeholders

6161
Monitoring FrameworkMonitoring FrameworkComponent of
Conceptual Model
Landscape Species
Objective Method Indicator Who Comments
Conservation Target
TigerTo raise the population of Tiger by 20% over five years
Camera trappingPatch occupancy - area used
2 Camera trap teams
Density; # of individuals/km2 ; in the future after populations increase
Conservation Target
Southern SerowTo raise the population of Southern Serow by 50% over five years
Camera trappingPatch occupancy - area occupied
2 Camera trap teams
Conservation Target
Eurasian Wild PigTo raise the population of Eurasian Wild Pig by 100% over five years
Camera trappingPatch occupancy - area used
2 Camera trap teams
Conservation Target
White-cheeked Crested Gibbon
To raise the population of White-Cheeked Crested Gibbon by 10% over five years
Dry season forest transects
Patch occupancy - area occupied
4 Forest transect teams
Density; # of individuals/km2 ; in the future after populations increase
Conservation Target
Great HornbillTo raise the population of Great Hornbill by 35% over five years
Dry season forest transects
Patch occupancy - area used
4 Forest transect teams
Density; # of individuals/km2 ; in the future after populations increase
Conservation Target
Asian ElephantTo have no decline in the population of Asian Elephant over five years
Fecal DNA capture-recapture
Density; # of individuals/km2
To be determined
To be initiated in 2009