monitoring large-scale changes in transcript abundance … · monitoring large-scale changes in...
TRANSCRIPT

Plant Molecular Biology 48: 551–573, 2002.© 2002 Kluwer Academic Publishers. Printed in the Netherlands.
551
Monitoring large-scale changes in transcript abundance in drought- andsalt-stressed barley
Z. Neslihan Ozturk1,2, Valentina Talame1,3, Michael Deyholos4, Christine B. Michalowski1,4,David W. Galbraith4, Nermin Gozukirmizi2, Roberto Tuberosa3 and Hans J. Bohnert1,4,∗1Department of Biochemistry and Molecular Biophysics, University of Arizona, Biosciences West, Tucson, AZ85721-0088, USA; 2TUBITAK, Marmara Research Center, Research Institute for Genetic Engineering andBiotechnology, 41470 Gebze/Kocaeli, Turkey; 3Department of Agroenvironmental Science and Technology, Univer-sity of Bologna, 40126 Bologna, Italy; 4Permanent address: Departments of Plant Biology and of Crop Sciences,University of Illinois, 1201 W. Gregory Drive, Urbana, IL 61801, USA (∗author for correspondence; [email protected])
Received 31 July 2001; accepted in revised form 17 September 2001
Key words: drought stress, Hordeum vulgare, microarray hybridization, salinity stress, stress-regulated transcripts
Abstract
Responses to drought and salinity in barley (Hordeum vulgare L. cv. Tokak) were monitored by microarray hy-bridization of 1463 DNA elements derived from cDNA libraries of 6 and 10 h drought-stressed plants. Functionalidentities indicated that many cDNAs in these libraries were associated with drought stress. About 38% of thetranscripts were novel and functionally unknown. Hybridization experiments were analyzed for drought- andsalinity-regulated sequences, with significant changes defined as a deviation from the control exceeding 2.5-fold.Responses of transcripts showed stress-dependent expression patterns and time courses. Nearly 15% of all tran-scripts were either up- or down-regulated under drought stress, while NaCl led to a change in 5% of the transcripts(24 h, 150 mM NaCl). Transcripts that showed significant up-regulation under drought stress are exemplified byjasmonate-responsive, metallothionein-like, late-embryogenesis-abundant (LEA) and ABA-responsive proteins.Most drastic down-regulation in a category was observed for photosynthesis-related functions. Up-regulation underboth drought and salt stress was restricted to ESTs for metallothionein-like and LEA proteins, while increases inubiquitin-related transcripts characterized salt stress. A number of functionally unknown transcripts from cDNA li-braries of drought-stressed plants showed up-regulation by drought but down-regulation by salt stress, documentinghow precisely transcript profiles report different growth conditions and environments.
Introduction
Abiotic stresses can severely impair plant growth andperformance. Environmental factors, such as drought,extreme temperatures or high and fluctuating salinity,are also responsible for significant yield reductions incultivated areas world-wide. Thus, the responses ofplants to various stresses have for decades been thefocus of physiological studies (Levitt, 1980) and, morerecently, of molecular and reverse genetics studies andtransgenic experimentation (Grover, 1999; Bajaj et al.,2000; Forster et al., 2000; Hasegawa et al., 2000;Zhang et al., 2000). A large and increasing number
of genes, transcripts and proteins have been correla-tively implicated in stress response pathways, whiletheir precise functions in either tolerance or sensitivityoften remain unclear (Bray, 1997). Rather than beingindicators of stress resistance, many of these responsecomponents may be ancillary and irrelevant or mayeven be indicators of degenerative processes.
By necessity, the work followed a gene-by-geneor protein-after-protein process, which may now, asmolecular genetic tools have improved, be replacedby global approaches to study gene and protein ex-pression. We have begun to assemble transcript pop-

552
ulations to probe for abiotic (drought or salinity)stress-related transcript changes in microarray hy-bridizations. Microarray technology allows for thedetermination of transcript abundance for many orall transcripts in a genome by comparing control andexperimental states. The RNAs from different treat-ments are distinguished by the incorporation of dif-ferent fluorescent labels (Richmond and Somerville,2000; Schuchardt et al., 2000; Deyholos and Gal-braith, 2001). With appropriate controls and repeatexperiments, significant data are obtained. Statisticalanalysis of such microarray data has already estab-lished insights into a number of plant processes, suchas seed development (Girke et al., 2000), woundingresponses (Reymond et al., 2000), pathogen signaling(Maleck et al., 2000; Schenk et al., 2000), nutrient-dependent changes in expression profiles (Wang et al.,2000), or salinity stress responses (Kawasaki et al.,2001).
Barley (Hordeum vulgare L.) was chosen for mon-itoring the changes induced by water and salt stress intranscript profiles in comparison with control plants.Barley is a moderately drought- and salt-tolerant cropof great significance in countries around the Mediter-ranean basin. Several morpho-physiological and bio-chemical traits have been investigated in the attemptto improve barley yield under water-limited condi-tions (Avecedo, 1987; Grumet et al., 1987; Blum,1988; Matin, 1989; Sanguineti et al., 1994; Cecca-relli and Grando, 1996; Borel et al., 1997; Teulatet al., 1997; Ceccarelli et al., 1998). Among the mostnotable biochemical traits, accumulation of prolinehas received considerable attention, though contrast-ing conclusions have been reached concerning its rolein the adaptive response to drought (Blum, 1988; De-launey and Verma, 1993). Extensive efforts have alsobeen devoted to the characterization of genes inducedor upregulated by drought, such as dehydrins (Closeet al., 1989, 1993). Correlative evidence suggests apossible role for a number of these drought-inducedproteins in protecting cells from the harmful effects ofdehydration (Bray, 1997; Close, 1997). For example,the up-regulation of a drought-induced barley gene(HVA1) improved tolerance to drought and salinityin rice grown under controlled conditions (Xu et al.,1996). Encouraging as these results are, there is wide-spread scepticism that up-regulation of one or moregenes encoding structural proteins may lead to mean-ingful results in terms of field tolerance to drought(Bajaj et al., 2000; Bohnert and Bressan, 2001).A more promising strategy relies on genes encod-
ing transcription factors (e.g., DREB-1A; Yamaguchi-Shinozaki and Shinozaki, 1994; Jaglo-Ottosen et al.,1998; Smirnoff and Bryant, 1999), which lead to theinduced expression of a suite of genes in response todrought. When the expression of Arabidopsis DREB-1A was regulated by a drought-inducible promoterin rice, resistance to drought under controlled condi-tions was significantly enhanced (Kasuga et al., 1999).The presence of DREB-1A homologues in barley (e.g.,CBF1, accession number AF298230; T.J. Close, per-sonal communication) and maize (van Buuren et al.,2002) has recently been reported. It will be impor-tant to resolve to what extent, if any, allelic variationin DREB1 homologues affects drought tolerance inbarley and other crops.
Genetic differences in tolerance to saline condi-tions have been reported among accessions of culti-vated barley (Greenway, 1962; Richards et al., 1987;Slavich et al., 1990). A number of genes seem to affectNa+ influx and concentration in cells (Schachtmanand Liu, 1999). Although a Na+ (net) uptake trans-porter has yet to be identified in higher plants, it seemsthat Na+ enters cells through high-affinity K+ carriersor low-affinity K+ channels which are insufficientlyselective for K+ (Amtmann and Sanders, 1999). Re-cent evidence indicates that HKT-type transportersmay be one of those default influx systems (Rus et al.,2001). In contrast to Na+ influx, more is knownabout genes responsible for the compartmentalizationof Na+ to the vacuole. This is accomplished by atonoplast Na+/H+ antiporter, whose over-expressionhas been shown to increase salinity tolerance in Ara-bidopsis thaliana (Apse et al., 1999). In all plants,tolerance to high salt concentrations relies on main-taining continued meristematic growth and sustainedphotosynthesis, which is made possible by controlover the rate of salt accumulation and sequestering inleaves so that cytoplasmic concentrations remain be-low toxic levels (Greenway and Munns, 1980) whilethe supply of carbon to sinks is maintained (Munns,1993). It has been argued that salt tolerance of barleymay be a consequence of high growth rate associatedwith fast progression of phenological development andearly flowering (Munns et al., 2000).
Plant stress tolerance is governed by complex traitswhose expression is subject to ‘genotype × environ-ment’ interactions (G × E; Powell et al., 1986; Contiet al., 1994; Tuberosa et al., 1998). This, in turn, sug-gests that monitoring changes in transcript profiles bymicroarray hybridizations may allow for the identifi-cation of networks of transcripts accounting for G × E

553
Table 1. Transcript profiles of drought-stressed barley (H. vulgare L. cv. Tokak). Thecategory ‘no hit’ includes ESTs for which no homology in the databases was detectedin BLAST searches. Unclassified proteins denote ESTs with homology to unknown,hypothetical or putative ESTs with unknown functions in other organisms.
Major functional categories Leaf Root Total
n % n % n %
Cell growth and division 14 2.8 49 5.1 63 4.3
Cell rescue, defense and aging 61 12.0 74 7.7 135 9.2
Cellular biogenesis 0 0.0 3 0.3 3 0.2
Cellular organization 8 1.6 3 0.3 11 0.8
Energy 20 3.9 38 4.0 58 4.0
Intracellular transport 3 0.6 14 1.5 17 1.2
Ion homeostasis 18 3.6 13 1.4 31 2.1
Metabolism 86 17.0 123 12.9 209 14.3
‘No hit’ 38 7.5 101 10.6 139 9.5
Photosynthesis 14 2.8 0 0.0 14 1.0
Protein destination 46 9.1 75 7.8 121 8.3
Protein synthesis 17 3.4 37 3.9 54 3.7
Signal transduction 18 3.6 59 6.2 77 5.3
Transcription 7 1.4 23 2.4 30 2.1
Transport facilitation 41 8.1 58 6.1 99 6.8
Unclassified proteins 116 22.9 286 29.9 402 27.5
Total 507 100 956 100 1463 100
interactions in different genotyes. We used a relativelydrought-tolerant line of barley (Hordeum vulgare L.cv. Tokak; Altinkut et al., 2001) to generate cDNAlibraries from roots and leaves after drought stress for6 and 10 h. The stress was applied in the form ofa shock treatment because we wished to obtain tran-scripts which showed strong regulation, arguing thatsuch a set might be informative to follow up in laterexperiments based on a more natural and slow dry-ing of plants. ESTs were sequenced and ca. 1500DNA elements were arrayed on glass slides. Resultsfrom the hybridization experiments confirmed the up-regulation of many transcripts which had previouslybeen reported as responsive to stress; in addition,many more novel, functionally unknown transcriptswere found. It is also obvious that the responses todrought and salt shock include only partially overlap-ping sets of transcripts.
Materials and methods
Plant materials and growth conditions
Hordeum vulgare L. cv. Tokak seeds were provided byTUBITAK, MRC, RIGEB (Kocaeli, Turkey). Seedswere surface-sterilized in 10% sodium hypochloride(30 min) and rinsed 15 times (1 min/each) in double-distilled H2O. For drought experiments, plants weregrown in sand and watered daily with one-third-strength Hoagland’s solution containing double iron.For salt stress experiments, the plants were grownin aerated, hydroponic tanks in the same solution.Plants were grown under controlled conditions (28 ◦Cday/25 ◦C night, 12 h photoperiod, ∼500 µmol m−2
s−1 photon flux density, 83% relative humidity) andstressed at the age of three weeks after germination.
Drought stress was applied by removing plantsfrom sand and leaving them on paper towels underthe conditions indicated above. Root and leaf tissueswere harvested after 6 and 10 h of stress, frozen inliquid nitrogen and stored at −80 ◦C. Control plantswere well-watered and harvested at the same time asthe stressed plants. Salt stress was applied to plantsin hydroponic tanks containing one-third Hoagland’s
554
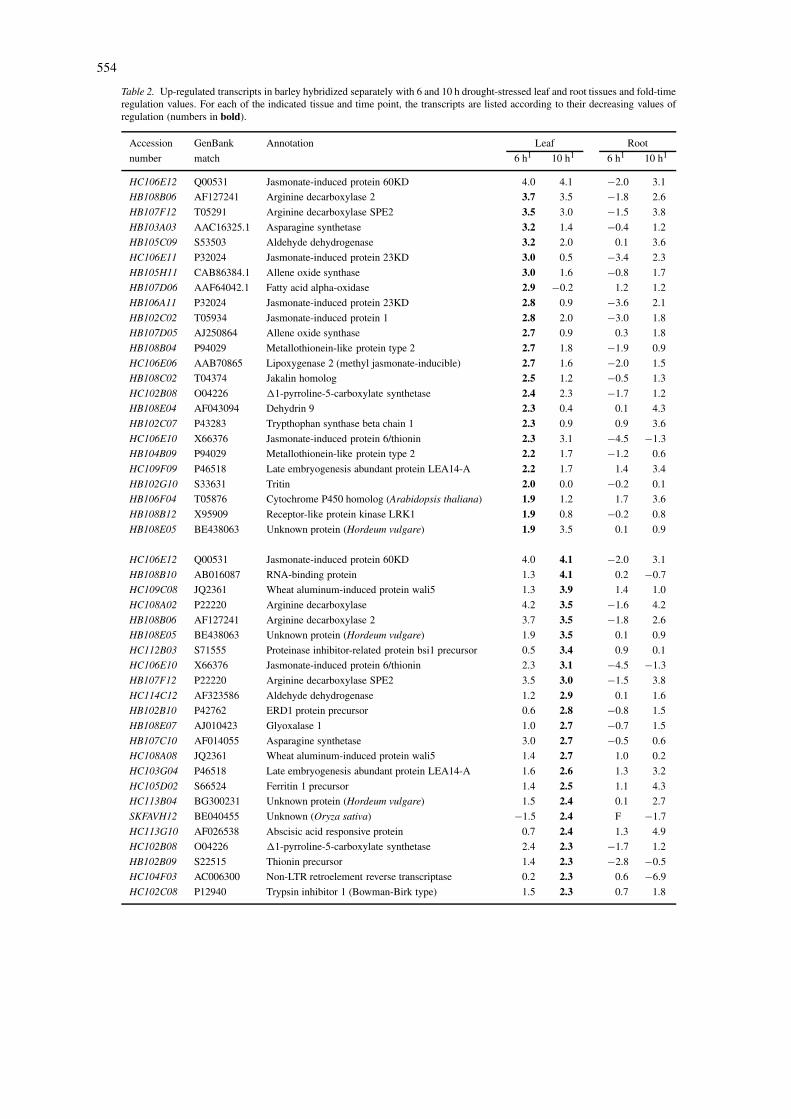
Table 2. Up-regulated transcripts in barley hybridized separately with 6 and 10 h drought-stressed leaf and root tissues and fold-timeregulation values. For each of the indicated tissue and time point, the transcripts are listed according to their decreasing values ofregulation (numbers in bold).
Accession GenBank Annotation Leaf Root
number match 6 h1 10 h1 6 h1 10 h1
HC106E12 Q00531 Jasmonate-induced protein 60KD 4.0 4.1 −2.0 3.1
HB108B06 AF127241 Arginine decarboxylase 2 3.7 3.5 −1.8 2.6
HB107F12 T05291 Arginine decarboxylase SPE2 3.5 3.0 −1.5 3.8
HB103A03 AAC16325.1 Asparagine synthetase 3.2 1.4 −0.4 1.2
HB105C09 S53503 Aldehyde dehydrogenase 3.2 2.0 0.1 3.6
HC106E11 P32024 Jasmonate-induced protein 23KD 3.0 0.5 −3.4 2.3
HB105H11 CAB86384.1 Allene oxide synthase 3.0 1.6 −0.8 1.7
HB107D06 AAF64042.1 Fatty acid alpha-oxidase 2.9 −0.2 1.2 1.2
HB106A11 P32024 Jasmonate-induced protein 23KD 2.8 0.9 −3.6 2.1
HB102C02 T05934 Jasmonate-induced protein 1 2.8 2.0 −3.0 1.8
HB107D05 AJ250864 Allene oxide synthase 2.7 0.9 0.3 1.8
HB108B04 P94029 Metallothionein-like protein type 2 2.7 1.8 −1.9 0.9
HC106E06 AAB70865 Lipoxygenase 2 (methyl jasmonate-inducible) 2.7 1.6 −2.0 1.5
HB108C02 T04374 Jakalin homolog 2.5 1.2 −0.5 1.3
HC102B08 O04226 �1-pyrroline-5-carboxylate synthetase 2.4 2.3 −1.7 1.2
HB108E04 AF043094 Dehydrin 9 2.3 0.4 0.1 4.3
HB102C07 P43283 Trypthophan synthase beta chain 1 2.3 0.9 0.9 3.6
HC106E10 X66376 Jasmonate-induced protein 6/thionin 2.3 3.1 −4.5 −1.3
HB104B09 P94029 Metallothionein-like protein type 2 2.2 1.7 −1.2 0.6
HC109F09 P46518 Late embryogenesis abundant protein LEA14-A 2.2 1.7 1.4 3.4
HB102G10 S33631 Tritin 2.0 0.0 −0.2 0.1
HB106F04 T05876 Cytochrome P450 homolog (Arabidopsis thaliana) 1.9 1.2 1.7 3.6
HB108B12 X95909 Receptor-like protein kinase LRK1 1.9 0.8 −0.2 0.8
HB108E05 BE438063 Unknown protein (Hordeum vulgare) 1.9 3.5 0.1 0.9
HC106E12 Q00531 Jasmonate-induced protein 60KD 4.0 4.1 −2.0 3.1
HB108B10 AB016087 RNA-binding protein 1.3 4.1 0.2 −0.7
HC109C08 JQ2361 Wheat aluminum-induced protein wali5 1.3 3.9 1.4 1.0
HC108A02 P22220 Arginine decarboxylase 4.2 3.5 −1.6 4.2
HB108B06 AF127241 Arginine decarboxylase 2 3.7 3.5 −1.8 2.6
HB108E05 BE438063 Unknown protein (Hordeum vulgare) 1.9 3.5 0.1 0.9
HC112B03 S71555 Proteinase inhibitor-related protein bsi1 precursor 0.5 3.4 0.9 0.1
HC106E10 X66376 Jasmonate-induced protein 6/thionin 2.3 3.1 −4.5 −1.3
HB107F12 P22220 Arginine decarboxylase SPE2 3.5 3.0 −1.5 3.8
HC114C12 AF323586 Aldehyde dehydrogenase 1.2 2.9 0.1 1.6
HB102B10 P42762 ERD1 protein precursor 0.6 2.8 −0.8 1.5
HB108E07 AJ010423 Glyoxalase 1 1.0 2.7 −0.7 1.5
HB107C10 AF014055 Asparagine synthetase 3.0 2.7 −0.5 0.6
HC108A08 JQ2361 Wheat aluminum-induced protein wali5 1.4 2.7 1.0 0.2
HC103G04 P46518 Late embryogenesis abundant protein LEA14-A 1.6 2.6 1.3 3.2
HC105D02 S66524 Ferritin 1 precursor 1.4 2.5 1.1 4.3
HC113B04 BG300231 Unknown protein (Hordeum vulgare) 1.5 2.4 0.1 2.7
SKFAVH12 BE040455 Unknown (Oryza sativa) −1.5 2.4 F −1.7
HC113G10 AF026538 Abscisic acid responsive protein 0.7 2.4 1.3 4.9
HC102B08 O04226 �1-pyrroline-5-carboxylate synthetase 2.4 2.3 −1.7 1.2
HB102B09 S22515 Thionin precursor 1.4 2.3 −2.8 −0.5
HC104F03 AC006300 Non-LTR retroelement reverse transcriptase 0.2 2.3 0.6 −6.9
HC102C08 P12940 Trypsin inhibitor 1 (Bowman-Birk type) 1.5 2.3 0.7 1.8

555
Table 2. Continued
Accession GenBank Annotation Leaf Root
number match 6 h1 10 h1 6 h1 10 h1
HC101A03 P94029 Metallothionein-like protein 2.2 2.3 −1.0 2.9
HB107E04 U77345 Cell death supressor protein L1s1 1.2 1.8 −1.2 1.6
HC105B12 AF218627 Abscisic acid-induced plasma membrane protein 0.9 1.1 3.9 4.9
HC101C08 CAA09192.1 Glutathione transferase 0.1 0.8 2.6 3.3
HC109H11 T01696 Omega-3 fatty acid desaturase −0.4 −0.9 2.6 3.1
HC103D05 T02191 Cytochrome P450 homolog (Arabidopsis thaliana) 1.0 1.1 2.5 3.3
HC102A07 T06986 Wheat aluminum-induced protein wali6 0.3 1.3 2.5 3.3
HC102D09 CAC11562 Hypothetical membrane protein (Thermolasma acidophilum) 0.3 0.0 2.5 0.5
HC108B09 Q10327 Unknown (Schizosaccharomyces pombe) 0.0 −0.4 2.5 −0.4
HC109C04 – No hit 0.4 1.4 2.5 1.2
HC105D07 T17012 Protein phosphatase 2A 1.1 −1.2 2.4 1.3
HC108D06 P49075 Exoglucanase 3 precursor 0.8 −0.4 2.3 0.2
HC101A05 Q41001 Blue copper-binding protein homolog 1.3 0.3 2.3 2.5
HC101G12 S66342 Ribonuclease 2 (wound-induced) 0.5 1.5 2.3 2.3
HC104B09 P43279 Malic enzyme (NAPD-dependent, chloroplast) 0.0 −0.8 2.2 2.9
HC105G01 AF031195 Blue copper-binding protein homolog −0.2 0.6 2.1 3.0
HC102E09 U60764 Pathogenesis-related protein 0.1 −0.3 2.1 5.0
HC101E01 AF123608 Cytochrome P450 −0.6 1.3 2.0 2.1
HC101B07 L37358 Lipoxygenase 2 1.2 0.4 2.0 2.4
HC105A09 AAD21417 Unknown (Arabidopsis thaliana) −0.4 −0.8 1.9 2.3
HC107D02 AF250935 Germin protein F −0.3 1.6 1.9 2.6
HC110G12 S71361 Actin-binding protein WCOR719 0.5 0.6 1.9 4.0
HC110A02 P40372 Ribosomal protein 60S L3-A −0.6 −0.1 1.9 0.1
HC107G10 T05956 Germin-like protein −0.3 0.4 1.8 2.5
HC110G02 BAB02761 Cytochrome c oxidoreductase-like protein 0.9 −0.3 1.8 2.4
HC113F12 T11580 12-oxophytodienoate reductase −0.4 −0.8 1.8 3.5
HC101A07 Q01291 Ribosomal protein, s0, 40S −0.3 0.5 1.8 0.4
HC109H08 T07107 Calcium-binding protein 0.3 1.6 1.7 3.0
HC110C03 AAF08575 Unknown (Arabidopsis thaliana) 1.3 0.2 1.7 1.6
HC103C11 P07987 Exoglucanase 2 precursor −1.6 −3.3 1.6 F
HC112E03 AF026538 Abscisic acid responsive protein 0.6 1.5 1.6 2.8
HC107H07 AAF64042 Fatty acid alpha-oxidase 2.5 −0.8 F 6.5HC114F01 T17012 Probable phosphoprotein phosphatase −0.6 −2.2 F 5.4HC104E01 T02763 Malate dehydrogenase 0.1 −4.9 0.3 5.4HC114D12 AL365234 Unknown (Arabidopsis thaliana) 0.7 0.5 −0.6 5.2HC102E09 T14817 Pathogenesis-related protein 0.1 −0.3 2.1 5.0HC105B12 AF218627 Abscisic acid-induced plasma membrane protein 0.9 1.1 3.9 4.9HB107A11 AF127241 Arginine decarboxylase 2 3.4 2.9 −1.3 4.7HC107C01 D85764 Monodehydroascorbate reductase (cytosolic) 0.7 0.1 0.7 4.6HC109B06 Q03460 Glutamate synthase (NADH dependent) −0.2 0.4 1.1 4.5HC105C11 AC010926 Protein phosphatase 2C 1.1 1.3 0.3 4.5HC107A05 AF324993 Unknown (Arabidopsis thaliana) 0.6 1.3 1.3 4.3HC105D02 S66524 Ferritin 1 precursor 1.4 2.5 1.1 4.3HB108E04 AF043094 Dehydrin 9 2.3 0.4 0.1 4.3HC109E10 BF256912 Unknown protein (Hordeum vulgare) 0.6 0.4 0.7 4.2HC110G12 S71361 Actin binding protein WCOR719 0.5 0.6 1.9 4.0HC114E06 AC010718 Unknown (Arabidopsis thaliana) 0.4 1.0 0.5 4.0
556
Table 2. Continued
Accession GenBank Annotation Leaf Root
number match 6 h1 10 h1 6 h1 10 h1
HB106D02 AJ010829 Geminivirus Rep A-binding protein (GRAB1) 1.4 1.7 1.2 4.0HC105D06 BG355459 Unknown protein (Hordeum vulgare) 0.3 0.2 −0.6 3.8HB107F12 P22220 Arginine decarboxylase 3.5 3.0 −1.5 3.8HC103E02 T01558 Auxin-induced protein 0.3 −2.0 −0.6 3.8SKFAVG11 BAB09839 Water channel protein (WCP-IV) 0.6 −1.3 −0.3 3.7HC112E09 AJ250864 Allene oxide synthase 2.3 0.9 0.7 3.6HB106F04 T05876 Cytochrome P450 homolog (Arabidopsis thaliana) 1.9 1.2 1.7 3.6HB105C09 S53503 Aldehyde dehydrogenase 3.2 2.0 0.1 3.6HC107E10 AL161496 Protein phosphatase regulatory subunit −0.6 0.0 0.6 3.6HB102C07 P43283 Trypthophan synthase beta chain 1 2.3 0.9 0.9 3.6
1Values represent log2 ratios of stressed vs. control tissue. Changes in regulation were considered significant at 2.5-fold deviationfrom the control value (corresponding to log2 = 1.5). ESTs labeled ‘F’ were flagged because of high variability of signal intensityin repeat experiments.
solution supplied with double iron and 150 mM NaCl.Root and leaf tissues were collected from control andstressed plants after 24 h of stress treatment.
Physiological analyses
Water loss of plants under drought conditions was de-termined by drying leaf samples taken from stressedand control plants at 80 ◦C for 6 h. Free amino acidsfrom both drought-stressed (10 h) and control sampleswere isolated according to Thomas et al. (1992). Theamino acid composition was determined in a Beckman7300 amino acid analyzer (Beckman, Fullerton, CA).
RNA isolation and cDNA library construction
Total RNA was isolated by using TRIzol Reagent(Life Technologies, Rockville, MD) and converted tomRNA by the PolyAT-tract mRNA Isolation SystemIV (Promega, Madison, WI) according to establishedprotocols. Two cDNA libraries were constructed fromdrought-stressed H. vulgare L. cv. Tokak. The libraryHB includes transcripts from 6 and 10 h drought-stressed leaves combined; library HC includes RNAfrom 6 and 10 h drought-stressed roots. Library con-struction utilized a cDNA Synthesis Kit (Stratagene,La Jolla, CA). The cDNAs were ligated into pBlue-script II SK(+) (Life Technologies) and transformedinto Escherichia coli XL10-Gold (Stratagene). AfterDNA isolation, inserts were sequenced from the 5′ends and annotated on the basis of their homologieswith sequences published in GenBank.
Library amplification and preparation of DNAmicroarrays
cDNA libraries were amplified in a 96-well PCR for-mat using pBluescript T3 (5′-GAAATTAACCCTCA-CTAAAGG-3′) and T7 (5′-TGTAATACGACTCACT-ATAGGGC-3′) primers with amino-modified 5′ endsin 50 µl reaction volumes at an annealing temperatureof 55 ◦C for 40 cycles. The products were separatedin agarose gels to confirm amplification quality andquantity. PCR products were diluted by adding 100 µlbinding solution (150 mM potassium acetate pH 4.8,7 M guanidine hydrochloride), purified (Mafnob 96-well PCR Cleanup Kit; Millipore, Bedford, MA),freeeze-dried and re-suspended in 7 µl of 2× SSC.Products at a DNA concentration >400 ng/µl and ofa size >400 bp were printed (Deyholos and Galbraith,2001) on Sigma Screen glass slides (Sigma, St. Louis,MO) using the Omnigrid Spotter (GeneMachines, SanCarlos, CA). Each DNA element was spotted in fourreplicates. In addition, five different human ESTs werespotted in four replicates in multiple locations on theslides. Each hybridization included Cy3/Cy5-labeledhuman probes of these ESTs each at a different con-centration to control for low and high signal intensitiesand to adjust for equal Cy3 and Cy5 signal strength.
Preparation of fluorescent probes
mRNA samples were labeled with Cy3- or Cy5-labeled dUTP (Amersham Pharmacia Biotech, Duben-dorf, Switzerland) by first-strand reverse transcription.Labeling was performed in a 50 µl reaction vol-ume containing 1× reaction buffer, 2 µg oligo T(18)
557
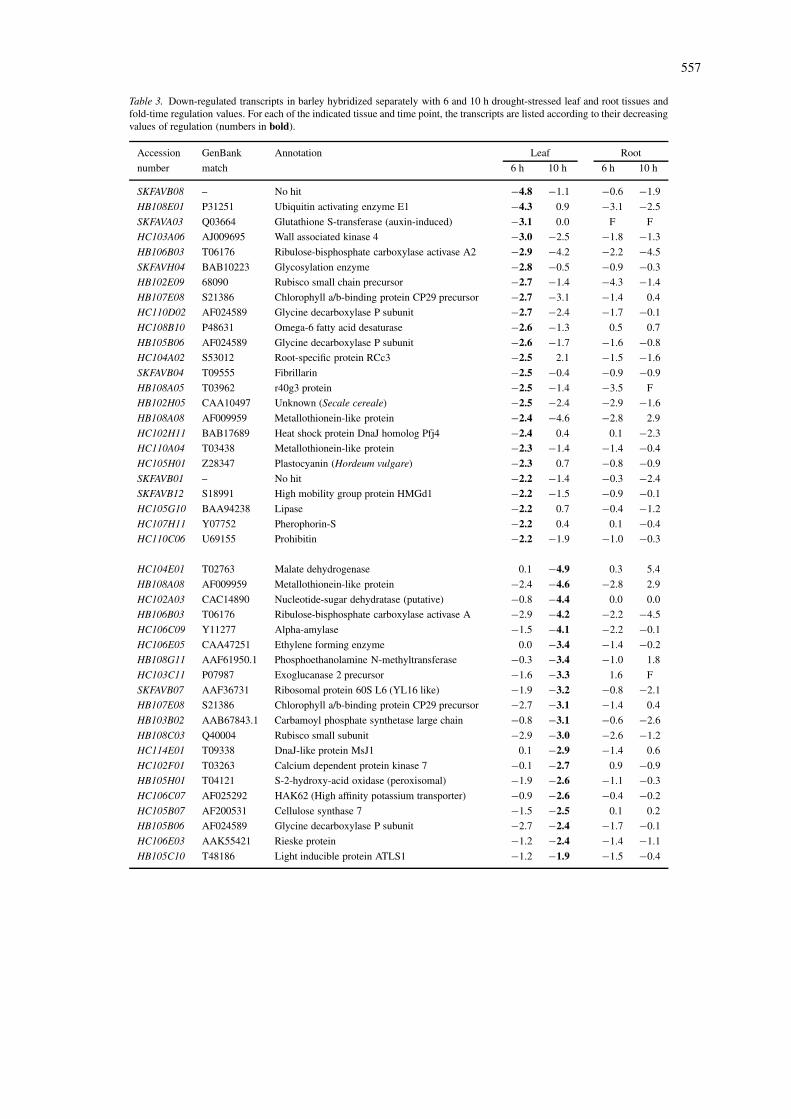
Table 3. Down-regulated transcripts in barley hybridized separately with 6 and 10 h drought-stressed leaf and root tissues andfold-time regulation values. For each of the indicated tissue and time point, the transcripts are listed according to their decreasingvalues of regulation (numbers in bold).
Accession GenBank Annotation Leaf Root
number match 6 h 10 h 6 h 10 h
SKFAVB08 – No hit −4.8 −1.1 −0.6 −1.9
HB108E01 P31251 Ubiquitin activating enzyme E1 −4.3 0.9 −3.1 −2.5
SKFAVA03 Q03664 Glutathione S-transferase (auxin-induced) −3.1 0.0 F F
HC103A06 AJ009695 Wall associated kinase 4 −3.0 −2.5 −1.8 −1.3
HB106B03 T06176 Ribulose-bisphosphate carboxylase activase A2 −2.9 −4.2 −2.2 −4.5
SKFAVH04 BAB10223 Glycosylation enzyme −2.8 −0.5 −0.9 −0.3
HB102E09 68090 Rubisco small chain precursor −2.7 −1.4 −4.3 −1.4
HB107E08 S21386 Chlorophyll a/b-binding protein CP29 precursor −2.7 −3.1 −1.4 0.4
HC110D02 AF024589 Glycine decarboxylase P subunit −2.7 −2.4 −1.7 −0.1
HC108B10 P48631 Omega-6 fatty acid desaturase −2.6 −1.3 0.5 0.7
HB105B06 AF024589 Glycine decarboxylase P subunit −2.6 −1.7 −1.6 −0.8
HC104A02 S53012 Root-specific protein RCc3 −2.5 2.1 −1.5 −1.6
SKFAVB04 T09555 Fibrillarin −2.5 −0.4 −0.9 −0.9
HB108A05 T03962 r40g3 protein −2.5 −1.4 −3.5 F
HB102H05 CAA10497 Unknown (Secale cereale) −2.5 −2.4 −2.9 −1.6
HB108A08 AF009959 Metallothionein-like protein −2.4 −4.6 −2.8 2.9
HC102H11 BAB17689 Heat shock protein DnaJ homolog Pfj4 −2.4 0.4 0.1 −2.3
HC110A04 T03438 Metallothionein-like protein −2.3 −1.4 −1.4 −0.4
HC105H01 Z28347 Plastocyanin (Hordeum vulgare) −2.3 0.7 −0.8 −0.9
SKFAVB01 – No hit −2.2 −1.4 −0.3 −2.4
SKFAVB12 S18991 High mobility group protein HMGd1 −2.2 −1.5 −0.9 −0.1
HC105G10 BAA94238 Lipase −2.2 0.7 −0.4 −1.2
HC107H11 Y07752 Pherophorin-S −2.2 0.4 0.1 −0.4
HC110C06 U69155 Prohibitin −2.2 −1.9 −1.0 −0.3
HC104E01 T02763 Malate dehydrogenase 0.1 −4.9 0.3 5.4
HB108A08 AF009959 Metallothionein-like protein −2.4 −4.6 −2.8 2.9
HC102A03 CAC14890 Nucleotide-sugar dehydratase (putative) −0.8 −4.4 0.0 0.0
HB106B03 T06176 Ribulose-bisphosphate carboxylase activase A −2.9 −4.2 −2.2 −4.5
HC106C09 Y11277 Alpha-amylase −1.5 −4.1 −2.2 −0.1
HC106E05 CAA47251 Ethylene forming enzyme 0.0 −3.4 −1.4 −0.2
HB108G11 AAF61950.1 Phosphoethanolamine N-methyltransferase −0.3 −3.4 −1.0 1.8
HC103C11 P07987 Exoglucanase 2 precursor −1.6 −3.3 1.6 F
SKFAVB07 AAF36731 Ribosomal protein 60S L6 (YL16 like) −1.9 −3.2 −0.8 −2.1
HB107E08 S21386 Chlorophyll a/b-binding protein CP29 precursor −2.7 −3.1 −1.4 0.4
HB103B02 AAB67843.1 Carbamoyl phosphate synthetase large chain −0.8 −3.1 −0.6 −2.6
HB108C03 Q40004 Rubisco small subunit −2.9 −3.0 −2.6 −1.2
HC114E01 T09338 DnaJ-like protein MsJ1 0.1 −2.9 −1.4 0.6
HC102F01 T03263 Calcium dependent protein kinase 7 −0.1 −2.7 0.9 −0.9
HB105H01 T04121 S-2-hydroxy-acid oxidase (peroxisomal) −1.9 −2.6 −1.1 −0.3
HC106C07 AF025292 HAK62 (High affinity potassium transporter) −0.9 −2.6 −0.4 −0.2
HC105B07 AF200531 Cellulose synthase 7 −1.5 −2.5 0.1 0.2
HB105B06 AF024589 Glycine decarboxylase P subunit −2.7 −2.4 −1.7 −0.1
HC106E03 AAK55421 Rieske protein −1.2 −2.4 −1.4 −1.1
HB105C10 T48186 Light inducible protein ATLS1 −1.2 −1.9 −1.5 −0.4

558
Table 3. Continued
Accession GenBank Annotation Leaf Root
number match 6 h 10 h 6 h 10 h
HB102C11 D75542 Unknown (Deinococcus radiodurans) −0.4 0.7 −7.0 0.9
HB104B12 S21150 Unknown (Oryza sativa) −1.0 −0.3 −4.7 10.4
HC106E10 X66376 Jasmonate-induced protein 6/thionin 2.3 3.1 −4.5 −1.3
HB102E09 68090 Rubisco small chain precursor −2.7 −1.4 −4.3 −1.4
HB106A11 P32024 Jasmonate-induced protein 23KD 2.8 0.9 −3.6 2.1
HB108A05 T03962 r40g3 protein −2.5 −1.4 −3.5 F
HB105G03 P41067 Conjugal transfer protein TRAB 0.6 −0.7 −3.2 0.2
HB102B01 T15046 Arginine decarboxylase 1 1.6 −0.6 −3.1 0.0
HB108E01 P31251 Ubiquitin activating enzyme E1 −4.3 0.9 −3.1 −2.5
HB105B09 T02645 Unknown (Arabidopsis thaliana) −0.9 −1.1 −3.0 −1.7
HB102C02 T05934 Jasmonate-induced protein 1 2.8 2.0 −3.0 1.8
HC109A05 P53990 Unknown (Homo sapiens) 0.8 0.3 −3.0 0.8
HB108A08 AF009959 Metallothionein-like protein −2.4 −4.6 −2.8 2.9
HB106C03 AC025783 C-4 sterol methyl oxidase 1.7 1.8 −2.8 −0.2
HB102B09 S22515 Thionin precursor 1.4 2.3 −2.8 −0.5
HB105A10 CAA10497 Unknown (Secale cereale) −0.4 −0.1 −2.7 0.9
HB107D07 S28871 Lipid transfer protein cw18 0.5 0.9 −2.7 −0.8
HB108A06 P13803 Electron transfering flavoprotein −0.4 −1.9 −2.6 −1.1
HC102E01 BAB18760 Beta-cyanoalanine synthase −1.2 F −2.6 −1.0
HB106A08 AJ005840 Thioredoxin M −1.9 −1.2 −2.6 0.0
HC104F03 AC006300 Non-LTR retroelement reverse transcriptase 0.2 2.3 0.6 −6.9HB102F03 AJ243828 Phosphatase 2A regulatory A subunit −1.0 0.0 −0.6 −5.6HB106B03 T06176 Ribulose-bisphosphate carboxylase activase A −2.9 −4.2 −2.2 −4.5HC109H10 AAF69540 Unknown (Arabidopsis thaliana) −0.2 1.2 0.0 −4.4HC113A01 AC007060 Unknown (Arabidopsis thaliana) −0.6 −1.4 F −4.1HB103A01 AK001301 Unknown (Homo sapiens) −0.6 −0.3 −2.4 −3.8HB108F01 – No hit −0.4 −0.2 −1.3 −3.5SKFAVE05 CAA67362 Peroxidase ATP9a −0.8 −0.5 −0.7 −3.3HB108B05 AF003551 Lysine-ketoglutarate reductase/saccharopine dehydrogenase 0.1 0.4 −0.4 −3.2HC113A12 AF250935 Germin protein F −0.6 0.3 0.2 −3.1HB102H11 P30110 Glutathione S-transferase 1 −0.6 0.6 −0.4 −3.1HC114A01 AL509452 Unknown protein (Hordeum vulgare) −0.9 −0.5 −0.5 −3.0HC102B01 AJ006358 Ascorbate peroxidase 0.0 0.3 −0.4 −3.0SKFAVE03 P12940 Trypsin inhibitor 1 (Bowman-Birk type) −0.1 1.6 −0.6 −3.0HC113B01 Q43082 Hydroxymethylbilane synthase −0.4 0.5 F −3.0HC108B01 AL512082 Unknown protein (Hordeum vulgare) −0.8 0.6 −0.3 −2.9HB102H12 AB017042 Glyoxalase I −0.1 −0.9 −0.4 −2.9HC112F01 P49043 Vacuolar processing enzyme precursor −0.4 0.9 −0.4 −2.9HB102F01 T03727 Metallothionein-like protein type 2 1.0 1.2 F −2.7HC106F05 BAB11029 Beta-galactosidase 1.1 −0.9 −0.7 −2.7HB103B02 U40341 Carbamoyl phosphate synthetase large chain −0.8 −3.1 −0.6 −2.6HC109E03 AL511500 Unknown protein (Hordeum vulgare) −1.1 −1.1 −1.2 −2.6HB105B03 X83413 Unknown (herpesvirus-6) −1.7 0.0 −0.5 −2.6HC108B03 AC069273 Unknown (Arabidopsis thaliana) −0.4 1.4 −0.1 −2.6

559
Table 3. Continued
Accession GenBank Annotation Leaf Root
number match 6 h 10 h 6 h 10 h
SKFAVC10 AC027662 Unknown (Oryza sativa) −0.4 −2.1 −0.3 −2.5HB108E01 P31251 Ubiquitin activating enzyme E1 −4.3 0.9 −3.1 −2.5SKFAVG12 BE607400 Unknown (Oryza sativa) −2.3 0.8 −0.9 −2.5
1Values represent log2 ratios of stressed vs. control tissue. Changes in regulation were considered significantat 2.5-fold deviation from the control value (corresponding to log2 = 1.5). ESTs labeled ‘F’ were flaggedbecause of high variability of signal intensity in repeat experiments.
primer, 0.5 mM dATP, dCTP and dGTP, 0.2 mMdTTP, 2 nmol of either Cy3- or Cy5-labeled dUTP and0.5 units of reverse transcriptase (SuperScript II, LifeTechnologies). After incubation at 42 ◦C for 1.5 h,RNA was degraded by adding RNase H. Fluorescentlylabeled target cDNAs were cleaned (Concert RapidPCR Purification System, Life Technologies) and pre-cipitated overnight at −20 ◦C after the addition of 0.1volume of 3 M sodium acetate (pH 5.2) and one vol-ume of isopropanol. The precipitate was collected bycentrifugation, washed with 70% ethanol, dried andre-suspended in 15 µl of hybridization buffer contain-ing 0.25% non-fat dry milk, 5× SSC, 0.1% SDS and50% formamide.
Hybridization and data analysis
Microarrays were sealed with cover slips after the ap-plication of denatured target cDNAs from both controland treated plant tissues, which had been labeled bythe incorporation of Cy3 or Cy5 nucleotides, respec-tively. Hybridization was carried out at 42 ◦C for14–16 h in chambers containing 2× SSC solution.After hybridization, the slides were incubated in 2×SSC and 0.5% SDS for 5 min followed by two incu-bations of 5 min each in 0.5× SSC. Slides were driedby centrifugation.
Microarrays were scanned using a ScanArray 3000(GSI Lumonics, Watertown, MA) and analyzed byImaGene III Software (BioDiscovery, Los Angeles,CA). Local background was subtracted from the valueof each spot on the array. Spots showing low signalvalues, covered with dust particles or having irregularshapes, as well as spots in high background areas wereflagged as candidates for exclusion and, after furtheranalysis, excluded from the data analysis. Normaliza-tion of the signal intensities was carried out accordingto Deyholos and Galbraith (2001). Changes in sig-nal intensity between stress and control experimentsexceeding a 2.5-fold or higher difference in repeat ex-
periments were considered significant. An initial nor-malization between the Cy3 and Cy5 emission chan-nels was achieved by adjusting the signal intensityof exogenously added non-plant control genes. Tran-script regulation is expressed as the ratio of intensitiesbetween stress and control.
Real-time quantitative PCR
Real-time PCR amplifications were carried out withtwo genes that showed up- and down-regulation, re-spectively. The α-tubulin 2 gene (forward primer, 5′-AGTGTCCTGTCCACCCACTC-3′; reverse primer,5′-AGCATGAAGTGGATCCTTGG-3′) was used as acontrol in the PCR. The transcript for the up-regulatedgene was the cell death suppressor protein L1s1 (for-ward primer, 5′-GCCAGAAGCATTTCGTGTTT-3′;reverse primer, 5′-TGGTTTTCAACCCGACTTTT-3′), and for the down-regulated gene was the tran-script for the light-inducible protein ATLS1 (for-ward primer, 5′-GGCTGAACCCTGATGTGAAC-3′;reverse primer, 5′-TGGCCATTAAACTGACACGA-3′). L1s1 and ATLS1 were amplified by Smart-CyclerReal-Time PCR (Cepheid, Sunnyvale, CA) in a 25 µlreaction volume containing 2.5 mM dNTP solution,1× reaction buffer for reverse transcriptase, 10 mM ofeach primer, 250 ng total RNA, 2.5 mM MgCl2, 10×SYBR Green I (Sigma), 0.2 units of Taq DNA Poly-merase (Sigma) and 0.5 units of StrataScript ReverseTranscriptase (Stratagene). Reverse transcription wascarried out at 55 ◦C for 10 min followed by annealingat 55 ◦C for 45 cycles. Results were analyzed accord-ing to the threshold value for RNA from stressed andcontrol tissues.
560
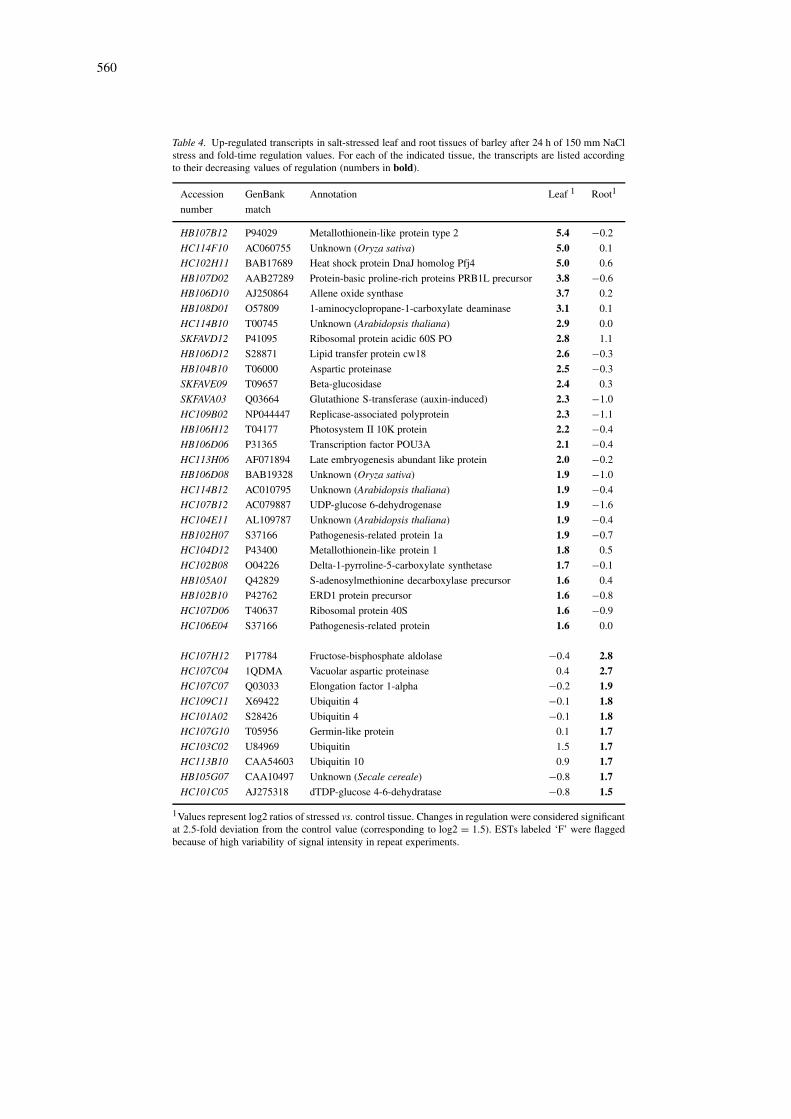
Table 4. Up-regulated transcripts in salt-stressed leaf and root tissues of barley after 24 h of 150 mm NaClstress and fold-time regulation values. For each of the indicated tissue, the transcripts are listed accordingto their decreasing values of regulation (numbers in bold).
Accession GenBank Annotation Leaf 1 Root1
number match
HB107B12 P94029 Metallothionein-like protein type 2 5.4 −0.2
HC114F10 AC060755 Unknown (Oryza sativa) 5.0 0.1
HC102H11 BAB17689 Heat shock protein DnaJ homolog Pfj4 5.0 0.6
HB107D02 AAB27289 Protein-basic proline-rich proteins PRB1L precursor 3.8 −0.6
HB106D10 AJ250864 Allene oxide synthase 3.7 0.2
HB108D01 O57809 1-aminocyclopropane-1-carboxylate deaminase 3.1 0.1
HC114B10 T00745 Unknown (Arabidopsis thaliana) 2.9 0.0
SKFAVD12 P41095 Ribosomal protein acidic 60S PO 2.8 1.1
HB106D12 S28871 Lipid transfer protein cw18 2.6 −0.3
HB104B10 T06000 Aspartic proteinase 2.5 −0.3
SKFAVE09 T09657 Beta-glucosidase 2.4 0.3
SKFAVA03 Q03664 Glutathione S-transferase (auxin-induced) 2.3 −1.0
HC109B02 NP044447 Replicase-associated polyprotein 2.3 −1.1
HB106H12 T04177 Photosystem II 10K protein 2.2 −0.4
HB106D06 P31365 Transcription factor POU3A 2.1 −0.4
HC113H06 AF071894 Late embryogenesis abundant like protein 2.0 −0.2
HB106D08 BAB19328 Unknown (Oryza sativa) 1.9 −1.0
HC114B12 AC010795 Unknown (Arabidopsis thaliana) 1.9 −0.4
HC107B12 AC079887 UDP-glucose 6-dehydrogenase 1.9 −1.6
HC104E11 AL109787 Unknown (Arabidopsis thaliana) 1.9 −0.4
HB102H07 S37166 Pathogenesis-related protein 1a 1.9 −0.7
HC104D12 P43400 Metallothionein-like protein 1 1.8 0.5
HC102B08 O04226 Delta-1-pyrroline-5-carboxylate synthetase 1.7 −0.1
HB105A01 Q42829 S-adenosylmethionine decarboxylase precursor 1.6 0.4
HB102B10 P42762 ERD1 protein precursor 1.6 −0.8
HC107D06 T40637 Ribosomal protein 40S 1.6 −0.9
HC106E04 S37166 Pathogenesis-related protein 1.6 0.0
HC107H12 P17784 Fructose-bisphosphate aldolase −0.4 2.8HC107C04 1QDMA Vacuolar aspartic proteinase 0.4 2.7HC107C07 Q03033 Elongation factor 1-alpha −0.2 1.9HC109C11 X69422 Ubiquitin 4 −0.1 1.8HC101A02 S28426 Ubiquitin 4 −0.1 1.8HC107G10 T05956 Germin-like protein 0.1 1.7HC103C02 U84969 Ubiquitin 1.5 1.7HC113B10 CAA54603 Ubiquitin 10 0.9 1.7HB105G07 CAA10497 Unknown (Secale cereale) −0.8 1.7HC101C05 AJ275318 dTDP-glucose 4-6-dehydratase −0.8 1.5
1Values represent log2 ratios of stressed vs. control tissue. Changes in regulation were considered significantat 2.5-fold deviation from the control value (corresponding to log2 = 1.5). ESTs labeled ‘F’ were flaggedbecause of high variability of signal intensity in repeat experiments.

561
Table 5. Down-regulated transcripts in salt-stressed leaf and root tissues of barley after 24 h of 150 mm NaCl stress andfold-time regulation values. The transcripts are listed according to their decreasing values of regulation (numbers in bold).
Accession GenBank Annotation Leaf1 Root1
number match
HB102D03 AAB71969 Auxin-induced protein −8.3 −0.5
HC109H01 AL162508 Unknown (Arabidopsis thaliana) −6.8 0.2
HC107F09 AC007858 Unknown (Oryza sativa) −6.8 −0.8
HC112D03 T09657 Beta-glucosidase −6.6 0.1
HC109H03 JQ2361 Wheat aluminum-induced protein wali5 −6.1 0.3
HC105F01 Y08501 ORF107a (Arabidopsis thaliana) −4.8 0.2
HC109F09 P46518 Late embryogenesis abundant protein LEA14-A −4.8 −0.3
HC112B09 AAG52429 Aminopeptidase N −4.7 −0.9
HC109H10 AAF69540 Unknown (Arabidopsis thaliana) −4.7 −0.4
HC101B09 O49203 Nucleoside diphosphate kinase III precursor −4.4 −0.8
HC109D01 T14189 Unknown (Arabidopsis thaliana) −4.3 −0.1
HC107D01 S34285 Ubiquitin −4.2 −0.2
HC103B10 S30569 Glutamine synthetase −4.1 1.2
HB105D02 AF113541 Ethylene response sensor (putative) −4.0 −0.4
HB108C11 AAF07846 Aminotransferase (putative) −3.8 F
HC107H01 P40392 Ras-related protein RIC 1 −3.7 −0.3
SKFAVA11 CAA75793 Sucrose synthase 2 −3.6 0.2
HC110E01 AAK20858 Fasciclin-like arabinodalactan-protein 2 −3.5 −1.0
HC107H03 AAG09228 Coatomer alpha subunit −3.5 0.5
HC105B05 T36632 Oxidoreductase −3.4 −0.1
HC105D06 BG355459 Unknown protein (Hordeum vulgare) −3.4 0.5
HB107A01 AJ275310 Unknown (Cicer arietinum) −3.4 −0.5
HC101D02 T02667 Proteinase inhibitor −3.3 −0.6
HC101F12 T05276 Unknown (Arabidopsis thaliana) −3.3 0.4
SKFAVG12 BE607400 Unknown (Oryza sativa) −3.3 −0.5
HC108B05 – No hit −3.3 −0.5
HC108E01 AE003723 Unknown (Drosophila melanogaster) −3.3 −0.2
SKFAVH12 BE040455 Unknown (Oryza sativa) F −4.3HB108G10 S28871 Lipid transfer protein cw18 0.3 −2.1SKFAVA01 AAD50376 Ripening related protein −0.3 −1.7HB105C02 AL078637 Unknown (Arabidopsis thaliana) 0.5 −1.7HC106C05 L12707 Photosystem 1 −0.7 −1.7HB108C01 AAG00249 Unknown (Arabidopsis thaliana) −0.4 −1.7HC110D04 P49043 Vacuolar processing enzyme precursor 0.2 −1.7HC107B12 AC079887 UDP-glucose 6-dehydrogenase 1.9 −1.6HC106C09 Y11277 Alpha-amylase F −1.6
1Values represent log2 ratios of stressed vs. control tissue. Changes in regulation were considered significant at 2.5-folddeviation from the control value (corresponding to log2 = 1.5). ESTs labeled ‘F’ were flagged because of high variabilityof signal intensity in repeat experiments.
Results and discussion
Physiological parameters and drought-specifictranscript profiles
For the drought-shock experiment, samples fromstressed and control tissues were taken at the same
time points to eliminate variation due to diurnalchanges in gene expression. During that time period,relative water content of the plants declined to ca. 90%within the initial 4 h, and then more rapidly to ca. 70%(6 h) and 64% (10 h). Replanting after 10 h of droughtindicated that the plants were able to survive and re-

562
Table 6. Transcripts with up- or down-regulation under drought and salt stress experiments.
Accession GenBank Annotation Drought Salt
number match
6 h 10 h 6 h 10 h 24 h 24 h
leaf leaf root root leaf root
With up-regulationHB107D05 AJ250864 allene oxide synthase 1 2.7 0.9 0.3 1.8 3.7 0.2
HB108B04 P94029 metallothionein-like protein 2.7 1.8 −1.9 0.9 5.4 −0.2
HB102B10 P42762 ERD1 protein precursor 0.6 2.8 −0.8 1.5 1.6 −0.8
HC102B08 O04226 �1-pyrroline-5-carboxylate synthetase 2.4 2.3 −1.7 1.2 1.7 −0.1
HC107G10 T05956 germin-like protein −0.3 0.4 1.8 2.5 0.1 1.7With down-regulationHC106C09 Y11277 α-amylase −1.5 −4.1 −2.2 −0.1 F −1.6HB107D07 S28871 lipid transfer protein cw18 0.5 0.9 −2.7 −0.8 0.3 −2.1HC109H10 AC06922 ABC transporter −0.2 1.2 0.0 −4.4 −4.7 −0.4
HC112F01 P49043 vacuolar processing enzyme precursor −0.4 0.9 −0.4 −2.9 0.2 −1.7SKFAVG12 BE607400 unknown (Oryza sativa) −2.3 0.8 −0.9 −2.5 −3.3 −0.5
Data are log2 ratios of stressed vs. control tissue. Changes in regulation were considered significant at 2.5-fold deviation fromthe control value (corresponding to log2 = 1.5). ESTs labeled ‘F’ were flagged because of high variability of signal intensityin repeat experiments.
sume growth but leaves that had already developed didnot recover (not shown). As an additional physiolog-ical parameter, the composition of free amino acidswas determined in whole plants. Within 10 h, the totalamount of amino acids had increased more than 2.5-fold, from 8008 to 22 979 pmol per 50 µl total aminoacids. A substantial proportion of the increase was inproline (from 28 to 5711 pmol per 50 µl) which, af-ter 10 h of drought, amounted to 25% of all aminoacids. Similar stress-dependent increases in prolinehave been observed in many plants (Yoshiba et al.,1997).
Two cDNA libraries, from roots and leaves, re-spectively, were generated and the DNA of ca. 2200clones was sequenced. Redundant clones were elim-inated before printing which resulted in 1463 DNAelements from drought-stressed leaf and root tissuesincluded on the slides (Table 1). The transcript pro-file sampled here is small, includes mainly abundanttranscripts, and is characterized by the large num-ber of ESTs related to cell defense functions, whichamounted to almost 10% of all transcripts. The lownumber of transcripts in the photosynthesis category(2.8% of ESTs in leaves) supports that these cloneswere indeed derived from stressed plants (Table 1).In unstressed plants, about 15% of all leaf transcriptscan typically be categorized as photosynthesis-related,but in drought-stressed leaves this percentage is muchlower. This value (Table 1) includes transcripts for
functions of light reactions only. When other chloro-plast functions are counted in addition, the valueincreases to ca. 5% of the leaf transcripts. At least38% of all transcripts are functionally unknown. Theyare grouped into two categories, ‘unknown’ and ‘nohit’, the latter indicating that transcripts in this classhave not previously been described from other organ-isms. In reality, however, the number of functionallyunknown transcripts is larger because many transcriptsare assigned to categories based on domain homolo-gies with other deduced protein sequences while theiractual function has not been documented.
Microarray hybridization analysis
The result of a hybridization to ESTs derived from theroot and leaf cDNA libraries is shown in Figure 1.DNA elements were deposited in quadruplicate: theaverage signal intensities were determined after sub-traction of the local background intensity. The figurereveals the variability that is typically obtained whichmay lead to difficulties in interpreting hybridizationresults when spots are either too small or not well de-fined. Spots with aberrant size, washed-out spots, orunevenly hybridized spots were flagged and excludedfrom the analyses. Such variability depends on thepurity of the DNA samples (e.g., ion content), slidesurface properties, solubilization of the target probe,and quality of the pins used to deposit the DNA onthe glass surface. The Cy3/Cy5 signal intensities were

563
Table 7. Quantitative determination of transcript abundance. The change in transcriptabundance in leaf tissue during drought stress observed by microarray analysis wasconfirmed by duplicate real time PCR. The threshold values were used for quantitativeexpression of PCR results. α-tubulin 2 gene (specific primers Tub2) was used as control,cell death suppressor protein L1s1 (specific primers IIs1) for confirming up-regulation andlight-inducible protein ATLS1 (specific primers Atls1) for down-regulation. A. Thresholdvalues of replicate real time PCR. B. Quantitative comparison of microarray and PCRresults.
A
Tissue Primer Exp. 1 Exp. 2
threshold value threshold value
6 h drought-stressed leaf Tub2 13.8 14.2
Control leaf for 6 h drought stress Tub2 13.5 13.9
10 h drought-stressed leaf Tub2 14.0 14.5
Control leaf for 10 h drought stress Tub2 13.3 13.8
6 h drought-stressed leaf lls1 11.6 11.8
Control leaf for 6 h drought stress lls1 14.9 15.3
10 h drought-stressed leaf lls1 10.8 11.1
Control leaf for 10 h drought stress lls1 15.8 16.4
6 h drought-stressed leaf Atls1 16.1 15.6
Control leaf for 6 h drought stress Atls1 14.7 15.0
10 h drought-stressed leaf Atls1 16.6 16.5
Control leaf for 10 h drought stress Atls1 15.0 15.1
B
Tissue Primer PCR Microarray
6 h drought-stressed leaf vs. control Tub2 0.8 1.0
10 h drought-stressed leaf vs. control Tub2 0.6 0.8
6 h drought-stressed leaf vs. control lls1 10.8 2.3
10 h drought-stressed leaf vs. control lls1 36.2 3.5
6 h drought-stressed leaf vs. control Atls1 −1.9 −2.3
10 h drought-stressed leaf vs. control Atls1 −2.8 −1.9
adjusted with the help of exogenously added controlgenes which had been placed in different sectionsof the microarray slides to compensate for variablebackground levels (see Materials and methods). Acomparison of hybridization intensities by using la-beled root (Cy3) and leaf (Cy5) targets is presentedin Figure 2. The distribution of log2 signal intensitiesindicated that most of the transcripts on the array arenot specific to either leaf or root tissue. More than 90%of all transcripts are equally expressed in both tissues.Examples for leaf-specific transcripts are an unknownprotein (HB104B12; S21150), a metallothionein-like
protein (HB108A08; AF009959), a membrane protein(HB108C09; AAF18512) and an ADP/ATP translo-case (HC107E02; S33630). Root-specific transcriptsare glyoxalase-I (HB102H12; AB107042), a non-LTR retroelement reverse transcriptase (HC104F03;AC006300), a phosphatase-2A regulatory subunit(HB102F03; AJ243828) and an unknown protein(HC109H10; AAF69540).
Hybridizations with RNA extracted from leaf androot tissues of either drought-stressed (6 and 10 h)or salt-stressed (24 h, 150 mM NaCl) plants areshown in Figures 3–5, presenting the normalized log-

564
Figure 1. Microarray hybridization to cDNAs immobilized on glass slides. A segment of a microarray slide is shown after hybridization withCy5-labeled-dUTP target from drought-stressed roots (10 h) (A) and Cy3-labeled-dUTP target from untreated roots (B). The saturation ofsignals with Cy3- and Cy5-labeled targets is represented by colors (blue, green, red, yellow to white), where blue is for low signal intensity andwhite for high intensity.
Figure 2. Tissue specificity of transcript expression. Drought stress(10 h) hybridization intensities on log2 basis of root samples com-pared to leaf samples. The distribution of signal ratios indicates thatmost transcripts used in these experiments are not specific for eithertissue.
10 hybridization intensity ratios of stressed vs. controltissues plotted against the EST number. We consid-ered a 2.5-fold change (corresponding to 0.6 log10 or1.5 log2) in the stressed tissue as significant for up-and down-regulation. Transcripts above or below theboxed area (Figures 3–5) represent those exhibitingsignificant changes in expression following stress. Inorder to ascertain the reproducibility of the changesin transcripts of a particular sample, mRNAs from thesame isolation and labeling reaction were compared inrepeated hybridizations (Figures 3B and C; Figures 5B
and C). The conformity of up- and down-regulationin repeat experiments was c.a. 50% for all transcriptsshowing significant changes in regulation, i.e., abouthalf of the transcripts that we identified as significantlyaltered in response to drought or salinity showed thesame regulation in repeat experiments. This percent-age was the same irrespective of whether the mRNAderived from the same or different experiments. How-ever, a relaxation of the significance level to a 1.6-foldchange (Kawasaki et al., 2001) indicated that morethan 90% of the transcripts which showed either up-or down-regulation in one hybridization, did likewisein repeat experiments. A similar degree of variabil-ity has been observed for rice salinity-stress-regulatedtranscripts (Kawasaki et al., 2001).
Up-regulated transcripts in drought-stressed leaves
Examples of significantly drought-affected transcriptsin barley are given in Tables 2 and 3. Highly up-regulated at the 6 h time point of the drought treatmentin leaves (Table 2) are transcripts for the biosynthe-sis of jasmonate (e.g., several allene oxide synthases),which is well-known as a signal in pathogen defenseand under drought conditions (Reymond and Farmer,1999; Wierstra and Kloppstech, 2000). Strongly

565
Figure 3. Hybridization ratios (log10) for drought-stressed leaf tissues. A. 6 h drought-stressed leaf tissue vs. control leaf target after normal-ization. B. 10 h drought-stressed leaf tissue vs. control after normalization. C. A repeat experiment for 10 h drought-stressed leaf tissue vs.control with mRNA from the same sample and labeling is shown. Boxed areas indicate the interval (−2.5- to 2.5-fold regulation) in whichchanges in expression were considered not significant.
increased leaf transcripts encode known jasmonate-induced proteins (JIPs) and a methyl-jasmonate in-ducible lipoxygenase reported earlier (Voros et al.,1998). Two arginine decarboxylases are induced (at6 and 10 h in leaves and also at 10 h in roots), pos-sibly reflecting the altered synthesis of polyamines
that are observed in many stressed plants (Masgrauet al., 1997; Soyka and Heyer, 1999). Lipoxyge-nase and an equally strongly induced fatty acid α-oxidase may be in the signal transduction pathwaythat is regulated by jasmonates. Finally, LEA/dehydrinprotein and metallothionein encoding transcripts, as

566
Figure 4. Hybridization ratios (log10) for drought-stressed root tissues. A. 6 h drought-stressed root tissue vs. control after normalization.B. 10 h drought-stressed root tissue vs. control after normalization. Boxed areas indicate the interval (−2.5- to 2.5-fold regulation) in whichchanges in expression were considered not significant.
well as 1-pyrroline-5-carboxylate synthetase are up-regulated, the latter encoding a rate-limiting enzymein proline biosynthesis. Free proline does indeed ac-cumulate rapidly (see above). For a number of other6 h-induced transcripts, no function can be ascertainedalthough functions in stress responses, for example,for aldehyde dehydrogenase, asparagine synthetase, acytochrome P450 enzyme or a receptor-like protein ki-nase can be postulated. Only a more detailed analysis,which was not the purpose of this study, will showtheir precise functions. We point out, however, that thelibrary for the 6 h time point of drought stress includes,among the less strongly up-regulated transcripts, othercDNAs that could potentially have a large effect onthe response and defense capacity of the plants. Fu-
ture studies should attempt to isolate additional andless-abundant transcripts from this library.
The leaf 10 h stress time point shows a differentprofile in terms of up-regulated transcripts (Table 2).Transcripts for jasmonate-responsive proteins are lessprominent, although several JIPs are still among themost highly up-regulated transcripts; this also ap-plies to LEA/dehydrins and metallothionein-like tran-scripts, and for proline or polyamine biosynthesisfunctions. At this time point, the first ABA-inducedprotein transcript is found to be up-regulated, present-ing good indications for jasmonates and ABA servingin separate signal transduction pathways. Also, atthe 10 h time point, transcripts emerge that encodediverse functions, whose mechanisms and possible

567
significance in plant stress tolerance are unknown.The unknown putative functions are indicated by de-scriptive labels, such as putative RNA-binding protein,proteinase inhibitor-related protein BSi1, aluminum-induced protein or thionin precursor.
Up-regulated transcripts in drought-stressed roots
In leaves, about half of the up-regulated transcripts atthe 6 h time point are also among the most highlyinduced transcripts after 10 h, but in roots a verydifferent pattern is observed. First, the root and leaf ex-pression profiles are fundamentally different (Table 2).Second, the 6 h profile of up-regulated transcripts in-cludes many ESTs that are also strongly up-regulatedat 10 h, yet at 10 h an additional set of transcripts isup-regulated; those transcripts are at background levelat 6 h. Also, analogous to what has been reportedfor salt stress-dependent transcript regulation in rice(Kawasaki et al., 2001), up-regulated transcripts forwhich no function is known or which are placed intothe ‘no hit’ category are more often encountered inroots than in leaves, possibly reflecting the relativepaucity of studies with plant roots. Several highly up-regulated transcripts constitute putative signal trans-duction intermediates or producers of secondary mes-sengers (other than the jasmonate pathway). Othersare known for their defense (including pathogen de-fense) functions, in scavenging of oxygen radicalspecies or in redox control, and in metabolic adjust-ments to stress (e.g., nitrogen metabolism [glutamatesynthase] and mitochondrial respiration [malate de-hydrogenase]). The functions of yet other proteins,should the up-regulated transcripts be translated, re-main obscure. This is, for example, the case forthe transcript of a water channel protein (similar toBAB09839) because the increased synthesis of a chan-nel that facilitates water movement in drought-stressedroots could be considered counterproductiveunless thereal function of such channels is different from watertransport.
Down-regulation of transcripts upon drought shock
Significantly down-regulated transcripts are compiledin Table 3. From hybridization with RNA fromdrought-stressed leaves, down-regulation was obviousfor a number of basic biosynthetic functions, includ-ing photosynthesis and photorespiration, and aminoacid and carbohydrate metabolism. Also, a high-affinity potassium transporter, several protein kinasesand DnaJ-like transcripts were down-regulated.
Although Tables 2 and 3 provide a glimpse ofthe many different functions regulated under stressconditions, their role and importance in tolerance orsensitivity is impossible to judge from the limited se-lection of ESTs that are contained on the microarrayslides. With approximately 1400 ESTs, our hybridiza-tions covered about 10% or less of all transcriptsexpressed in the leaf or root tissues. This numberis based on experiments on renaturation kinetics, inwhich it had been estimated that roots and leaves mayexpress around 8000 transcripts, each with about onethird of the transcripts expressed similarly in bothtissues (Kamalay and Goldberg, 1980).
The response to salt shock in comparison to droughtstress
The results of the hybridization of transcripts from24 h, 150 mM NaCl-stressed leaf and root tissuesshowed the fundamentally different stress responseprograms of these tissues to the two stress factorsconsidered in our study (Tables 4 and 5). There wasvery little overlap among both the most highly up-or down-regulated transcripts in the two tissues whencomparing high salinity and lack of water. Tran-scripts which are equivalently regulated in drought andsalinity conditions are compiled in Table 6.
An enzyme in the biosynthesic pathway leadingto jasmonate (allene oxide synthase 1) is among themost significantly up-regulated transcript under bothconditions. This may indicate similar pathways relatedto water deficiency reported through a jasmonate-based signal. A �1-pyrroline-5-carboxylate syn-thetase which largely controls proline de novo synthe-sis is also up-regulated in response to both stresses;in fact, barley accumulates proline during droughtand salinity episodes (Stewart and Voetberg, 1985;Stewart et al., 1986). Several other transcripts, andin most cases also the encoded proteins, have beenshown to accumulate under abiotic stress conditions(metallothionein-like protein, ERD1, germin-like pro-tein; Lane et al., 1992; Hsieh et al., 1995; Hsiehet al., 1996; Nakashima et al., 1997) and it shouldnot be surprising that they are also reported by our mi-croarray hybridizations. What exactly their functionsare, with their up-regulation most likely related to wa-ter deficit, is unknown. Comparably down-regulatedtranscripts under both stress conditions include trans-port proteins such as a lipid transfer protein and anABC transporter. Others include an unknown pro-tein for which a rice homologue has been found and

568
Figure 5. Hybridization ratios on a log10 basis for 24 h 150 mM salt-stressed tissues. A. Leaf tissue vs. its control after normalization. B. Roottissue vs. its control after normalization. C. Repeat experiment for root tissue vs. its control in which mRNA from different extractions wasused. Boxed areas indicate the interval (−2.5- to 2.5-fold regulation) in which changes in expression were considered not significant.

569
this transcript is up-regulated in both rice and bar-ley (Kawasaki et al., 2001). In fact, for transcriptswhose sequences are conserved by more than ca.87% between different grasses, hybridization of bar-ley target first-strand cDNA to rice printed microarrayelements produced the same signal as hybridizationbetween homologous probes and targets. Also, a vac-uolar processing enzyme of unknown specific functionis strongly induced.
Apart from the similarly regulated transcripts listedin Table 6, drought and salinity affect very differenttranscripts. Regulation differences of genes under dif-ferent stress conditions indicate the difference of plantstress response to changes in environmental condi-tions. This difference is not just related to the stresstype and conditions but also the species and degree oftolerance of the plant. For this experiment we used arelatively drought-tolerant barley species which alsoshowed high tolerance to elevated salinity. The condi-tions (24 h, 150 mM NaCl) used here did not severelyaffect the plants, which had already recovered after24 h, as also indicated by the microarray analysis. Itmay be that the pronounced natural salt tolerance ofthis line is responsible for the relatively small numberof regulated transcripts and also for the fact that wedid not observe much overlap between drought- andsalinity-regulated transcripts.
How closely do microarrays report the induction orrepression of transcripts?
As a control for the validity of microarray results, PCRamplifications were carried out for genes that showedup- and down-regulation, respectively (Table 7). Sev-eral studies have already shown that a tight correlationexists between the changes reported by RNA-blot hy-bridization analyses and microarray data (e.g., Ruanet al., 1998; Reymond et al., 2000; Kawasaki et al.,2001; Yale and Bohnert, 2001). One potential prob-lem of microarrays is a relatively narrow dynamicrange which is due to the low level of DNA deposited.Thus, abundant transcripts or transcripts that increasedramatically under the experimental conditions cho-sen may not report true amounts or changes in theamounts, as was seen for several of the highly abun-dant transcripts shown in Figure 2. Likewise, for raretranscripts, the ratio of change may not reflect realitybecause signal intensities close to background levelscannot be recorded accurately with the microarrays.
Real-time PCR is a novel technique suitable for si-multaneous amplification and detection (Livak et al.,
1995). The basic PCR amplification method is usedin combination with intercalating dyes, which pro-vide a measure of the amount of double-stranded DNAobtained after each amplification cycle. The data out-put consists of a baseline, representing an unboundprobe that may form double-stranded segments orautofluorescing components during early amplifica-tion steps, and a log-linear phase of increasing signalrepresenting the exponential amplification of the de-sired product. A ‘threshold value’ at which amplifica-tion products of a reaction become detectable providesthe basis of quantification. This value depends on theinitial amount of target present in the reaction that canthus be calculated. For a robust and reliable quantifi-cation of amounts, repeat experiments and a standardcurve based on a known amount of target are neces-sary. Several studies in the laboratory indicated thatmicroarray hybridizations generate data, with respectto regulatory changes, comparable to data obtainedby qualitative PCR and RNA-blot analyses (Kawasakiet al., 2001; Yale and Bohnert, 2001; M. Deyholos,C.B. Michalowski, D.W. Galbraith and H.J. Bohnert,in preparation). Microarray analyses tend to reportlower differences than the other techniques and in veryfew instances (e.g., Yale and Bohnert, 2001) resultsdiverge. In those cases, divergence is due to very lowtranscript abundance.
A tubulin EST was chosen as an example of atranscript that did not change in abundance accord-ing to the microarray data during drought stress.For this transcript, tub2, both techniques indicateno changes or only non-significant changes (down-regulation) during stress. Differences in repeat exper-iments, not exceeding a factor of 2, seem to reflectdifferences in RNA quality and possible systematicerrors. In the case of the tub2 transcript, the differ-ences between PCR and microarray results are notsignificant and both techniques confirm that transcriptamounts for tub2 do not change under our experimen-tal conditions. The up-regulated IIs1 (average increase3-fold by microarray analysis), encoding a cell deathsuppressor protein, showed much higher up-regulationby quantitative PCR (more than 10-fold) than by mi-croarray hybridization. Since microarray analyses canoverestimate differences for transcripts whose sig-nal intensities are close to background values, it isimportant to consider absolute signal strength. Mis-calculation seems not to have been a problem becausethe signal for IIs1 in the unstressed state was about 10times above background and increased during stress,indicating that a real increase was measured.

570
Finally, ATLS1, coding for a light-inducible, down-regulated protein, showed closely matching transcriptamounts with both techniques; in both cases down-regulation was observed. These genes were selectedbecause they were unique transcripts based on ourEST analysis and all three transcripts belonged to ap-proximately the same abundance class. Likely, othermembers of presumptive gene families, we argued,would not distort the results. In general, the resultsobtained with real-time PCR amplification (assum-ing identical amplification efficiency) agreed with thetrend observed in microarray hybridizations. The real-time quantitative PCR amplification technique couldthus replace RNA-blot analyses and, once sufficientlyminiaturized, might be able to replace microarrayhybridizations.
Conclusions
This first microarray analysis of barley transcripts,which are putatively involved in drought toleranceresponses, is merely a beginning. We focused on aset of transcripts, which were obtained from cDNAlibraries of shock-stressed young barley plants to de-termine the feasibility of the approach and to obtaindata which, we hope, could facilitate future work inthis direction. Admittedly, the shock treatment ad-ministered here is not comparable to a field situation,and, thus, the results might be of only limited valuefor crop physiologists and breeders. However, hav-ing identified transcripts responsive to shock treatmentshould provide clues about severe stress situationswith a database available for comparison with datafrom stress conditions as they develop in the field nat-urally. Even though the collection of transcripts usedhere was small, we can draw several conclusions fromthe results.
Drought and salinity stresses affect largely differ-ent sets of transcripts. Yet the differences are oftenin isoforms of transcripts for similarly encoded func-tions, i.e., the same function seems to be requiredby the plant to adapt to more than one abiotic stress.The differences then should lie in different activationcircuits either through alternative signal transduction,separate transcription factors, and/or altered promoterstructures. Disregarding several ESTs in the ‘func-tionally unknown’ or ‘no hit’ categories and knownregulated proteins with a general, not well-defined,defense function, the similarities are in a few signaltransduction intermediates, among which are mem-
bers of the PP2A and PP2C gene families. The PP2Cinduced in our study is homologous to the ArabidopsisABI1/2 genes.
One result deserves discussion: the utility of abarley EST microarray for monitoring expressionchanges in other grass species. For example, in bothbarley and rice, the transcript for a metabolite fa-cilitator protein (WCP-IV, a putative water channelprotein) showed up-regulation under salt-stress con-ditions. This up-regulation was observed in rice afteran adaptation period of several days (Kawasaki et al.,2001) but up-regulation was observed in barley within24 h after stress imposition indicating, presumably, therelatively higher stress tolerance of the barley line.
Among repressed transcripts in barley and rice,transcripts for a glycosylation enzyme showedvery similar behavior. A transcript encoding ametallothionein-like protein (barley EST), differentfrom an up-regulated transcript encoding this function,was down-regulated; this distinct behavior is found inbarley and rice (Kawasaki et al., 2001). Also down-regulated in both grasses is the transcript encodinga high-mobility-group protein, HMGd1, whose sig-nal intensity declined by more than a factor of four.Finally, a highly expressed transcript encoding a per-oxidase, ATP9a, was equally down-regulated. For allthe outlined examples, the transcripts showed signalintensities that were significantly above backgroundsuch that the systematic error could be considerednegligible.
Even more pronounced is the salinity stress-dependent concomitant up- and down-regulation inbarley and rice. The most highly regulated tran-scripts in both species are a metallothionein-like pro-tein, β-glucosidase, glutathione S-transferase (auxin-induced), S-adenosylmethionine decarboxylase, and aribosomal protein 40S and elongation factor 1-α. Co-incident regulation was also observed for significantlydown-regulated transcripts in both grass species: anucleoside diphosphate kinase III precursor, amino-transferase, and sucrose synthase 2.
When focusing on the drought-induced transcriptsin barley roots and leaves, we list the roughly 100most strongly up-regulated ones, although more tran-scripts are included in our complete analysis. Amongthose, about half are functionally unknown (and anumber of these transcripts have not been reportedas drought-induced). In a global sense, ca. 20% ofthe transcripts included in our microarray are eitherup- or down-regulated significantly in this populationof relatively abundant transcripts from non-subtracted

571
cDNA libraries. Is such a small array sufficient forproviding meaningful information from a breedingstandpoint? Clearly, we have cloned a large num-ber of the barley transcripts that had already beenidentified as drought-stress induced. Those and theadditional drought-regulated transcripts will now beanalyzed with target RNAs from barley plants andbreeding lines that experienced natural drought con-ditions. It may be that we will need additional ESTsthat are selected from the transcript profiles from dif-ferent developmental stages, and that we will needto add transcripts for selected stress sensing, signal-ing, and/or biochemical pathways to better understanddrought through microarray analysis and the correl-ative quantitative transcript profiles (CQTPs) which,coupled with an appropriate QTL analysis, could pos-sibly lead to the identification of candidate genes foragronomically valuable traits.
Acknowledgments
We are indebted to Dr K. Krupinska, Institut fürPflanzenökologie, Universität Giessen, Germany, forproviding clones of barley cDNAs used as controls.We thank Drs Shinji Kawasaki for help and discus-sions, Caetlin Murphy, Christina Normand and ChrisPalacio for help with the libraries and DNA isolationand Ryan Kelley for annotations and bioinformaticsanalysis. The work was supported by a travel fellow-ship to Z.N.O. from TUBITAK, MRC, RIGEB, Ko-caeli, Turkey, and by a contribution of the Universityof Bologna, Italy, to R.T. and V.T. (InterdepartmentalCentre for Biotechnology). The work is supported by agrant from the US National Science Foundation (PlantGenome Program, NSF DBI 98-13360).
References
Acevedo, E. 1987. Gas exchange of barley and wheat genotypesunder drought. In: Cereal Improvement Program Annual Report1987. ICARDA, Aleppo, Syria, pp. 101–116.
Altinkut, A., Kazan, K., Ipekci, Z. and Gozukirmizi, N. 2001. Tol-erance to paraquat is correlated with the traits associated withwater stress tolerance in segregating F2 populations of barley andwheat. Euphytica, 121: 81–86.
Amtmann, A. and Sanders, D. 1999. Mechanisms of Na+ uptake byplant cells. Adv. Bot. Res. 29: 75–112.
Apse, M.P., Aharon, G.S., Snedden, W.A. and Blumwald, E.1999. Salt tolerance conferred by overexpression of a vacuolarNa+/H+-antiport in Arabidopsis. Science 285: 1256–1258.
Bajaj, S., Targolli, J., Liu-Lifei, Ho, T.H.D. and Wu, R. 2000.Transgenic approaches to increase dehydration-stress tolerancein plants. Mol. Breed. 5: 493–503.
Blum, A. 1988. Plant Breeding for Stress Environments, CRC Press,Boca Raton, FL.
Bohnert, H.J. and Bressan, R.A. 2001. Abiotic stresses, plant re-actions, and approaches towards improving stress tolerance. In:J. Nössberger (Ed.) Crop Science: Progress and Prospects, CABIInternational, Wallingford, UK, pp. 81–100.
Borel, C., Simonneau, T., This, D. and Tardieu, F. 1997. Stomatalconductance and ABA concentration in the xylem sap of barleylines of contrasting genetic origins. Aust. J. Plant Physiol. 24:607–615.
Bray, E. 1997. Plant responses to water deficit. Trends Plant Sci. 2:48–54.
Ceccarelli, S. and Grando, S. 1996. Drought as a challenge for theplant breeder. Plant Growth Regul. 20: 149–155.
Ceccarelli, S., Grando, S. and Impiglia, A. 1998. Choice of selec-tion strategy in breeding barley for stress enviroments. Euphytica103: 307–318.
Close, T.J. 1997. Dehydrins: a commonality in the response ofplants to dehydration and low temperature. Physiol. Plant. 100:291–296.
Close, T.J., Kortt, A.A. and Chandler, P.M. 1989. A cDNA-based comparison of dehydration-induced proteins (dehydrins)in barley and corn. Plant Mol. Biol. 13: 95–108.
Close, T.J., Fenton, R.D. and Moonan, F. 1993. A view of plant de-hydrins using antibodies specific to the carboxy-terminal peptide.Plant Mol. Biol. 23: 279–286.
Conti, S., Landi, P., Sanguineti, M.C., Stefanelli, S. and Tuberosa,R. 1994. Genetic and environmental effects on abscisic acidaccumulation in leaves of field-grown maize. Euphytica 78:81–89.
Delauney, A.J. and Verma, D.P.S. 1993. Proline biosynthesis andosmoregulation in plants. Plant J. 4: 215–223.
Deyholos, M. and Galbraith, D.W. 2001. High-density microarraysfor gene expression analysis. Cytometry 43: 229–238.
Forster, B.P., Ellis, R.P., Thomas, W.T., Newton, A.C., Tuberosa,R., This, D., el-Enein, R.A., Bahri, M.H. and Ben Salem, M.2000. The development and application of molecular markers forabiotic stress tolerance in barley. J. Exp. Bot. 51: 18–27.
Girke, T., Todd, J., Ruuska, S., White, J., Benning, C. and Ohlrogge,J. 2000. Microarray analysis of developing Arabidopsis seeds.Plant Physiol. 124: 1570–1581.
Greenway, H., 1962. Plant response to saline substrates. Growthand ion uptake of several varieties of Hordeum during and aftersodium chloride treatment. Aust. J. Biol. Sci. 15: 16–38.
Greenway, H. and Munns, R., 1980. Mechanisms of salt tolerancein non-halophytes. Annu. Rev. Plant Physiol. 31: 149–190.
Grover, A. 1999. A novel approach for raising salt toleranttransgenic plants based on altering stress signalling throughCa++/calmodulin-dependent protein phosphatase calcineurin.Curr. Sci. 76: 136–137.
Grumet, R., Albrechtensen, R.S. and Hanson, A.D. 1987. Growthand yield of barley isopopulations differing in solute potential.Crop Sci. 27: 119–130.
Hasegawa, P.M., Bressan, R.A., Zhu, J.-K. and Bohnert, H.J. 2000.Molecular biology of salinity stress responses in higher plants.Annu. Rev. Plant Physiol Plant Mol. Biol. 51: 463–499.
Hsieh, H.M., Liu, W.K., Cheng, A. and Huang, P.C. 1996. RNAexpression patterns of a type 2 metallothionein-like gene fromrice. Plant Mol. Biol. 32: 525–529.
Hsieh, H.M., Liu, W.K. and Huang, P.C. 1995. A novel stress-inducible metallothionein-like gene from rice. Plant Mol. Biol.28: 381–389.
Jaglo-Ottosen, K.R., Gilmour, S.J., Zarka, D.G., Schabenberger, O.and Thomashow, M.F. 1998. Arabidopsis CBF1 overexpression

572
induces COR genes and enhances freezing tolerance. Science280: 104–106.
Kamalay, J.C. and Goldberg, R.B. 1980. Regulation of structuralgene expression in tobacco. Cell 19: 935–946.
Kasuga, M., Liu, Q., Miura, S., Yamaguchi-Shinozaki, K. and Shi-nozaki, K. 1999. Improving plant drought, salt and freezing tol-erance by gene transfer of a single stress-inducible transcriptionfactor. Nature Biotechnol. 17: 287–291.
Kawasaki, S., Deyholos, M., Borchert, C., Brazille, S., Kawai, K.,Galbraith, D.W. and Bohnert, H.J. 2001. Temporal succession ofsalt stress responses in rice by microarray analysis. Plant Cell 12:889–905.
Lane, B.G., Cuming, A.C., Fregeau, J., Carpita, N.C., Hurk-man, W.J., Bernier, F., Dratweka-Kas, E. and Kennedy, T.D.1992. Germin isoforms are discrete temporal markers of wheatdevelopment. Eur. J. Biochem. 209: 961–969.
Levitt, J. 1980. Responses of Plants to Environmental Stress, 2nded. Academic Press, New York.
Livak, K.J., Flood, S.J., Marmaro, J., Giusti, W. and Deetz, K. 1995.Oligonucleotides with fluorescent dyes at opposite ends providea quenched probe useful for detecting PCR product and nucleicacid hybridization. PCR Meth. Appl. 4: 357–362.
Maleck, K., Levine, A., Eulgem, T., Morgan, A., Schmid, J.,Lawton, K.A., Dangl, J.L. and Dietrich, R.A. 2000. The tran-scriptome of Arabidopsis thaliana during systemic acquiredresistance. Nature Genet. 26: 403–410.
Masgrau, C., Altabella, T., Farras, R., Flores, D., Thompson, A.J.,Besford, R.T. and Tiburcio, A.F. 1997. Inducible overexpressionof oat arginine decarboxylase in transgenic tobacco. Plant J. 11:465–473.
Matin, M.A., Brown, J.H. and Ferguson, H., 1989. Leaf wa-ter potential, relative water content, and diffusive resistance asscreening techniques for drought resistance in barley. Agron. J.81: 100–105.
Munns, R. 1993. Physiological processes limiting plant-growth insaline soils: some dogmas and hypotheses. Plant Cell Envir. 16:15–24.
Munns, R., Passioura, J.B., Guo, J., Chazen, O. and Cramer, G.R.2000. Water elations and leaf expansion: importance of timing.J. Exp. Bot. 51: 1495–1504.
Nakashima, K., Kiyosue, T., Yamaguchi-Shinozaki, K. and Shi-nozaki, K. 1997. A nuclear gene, erd1, encoding a chloroplast-targeted Clp protease regulatory subunit homolog is not onlyinduced by water stress but also developmentally up-regulatedduring senescence in Arabidopsis thaliana. Plant J. 12: 851–861.
Powell, W., Caligari, P.D.S., Phillips, M.S. and Jinks, J. 1986.The measurement and interpretation of genotype by environ-ment interaction in spring barley (Hordeum vulgare). Heredity56: 255–262.
Reymond, P. and Farmer, E.E. 1999. Jasmonate and salicylate asglobal signals for defense gene expression. Curr. Opin. PlantBiol. 1: 404–411.
Reymond, P., Weber, H., Damond, M. and Farmer, E.E. 2000. Dif-ferential gene expression in response to mechanical woundingand insect feeding in Arabidopsis. Plant Cell 12: 707–719.
Richards, R.A., Dennet, C.W., Qualset, C.O., Epstein, E., Norlyn,J.D. and Winslow, M.D. 1987. Variation in yield of grain andbiomass in wheat, barley, and triticale in a salt-affected field.Field Crops Res. 15: 277–287.
Richmond, T. and Somerville, S. 2000. Chasing the dream: plantEST microarrays. Curr. Opin. Plant Biol. 3: 108–116.
Ruan, Y., Gilmore, J. and Conner, T. 1998. Towards Arabidopsisgenome analysis: monitoring expression profiles of 1400 genesusing cDNA microarrays. Plant J. 15: 821–833.
Rus, A., Yokoi, S., Sharkhuu, A., Reddy, M., Lee, B.-H., Damsz,B., Sokolchik, I., Matsumoto, T., Barb, A.W., Koiwa, H., Zhu,J.-K., Bressan, R.A. and Hasegawa, P.M. 2001. AtHKT1 is a salttolerance determinant that controls sodium entry into plant roots.Submitted for publication.
Sanguineti, M.C., Tuberosa, R., Stefanelli, S., Noli, E., Blake,T.K. and Hayes, P.M. 1994. Utilization of a recombinant inbredpopulation to localize QTLs for abscisic acid content in leavesof drought-stressed barley (Hordeum vulgare L.). Russ. J. PlantPhysiol. 41: 572–576.
Schachtman, D. and Liu, W. 1999. Molecular pieces to the puzzle ofthe interaction between potassium and sodium uptake in plants.Trends Plant Sci. 4: 281–287.
Schenk, P.M., Kazan, K., Wilson, I., Anderson, J.P., Richmond.,T.,Somerville, S.C. and Manners, J.M. 2000. Coordinated plant de-fense responses in Arabidopsis revealed by microarray analysis.Proc. Natl. Acad. Sci. USA 97: 21: 11655–11660.
Schuchardt, J., Beule, D., Malik, A., Wolski, E., Eickhoff, H.,Lehrach, H. and Herzel, H. 2000. Normalization strategies forcDNA microarrays. Nucl. Acids Res. 28: E47.
Slavich, P.G., Read, B.J. and Cullis, B.R. 1990. Yield response ofbarley germplasm to field variation in salinity quantified usingthe EM-38. Aust. J. Exp. Agric. 30: 551–556.
Smirnoff, N. and Bryant, J.A. 1999. DREB takes the stress out ofgrowing up. Nature Biotechnol. 17: 229–230.
Soyka, S. and Heyer, A.G. 1999. Arabidopsis knockout mutationof ADC2 gene reveals inducibility by osmotic stress. FEBS Lett.458: 219–223.
Stewart, C.R. and Voetberg, G. 1985. Relationship between stress-induced ABA and proline accumulations and ABA-induced pro-line accumulation in excised barley leaves. Plant Physiol. 79:2–27.
Stewart, C.R., Voetberg, G. and Rayapati, P.J. 1986. The effectsof benzyladenine, cycloheximide, and cardycepin on wilting-induced abscisic acid and proline accumulations and abscisicacid- and salt-induced proline accumulation in barley leaves.Plant Physiol. 82: 707.
Teulat, B., Monneveux P., Wery, J., Borries, C., Souyris, I., Char-rier, A. and This, D. 1997. Relationships between relative watercontent and growth parameters under water stress in barley: AQTL study. New Phytol. 137: 99–107.
Thomas, J.C., DeArmond, R.L. and Bohnert, H.J. 1992. Influence ofNaCl on growth, proline and phosphoenolpyruvate carboxylaselevels in Mesembryanthenum crystallinum suspension cultures.Plant Physiol. 98: 626–631.
Tuberosa, R., Sanguineti, M.C., Landi, P., Salvi, S., Casarini, E.and Conti, S. 1998. RFLP mapping of quantitative trait loci con-trolling abscisic acid concentration in leaves of drought-stressedmaize (Zea mays L.). Theor. Appl. Genet. 97: 744–755.
van Buuren, M., Salvi, S., Morgante, M., Serhani, B. and Tuberosa,R. 2002. Comparative genomic mapping between a 754 kb re-gion flanking DREB1A in Arabidopsis thaliana and maize. PlantMol. Biol., 48: 741–750.
Voros, K., Feussner, I., Kuhn, H., Lee, J., Graner, A., Lobler,M., Parthier, B. and Wasternak, C. 1998. Characterization ofa methyljasmonate-inducible lipoxygenase from barley. Eur. J.Biochem. 251: 36–44.
Wang, R.C., Guegler, K., LaBrie, S.T., Crawford, N.M. and Wang,R.C. 2000. Genomic analysis of a nutrient response in Arabidop-sis reveals diverse expression patterns and novel metabolic andpotential regulatory genes induced by nitrate. Plant Cell 12: 8:1491–1509.
Wierstra, I. and Kloppstech, K. 2000. Differential effects of methyl-jasmonate on the expression of the early light-inducible proteins

573
and other light-related genes in barley. Plant Physiol. 124: 833–844.
Xu, DP., Duan, X.L., Wang, B.Y., Hong, B.M., Ho, T.H.D., Wu, R.,Xu, D.P., Duan, X.L., Wang, B.Y. and Hong, B.M. 1996 . Ex-pression of a late embryogenesis abundant protein gene, HVA1,from barley confers tolerance to water deficit and salt stress intransgenic rice. Plant Physiol. 110: 249–257.
Yale, J. and Bohnert, H.J. 2001. Changes in gene expression in theyeast genome in response to salinity, temperature and oxidativestresses. J. Biol. Chem. 276: 15996–16007.
Yamaguchi-Shinozaki, K. and Shinozaki, K. 1994. A novel cis-acting element in an Arabidopsis gene is involved in responsive-
ness to drought, low-temperature, or high-salt stress. Plant Cell6: 251–264.
Yoshiba, Y., Kiyosue, T., Nakashima, K., Yamaguchi-Shinozaki,K. and Shinozaki, K. 1997. Regulation of levels of proline asan osmolyte in plants under water stress. Plant Cell Physiol. 38:1095–1102.
Zhang, JX., Klueva, N.Y., Wang, Z., Wu, R., Ho, T.H., Nguyen,H.T. and Ho, T.H.D. 2000. Genetic engineering for abiotic stressresistance in crop plants. In Vitro Cell Devel. Biol. Plant 36: 108–114.