monitoring management plan - water corporation
TRANSCRIPT

Sepia Depression Ocean Outlet Monitoring and Management Plan
821_001/1_Rev5 April 2014


\\oce-per-fs1\projects\WaterCorp\821_SDOOL2009_10\001_ProjectManagement\Reports\SDOOL MMP\SDOOLM&MP_2014_20140313.docm
Sepia Depression Ocean Outlet
Monitoring and Management Plan
Prepared for
Water Corporation
Prepared by
BMT Oceanica Pty Ltd
April 2014
Report No. 821_001/1_Rev5


Client: Water Corporation
Document history Distribution
Revision Author Recipients Organisation No. copies & format Date
A A. Gartner K. Hillman Oceanica 1 x e-copy 10/02/11
B A. Gartner K. Hillman Oceanica 1 x e-copy 25/02/11
C A. Gartner C. Byers Water Corp 1 x e-copy 03/03/11
D A. Gartner K. Hillman Oceanica 1 x e-copy 05/05/11
E A. Gartner C. Byers Water Corp 1 x e-copy 23/06/11
0 A. Gartner C. Byers Oceanica
Water Corp
2 x hardcopy 2 x CDs 2 x hardcopy
28/06/11
1 A. Gartner C. Byers OEPA Oceanica
Water Corp
1 x e-copy Via Water Corp 2 x hardcopy
29/07/11
2 A. Gartner
J. Tobon OEPA
Water Corp
1 x hardcopy 1 x pdf (highlights) 1 x hardcopy 1 x pdf (final) 1 x hardcopy 1 x pdf (highlights) 1 x hardcopy 1 x pdf (final)
17/07/12
3 M. Lourey
A. Gartner K. Hillman J. Phillips J. Tobon OEPA
Oceanica Oceanica Oceanica Water Corp
1 x e-copy 1 x e-copy 1 x e-copy 1 x e-copy 1 x hardcopy 1 x hardcopy 1 x e-copy
02/01/13 02/01/13 02/01/13 14/01/13 25/01/13
4 M. Lourey
G. Shiell J. Tobon C. Byers OEPA
Oceanica Water Corp Water Corp OEPA
1 x e-copy 1 x e-copy 1 x e-copy 1 x e-copy
21/08/13 22/08/13 28/01/14 28/01/14
5 M. Lourey C. Byers T. Liaghati
Water Corp OEPA
1 x e-copy 1 x e-copy
2/04/14
Review
Revision Reviewer Intent Date
A J. Phillips Editorial 14/02/11
B K. Hillman Technical 03/03/11
C C. Byers Client 20/03/11
D K. Hillman Technical/Editorial 23/06/11
E C. Byers Client 28/06/11
0 A. Gartner Editorial 28/07/11
1 T. Liaghati Client 28/03/12
2 H. Kemps Client 17/12/12

Revision Reviewer Intent Date
3
A. Gartner K. Hillman J. Phillips J. Tobon
Technical Technical/Editorial Editorial Client
09/01/13 11/01/13 11/01/13 17/01/13
4 G. Shiell C. Byers T. Liaghati
Technical Client Client
22/08/13 10/10/13 07/03/14
Quality Assurance
BMT Oceanica Pty Ltd has prepared this report in accordance with our Quality Management System, certified to AS/NZS ISO 9001: 2008.
Status This report is 'Draft' until approved for final release, as indicated below by inclusion of signatures from: (i) the author and (ii) a Director of BMT Oceanica Pty Ltd or their authorised delegate. A Draft report may be issued for review with intent to generate a 'Final' version, but must not be used for any other purpose.
Approved for final release:
Author Director (or delegate) Date: 01/04/14 Date: 01/04/14


Cover Main image: Sea lion at Sepia Depression (BMT Oceanica Pty Ltd); Minor images: Sepia Depression wastewater outlet (BMT Oceanica Pty Ltd)
Mussel cages deployed for sentinel mussel monitoring, Sepia Depression(BMT Oceanica Pty Ltd); Disclaimer This report has been prepared on behalf of and for the exclusive use of Water Corporation, and is subject to and issued in accordance with the agreed terms and scope between Water Corporation and BMT Oceanica Pty Ltd. BMT Oceanica Pty Ltd accepts no liability or responsibility for it in respect of any use of or reliance upon this report by any third party.
Copying this report without prior written consent of Water Corporation or BMT Oceanica Pty Ltd is not permitted.
The BMT Oceanica logo is a registered trademark of BMT Oceanica Pty Ltd that is protected by law. You may not use this trademark without first obtaining the permission of BMT Oceanica Pty Ltd.
© Copyright 2013 BMT Oceanica Pty Ltd

BMT Oceanica: Water Corporation: Sepia Depression Ocean OutletMonitoring and Management Plan i
Contents
1. Purpose of this Document ................................................................................................ 1
1.1 Objectives .............................................................................................................. 1
1.2 This document ....................................................................................................... 1
1.3 Implementation of Ministerial Statement 665 ....................................................... 2
2. Background ....................................................................................................................... 7
2.1 Wastewater discharge in Perth’s metropolitan coastal waters .......................... 7
2.2 Receiving environment of the Sepia Depression .............................................. 10
2.3 Potential environmental impacts of WWTP discharge ...................................... 11
2.4 Environmental commitment ................................................................................ 11
2.5 Relationship of this M&MP to the PLOOM Monitoring Program ....................... 12
3. Environmental Management Framework ....................................................................... 13
3.1 Environmental management framework background ....................................... 13
3.2 SDOOL environmental management framework ............................................... 13
3.2.1 Sepia Depression Environmental Values .....................................................15
3.2.2 Sepia Depression Environmental Quality Objectives ...................................15
3.2.3 Sepia Depression Environmental Quality Criteria ........................................15
4. Environmental Quality Objectives and Criteria ............................................................. 16
4.1 Maintenance of Ecosystem Integrity (EQO1) ..................................................... 16
4.1.1 Objective .....................................................................................................16
4.1.2 Schedule 1 monitoring and management requirements ...............................16
4.1.3 Environmental quality criteria .......................................................................19
4.2 Maintenance of Aquatic Life for Human Consumption (EQO2) ........................ 23
4.2.1 Objective .....................................................................................................23
4.2.2 Environmental Quality Criteria .....................................................................27
4.3 Maintenance of Primary and Secondary Contact Recreation Values (EQO3 and EQO4) ................................................................................................ 29
4.3.1 Objective .....................................................................................................29
4.3.2 Environmental quality criteria .......................................................................31
4.4 Maintenance of Aesthetic Values (EQO5) .......................................................... 34
4.4.1 Objective .....................................................................................................34
4.4.2 Environmental quality criteria .......................................................................34
5. Monitoring to Maintain Ecosystem Integrity ................................................................. 36
5.1 Overview ............................................................................................................... 36
5.2 Waste stream monitoring .................................................................................... 37
5.2.1 Operational monitoring ................................................................................37
5.2.2 Nitrogen loads .............................................................................................38
5.2.3 Diffuser verification ......................................................................................38
5.3 Toxicants in treated wastewater ......................................................................... 38
5.3.1 Treated wastewater characterisation ...........................................................38
5.3.2 Quarterly treated wastewater characterisation .............................................39
5.3.3 Comprehensive treated wastewater characterisation ...................................41
5.3.4 Bioaccumulating toxicants ...........................................................................46

ii BMT Oceanica: Water Corporation: Sepia Depression Ocean OutletMonitoring and Management Plan
5.3.5 Dilution calculations ..................................................................................... 46
5.3.6 Total toxicity calculations ............................................................................. 46
5.3.7 Whole-of-effluent toxicity (WET) testing ....................................................... 47
5.4 Receiving waters: physico-chemical and direct biological measures ..............50
5.4.1 Compliance monitoring ................................................................................ 50
5.4.2 Sentinel mussel monitoring ......................................................................... 53
5.5 Toxicants in sediments ........................................................................................56
5.5.1 Sediment quality monitoring ........................................................................ 56
5.6 Dam flushing events .............................................................................................59
5.6.1 Interim measures ......................................................................................... 59
5.6.2 Ongoing monitoring ..................................................................................... 59
6. Monitoring to Maintain Seafood Safety ..........................................................................60
6.1 Overview ...............................................................................................................60
6.2 Thermo-tolerant coliforms (TTC) .........................................................................60
6.2.1 Microbial contaminant monitoring ................................................................ 60
6.2.2 Sentinel mussel monitoring ......................................................................... 63
6.3 Metals and chemicals ...........................................................................................63
6.3.1 Sentinel mussel monitoring ......................................................................... 63
6.4 Algal biotoxins ......................................................................................................63
6.4.1 Phytoplanktion community composition ....................................................... 63
6.4.2 Sentinel mussel monitoring ......................................................................... 64
7. Monitoring to Maintain Contact Recreation ...................................................................65
7.1 Overview ...............................................................................................................65
7.2 Faecal pathogens (Enterococci spp.) ..................................................................65
7.3 Algal biotoxins ......................................................................................................65
7.4 Toxic chemicals ....................................................................................................66
8. Monitoring to Maintain Aesthetic Values ........................................................................68
8.1 Overview ...............................................................................................................68
8.2 Aesthetic appearance ...........................................................................................68
8.3 Fish tainting substances ......................................................................................68
9. Implementation.................................................................................................................70
9.1 Reporting and auditing .........................................................................................70
9.2 Monitoring and revision .......................................................................................70
10. Stakeholder consultation ................................................................................................71
11. References ........................................................................................................................72

BMT Oceanica: Water Corporation: Sepia Depression Ocean OutletMonitoring and Management Plan iii
List of Figures
Figure 2.1 Location of Sepia Depression Ocean Outlet .......................................................... 8
Figure 2.2 Contributors into the Sepia Depression Ocean Outlet ........................................... 9
Figure 3.1 Environmental Risk/Management Response ....................................................... 14
Figure 4.1 Environmental quality objectives, criteria and monitoring programs for maintaining the environmental value Ecosystem Health ...................................... 17
Figure 4.2 Sepia Depression ocean outlet ecological protection boundaries ........................ 18
Figure 4.3 Environmental quality objectives, criteria and monitoring programs for maintaining the environmental value Fishing and Aquaculture ............................ 24
Figure 4.4 Proposed Closed Safety Zone for shellfish harvesting ......................................... 25
Figure 4.5 Environmental quality objectives, criteria and monitoring programs for maintaining the environmental value Recreation and Aesthetics ......................... 29
Figure 4.6 Boundary of area surrounding the SDOOL ocean outlet where primary and secondary contact recreation is not recommended.............................................. 30
Figure 4.7 Environmental quality objectives, criteria and monitoring programs for maintaining the environmental value Recreation and Aesthetics ......................... 34
Figure 5.1 Sepia Depression Ocean Outlet Landline (SDOOL) on-line monitoring and sampling points ................................................................................................... 37
Figure 5.2 Conceptual diagram of the Compliance Monitoring program showing hypothetical compliance sites and their relative distances from the outlet diffuser ................................................................................................................ 52
Figure 5.3 Sentinel mussel and sediment sampling sites ..................................................... 55
Figure 6.1 Fixed sites around the Sepia Depression outlet sampled for thermo-tolerant coliforms (TTC), Enterococci spp. and phytoplankton during periods with northerly, easterly, westerly and southerly currents ............................................. 61
Figure 6.2 Fixed sites around the Sepia Depression outlet sampled for thermo-tolerant coliforms (TTC), Enterococci spp. and phytoplankton during periods with north-easterly, south-easterly, north-westerly and south-westerly currents .......... 62
List of Tables
Table 1.1 Summary of monitoring, investigation and management responses in Ministerial Conditions from Ministerial Statement 665 for the SDOOL ................... 2
Table 1.2 Summary of Water Corporation commitments from Ministerial Statement 665 for the SDOOL ...................................................................................................... 4
Table 1.3 Additional actions required to be conducted to address outstanding items and complete this plan .......................................................................................... 6
Table 4.1 Environmental Quality Criteria for the EQO of Maintenance of Ecosystem Integrity (EQO1)1 ................................................................................................. 19
Table 4.2 Management response following exceedances of EQC for the EQO of Maintenance of Ecosystem Integrity (EQO1) ....................................................... 21
Table 4.3 Environmental Quality Criteria for the EQO of Maintenance of Seafood for Human Consumption (EQO2) ............................................................................. 27
Table 4.4 Management response following exceedances of EQC for the EQO of Maintenance of Seafood for Human Consumption (EQO2) ................................. 28
Table 4.5 Boundary coordinates for the area surrounding the SDOOL ocean outlet where primary and secondary contact recreation is not recommended ............... 31
Table 4.6 Environmental Quality Criteria for the EQO of Maintenance of Primary Contact Recreation (EQO3) ................................................................................ 31

iv BMT Oceanica: Water Corporation: Sepia Depression Ocean OutletMonitoring and Management Plan
Table 4.7 Environmental Quality Criteria for the EQO of Maintenance of Secondary Contact Recreation (EQO4) .................................................................................32
Table 4.8 Management response following exceedances of EQC for the EQOs of Maintenance of Primary and Secondary Contact Recreation (EQO3 and EQO4) ..................................................................................................................33
Table 4.9 Environmental Quality Criteria for the EQO of Maintenance of Recreation and Aesthetics (EQO5) ........................................................................................35
Table 4.10 Management response following exceedances of EQC for the EQOs of Maintenance of Aesthetic values (EQO5) .............................................................35
Table 5.1 Parameters to be measured quarterly in the SDOOL wastewater stream and the ANZECC/ARMCANZ (2000) guideline trigger values for toxicants in marine waters to achieve various levels of species protection ..............................40
Table 5.2 Parameters to be measured annually in the SDOOL wastewater stream and the ANZECC/ARMCANZ (2000) guideline trigger values for toxicants in marine waters to achieve various levels of species protection ..............................41
Table 5.3 EQG and EQS values for metal concentrations for the maintenance of seafood safe for human consumption...................................................................54
Table 5.4 Sentinel mussel and sediment sampling site coordinates .....................................56
Table 5.5 Sediment quality criteria .......................................................................................58
Table 6.1 EQG and EQS for the maintenance of seafood for human consumption ..............63
Table 6.2 Protocols for analysis of archived phytoplankton samples ....................................64
Table 7.1 Parameters to be measured annually in the SDOOL wastewater stream and the EPA (2005a) recreational guidelines ..............................................................66
Table 8.1 Field sheet for demonstrating compliance with EQG for aesthetics ......................68
Table 8.2 Parameters to be measured annually in the SDOOL wastewater stream and the EPA (2005a) guidelines for fish tainting substance .........................................69
List of Appendices
Appendix A Ministerial Statement 665
Appendix B Management Response Framework flow diagrams
Appendix C Approach for determining LEPA boundary dilution
Appendix D WET Testing Sensitivity
Appendix E Contaminants in Treated Wastewater Appendix F Comprehensive Annual Summer Water Quality Survey
Appendix G Summary of public consultation process
Appendix H Terms of Reference of the public consultation Stakeholder Liaison Group

BMT Oceanica: Water Corporation: Sepia Depression Ocean OutletMonitoring and Management Plan v
List of Acronyms
ANZECC Australian and New Zealand Environment and Conservation Council ARMCANZ Agriculture and Resource Management Council of Australia and New Zealand BOD Biological oxygen demand CTWWC Comprehensive treated wastewater characterisation DER Western Australian Department of Environment Regulation DoH Western Australian Department of Health End of pipe For the industry participants: at the industry connection to the SDOOL or at the
industries diffuser in Cockburn Sound immediately prior to the discharge to the environment. For the Water Corporation: at the SDOOL diffuser immediately prior to the discharge to the environment
EC10 Concentration expected to produce an effect in 10% of the population EC50 Concentration expected to produce an effect in 50% of the population EPA Environmental Protection Authority of Western Australia EQC Environmental Quality Criteria EQG Environmental Quality Guideline EQMF Environmental Quality Management Framework EQO Environmental Quality Objective EQS Environmental Quality Standard HEPA High Ecological Protection Area KWRP Kwinana Water Reclamation Plant LEPA Low Ecological Protection Area LOEC Lowest Observable Effects Concentration Mg Milligram, or one thousandth of a gram μg Microgram, or one millionth of a gram ML Megalitre, or one million litres M&MP Monitoring and Management Plan MS 665 Ministerial Statement 665 NOEC No observed effect concentration OEPA Office of the Environmental Protection Authority PLOOM Perth Long-term Ocean Outlet Monitoring Program SDOOL Sepia Depression Ocean Outlet Landline SHEZ Shellfish Harvesting Exclusion Zone TN Total nitrogen TP Total phosphorus TRE Toxicity Reduction Evaluation TSS Total suspended solids TTC Thermo-tolerant coliforms WET testing Whole-of-effluent toxicity testing WWTP Wastewater treatment plant


BMT Oceanica: Water Corporation: Sepia Depression Ocean OutletMonitoring and Management Plan 1
1. Purpose of this Document
1.1 Objectives On 28 October 2004, the use of the Sepia Depression Ocean Outlet Landline (SDOOL) to dispose of up to 30 megalitres per day (ML day-1) of industrial wastewater to the Sepia Depression was approved by the Minister for the Environment (Ministerial Statement 665; hereafter MS 665). The specified sources of the industrial wastewater are the Kwinana Water Reclamation Plant (KWRP), BP Refinery (Kwinana), CSBP Limited and the Kwinana Cogeneration Plant. This is in addition to the discharge of treated wastewater via the SDOOL from the Water Corporation’s domestic wastewater treatment plants at Woodman Point and Point Peron, and water from the Jervoise Bay Groundwater Recovery Scheme. Industrial wastewater will only be accepted if the quality of the combined wastewater stream meets the ANZECC/ARMCANZ (2000) 80% species protection guidelines for bioaccumulating toxicants at discharge, and the ANZECC/ARMCANZ (2000) 99% species protection guidelines for toxicants (with the exception of cobalt, where the 95% species protection guideline will apply) at 100 m from the diffuser. The proposal does not allow any of the specified industries to increase their discharge of current toxicant loads to the marine environment without prior referral to the Environmental Protection Authority (EPA). Condition 6 of MS 665 sets out the requirements for monitoring and management of the SDOOL to be addressed in a Monitoring and Management Plan (M∓ this document). The objective of this M&MP is to meet Condition 6.1 of MS 665, which is to ensure that agreed ecological and social environmental values for marine waters in the vicinity of the Sepia Depression are maintained. Condition 6.1 requires the M&MP to include: 1. the monitoring and evaluation of the environmental effects of discharging industrial effluent
into the Sepia Depression 2. long-term Environmental Quality Objectives and their spatial application consistent with the
EPA’s (2000) objectives as described in the publication Perth’s Coastal Waters – Environmental Values and Objectives
3. a program to achieve long-term Environmental Quality Objectives through short- to medium-term targets
4. agreed trigger levels for further investigations (Environmental Quality Guidelines) 5. agreed trigger levels for remedial and/or preventative actions to protect the water quality and
the environment of the Sepia Depression (Environmental Quality Standards) 6. management actions to be taken in the event that Environmental Quality Guidelines or
Environmental Quality Standards are not met.
1.2 This document This document outlines the monitoring and management framework for the discharge of industrial and urban wastewater from the Sepia Depression Ocean Outlet. The relevant components of the framework are summarised and discussed, as follows: Environmental Management Framework (Chapter 3) Environmental Objectives, Quality Criteria and management responses (Chapter 4) Environmental Monitoring Program (Chapters 5–8) Review and reporting requirements (Chapter 9) Public consultation (Chapter 10).

2 BMT Oceanica: Water Corporation: Sepia Depression Ocean OutletMonitoring and Management Plan
1.3 Implementation of Ministerial Statement 665 Ministerial Statement 665 (Appendix A) includes a number of conditions and commitments relating to the monitoring and reporting, further investigations, remedial and/or preventative actions and management actions. In particular, MS 665 includes Ministerial Conditions regarding bioaccumulating contaminants1, other contaminants, nitrogen loads and sediment quality, in relation to the disposal of industrial wastewater to the SDOOL (refer to Table 1.1 and Table 1.2). All Conditions of MS 665 relevant to the impacts of industrial wastewater discharge are met by this M&MP. These include Conditions 6.1, 6.2, 6.3, 7.1, 7.2, 7.3, 7.4, 7.5, 7.6, 9.1, 10.1, 10.2, 11.1, 11.2 and 11.3 (see Appendix A) and the Water Corporation’s Environmental Management Commitments 1, 3, 4, 5, 6, 7, 8 and 9 (Table 1.2).
Table 1.1 Summary of monitoring, investigation and management responses in Ministerial Conditions from Ministerial Statement 665 for the SDOOL
Parameter Monitoring Investigation Management Response
Discharge Quality Condition 1.1: As detailed in Schedule 1 of MS 665, the proponent shall undertake monitoring to derive monthly estimates for total suspended solids (TSS), biochemical oxygen demand (BOD) and total phosphorus (TP) to ensure concentrations in the combined treated wastewater quality do not exceed wastewater targets on more than one occasion in a calendar year. See Section 5.3
In the event that TSS, BOD or TP exceed the targets detailed in Schedule 1 of MS 665 on more than one occasion in a calendar year, the Water Corporation is to investigate each of the participants to the SDOOL, to determine the cause and origin of the exceedance. See Section 4.1.2
In the event that TSS, BOD or TP exceed the targets detailed in Schedule 1 of MS 665 on more than one occasion, the Water Corporation will report the exceedance and the outcome of the subsequent investigations in the annual report. See Section 4.1.2
Bioaccumulating Toxicants
Condition 7.1: Determine and report whether the concentrations of bioaccumulating toxicants in the effluent at the diffuser exceed the ANZECC/ARMCANZ (2000) 80% species protection guideline trigger levels. See Section 5.3
Condition 7.2: In the event that a guideline trigger level for a bioaccumulating toxicant is exceeded, there is a requirement to report the matter within one working day of determining that an exceedance has occurred and to initiate an investigation against the Environmental Quality Standards and into the cause of the exceedance in accordance with the Environmental Quality Management Framework developed in the Environmental Quality Criteria Reference Document for Cockburn Sound (2003–2004) (EPA 2005a). See Section 4.1.3
Condition 7.3: If an Environmental Quality Standard for a bioaccumulating toxicant is exceeded, there is a requirement to initiate a management response to determine the cause and remedy the exceedance in accordance with the implementation framework for the National Water Quality Management Strategy (EPA 2002). See Section 4.1.3
1Although Ministerial Statement 665 uses the word ‘toxicant’, this document preferentially uses the word ‘contaminant’. A contaminant is a substance that is present in amounts above natural background levels, but it only becomes a toxicant when it is present at levels that cause toxicity in organisms.

BMT Oceanica: Water Corporation: Sepia Depression Ocean OutletMonitoring and Management Plan 3
Parameter Monitoring Investigation Management Response
Toxicants Condition 7.4: Determine and report whether the ANZECC/ARMCANZ (2000) 99% species protection guideline trigger levels for toxicants (with the exception of cobalt, where the 95% guideline will apply) are being exceeded within the High Ecological Protection Zone (i.e. beyond a 100 m radius of the diffuser). See Section 5.3
Condition 7.5: In the event that a guideline trigger level for a toxicant is exceeded, there is a requirement to report the matter within one working day of determining that an exceedance has occurred and to initiate an investigation against the Environmental Quality Standards and into the cause of the exceedance in accordance with the Environmental Quality Management Framework developed in the Environmental Quality Criteria Reference Document Cockburn Sound (2003–2004) (EPA 2005a). See Section 4.1.3
Condition 7.6: If an Environmental Quality Standard for a toxicant is exceeded, there is a requirement to initiate a management response to determine the source and remedy the exceedance in accordance with the implementation framework for the National Water Quality Management Strategy (EPA 2002). See Section 4.1.3
Nitrogen Loads
Condition 10.1: Operate the SDOOL so that the annual nitrogen load to the Sepia Depression does not exceed the nitrogen load discharged from the outlet in 1994 (1778 t). See Section 5.3
Condition 10.2: In the event that subsequent monitoring shows an adverse environmental impact at the 1994 nitrogen load, there is a requirement to reduce the annual nitrogen load to 75% of the load discharged from the outlet in 1994. See Section 4.1.2
Sediment Quality
Condition 11.1: Monitor sediment quality within and at the boundary of the Low Ecological Protection Zone and report on whether sediments exceed the ANZECC/ARMCANZ (2000) Interim Sediment Quality Guidelines-low “trigger” levels. See Section 5.5
Condition 11.2: In the event that a guideline trigger level for sediment is exceeded, there is a requirement to report the matter within one working day of determining that an exceedance has occurred and to initiate an investigation against the Environmental Quality Standards and into the cause of the exceedance in accordance with the Environmental Quality Management Framework developed in the Environmental Quality Criteria Reference Document Cockburn Sound (2003–2004) (EPA 2005a). See Section 4.1.3
Condition 11.3: If an Environmental Quality Standard for sediment quality is not met, there is a requirement to initiate a management response to determine the cause and act to prevent further sediment quality degradation. See Section 4.1.3

4 BMT Oceanica: Water Corporation: Sepia Depression Ocean OutletMonitoring and Management Plan
Table 1.2 Summary of Water Corporation commitments from Ministerial Statement 665 for the SDOOL
Commitment SDOOL M&MP Section
Action
No. 1
4.1 5.3 5.3.4
Attain an average dilution of the SDOOL wastewater stream of at least 1:300, with dilution being above 1:200 at least 99% of the time within 100 m of the diffuser. Dilution will be demonstrated by modelling and monitoring.
No. 3
4.1 5.3 5.3.4
Manage the discharge of treated waster to the Sepia Depression, including that accepted from industrial participants and future expansion of the wastewater treatment system, to ensure that the concentration of toxicants meets agreed Environmental Quality Criteria 100 m from the diffuser. Compliance will be demonstrated by modelling and monitoring.
No. 4 9.1
Conduct specific investigations and annually report the effects of wastewater discharge to the Sepia Depression through the Perth Long-term Ocean Outlet Monitoring (PLOOM) Program or other agreements. Reporting will be through the Compliance Report.
No. 5 5.3
Conduct specific investigations in the event that toxicants in the treated wastewater exceed concentrations which will result in the Environmental Protection Authority’s relevant high protection Environmental Quality Guidelines being exceeded following 1:200 initial dilution, with the relevant industrial participant(s) and in consultation with the Department of Environment and Conservation to identify the source and cause of the identified condition. Report any exceedances in the Compliance Report.
No. 6 4.1.3
Undertake assessment of the risk presented to the ecological processes in the Sepia Depression by the exceedance in Commitment No. 5, and undertake measures necessary to mitigate those risks. Report mitigation measures taken in the Compliance Report.
No. 7 5.3.7
Undertake Whole-Effluent-Toxicity (WET) testing using a method agreed with the Department of Environment and Conservation following the principles contained in the USEPA, APHA and ASTM protocols, at a NATA-accredited laboratory in accordance with the protocols set out in ANZECC/ARMCANZ (2000) and in accordance with the SDOOL Monitoring and Management Plan. Report results in the Compliance Report.
No. 8 4.2 5.4.2
Participate in close consultation with the Department of Health and the Department of Environment and Conservation to further refine the notional social Environmental Quality Objectives for the maintenance of seafood for human consumption and recreation and aesthetic Environmental Quality Criteria values and boundaries for treated wastewater discharge to the marine environment. Deploy sentinel mussels to monitor tissue coliform levels in accordance with the SDOOL Monitoring and Management Plan. Report results in the Compliance Report.
No. 9 4.2 4.3
Notify the Department for Planning and Infrastructure of the spatial extent of the area in proximity to the Sepia Depression Ocean Outlet where primary contact recreation and taking of seafood is not recommended, with a request for inclusion on relevant Maritime Charts. Provide evidence of the notification.

BMT Oceanica: Water Corporation: Sepia Depression Ocean OutletMonitoring and Management Plan 5
Commitment SDOOL M&MP Section
Action
No. 10 This Report
Prepare a Wastewater Monitoring and Management Plan to address the receipt and discharge of wastewater from the SDOOL, including: The monitoring and evaluation of combined treated wastewater and industrial
effluent into the Sepia Depression. The Monitoring will include as far as practicable:
Real-time monitoring of all streams of wastewater returned to the SDOOL and combined streams prior to discharge. Routine monitoring is to include flow-rate, pH, conductivity, turbidity and temperature; and
Routine monitoring of prescribed contaminant levels in all streams of wastewater returned to the SDOOL and combined streams prior to discharge. Prescribed contaminants are those agreed from time to time under this Plan.
Procedures required to be implemented by the Water Corporation and Kwinana Water Reclamation Plant participants if the wastewater contamination has the potential to cause specified toxicant concentrations and loads to be exceeded.
Mode of operation of the SDOOL to attain an average dilution of the combined wastewater stream of at least 1:300, with the dilution being above 1:200 at least 99% of the time within 100 m of the diffuser.
Submit framework and plan to Audit Branch (Department of Environment and Conservation).
No. 11 9.1 Finalise the Wastewater Monitoring and Management Plan (see Commitment 10). Submit Plan to Audit Branch (Department of Environment and Conservation).
No. 12 9.1
Implement the Wastewater Monitoring and Management Plan (see Commitments 10 and 11). Report in the Compliance Report.
No. 13 10
Develop a Stakeholder Consultation Strategy. The Strategy will include commitments to: Identify relevant stakeholders including community groups, environmental
groups, local governments (including the City of Rockingham) and government agencies;
Describe stakeholder consultation measures; Require stakeholder input into the Plans and Strategies required to be
prepared by these commitments; Describe opportunities to publicly review annual reports and data on the
Sepia Depression Ocean Outlet environmental performance and monitoring programs;
Make reports on Kwinana Water Reclamation Plant environmental performance readily available to the public and advertise their availability;
Make the results of the Perth Long-term Ocean Outlet Monitoring (PLOOM) Program readily available to the public and advertise their availability;
Maintain a complaints/response record of actions taken to address matters arising;
Present up-to-date information and data, consult on and receive input on current and possible future industry participations prior to any referral under s.38 of the Environmental Protection Act 1986.
Implement the Stakeholder Consultation Strategy. Report monitoring results, complaints and responses in the Compliance Report.
The SDOOL M&MP addresses the potential impacts of industrial wastewater discharge into the Sepia Depression. The M&MP has been specifically developed to meet the requirements of Ministerial Conditions 7.1, 7.4, 10.1 and 11.1 and Water Corporation commitments 1, 4, 6 and 8, and consists of two distinct components:

6 BMT Oceanica: Water Corporation: Sepia Depression Ocean OutletMonitoring and Management Plan
Monitoring of the contaminant source to provide information on contaminant inputs, comprising: real-time monitoring wastewater characterisation and initial dilution modelling whole-of-effluent toxicity (WET) testing. Monitoring of the quality of the ambient environment, comprising: sentinel mussel monitoring sediment quality monitoring. Monitoring of the long-term effects of the wastewater discharge on the Sepia Depression has primarily occurred through the Perth Long-term Ocean Outlet Monitoring (PLOOM) Program. The relationship between the SDOOL and PLOOM monitoring programs is discussed in Section 2.5. Operationally, monitoring will continue to be conducted as a part of PLOOM but is now formalised and driven by the content of this M&MP. In addition to the Conditions and Commitments listed in Table 1.1 and Table 1.2, the Water Corporation is committed to the actions outlined in Table 1.3 to account for outstanding items. These actions are to be implemented as a condition of M&MP approval.
Table 1.3 Additional actions required to be conducted to address outstanding items and complete this plan
Action Purpose Estimated completion date
Create a validated and calibrated three dimensional hydrodynamic model to determine dilution at the LEPA boundary.
To provide evidence that commitment 1 of Ministerial Statement 665 is being met
To justify the use of 1:200 or suggest an alternative number of dilutions used to correct waste stream toxicant concentrations for dilution at the LEPA boundary
To provide data to help determine whether EQG are met during balancing dam flushing events
Within 9 months of acceptance of the plan to allow for autumn current meter deployments, subsequent modelling, interpretation and reporting
The model will be calibrated with ADCP data collected from the Sepia Depression and validated against solute fields from the plume monitoring data collected in situ during the summer field campaigns. The ADCP deployments will be conducted during the low energy April–May period. The validation sampling will be conducted to capture low energy conditions.
To calibrate the model relative to conservative (low energy) conditions encountered during April–May).
To validate the model against appropriate solute fields (i.e. encountered during low energy periods)
Within 9 months of acceptance of the plan to allow for autumn current meter deployments, subsequent modelling, interpretation and reporting
Use the improved understanding of dilution as well as estimates of the magnitude and duration of contaminant and TSS spikes to determine whether balancing dam flushing exceeds ANZECC/ARMCANZ (2000a) guidelines
To derive a management system to ensure when the balancing dam is flushed, dilution at the diffuser is sufficient to meet the relevant ANZECC/ARMCANZ species protection guideline values at the edge of the LEPZ (particularly for ammonia)
Within 9 months of acceptance of the plan to allow for autumn current meter deployments, subsequent modelling, interpretation and reporting

BMT Oceanica: Water Corporation: Sepia Depression Ocean OutletMonitoring and Management Plan 7
2. Background
2.1 Wastewater discharge in Perth’s metropolitan coastal waters The Water Corporation operates three major wastewater treatment plants (WWTPs) within metropolitan Perth, at Beenyup, Subiaco and Woodman Point. The bulk of the treated wastewater is discharged to the sea through ocean outlets located at Ocean Reef, Swanbourne and Sepia Depression, respectively. The Water Corporation has undertaken monitoring of the environmental effects of treated wastewater discharge into Perth’s coastal waters since the construction of the ocean outlets at Swanbourne in 1963, Sepia Depression in 1984 and Ocean Reef in 1978 (Outlet A) and 1992 (Outlet B). The Woodman Point WWTP services the southern Perth metropolitan area and predominantly receives domestic wastewater (from kitchen, bathroom, toilet and laundry uses), with approximately 8% received from light industrial wastewater. In 2002, the Woodman Point WWTP was upgraded from primary to advanced secondary level treatment. Currently, the plant produces secondary treated wastewater using an activated sludge process with nitrification and denitrification stages for nutrient removal (Figure 2.1). In 2012-2013, the Woodman Point WWTP discharged approximately 132 ML d-1 of secondary treated wastewater to the sea through the Sepia Depression ocean outlet. Approximately 24 ML day-1 of this secondary treated wastewater is further treated at the Kwinana Water Reclamation Plant into high-grade industrial processing water for use by industries in the Kwinana area. Following industrial processing, this water is then redirected back into the SDOOL (Figure 2.2). An additional 18 ML d-1 of primary treated wastewater was discharged through the same outlet from the smaller Point Peron WWTP, downstream of the Woodman Point WWTP (Figure 2.2). The Sepia Depression ocean outlet discharges approximately 4 km offshore into the Sepia Depression (refer Figure 2.1 and Figure 2.2), into a water depth of 20 m. The ocean outlet has an overall (offshore) length of 4.2 km and a diffuser length of 324 m.

8 BMT Oceanica: Water Corporation: Sepia Depression Ocean OutletMonitoring and Management Plan
Figure 2.1 Location of Sepia Depression Ocean Outlet

BMT Oceanica: Water Corporation: Sepia Depression Ocean OutletMonitoring and Management Plan 9
Figure 2.2 Contributors into the Sepia Depression Ocean Outlet

10 BMT Oceanica: Water Corporation: Sepia Depression Ocean OutletMonitoring and Management Plan
2.2 Receiving environment of the Sepia Depression Sepia Depression is a natural channel approximately 5 km long and 20 m deep (Figure 2.1), with the seabed (including the area around the outlet) largely consisting of fine to coarse unvegetated sand. The western boundary of the Sepia Depression is the reef line of Five Fathom Bank, which lies roughly parallel to the coastline, while the eastern boundary is the Garden Island reef line of rocky islands, channels and gaps that also runs parallel to the coastline. Garden Island separates Sepia Depression from Cockburn Sound, although the southern opening of Cockburn Sound provides a channel between the Sound and Sepia Depression.
Coastal hydrodynamics and circulation The offshore wave climate of Perth is dominated by a persistent low-to moderate-energy wave regime, and is generally far more variable in winter than in summer. The summer swell arrives from the west to south-west and is typically 1–2 m in height. Winter swell arrives from almost due west and is typically 1–3 m in height. During summer, the afternoon sea breeze results in the development of local seas (typical wave heights are 0.5–1.5 m) that are superimposed upon the swell regime. Local seas are also generated by the passage of winter storms; wave height and direction varies considerably from storm to storm, but the wave heights often exceed 4 m (7 m or more in severe storms). The offshore reef chains dissipate the wave energy received inshore. The Five Fathom Bank reef line varies in depth to a maximum of 10 m and is sufficiently shallow to cause some attenuation of the swell wave energy within the Sepia Depression, but the shallower Garden Island Ridge results in far greater attenuation. Therefore, the waters of the Sepia Depression are of higher wave energy than most of the inshore waters of Perth. Wind is the main factor influencing coastal circulation in the inshore waters, particularly in summer when up to 60% of the variation in the ocean currents can be explained by the wind field (Pattiaratchi & Knock 1995). The prevailing summer winds drive northward-flowing littoral currents, although periods of current reversal can occur when winds come from the north, particularly in winter. Currents are strongly influenced by the inshore bathymetry, and the offshore reef line channels water flow parallel to the shore. In the Sepia Depression the seasonal distribution of mid-depth current direction is bimodal, with northward flows predominating in summer and southward flows in winter. Ambient current velocities are typically 5–20 cm/s. A year of current measurements recorded in the Sepia Depression in 1993 (deemed a ‘typical’ year in terms of winds and currents) showed that current speed equals or exceeds 5 cm/s for 97.5% of the time, and averages 13 cm/s (Bailey et al. 2003).
Marine ecology Perth’s submerged offshore reefs support extensive stands of macroalgae, predominantly larger species of brown algae (Ecklonia radiata, Scytothalia dorycarpa and Sargassum spp.) but also mixed assemblages of smaller species of red, green and brown algae, particularly on areas of limestone pavement. A diverse assemblage of sponges, gorgonians and other invertebrates also inhabits the reefs. In shallow (<10 m deep) sheltered waters inshore of the reef lines, seagrass habitats typically occupy a larger area than the macroalgal-covered reefs (Oceanica & CRC 2005). Unlike the western coastlines of the other southern continents, Western Australia lacks any major oceanic upwelling and consequently does not have the highly productive plankton food chains that support the large finfish fisheries of the west coasts of South America and southern Africa. The fish populations in the nutrient-poor nearshore waters of Perth depend largely on benthic-based food chains in the seagrass meadows, macroalgal-dominated reef systems and detritus-

BMT Oceanica: Water Corporation: Sepia Depression Ocean OutletMonitoring and Management Plan 11
enriched basins. The Sepia Depression, although relatively deep, experiences too much wave energy for the accumulation of detritus from adjoining reefs. The relatively high wave energy experienced in the Sepia Depression is also evident in its' coarse, sandy, nutrient-poor sediments. Consequently, the benthic fauna of the Sepia Depression is naturally low in biomass and species diversity (Bailey et al. 2003).
2.3 Potential environmental impacts of WWTP discharge The Water Corporation acknowledges that treated wastewater will contain elevated concentrations of nutrients, metals and organic particulates. Herbicides and pesticides may also be present in the wastewater discharge, but long-term monitoring has demonstrated that the concentration of these substances is very seldom higher than detection limits. Discharge from WWTPs contains three classes of materials of potential environmental concern: Pathogenic organisms from faecal material: these are a potential threat to human health via
accidental swallowing of contaminated waters during recreational activities or via consumption of uncooked seafood (note: cooking destroys enteric bacteria). Bacterial groups typically monitored are faecal streptococci (to assess recreational suitability) and thermo-tolerant coliforms (to assess suitability for shellfish consumption)
Metals and persistent organic compounds: these may accumulate in biota at concentrations sufficient to be a concern for human consumption of seafood. As the Woodman Point WWTP is not a combined system (i.e. it does not collect stormwater runoff) and accepts no heavy industrial waste, the persistent organic compounds of potential concern are mainly trace concentrations of pesticides and do not include substances such as polychlorinated biphenyls (PCBs) or petroleum hydrocarbons.
Nutrients: dissolved inorganic forms make up the majority of nitrogen and phosphorus discharged from outlets. These nutrients enhance the growth of aquatic plants in the water column (i.e. phytoplankton) and on the seabed (e.g. reef algae, seagrass epiphytes), which may lead to changes in the abundance and species composition of aquatic plant communities if some species are favoured more than others by the increased nutrient supply. Particulate organic material can also accumulate in sediments and the resultant increased food supply may cause alterations to benthic fauna abundance and species composition.
Examples of the direct and indirect effects of the construction and operation of the Sepia Depression wastewater outlet on the marine environment are described in the Public Environmental Review (PER) for disposal of industrial wastewater via the SDOOL (Bailey et al. 2003). The Water Corporation has monitored the effects of wastewater discharge on the marine environment since the commissioning of the Sepia Depression Ocean Outlet in 1984, with monitoring expanding and evolving into the PLOOM program in 1996. Since 1984 there have been very few exceedances of any of the relevant contaminant guidelines, and the receiving environment is considered to have undergone no adverse impacts (Oceanica 2010b). Best practice environmental management depends on knowledge of the potential effects of ocean wastewater disposal together with an understanding of the receiving environment, including the extent of natural environmental variation. To ensure that the effects (if any) of ocean disposal are detected early, the Water Corporation has committed to an extensive program of environmental monitoring, the details of which are included in this M&MP.
2.4 Environmental commitment The Water Corporation has carefully considered the potential for environmental impacts of WWTP discharge into the Sepia Depression, and all reasonable actions have been taken to mitigate impacts through effective and integrated management. Environmental modelling was used to predict the likely effect of the treated wastewater plume, including the likely zone of influence and the expected concentrations of contaminants following initial dilution (Bailey et al. 2003).

12 BMT Oceanica: Water Corporation: Sepia Depression Ocean OutletMonitoring and Management Plan
Results of the modelling indicated that the physical oceanographic characteristics (i.e. the exposed coastline and high wave energy conditions) of the Sepia Depression are likely to facilitate effective dilution and dispersal of the treated wastewater, thus limiting the potential for detrimental effects. For example, the average dilution of treated wastewater (even under worst-case conditions) will dilute contaminants to levels below the ANZECC/ARMCANZ (2000) trigger values for protection of 99% of species.. To ensure that the effects (if any) of ocean disposal are detected early, the Water Corporation has committed to an extensive and ongoing program of environmental monitoring across all Perth metropolitan WWTPs, presently implemented via the Perth Long-term Ocean Outlet Monitoring (PLOOM) Program. The components of the PLOOM program conducted under the EQMF framework have now been incorporated into this SDOOL M&MP.
2.5 Relationship of this M&MP to the PLOOM Monitoring Program The Perth Long-term Ocean Outlet Monitoring (PLOOM) Program formally commenced in 1996. The program is based on an understanding of the environmental processes that occur as a consequence of the discharge of treated wastewater, with regards to potential effects on the marine environment and human health. PLOOM was designed as a long-term program, monitoring any potential chronic problems resulting from the three metropolitan ocean outfalls (Ocean Reef, Swanbourne and Sepia Depression). The PLOOM Program has historically included monitoring components relevant to the SDOOL wastewater outlet: Annual summer water quality surveys: As a requirement under the licence conditions for
the Woodman Point and Point Peron WWTPs, the Water Corporation conducts comprehensive annual summer surveys of water quality in the vicinity of the Sepia Depression ocean outlet. The annual summer water quality surveys are not conducted in a manner consistent with the EQMF framework and have not been incorporated into this management plan. However, as a licence condition they will continue to be conducted regardless.
Seasonal water quality monitoring: Seasonal sampling of water column physical-chemical characteristics, nutrients and primary productivity (chlorophyll-a) at four sites near the Sepia Depression ocean outlet. This was discontinued in 2008.
PLOOM Compliance monitoring: A period of intensive summer water quality monitoring at compliance monitoring sites and reference sites near the Sepia Depression ocean outlet. The core components of the compliance monitoring program are: i. physical stressor monitoring (i.e. salinity and dissolved oxygen) ii. nutrient and phytoplankton monitoring iii. public health monitoring.
Ministerial Condition 6.1 requires that the SDOOL M&MP include the monitoring and evaluation of the effects of discharging treated wastewater into the Sepia Depression. Operational procedures for monitoring some of these effects have historically been incorporated, and will remain a component of PLOOM. However, the long-term environmental quality objectives and environmental quality criteria relevant to managing these effects that are managed by PLOOM are formalised and set out via this SDOOL M&MP (Section 4). In the unlikely event that PLOOM or components of PLOOM ceases, monitoring will continue at Sepia Depression in the manner described in this M&MP.

BMT Oceanica: Water Corporation: Sepia Depression Ocean OutletMonitoring and Management Plan 13
3. Environmental Management Framework
3.1 Environmental management framework background The EPA is implementing an Environmental Quality Management Framework (EQMF) for Perth’s coastal waters (EPA 2000, 2005a; Govt of WA 2005). This EQMF is based on: Identifying Environmental Values2 Establishing and spatially defining Environmental Quality Objectives (EQOs)3 that need to
be maintained to ensure the associated Environmental Values are protected Monitoring and managing to ensure the EQOs are achieved and/or maintained in the long-
term in the areas they have been designated Establishing Environmental Quality Criteria (EQC), which are quantitative bench marks or
‘trigger values’ against which monitoring results can be compared. According to the EQMF, the extent to which the Environmental Values and EQOs are met is assessed against a suite of appropriate EQC. There are two levels of EQC; Environmental Quality Guidelines and Environmental Quality Standards (refer to Section 5): Environmental Quality Guidelines (EQGs) — quantitative, investigative triggers which signify low risk of an environmental effect if they are met, and trigger further investigations if an exceedance occurs Environmental Quality Standards (EQSs) — management triggers based on multiple lines of evidence, which if exceeded signify that the Environmental Quality Objective is not being met and that a management response is required.
3.2 SDOOL environmental management framework The SDOOL M&MP is based on the EQMF for Perth’s coastal waters, as outlined above (Section 3.1). This section (3.2) describes the environmental management process that underpins the M&MP; the Environmental Values and EQOs specific to the Sepia Depression are described in Sections 3.2.1 and 3.2.2, respectively. A Compliance Monitoring program, incorporating Environmental Quality Indicators and EQC that are compared against relevant EQOs, is described in Section 3.2.3. In the event that an EQC is exceeded, the Water Corporation will initiate the appropriate management responses. Management responses will range from continued monitoring through to investigations into management interventions, which would include cessation of industrial wastewater acceptance into the SDOOL if necessary. The level of management response will depend upon the nature of the exceedance, and would include consideration of the background levels, guideline or standard criteria and/or the severity of observed environmental conditions. The management response will be consistent with the risk management framework outlined in the Environmental Quality Criteria Reference Document for Cockburn Sound 2003-04 (EPA 2005a, Figure 3.1).
2 Particular values or uses of the environment that are important for a healthy ecosystem or for public benefit, welfare, safety or health, and which require protection from the effects of pollution, waste discharges and deposits. 3 More specific than EVs and representing management goals for maintaining environmental quality to protect particular aspects of the EVs from the effects of wastes.

14 BMT Oceanica: Water Corporation: Sepia Depression Ocean OutletMonitoring and Management Plan
Source: EPA (2005a)
Figure 3.1 Environmental Risk/Management Response
To establish the level of compliance required to meet the identified EQOs, the monitoring results will be compared against the EQC. As noted above, there are two levels of EQC: Environmental Quality Guidelines (EQGs) and Environmental Quality Standards (EQSs), and these demarcate three levels of management response: If monitored values are below the EQG then the EQO are considered to have been met and
the Environmental Values protected, routine monitoring then continues as per the M&MP. If an EQG is exceeded it is considered there is an increased risk that the associated EQO
may not be achieved. This triggers the need for a more comprehensive assessment against the EQS. A more comprehensive assessment against an EQS involves a risk-based approach that considers multiple lines of evidence and integrates more refined measures of the surrogate indicators with more direct measures of the EQO (EPA 2005a).
If an EQS is exceeded it is considered there is a significant risk that the associated EQO has not been achieved. This triggers a detailed investigation, including an adaptive management response to ensure the EQO is achieved and the exceedance does not occur again. The Office of the Environmental Protection Authority (OEPA) will be notified when an EQS is exceeded, and advice will be sought on management actions to complement those outlined in this M&MP.

BMT Oceanica: Water Corporation: Sepia Depression Ocean OutletMonitoring and Management Plan 15
3.2.1 Sepia Depression Environmental Values Three Environmental Values have been identified for the Sepia Depression (EPA 2004): Ecosystem Health (an ecological value) Fishing and Aquaculture (a social value) Recreation and Aesthetics (a social value).
3.2.2 Sepia Depression Environmental Quality Objectives There are five EQOs that must be achieved at the ocean outfall in order to maintain the Environmental Values at the Sepia Depression (EPA 2000). The EQOs need to be sustained for the long term by achieving the short- to medium-term targets described in this M&MP. The EQOs for the SDOOL ocean outfall are: Maintenance of Ecosystem Integrity (EQO1) Maintenance of Aquatic Life for Human Consumption (EQO2) Maintenance of Primary Contact Recreation Values (EQO3) Maintenance of Secondary Contact Recreation Values (EQO4) Maintenance of Aesthetic Values (EQO5).
3.2.3 Sepia Depression Environmental Quality Criteria EQC have been defined for key indicators of environmental health for each of the Environmental Quality Objectives 1 to 5 (Section 3.2.2) relevant to the Sepia Depression. As per EPA (2005a), EQC have been set at two levels: Environmental Quality Guidelines (EQGs) and Environmental Quality Standards (EQSs). These are set out in Section 4.

16 BMT Oceanica: Water Corporation: Sepia Depression Ocean OutletMonitoring and Management Plan
4. Environmental Quality Objectives and Criteria
4.1 Maintenance of Ecosystem Integrity (EQO1)
4.1.1 Objective The EQO for the Environmental Value ‘Ecosystem Health’ is aimed at maintaining ecosystem integrity and biodiversity, thereby ensuring the continued health and productivity of Perth’s coastal waterways (EPA 2000). To ensure this EQO is being met, monitoring programs have been developed to measure compliance against EQC set for waste stream monitoring, toxicants in treated wastewater, receiving water physio/chemical measures, receiving water direct biological measures and toxicants in sediments (Figure 4.1). The requirement is that ecosystem integrity, considered in terms of structure (e.g. biodiversity) and function (e.g. trophic links), will be maintained in the vicinity of the Sepia Depression wastewater outlet. The level of protection around the outlet will remain high (i.e. small changes from natural variation) except in a Low Ecological Protection Area (LEPA), where large changes from natural variation are permitted. The LEPA has been defined for toxicants (Figure 4.2) and includes waters within a 100 m radius around the diffuser (an area of approximately 10.5 ha). The diffuser location is 373340 E and 6426510 N (MGA94 Zone 50) with waters outside this zone to be managed as a High Ecological Protection Area (HEPA). Contaminants will be monitored in the treated wastewater prior to discharge, as well as within the receiving environment near the SDOOL ocean outlet. The primary contaminants of concern are nutrients (principally nitrogen and phosphorus) and toxicants (i.e. metals, herbicides, pesticides and organic particulates). The concentration of nutrients in receiving waters will be managed via the SDOOL EQC for physico-chemical parameters (see Section 3.2.3), which are described in full in Table 4.1 with results reported annually. The required management response following any exceedances of these EQC is set out in Table 4.2. Toxicant characteristics are also defined within MS 665 (Schedule 1; see below) and EQC defined and described in full (Table 4.1). Within the LEPA, an average dilution of the wastewater stream of at least 300-fold, and above 200-fold 99% of the time, is to be achieved. With a 200-fold dilution at the edge of the LEPA, the ANZECC/ARMCANZ (2000) 99% species protection guidelines for toxicants (with the exception of cobalt, for which the 95% species protection guideline will apply) will be met under both typical and worst-case discharge concentrations.
4.1.2 Schedule 1 monitoring and management requirements Key proposal characteristics (Table 1 in Schedule 1 of MS 665) have been adopted as TWW targets. Water Corporation and industry participants will undertake monthly monitoring to ensure concentrations in their combined treated wastewater do not exceed the targets for total suspended solids (TSS), biochemical oxygen demand (BOD) and total phosphorus (TP). The monthly average contributions from each industry participant will be flow-weighted and pooled to derive an estimate of monthly concentrations in the combined TWW stream. The monthly TWW stream estimates for 1 calendar year will be compared to the operational targets. In the event that TSS, BOD or TP exceed the targets detailed in Schedule 1 of MS 665 on more than one occasion, the Water Corporation will investigate each of the participants to the SDOOL, to determine the cause and origin of the exceedance. If the investigation of the SDOOL participants cannot identify the cause of and correct an exceedance, an appropriate management response will be initiated. A wastewater characterisation will be conducted to determine whether the

BMT Oceanica: Water Corporation: Sepia Depression Ocean OutletMonitoring and Management Plan 17
conditions that have generated an exceedance of the schedule 1 targets have also introduced unidentified toxicants to the waste stream. The characterisation will be conducted as described in section 5.3.2). Dilution determined by modelling (Appendix C) will be applied to determine the concentrations of contaminants, toxicants and potential stressors at the HEPA/LEPA boundary for comparison to triggers. A 1-hour urchin fertilization toxicity test will also be conducted to determine the overall toxicity of the discharge. The results will be assessed against the EQG and, if necessary EQS for treated wastewater characterisation and WET testing as defined in Table 4.1. Any exceedance and the outcome of the subsequent investigation will be reported in the annual report. The annual nitrogen load to the Sepia Depression must not exceed the nitrogen load discharged from the outlet in 1994 (1778 t). In 2013, the annual nitrogen load was 1,110 t. In the event that subsequent monitoring shows an adverse environmental impact at the 1994 nitrogen load, there is a requirement to reduce the annual nitrogen load to 75% of the load discharged from the outlet in 1994.
Note: 1. Components managed by the SDOOL and PLOOM monitoring programs are highlighted in blue and orange,
respectively.
Figure 4.1 Environmental quality objectives, criteria and monitoring programs for maintaining the environmental value Ecosystem Health
EV Ecosystem Health
EQO Maintenance of ecosystem integrity
EQC1 Waste stream
monitoring
EQC2 Toxicants in
treated wastewater
EQC3Receiving water
physico/chemical measures
EQC 4Receiving water direct biological
measures
EQC5:Toxicants in sediments
Monitoring Program:Real-time
monitoring
Monitoring Program:Treated
wastewater characterisation
Monitoring Program:
Initial dilution
modelling
Monitoring Program:
WET Testing
Monitoring Program:Sentinel mussel
monitoring
Monitoring Program:
Compliance monitoring
Monitoring Program:
Compliance monitoring
Monitoring Program:Sediment
quality monitoring

18 BMT Oceanica: Water Corporation: Sepia Depression Ocean OutletMonitoring and Management Plan
Figure 4.2 Sepia Depression ocean outlet ecological protection boundaries

BMT Oceanica: Water Corporation: Sepia Depression Ocean Outlet: Monitoring and Management Plan 19
4.1.3 Environmental quality criteria Table 4.1 Environmental Quality Criteria for the EQO of Maintenance of Ecosystem Integrity (EQO1)1
Environmental Quality Indicator
Environmental Quality Criteria2
Environmental Quality Guideline Environmental Quality Standard
Toxicants in Treated Wastewater Ammonia Metals Pesticides Herbicides Other chemicals
Treated wastewater characterisation – bioaccumulating toxicants Concentrations of contaminants will not exceed the ANZECC/ARMCANZ (2000) 80% species protection guideline trigger levels for bioaccumulating toxicants at the diffuser (Figure 4.2)
Sentinel mussel monitoring The EQS will be met if median concentrations of metals that may bioaccumulate (cadmium and mercury) within mussel tissue from sites at the boundary of the Low/High Ecological Protection Areas are lower than or equal to the 80th percentile of mussel tissue concentrations from reference sites.
Treated wastewater characterisation – non bioaccumulating toxicants The information on wastewater quality corrected for minimum dilution at the LEPA boundary will be compared with Table 5.1 and Table 5.2 to determine whether: 1. The ANZECC/ARMCANZ (2000) 99% species protection guideline trigger levels for toxicants (with the
exception of cobalt, where the 95% guideline trigger level will apply), are being achieved at the boundary of the Low Ecological Protection Area (LEPA) (i.e. a high level of protection is met beyond a 100 m radius of the diffuser) (Figure 4.2).
2. The total toxicity of the mixture (TTM) for the additive effect of ammonia, copper and zinc (as per ANZECC/ARMCANZ (2000) guidelines) is less than 1.0 (refer to Section 5.3.6). Note that for metals, the assessment is to be based on bioavailable concentrations of metals in the wastewater (i.e. concentrations after filtering through a 0.45 µm filter).
Table 5.2 list the main toxicants of concern in relation to the predominant waste stream, i.e. treated wastewater: ammonia, copper and zinc are considered to be the major cause of toxicity effects. If any EQGs are exceeded, assessment against the EQS will commence.
Whole-of-effluent toxicity (WET) testing Undertake the full suite of WET testing of the waste stream in accordance with ANZECC/ARMCANZ (2000) guidelines. The EQS will be exceeded where:
1%99
BurrliOZDR
DALEPA
Where DALEPA = Dilutions achieved at the boundary of the LEPA; DR99%BurrliOZ = Number dilutions required to achieve the 99% species protection guideline specific to treated wastewater that is calculated with BurrliOZ software using the results of the full suite of WET tests, as per ANZECC/ARMCANZ (2000).
Whole-of-effluent toxicity (WET) testing The EQG will be exceeded if following the 1 hour sea urchin test:
Where TDA = Typical Dilutions Achieved (constant based on 200-fold dilution) DRNOEC = Number of dilutions required to achieve the No Observed Effects Concentration (NOEC). Breaching the above triggers investigations against the EQS, and would comprise the full suite of WET tests (minimum of five species from four trophic groups).
Whole-of-effluent toxicity (WET) testing As per EQS above.
Receiving Water Physical Chemical Measures Nutrient enrichment Light attenuation Dissolved oxygen Salinity
Nutrient enrichment 1. Ambient value4 of defined area5 during non river-flow period6 not to exceed chlorophyll-a: 80th percentile
of reference sites data. 2. Ambient value4 of defined area5 during non river-flow period6 not to exceed light attenuation: 80th
percentile of reference sites data.
Not applicable. No suitable EQS available.
Organic enrichment Ambient value4 for dissolved oxygen in bottom waters (0–0.5 m above the sediment surface) greater than 90% saturation at any site for a defined period of not more than six weeks.
Organic enrichment Ambient value4 for dissolved oxygen in bottom waters (0–0.5 m above the sediment surface) greater than 60% saturation at any site for a defined period of not more than six weeks. No deaths of marine organisms resulting from de-oxygenation.
Salinity Median salinity (0.5 m below the water surface) at an individual site over any period not to deviate beyond the 20th and 80thile of natural salinity range over the same period.
Salinity No deaths of marine organisms resulting from anthropogenically-sourced salinity stress.
Receiving Water Direct Biological Measures (Algal growth potential) Phytoplankton
biomass (Chlorophyll-a)
Phytoplankton blooms 1. Ambient value4 for phytoplankton biomass measured as chlorophyll-a not to exceed 3 times median
chlorophyll-a concentration of reference sites, on any occasion during non river-flow period6. 2. Phytoplankton biomass measured as chlorophyll-a at any site does not exceed 3 times median
chlorophyll-a concentration of reference sites, on 25% or more occasions during the non river-flow period6.
If either of these EQGs are exceeded, assessment will proceed against the EQS.
Phytoplankton blooms 1. Ambient value4 for phytoplankton biomass measured as chlorophyll-a not to exceed 3 times median chlorophyll-a
concentration of reference sites, on more than one occasion during non river-flow period6 and in two consecutive years. 2. Phytoplankton biomass measured as chlorophyll-a at any site does not exceed 3 times median chlorophyll-a concentration
of reference sites, on 25% or more occasions during the non river-flow period6 and in two consecutive years.
TDADRNOEC
<1.0

20 BMT Oceanica: Water Corporation: Sepia Depression Ocean Outlet: Monitoring and Management Plan
Environmental Quality Indicator
Environmental Quality Criteria2
Environmental Quality Guideline Environmental Quality Standard
Toxicants in Sediments Metals Pesticides Herbicides
Sediment quality monitoring A. Median sediment total contaminant concentration from a defined sampling area should not exceed the environmental quality guideline value for high, moderate and low ecological protection areas. (Table 5.5) B. Total contaminant concentration at individual sample sites should not exceed the environmental quality guideline re-sampling trigger (Table 5.5). If so, repeat sampling will be conducted to define the extent of the contamination which will assessed as in point A
Sediment quality monitoring A. The 80%ile of bioavailable metal or metalloid concentrations (e.g. dilute acid extractable metals, SEM/AVS analysis) from the defined sampling area should not exceed the EQG. or B. The median bioavailable concentration for non-metallic contaminants (e.g. OC normalisation) from the defined sampling area should not exceed the EQG C. The 95%ile of bioavailable contaminant concentrations in porewater samples from the defined sampling area should not exceed high protection water quality guideline values (Table 2a of EQC Reference document). D. Sediment toxicity tests should not result in a statistically significant effect (P < 0.05) on sublethal chronic or lethal acute endpoints for any species, compared to a matched reference sediment E. No significant change in any biological or ecological indicator beyond natural variation that can be demonstrably linked to a contaminant F. Where TBT concentrations exceed the guideline the incidence of imposex in Thais orbita should be ≤ 5%. G. The median tissue concentration of chemicals that can adversely bioaccumulate or biomagnify should not exceed the 80th percentile of tissue concentrations from a suitable reference site.
Notes: 1. Based on the Environmental Quality Criteria Reference Document for Cockburn Sound (2003–2004) (EPA 2005a). 2. Where there is more than one Environmental Quality Criteria for an indicator, each one is to be considered individually. If any one of these is exceeded then the guideline or standard for that indicator has not been met. 3. Ambient Value = median value of individual sample data for a defined area. 4. Defined Area = area to be characterised for environmental quality against pre-determined Environmental Quality Objectives and levels of ecological protection. 5. Non River-flow Period = period December–March inclusive, when river and estuarine flows are weak.

BMT Oceanica: Water Corporation: Sepia Depression Ocean Outlet: Monitoring and Management Plan 21
Table 4.2 Management response following exceedances of EQC for the EQO of Maintenance of Ecosystem Integrity (EQO1)
Environmental Quality Indicators Management response following trigger level exceedance
Environmental Quality Guideline Environmental Quality Standard Toxicants in Treated Wastewater Treated wastewater characterisation – bioaccumulating toxicants
In the event that concentrations of contaminants exceed the ANZECC/ARMCANZ (2000) 80% species protection guideline trigger levels for bioaccumulating toxicants at the diffuser the Water Corporation will report the exceedance to the OEPA and Department of Environment Regulation (DER) within one working day of determining that it has occurred. Assessment against the EQS will then commence.
Sentinel mussel monitoring The EQS requires that median concentrations of metals that may bioaccumulate (cadmium and mercury) within mussel tissue from sites at the boundary of the Low/High Ecological Protection Areas will be compared to 80th percentile of values from reference sites. Any instances of an exceedance of the EQGS will be reported to the DER and the OEPA within one working day of determining that this has occurred. The significance of the exceedance, and any required investigation/action will be discussed with the OEPA. If required, a detailed risk assessment to indicate potential risk to the environment will be conducted. Toxicity Reduction Evaluation (TRE) will be undertaken, to identify the contaminant(s) of concern, and the management required to reduce them to acceptable levels. This would include a detailed examination of the contributor’s waste streams. Management measures to reduce the contaminant(s) of concern will be implemented and ongoing wastewater characterisation will be conducted to confirm that the required results are being achieved.
Treated wastewater characterisation – non bioaccumulating To determine whether the EQG for treated wastewater characterisation is exceeded, check whether the EQGs are met at the edge of the LEPA using measured contaminant concentrations corrected for minimum dilution at the LEPA boundary. If the EQGs are met, then no further work is required. If an EQG is exceeded, the first step will be to immediately collect and re-analyse a further sample of wastewater. If the EQG is still exceeded, initiate the Water Corporation will report the exceedance to OEPA and DER within one working day of determining that this has occurred and assessment against the EQS will commence.
Whole-of-Effluent-Toxicity (WET) testing If the EQG is exceeded the Water Corporation will undertake the full suite of Whole-of-Effluent-Toxicity testing of the treated wastewater in accordance with ANZECC/ARMCANZ (2000) guidelines. A sample will also be collected for comprehensive treated wastewater analysis. To meet the EQS the number of dilutions required to be protective of least 99% of species (calculated using BurrliOz software on sub-lethal chronic endpoints for five species from a minimum of four taxonomic groups) should be less than the number of dilutions attained at the boundary of the LEPA. The proposed management response based on an exceedance of the EQS is: 1. A Toxicity Reduction Evaluation (TRE) will be undertaken to identify the contaminant(s) of concern and the
management required to reduce them to acceptable levels. This would include a detailed examination of the treated wastewater and potentially include a Stage 1 Toxicity Identification Evaluation.
2. Management measures to reduce the contaminant(s) of concern will be implemented, along with monitoring to confirm that the required results are being achieved. The monitoring could include wastewater characterisation, further WET tests, and in situ monitoring, subject to further consultation with the OEPA.
The Water Corporation will report annually to the OEPA on any management initiated as a result of the WET tests outcomes. The Water Corporation will report any instances of an exceedance of the EQG or EQS to the OEPA and DER within one working day of determining that this has occurred.
Physical Chemical Measures Nutrient enrichment, organic enrichment and salinity If nutrient enrichment (chlorophyll-a), light attenuation, dissolved oxygen or salinity EQGs are exceeded, then an assessment will proceed against the EQS, as per Appendix B. The Water Corporation will report any instances of an exceedance of the EQG or EQS to the OEPA and DER within one working day of determining that this has occurred.
Nutrient enrichment, organic enrichment and salinity If the EQS is exceeded, a management response will be initiated in consultation with the OEPA and other relevant regulatory agencies to investigate potential effects on algal community structure and whether it has shifted by a margin beyond that expected due to natural processes alone. The Water Corporation will report any instances of an exceedance of the EQG or EQS to the OEPA and DER within one working day of determining that this has occurred. The Alkimos WWTP management plan (Oceanica 2010a) provides an indicative monitoring plan to demonstrate whether a change in the macroalgal community structure can be attributed to the SDOOL wastewater discharge. If so, the Water Corporation will take specific management actions to address nutrient loading due to the wastewater discharge. One of the specific management actions may include the option of modifying the diffuser to increase dilution, such as utilising extra contingency ports and/or increasing the velocity of the wastewater stream.
Direct Biological Measures Phytoplankton blooms If the algal growth potential EQGs are exceeded, assessment will proceed against the EQS. The Water Corporation will report any instances of an exceedance of the EQG or EQS to the OEPA and DER within one working day of determining that this has occurred.
See exceedance of EQS for nutrient enrichment

22 BMT Oceanica: Water Corporation: Sepia Depression Ocean Outlet: Monitoring and Management Plan
Environmental Quality Indicators Management response following trigger level exceedance
Environmental Quality Guideline Environmental Quality Standard Toxicants in Sediments Sediment quality monitoring
In the event that an ISQG-Low trigger level (ANZECC/ARMCANZ 2000) for sediment quality is exceeded, the Water Corporation will report the matter to the DER and the OEPA within one working day of determining that this has occurred. An investigation of the exceedance will be conducted in accordance with the framework developed in the Environmental Quality Criteria Reference Document for Cockburn Sound (2003-2004) (EPA 2005a) (see also Appendix B). In the event that an ISQG-High trigger level (ANZECC/ARMCANZ 2000) for sediment quality is exceeded, the Water Corporation will report the matter to the DER and the OEPA within one working day of determining that this has occurred. An investigation of the exceedance will be conducted in accordance with the framework developed in the Environmental Quality Criteria Reference Document for Cockburn Sound (2003-2004) (EPA 2005a).
Sediment quality monitoring The proposed management response based on an exceedance of the EQS is: 1. A Toxicity Reduction Evaluation (TRE) will be undertaken to identify the contaminant(s) of concern and the
management required to reduce them to acceptable levels. This would include a detailed examination of the treated wastewater and potentially include a Stage 1 Toxicity Identification Evaluation.
2. Management measures to reduce the contaminant(s) of concern will be implemented, along with monitoring to confirm that the required results are being achieved. The monitoring could include wastewater characterisation, further WET tests, and in situ monitoring, subject to further consultation with the OEPA.

BMT Oceanica: Water Corporation: Sepia Depression Ocean Outlet: Monitoring and Management Plan 23
4.2 Maintenance of Aquatic Life for Human Consumption (EQO2)
4.2.1 Objective The EQO for the Environmental Value ‘Fishing and Aquaculture’ is aimed at ensuring the addition of industrial wastewater discharge (which contains contaminants but no measurable level of bacteria) will not affect the long-term EQO within the area around the ocean outlet. To ensure this EQO is being met, monitoring programs have been developed to measure compliance against EQC set for thermo-tolerant coliforms, metals and chemicals and algal biotoxins (Figure 4.3). As the wastewater discharge from the Sepia Depression ocean outlet travels in a northerly direction due to prevailing longshore currents (Bailey et al. 2003), the wastewater is not considered to pose a risk to shellfish quality in Cockburn Sound (DoF 2007). However, the area immediately adjacent to the outlet (See Proposed Closed Safety Zone, Figure 4.4) is considered unsuitable for seafood harvesting due to the bacterial content of the treated domestic wastewater component of the effluent (DoF 2007). Consequently, a proposed mussel aquaculture closed safety zone has been established in an area surrounding the outfall (DoF 2007), with boundaries illustrated in Figure 4.4 (noting that coordinates differ slightly to DoF (2007), due to inaccuracies with the zone boundaries). Shellfish are not harvested from around the outlet due to the very sparse natural populations of targeted shellfish in the area. With respect to toxicants, the EQGs and EQSs for maintaining ecosystem integrity, as outlined in the Cockburn Sound SEP, are considered protective of wild seafood populations from the effects of environmental contamination (Govt of WA 2005). EQC for the EQO of Maintenance of Aquatic Life for Human Consumption are shown in Table 4.3. The required management response following any exceedances of these EQC is set out in Table 4.4 The EPA (2004) notes that discharge of industrial wastewater will not prevent attainment of the EPA objective to protect the social environmental values of recreation, fishing, aquaculture and aesthetics for marine waters in the future.

24 BMT Oceanica: Water Corporation: Sepia Depression Ocean Outlet: Monitoring and Management Plan
Note: 1. Components managed by the SDOOL and PLOOM monitoring programs are highlighted in blue and orange,
respectively.
Figure 4.3 Environmental quality objectives, criteria and monitoring programs for maintaining the environmental value Fishing and Aquaculture
EV2:Fishing &
Aquaculture
EQO2: Maintenance of aquatic life for human consumption
EQC Indicator 1:
Thermo-tolerant
coliforms
EQC Indicator 2:
Metals and chemicals
EQC Indicator 3:
Algal biotoxins
Monitoring Program:
Sentinel mussel monitoring
Monitoring Program:
Sentinel mussel monitoring
Monitoring Program:
Compliance monitoring
Monitoring Program:
Sentinel mussel monitoring
Monitoring Program:
Compliance monitoring
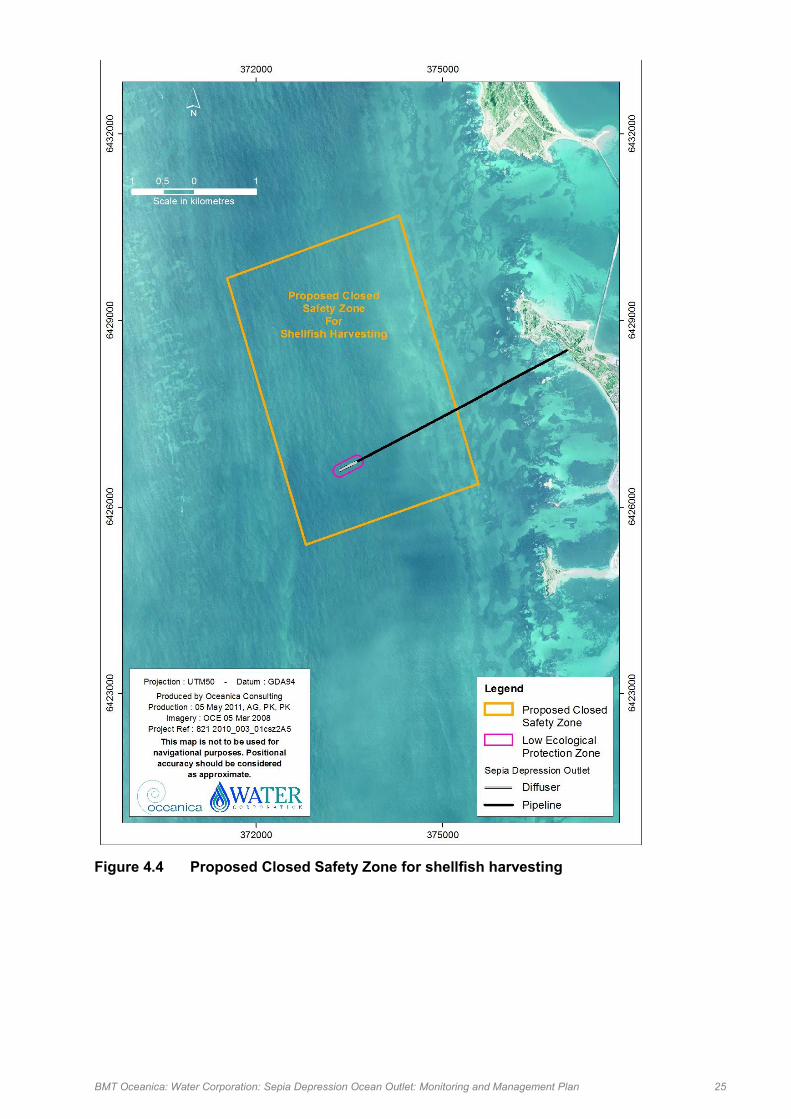
BMT Oceanica: Water Corporation: Sepia Depression Ocean Outlet: Monitoring and Management Plan 25
Figure 4.4 Proposed Closed Safety Zone for shellfish harvesting


BMT Oceanica: Water Corporation: Sepia Depression Ocean Outlet: Monitoring and Management Plan 27
4.2.2 Environmental Quality Criteria Table 4.3 Environmental Quality Criteria for the EQO of Maintenance of Seafood for Human Consumption (EQO2)
Environmental Quality Indicators Environmental Quality Criteria
Environmental Quality Guideline Environmental Quality Standard
Thermo-tolerant Coliforms Median thermo-tolerant coliform counts at sites at the boundary of the Shellfish Harvesting Exclusion Zone (SHEZ) are not to exceed 14 CFU 100 mL-1, with no more than 10% of the samples exceeding 21 CFU 100 mL-1 as measured using the membrane filtration method. If this EQG is exceeded, assessment will proceed against the EQS for coliforms in both water and sentinel mussel tissues.
Median thermo-tolerant coliform counts at sites at the boundary of the SHEZ not to exceed 70 CFU 100 mL-1, with no more than 10% of the samples exceeding 85 CFU 100 mL-1 as measured using the membrane filtration method.
Sentinel mussel monitoring Median thermo-tolerant coliform counts at sites at the boundary of the SHEZ not to exceed 2.3 MPN E. coli/g of flesh (wet wt.) in four out of five representative samples, and the fifth sample should not exceed 7 MPN E. coli/g of flesh (wet wt.), with a maximum total plate count of 250,000 organisms/g (EPA 2005a).
Metals & Chemicals Sentinel mussel monitoring Median concentrations of potentially contaminating metals in the flesh of shellfish deployed at sites at the boundary of the SHEZ are not to exceed the EQG for metals in molluscs published in Table 4 of EPA (2005a).
Sentinel mussel monitoring 1. Concentrations of potentially contaminating metals and organic chemicals in the flesh of shellfish
deployed at sites at the boundary of the SHEZ are not to exceed the EQS for metals and organic chemicals in molluscs published in Table 4 of EPA (2005a) (see also Appendix B).
2. Pesticide residue concentrations in the flesh of shellfish deployed at sites at the boundary of the SHEZ should not exceed the maximum residue limits and extraneous residue limits as set out in FSANZ (2006)2.
Algal Biotoxins Concentrations of potentially toxic algae at sites at the boundary of the SHEZ not to exceed the WASQAP1 trigger concentrations for any of the following: Alexandrium spp. (100 cells/L); Gymnodinium spp. (1000 cells/L); Karenia spp. (1000 cells/L); Dinophysis spp. (500 cells/L); Dinophysis acuminta (3000 cells/L); Prorocentrum spp. (500 cells/L); Psuedo-nitzschia spp. (250000 cells/L); Gonyaulax cf. spinifera (100 cells/L); and Protoceratium reticulatum (Gonyaulax grindleyi) (500 cells/L). If this EQG is exceeded, assessment will proceed against the EQS for sentinel mussel tissues.
Toxin concentrations in seafood not to exceed EQS in any sample at the boundary of the SHEZ3: Paralytic shellfish poison (0.8 mg Saxitoxin eq./kg); Diarrhoetic shellfish poison (0.2 mg/kg); Neurotoxic shellfish poison (200 mouse units/kg); and Amnesic shellfish poison (domoic acid; 20 mg/kg).
Notes: 1. Western Australian Shellfish Quality Assurance Program (DoF 2007). 2. As set out in the Australian New Zealand Food Standards Code (FSANZ 2006). 3. Western Australian Shellfish Quality Assurance Program (WASQAP) Operations Manual (DoF 2007).

28 BMT Oceanica: Water Corporation: Sepia Depression Ocean Outlet: Monitoring and Management Plan
Table 4.4 Management response following exceedances of EQC for the EQO of Maintenance of Seafood for Human Consumption (EQO2)
Environmental Quality Indicators Management following trigger level exceedance
Environmental Quality Guideline Environmental Quality Standard
Thermo-tolerant coliforms In the event of an EQG being exceeded, an investigation into the cause of the exceedance will commence. This is to include the deployment of sentinel mussels at the boundary of the Shellfish Harvesting Exclusion Zone (SHEZ) (see also Appendix B). Any instances of an exceedance of the EQG will be reported to the DoH, the DER and the OEPA within one working day of determining that this has occurred.
If the EQS is exceeded, the Department of Health (DoH) will be contacted and a management response determined based on DoH advice in consultation with the OEPA. Management actions will be taken to reduce the concentration to a level where the EQOs assigned to the receiving waters are achieved (see also Appendix B). Any instances of an exceedance of the EQS will be reported to the DoH, the DER and the OEPA within one working day of determining that this has occurred.
Sentinel mussel monitoring If the EQS is exceeded, Water Corporation will notify DoH, the DER and the OEPA within one working day of determining that this has occurred. Management actions will be taken to reduce the concentration to a level where the EQO assigned to the receiving environment is achieved, and will include (see also Appendix B) An investigation into the conditions prevailing (metocean conditions and plant operations) during the summer
period; and then Development of a management response on advice of the DoH and in consultation with the OEPA,
considering all relevant information collected.
Metals & chemicals An exceedance of the EQG value will result in further assessment against the EQS. Any instances of an exceedance of the EQG will be reported by the Water Corporation to the DoH, the DER and the OEPA within one working day of determining that this has occurred.
Sentinel mussel monitoring As above.
Algal biotoxins An exceedance of a algal biotoxin EQG value at the boundary of the SHEZ will result in further assessment against the EQS (see also Appendix B). Any instances of an exceedance of the EQG will be reported by the Water Corporation to the DoH, the DER and the OEPA within one working day of determining that this has occurred.
Sentinel mussel monitoring As above.

BMT Oceanica: Water Corporation: Sepia Depression Ocean Outlet: Monitoring and Management Plan 29
4.3 Maintenance of Primary and Secondary Contact Recreation Values (EQO3 and EQO4)
4.3.1 Objective The EQO for the Environmental Value ‘Recreation’ [‘and Aesthetics’] is aimed at ensuring Perth’s coastal waters are safe for primary and secondary contact recreation activities such as swimming and boating. In order to meet this objective, water quality around the SDOOL ocean outlet will be maintained so that: primary contact recreation (e.g. swimming) is safe in all waters except areas designated
otherwise (see Figure 4.5) secondary contact recreation (e.g. boating) is safe in all waters except areas designated
otherwise (see Figure 4.5). The addition of industrial wastewater discharge that does not contain measurable levels of bacteria will not affect the area around the SDOOL ocean outlet, which is considered unsuitable for primary (whole-body, i.e. swimming) contact recreation due to the bacterial content of the treated wastewater from the WWTPs. Boundaries where contact recreation is not recommended near the SDOOL ocean outlet have been identified, based on the estimated median faecal streptococci count (Figure 4.6). The long-term EQOs for the maintenance of primary and secondary contact recreation values and their spatial application will not change due to additional industrial wastewater discharge. Trial EQC for the EQOs of Maintenance of Primary and Secondary Contact Recreation are shown in Table 4.6 and Table 4.7, respectively. The required management response following any exceedances of these EQC is set out in Table 4.8. Compliance with the relevant primary and secondary contact recreation guidelines (ANZECC/ARMCANZ 2000) will be reported in the Water Corporation Annual Report.
Note: 1. Components managed by the SDOOL and PLOOM monitoring programs are highlighted in blue and orange,
respectively.
Figure 4.5 Environmental quality objectives, criteria and monitoring programs for maintaining the environmental value Recreation and Aesthetics
EV3:Recreation & Aesthetics
EQOs 3 and 4: Maintenance of primary contact recreation values
EQO5: Maintenance of aesthetic values
EQC Indicator 1:
Faecal pathogens
EQC Indicator 2:
Algal-biotoxins
Monitoring Program:
Compliance monitoring
Monitoring Program:
Compliance monitoring
Indicator:Aesthetic
appearance
Monitoring Program:Routine visual
assessments

30 BMT Oceanica: Water Corporation: Sepia Depression Ocean Outlet: Monitoring and Management Plan
Figure 4.6 Boundary of area surrounding the SDOOL ocean outlet where primary and
secondary contact recreation is not recommended

BMT Oceanica: Water Corporation: Sepia Depression Ocean Outlet: Monitoring and Management Plan 31
Table 4.5 Boundary coordinates for the area surrounding the SDOOL ocean outlet where primary and secondary contact recreation is not recommended
Coordinate Description Easting Northing
1 North-west corner 372979 6427159
2 North-east corner 373979 6427159
3 South-east corner 373979 6426159
4 South-west corner 372979 6426159
4.3.2 Environmental quality criteria Table 4.6 Environmental Quality Criteria for the EQO of Maintenance of Primary
Contact Recreation (EQO3)
Environmental Quality Indicators
Environmental Quality Criteria
Environmental Quality Guideline Environmental Quality Standard
Faecal pathogens
The 95th percentile value of Enterococci taken over the bathing season not to exceed 200 MPN/100 mL, outside the post-upgrade boundary (Figure 4.6).
The 95th percentile value of Enterococci taken over the bathing season not to exceed 500 MPN/100 mL, outside the post-upgrade boundary (Figure 4.6).
Algal biotoxins
Median total phytoplankton cell count for the area of concern (either from one sampling run or from a single site over agreed period of time) should not exceed 15 000 cells/mL. OR There should be no reports of skin or eye irritation or potential algal poisoning in swimmers considered by a medical practitioner as potentially resulting from toxic algae when less than 15 000 cells/mL is present in the water column.
There should be no confirmed incidences (by the DoH) of skin or eye irritation caused by toxic algae, or of algal poisoning in recreational users.
pH No EQG presently developed. The median of the sample concentrations from the area of concern (either from one sampling run or from a single site over an agreed period of time) should not exceed the range of 5–9 pH units.
Water clarity To protect the visual clarity of waters used for swimming, the vertical sighting of a 200 mm diameter black disc should exceed 1.6 m.
No EQS presently developed.
Toxic Chemicals
Concentrations of contaminants will not exceed the recreational guidelines for toxic chemicals at the post-upgrade boundary
No suitable EQS available
Notes: 1. Guidelines are from EPA (2005a). 2. DoH = Department of Health

32 BMT Oceanica: Water Corporation: Sepia Depression Ocean Outlet: Monitoring and Management Plan
Table 4.7 Environmental Quality Criteria for the EQO of Maintenance of Secondary Contact Recreation (EQO4)
Environmental Quality Indicators
Environmental Quality Criteria
Environmental Quality Guideline Environmental Quality Standard
Faecal pathogens
The 95th percentile value of Enterococci taken over the bathing season not to exceed 2000 MPN/100 mL, outside the post-upgrade boundary
The 95th percentile value of Enterococci taken over the bathing season not to exceed 5000 MPN/100 mL, outside the post-upgrade boundary
Algal biotoxins
Median total phytoplankton cell count for the area of concern (either from one sampling run or from a single site over agreed period of time) should not exceed 15 000 cells/mL. OR There should be no reports of skin or eye irritation or potential algal poisoning in swimmers considered by a medical practitioner as potentially resulting from toxic algae when less than 15 000 cells/mL is present in the water column.
There should be no confirmed incidences (by the DoH) of skin or eye irritation caused by toxic algae, or of algal poisoning in recreational users.
pH No EQG presently developed. The median of the sample concentrations from the area of concern (either from one sampling run or from a single site over an agreed period of time) should not exceed the range of 5–9 pH units.
Notes: 1. Guidelines are from EPA (2005a). 2. DoH = Department of Health
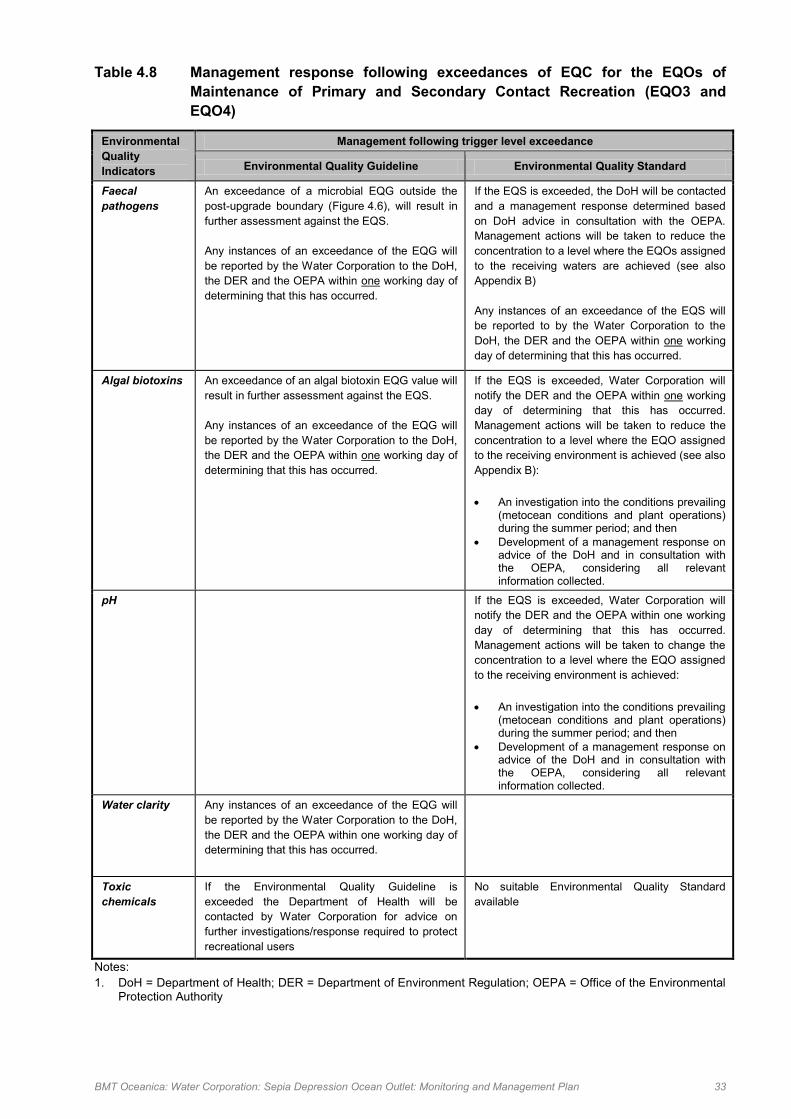
BMT Oceanica: Water Corporation: Sepia Depression Ocean Outlet: Monitoring and Management Plan 33
Table 4.8 Management response following exceedances of EQC for the EQOs of Maintenance of Primary and Secondary Contact Recreation (EQO3 and EQO4)
Environmental Quality Indicators
Management following trigger level exceedance
Environmental Quality Guideline Environmental Quality Standard
Faecal pathogens
An exceedance of a microbial EQG outside the post-upgrade boundary (Figure 4.6), will result in further assessment against the EQS. Any instances of an exceedance of the EQG will be reported by the Water Corporation to the DoH, the DER and the OEPA within one working day of determining that this has occurred.
If the EQS is exceeded, the DoH will be contacted and a management response determined based on DoH advice in consultation with the OEPA. Management actions will be taken to reduce the concentration to a level where the EQOs assigned to the receiving waters are achieved (see also Appendix B) Any instances of an exceedance of the EQS will be reported to by the Water Corporation to the DoH, the DER and the OEPA within one working day of determining that this has occurred.
Algal biotoxins An exceedance of an algal biotoxin EQG value will result in further assessment against the EQS. Any instances of an exceedance of the EQG will be reported by the Water Corporation to the DoH, the DER and the OEPA within one working day of determining that this has occurred.
If the EQS is exceeded, Water Corporation will notify the DER and the OEPA within one working day of determining that this has occurred. Management actions will be taken to reduce the concentration to a level where the EQO assigned to the receiving environment is achieved (see also Appendix B): An investigation into the conditions prevailing
(metocean conditions and plant operations) during the summer period; and then
Development of a management response on advice of the DoH and in consultation with the OEPA, considering all relevant information collected.
pH If the EQS is exceeded, Water Corporation will notify the DER and the OEPA within one working day of determining that this has occurred. Management actions will be taken to change the concentration to a level where the EQO assigned to the receiving environment is achieved: An investigation into the conditions prevailing
(metocean conditions and plant operations) during the summer period; and then
Development of a management response on advice of the DoH and in consultation with the OEPA, considering all relevant information collected.
Water clarity Any instances of an exceedance of the EQG will be reported by the Water Corporation to the DoH, the DER and the OEPA within one working day of determining that this has occurred.
Toxic chemicals
If the Environmental Quality Guideline is exceeded the Department of Health will be contacted by Water Corporation for advice on further investigations/response required to protect recreational users
No suitable Environmental Quality Standard available
Notes: 1. DoH = Department of Health; DER = Department of Environment Regulation; OEPA = Office of the Environmental
Protection Authority

34 BMT Oceanica: Water Corporation: Sepia Depression Ocean Outlet: Monitoring and Management Plan
4.4 Maintenance of Aesthetic Values (EQO5)
4.4.1 Objective The EQO for the Environmental Value [‘Recreation and] Aesthetics’ is to ensure that Perth’s coastal waters are aesthetically pleasing and that the aesthetic value is protected. To ensure this EQO is being met, monitoring will routinely assess the quality of surface water appearance (Figure 4.7).
4.4.2 Environmental quality criteria Since the discharge to Sepia Depression is 4 km offshore, any effect on the aesthetic values of the area would be limited to aerial views and those associated with secondary recreation activities. For most of the time, any plume associated with the wastewater discharge would not be noticeable. From time to time particular activities associated with the wastewater treatment plants may result in a visible plume at the Sepia Depression. Fortunately, such activities do not occur often and considering the distance from shore, any risk to aesthetic values is considered minimal. Consequently, environmental quality criteria are only set at the level EQG only, and not EQS. Aesthetic quality will be routinely assessed against EQC set out in Table 4.9. Any instances of an exceedance of the EQG will be reported by the Water Corporation to the Department of Health (DoH), the Department of Environment Regulation (DER) and the OEPA within five working days of determining that this has occurred, as per Table 4.10. Monitoring will be undertaken in conjunction with the Compliance Monitoring Program. This allows for visual assessment of the water surface and measurement of Secchi disk depth at each site and is consistent with requirements set out in EPA (2005b) for assessing aesthetic values. However, since a pre-discharge baseline has not been established, water clarity around the outlet (mean Secchi depth at 350 m from the diffuser, pooled from all days) will instead be compared against water clarity at distance of the outlet (mean Secchi depth at 1500 m from the diffuser from all days pooled) to assess whether differences exist.
Note: 1. Components managed by the SDOOL and PLOOM monitoring programs are highlighted in blue and orange,
respectively.
Figure 4.7 Environmental quality objectives, criteria and monitoring programs for maintaining the environmental value Recreation and Aesthetics
EV3:Recreation & Aesthetics
EQOs 3 and 4: Maintenance of primary contact recreation values
EQO5: Maintenance of aesthetic values
EQC Indicator 1:
Faecal pathogens
EQC Indicator 2:
Algal-biotoxins
Monitoring Program:
Compliance monitoring
Monitoring Program:
Compliance monitoring
Indicator:Aesthetic
appearance
Monitoring Program:Routine visual
assessments
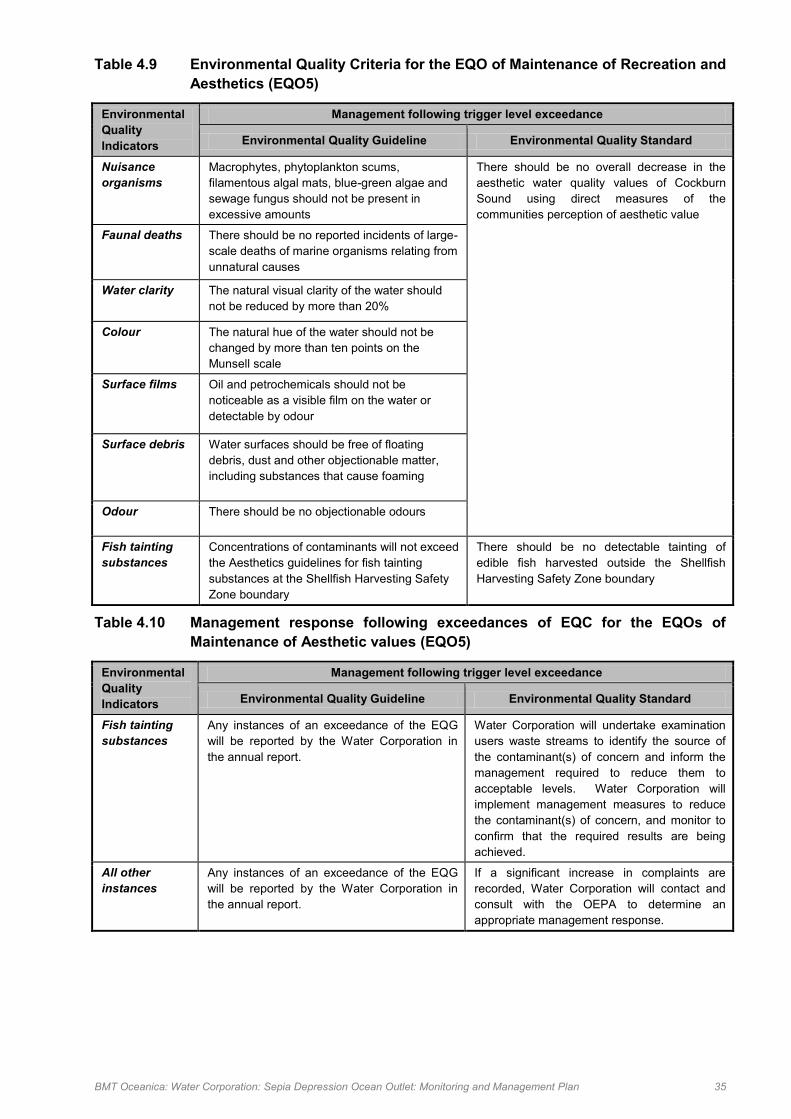
BMT Oceanica: Water Corporation: Sepia Depression Ocean Outlet: Monitoring and Management Plan 35
Table 4.9 Environmental Quality Criteria for the EQO of Maintenance of Recreation and Aesthetics (EQO5)
Environmental Quality Indicators
Management following trigger level exceedance
Environmental Quality Guideline Environmental Quality Standard
Nuisance organisms
Macrophytes, phytoplankton scums, filamentous algal mats, blue-green algae and sewage fungus should not be present in excessive amounts
There should be no overall decrease in the aesthetic water quality values of Cockburn Sound using direct measures of the communities perception of aesthetic value
Faunal deaths There should be no reported incidents of large-scale deaths of marine organisms relating from unnatural causes
Water clarity The natural visual clarity of the water should not be reduced by more than 20%
Colour The natural hue of the water should not be changed by more than ten points on the Munsell scale
Surface films Oil and petrochemicals should not be noticeable as a visible film on the water or detectable by odour
Surface debris Water surfaces should be free of floating debris, dust and other objectionable matter, including substances that cause foaming
Odour There should be no objectionable odours
Fish tainting substances
Concentrations of contaminants will not exceed the Aesthetics guidelines for fish tainting substances at the Shellfish Harvesting Safety Zone boundary
There should be no detectable tainting of edible fish harvested outside the Shellfish Harvesting Safety Zone boundary
Table 4.10 Management response following exceedances of EQC for the EQOs of Maintenance of Aesthetic values (EQO5)
Environmental Quality Indicators
Management following trigger level exceedance
Environmental Quality Guideline Environmental Quality Standard
Fish tainting substances
Any instances of an exceedance of the EQG will be reported by the Water Corporation in the annual report.
Water Corporation will undertake examination users waste streams to identify the source of the contaminant(s) of concern and inform the management required to reduce them to acceptable levels. Water Corporation will implement management measures to reduce the contaminant(s) of concern, and monitor to confirm that the required results are being achieved.
All other instances
Any instances of an exceedance of the EQG will be reported by the Water Corporation in the annual report.
If a significant increase in complaints are recorded, Water Corporation will contact and consult with the OEPA to determine an appropriate management response.

36 BMT Oceanica: Water Corporation: Sepia Depression Ocean Outlet: Monitoring and Management Plan
5. Monitoring to Maintain Ecosystem Integrity
5.1 Overview A monitoring framework was developed for the SDOOL to enable close supervision of wastewater inputs and allow identification of the sources of contaminants in the event of an incident, using electronic real-time monitoring instruments. In particular, a sampling and analysis plan was developed with the individual waste producers (refer Figure 5.1), including the following: 1. Each waste producer is required to fulfil its obligations in regard to monitoring and reporting
its emissions, as required by their respective Environmental Protection Act Licences. 2. Each waste producer must provide a point from which samples may be taken for analysis at
the point of discharge to the SDOOL (at points A1 to A5). 3. Additional sampling points are provided to enable determination of the KWRP process
concentrate (point B), the collective industrial effluent quality (post re-use) where it enters the SDOOL (point C), downstream of the Woodman Point WWTP (point E) as well as the composite SDOOL sample point (point D), prior to discharge to the Sepia Depression ocean outlet (see Figure 5.1).
The monitoring framework is made up of two distinct elements that together consist of seven monitoring programs. First Element – Waste Stream Monitoring consisting of: real-time monitoring (Section 5.2) treated wastewater characterisation (Section 5.3) whole-of-effluent toxicity (WET) testing (Section 5.3.7). Second Element – Receiving Environment Monitoring consisting of: compliance monitoring (5.4.1) sentinel mussel monitoring (Section 5.4.2) sediment quality monitoring (Section 5.5). Each element is described within the following sections of this M&MP.

BMT Oceanica: Water Corporation: Sepia Depression Ocean Outlet: Monitoring and Management Plan 37
Figure 5.1 Sepia Depression Ocean Outlet Landline (SDOOL) on-line monitoring and
sampling points
5.2 Waste stream monitoring
5.2.1 Operational monitoring Inputs into SDOOL to be monitored for flow rate, pH, conductivity, turbidity and temperature to enable operational control of the system and will provide early indications of any abnormal conditions developing. Analysers will monitor the quantity and the quality of the waste stream with upper limits for: conductivity (20 000 μS/cm) turbidity (200 NTU) temperature (40°C) pH (6–9). These are operational triggers set by the plant managers as indicators of a deviation from normal wastewater conditions. The triggers were informed by long-term experience in wastewater treatment. Where variations in flow rates or the limits for conductivity, turbidity, temperature and/or pH occur for the combined SDOOL discharge, the Water Corporation will report the exceedance to the DER and OEPA and investigate to ensure they do not cause adverse impacts on the receiving environment. Specifically, a comprehensive wastewater characterisation will be conducted to determine whether the conditions that have modified the physical parameters measured have also introduced toxicants to the waste stream. The comprehensive treated wastewater characterisation will be conducted as described in section 5.3.3). A 1:200 dilution will be applied (mandated worst case conditions in MS655) to determine the concentrations of contaminants, toxicants and potential stressors at the HEPA/LEPA boundary for comparison to triggers. Dilution will be confirmed by modelling (Appendix C). A 1-hour urchin fertilization toxicity test will also be conducted to determine the overall toxicity of the discharge. The results will be assessed against the EQG and, if necessary EQS for comprehensive treated wastewater
Woodman Point WWTP
Kwinana WaterReclamation Plant
(KWRP)
Point Peron WWTP
Industry Customers
C
D
E
Sepia Depression
Ocean Outlet
Landline (SDOOL)
Future Re-use(Rockingham)
MIEX Regenerant
Sepia Depression
Ocean Outlet
BP3.5 ML/d
CSBP1.2 ML/d
Edison Mission Energy0.9 ML/d
Perth Energy0.3 ML/d
Others
KWRP Product Water17 ML/d
KWRP Concentrate7 ML/d
Woodman Point AdvancedSecondary Treated Wastewater
24 ML/d
HIsmelt
B
A1
A3
A2
A4
A5
on-line monitoring and sampling point
KWRP Industry
Participant Wastewater

38 BMT Oceanica: Water Corporation: Sepia Depression Ocean Outlet: Monitoring and Management Plan
characterisation and WET testing as defined in Table 4.1. Subsequent reporting and management responses are detailed in Table 4.2. In addition, the participating industries will be responsible for monitoring their waste stream discharge into the SDOOL and ensuring it is within agreed criteria that meet the requirements of their individual Environmental Protection Act Licences. Prescribed notification procedures in relation to changes in the waste stream are detailed in individual contracts with industry participants, as well as a requirement of their Environmental Protection Act Licences.
5.2.2 Nitrogen loads The Water Corporation shall operate the SDOOL so that the annual nitrogen load to the Sepia Depression does not exceed the nitrogen load discharged from the outlet in 1994 (1,778 t). Nitrogen concentrations in the TWW are estimated for point D monthly and combined with the corresponding flow rates to yield an estimate of the monthly nitrogen load. Monthly loads are scaled up to an annual estimate (generally covering the preceding financial year for reporting purposes) for comparison to the 1994 load figure. In the event that subsequent monitoring shows an adverse environmental impact at the 1994 nitrogen load, the Water Corporation shall reduce the annual nitrogen load to 75% of the load discharged from the outlet in 1994. Notification to the DER will also be a required management response.
5.2.3 Diffuser verification In situ verification of the diffuser performance will be undertaken annually. The concentration of a suitable tracer will be determined at a number of sites downstream of the outlet diffuser. These data will be used in conjunction with CTD profiles to determine the actual rate of dilution by the diffuser. While the nature of field surveys precludes an absolute assurance regarding targeting specific meteorological conditions, sampling is biased towards calm conditions due to OSH constraints and the fact that monitoring is conducted in the mornings prior to establishment of the sea breeze. All practicable measures will be undertaken to ensure that monitoring will be conducted under as calm conditions as possible.
5.3 Toxicants in treated wastewater
5.3.1 Treated wastewater characterisation The treated wastewater stream will be monitored by the Water Corporation to characterise the concentration of metals, organics, nutrients and bacteria. Comprehensive treated wastewater characterisation, involving the full suite of contaminants (Table 5.2), will be conducted annually. Quarterly wastewater sampling will determine concentrations of ammonia and filtered (bioavailable) metal (copper and zinc) concentrations in the treated wastewater as part of routine testing undertaken by Water Corporation. Following the introduction of new industrial facilities to the wastewater outlet, the Water Corporation will also undertake regular screening/analysis of treated wastewater inputs, including for new non-negligible contaminants
Timing Treated wastewater characterisation will involve both quarterly and annual monitoring. The quarterly sampling will monitor a subset of the full suite of parameters that will be measured annually.

BMT Oceanica: Water Corporation: Sepia Depression Ocean Outlet: Monitoring and Management Plan 39
5.3.2 Quarterly treated wastewater characterisation The Water Corporation will undertake quarterly sampling of the wastewater stream for oil and grease, arsenic, cadmium, copper, chromium, lead, mercury, nickel and zinc. Additional toxicants that are likely to be industrial by-products or in elevated concentrations from domestic use within the wastewater stream, and which are potentially toxic to human or marine life, include molybdenum (Opresko 1993), cyanide, phenols (Eklund & Kautsky 2003), vanadium (Barceloux 2000) and selenium (Kathrine et al. 2006). Each of the contributing industrial waste streams and the combined discharge will be sampled quarterly for the toxicants listed in Table 5.1. In addition, for potential physio-chemical stressors, including nutrients, pH, biochemical oxygen demand (BOD) and conductivity (mS/cm), samples will be collected from each of the waste streams on the same day, including a combined composite sample (time-weighted) of all the waste streams from sample point D (Table 5.1; Figure 5.1). Quarterly treated wastewater characterisation will take place at the same time as the 1-hour sea urchin fertilisation tests (refer to Section 5.3.7). Modelling will be used to determine the number of dilutions at the LEPA boundary (Appendix C). Until the modelling is complete an interim dilution factor of 1:200 will be applied. Contaminant concentrations will be corrected for a 1:200 dilution and compared to the ANZECC/ARMCANZ (2000) 99% species protection guideline trigger levels (95% for cobalt). Quarterly testing focuses only on the key contaminants of concern, and includes the contaminants most likely to be present in the waste stream at concentrations that are above their limit of reporting from samples collected over the last five years (Table 5.2). The full suite of parameters (Table 5.2) will be monitored annually, as described in section 5.3.3.

40 BMT Oceanica: Water Corporation: Sepia Depression Ocean Outlet: Monitoring and Management Plan
Table 5.1 Parameters to be measured quarterly in the SDOOL wastewater stream and the ANZECC/ARMCANZ (2000) guideline trigger values for toxicants in marine waters to achieve various levels of species protection
Parameter
ANZECC/ARMCANZ (2000) guideline trigger values (µg L-1)1
Level of Protection (% Species)2 Low Reliability
Values3 99% 95% 80%
Total Suspended Solids n/a4 n/a n/a n/a
Total Nitrogen n/a n/a n/a n/a
Ammonia-Nitrogen 500 910 1,700 -
Total Phosphorus n/a n/a n/a n/a
Arsenic (As) ID5 ID ID 2.3 (As III) 4.5 (As V)
Cadmium (Cd) 0.7 5.5 36 -
Chromium (Cr) 7.7 (Cr III)
0.14 (Cr VI) 27.4 (Cr III) 4.4 (Cr VI)
90.6 (Cr III) 85 (Cr VI) -
Cobalt (Co) 0.005 1 150 -
Copper (Cu) 0.3 1.3 8 -
Lead (Pb) 2.2 4.4 12 -
Mercury (Hg) 0.1 0.4 1.4 -
Molybdenum (Mo) ID ID ID 23
Nickel (Ni) 7 70 560 -
Selenium (Se) ID ID ID 3
Silver (Ag) 0.8 1.4 2.6 -
Vanadium (V) 50 100 280 -
Zinc (Zn) 7 15 43 -
Cyanide 2 4 14 -
Phenol 270 400 720 -
Total Petroleum Hydrocarbons ID ID ID n/a
Methylene Blue Active Substances n/a n/a n/a 0.14
Notes: 1. Trigger values for marine water (Table 3.4.1; ANZECC/ARMCANZ (2000)). 2. Values in shaded cells are the ANZECC/ARMCANZ (2000) guideline trigger values that must be met for each
parameter. The majority must meet the 99% species protection guidelines at the boundary of the LEPA (95% for cobalt). Cadmium and mercury (two bioaccumulating toxicants) must meet the 80% species protection guidelines at the diffuser.
3. For many contaminants there are insufficient data to derive reliable national guidelines, thus Low Reliability Value have been derived using conservative assessment factors—with the caveat that Low Reliability Values should not be used as default guidelines but as indicative working levels, until more data are available to derive reliable guidelines.
4. The LRV is for linear alkylbenzene sulfonates (LAS). The MBAS assay detects all inorganic surfactants. Applying the LRV for LAS to measured MBAS concentrations is likely to be conservative
5. n/a = ANZECC/ARMCANZ (2000) guidelines or Low Reliability Values not available for this parameter. 6. ID = insufficient data to derive a reliable national trigger value.

BMT Oceanica: Water Corporation: Sepia Depression Ocean Outlet: Monitoring and Management Plan 41
5.3.3 Comprehensive treated wastewater characterisation Comprehensive treated wastewater characterisation (CTWWC) will be undertaken annually and each of the parameters listed in Table 5.2. CTWWC will also be undertaken within 3 months following material process or volume changes (i.e. with the addition of a new industry client). The CTWWC sample will be an average of the final treated wastewater discharge from sample point D (Figure 5.1) for the 24-hour period prior to and during the sample collection (i.e. a one litre sample is collected every hour over 24-hours, which provides a composite sample of 24 L from which sub-samples are analysed and an average calculated). A separate grab sample for microbiological parameters will be collected as 24-hour composites are not suitable for microbiological parameters. The bulk sample will be homogenised (agitated) and divided into separate sample containers. Samples will be collected, stored and transported according to the relevant parts of Australian Standard AS/NZS 5667.1:1998 and all analyses will be undertaken by laboratories with NATA-accredited methods. Samples for bioavailable metals will be passed through a 0.45 µm filter prior to analysis. These parameters were selected through ongoing internal review of the current Australian and international contaminants of concern in treated municipal wastewaters, as well as through consultation with industry. The suite of parameters to be monitored annually also took into consideration the wastewater supply and wastewater treatment plant operating conditions specific to the SDOOL.
Table 5.2 Parameters to be measured annually in the SDOOL wastewater stream and the ANZECC/ARMCANZ (2000) guideline trigger values for toxicants in marine waters to achieve various levels of species protection
Parameter Max (last 5 years)
Approx after 1:200
dilution (worst case)
ANZECC/ARMCANZ (2000) guideline trigger values (µg L-1)1
Level of protection Low Reliability
Value (LRV)
99% 95% 90% 80%
Microbiological
Confirmed Enterococci2 >24,000 <120 n/a3 n/a n/a n/a n/a
Presumptive thermo-tolerant Coliforms (TTC)4
>1,000,000 <5000 n/a n/a n/a n/a n/a
Confirmed thermo-tolerant Coliforms (TTC)4
>1,000,000 <5000 n/a n/a n/a n/a n/a
Escherichia coli >1,000,000 <5000 n/a n/a n/a n/a n/a
Nutrients (µg L-1)
Ammonia-N 37000 185 500 910 1,200 1,700 -
Nitrate-N+ Nitrite-N 7500 37.5 ID5 ID ID ID 13,000
Nitrogen-Total N 55000 275 n/a n/a n/a n/a n/a
Phosphate-Ortho as P 8400 42 n/a n/a n/a n/a n/a
Phosphorus-Total P 17000 85 n/a n/a n/a n/a n/a
Metals and Metalloids (µg L-1)
Arsenic (As) 2 0.01
ID ID ID ID 2.3 (As III) 4.5 (As V)
Cadmium (Cd) <0.1 <0.0005 0.7 5.5 14 36 -
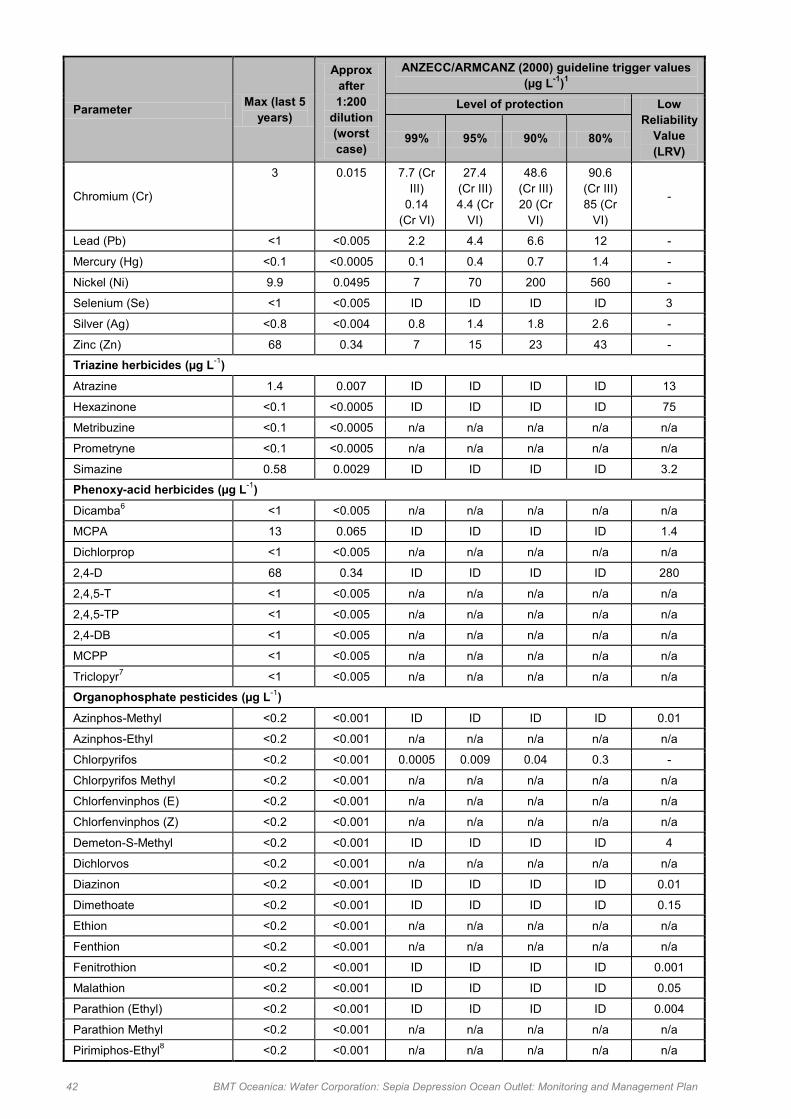
42 BMT Oceanica: Water Corporation: Sepia Depression Ocean Outlet: Monitoring and Management Plan
Parameter Max (last 5 years)
Approx after 1:200
dilution (worst case)
ANZECC/ARMCANZ (2000) guideline trigger values (µg L-1)1
Level of protection Low Reliability
Value (LRV)
99% 95% 90% 80%
Chromium (Cr)
3 0.015 7.7 (Cr III)
0.14 (Cr VI)
27.4 (Cr III) 4.4 (Cr
VI)
48.6 (Cr III) 20 (Cr
VI)
90.6 (Cr III) 85 (Cr
VI)
-
Lead (Pb) <1 <0.005 2.2 4.4 6.6 12 -
Mercury (Hg) <0.1 <0.0005 0.1 0.4 0.7 1.4 -
Nickel (Ni) 9.9 0.0495 7 70 200 560 -
Selenium (Se) <1 <0.005 ID ID ID ID 3
Silver (Ag) <0.8 <0.004 0.8 1.4 1.8 2.6 -
Zinc (Zn) 68 0.34 7 15 23 43 -
Triazine herbicides (µg L-1)
Atrazine 1.4 0.007 ID ID ID ID 13
Hexazinone <0.1 <0.0005 ID ID ID ID 75
Metribuzine <0.1 <0.0005 n/a n/a n/a n/a n/a
Prometryne <0.1 <0.0005 n/a n/a n/a n/a n/a
Simazine 0.58 0.0029 ID ID ID ID 3.2
Phenoxy-acid herbicides (µg L-1)
Dicamba6 <1 <0.005 n/a n/a n/a n/a n/a
MCPA 13 0.065 ID ID ID ID 1.4
Dichlorprop <1 <0.005 n/a n/a n/a n/a n/a
2,4-D 68 0.34 ID ID ID ID 280
2,4,5-T <1 <0.005 n/a n/a n/a n/a n/a
2,4,5-TP <1 <0.005 n/a n/a n/a n/a n/a
2,4-DB <1 <0.005 n/a n/a n/a n/a n/a
MCPP <1 <0.005 n/a n/a n/a n/a n/a
Triclopyr7 <1 <0.005 n/a n/a n/a n/a n/a
Organophosphate pesticides (µg L-1)
Azinphos-Methyl <0.2 <0.001 ID ID ID ID 0.01
Azinphos-Ethyl <0.2 <0.001 n/a n/a n/a n/a n/a
Chlorpyrifos <0.2 <0.001 0.0005 0.009 0.04 0.3 -
Chlorpyrifos Methyl <0.2 <0.001 n/a n/a n/a n/a n/a
Chlorfenvinphos (E) <0.2 <0.001 n/a n/a n/a n/a n/a
Chlorfenvinphos (Z) <0.2 <0.001 n/a n/a n/a n/a n/a
Demeton-S-Methyl <0.2 <0.001 ID ID ID ID 4
Dichlorvos <0.2 <0.001 n/a n/a n/a n/a n/a
Diazinon <0.2 <0.001 ID ID ID ID 0.01
Dimethoate <0.2 <0.001 ID ID ID ID 0.15
Ethion <0.2 <0.001 n/a n/a n/a n/a n/a
Fenthion <0.2 <0.001 n/a n/a n/a n/a n/a
Fenitrothion <0.2 <0.001 ID ID ID ID 0.001
Malathion <0.2 <0.001 ID ID ID ID 0.05
Parathion (Ethyl) <0.2 <0.001 ID ID ID ID 0.004
Parathion Methyl <0.2 <0.001 n/a n/a n/a n/a n/a
Pirimiphos-Ethyl8 <0.2 <0.001 n/a n/a n/a n/a n/a

BMT Oceanica: Water Corporation: Sepia Depression Ocean Outlet: Monitoring and Management Plan 43
Parameter Max (last 5 years)
Approx after 1:200
dilution (worst case)
ANZECC/ARMCANZ (2000) guideline trigger values (µg L-1)1
Level of protection Low Reliability
Value (LRV)
99% 95% 90% 80%
Pirimiphos-Methyl9 <0.2 <0.001 n/a n/a n/a n/a n/a
Organochlorine pesticides (µg L-1)
Aldrin <0.05 <0.00025 ID ID ID ID 0.003
trans-Chlordane10 <0.05 <0.00025 ID ID ID ID 0.001
cis-Chlordane10 <0.05 <0.00025 ID ID ID ID 0.001
Oxychlordane10 <0.05 <0.00025 ID ID ID ID 0.001
gamma-BHC (Lindane) <0.05 <0.00025 ID ID ID ID 0.007
alpha-BHC <0.05 <0.00025 n/a n/a n/a n/a n/a
beta-BHC <0.05 <0.00025 n/a n/a n/a n/a n/a
delta-BHC <0.05 <0.00025 n/a n/a n/a n/a n/a
p,p-DDD <0.05 <0.00025 n/a n/a n/a n/a n/a
p,p-DDE <0.05 <0.00025 ID ID ID ID 0.0005
p,p-DDT <0.05 <0.00025 ID ID ID ID 0.0004
Dieldrin <0.05 <0.00025 ID ID ID ID 0.01
Endrin <0.05 <0.00025 0.004 0.008 0.01 0.02 -
Endrin Aldehyde <0.05 <0.00025 n/a n/a n/a n/a n/a
Endrin Ketone <0.05 <0.00025 n/a n/a n/a n/a n/a
alpha-Endosulfan <0.05 <0.00025 ID ID ID ID 0.0002
beta-Endosulfan <0.05 <0.00025 ID ID ID ID 0.007
Endosulfan Sulfate11 <0.05 <0.00025 0.005 0.01 0.02 0.05 -
HCB (Hexachlorobenzene) <0.05 <0.00025 ID ID ID ID 0.05
Heptachlor <0.05 <0.00025 ID ID ID ID 0.0004
Heptachlor epoxide <0.05 <0.00025 n/a n/a n/a n/a n/a
Methoxychlor <0.05 <0.00025 ID ID ID ID 0.004
Phenols (µg L-1)
Phenol 16 0.08 270 400 520 720 -
Nonylphenol <1 <0.005 ID ID ID ID 1
2-Chorophenol <1 <0.005 ID ID ID ID 340
2-Methylphenol 0.29 0.00145 n/a n/a n/a n/a n/a
2,4-Dichlorophenol 2.1 0.0105 ID ID ID ID 120
2-Nitrophenol <1 <0.005 n/a n/a n/a n/a n/a
4-Chloro-3-methylphenol <2 <0.01 n/a n/a n/a n/a 2
2,4,6-Trichlorophenol <2 <0.01 ID ID ID ID 34
4-Nitrophenol <1 <0.005 ID ID ID ID 2
2,4,5-Trichlorophenol <2 <0.01 n/a n/a n/a n/a n/a
2,3,4,6-Trichlorophenol <0.2 <0.001 ID ID ID ID 10
Pentachlorophenol (PCP) <2 <0.01 11 22 33 55 -
Phthalates (µg L-1)
Dimethyl phthalate <10 <0.05 ID ID ID ID 3700
Diethyl phthalate <10 <0.05 ID ID ID ID 900
Di-n-butyl phthalate <10 <0.05 ID ID ID ID 25
Benzyl butyl phthalate <10 <0.05 n/a n/a n/a n/a n/a
Bis(2-ethylhexyl)phthalate <20 <0.1 ID ID ID ID 1

44 BMT Oceanica: Water Corporation: Sepia Depression Ocean Outlet: Monitoring and Management Plan
Parameter Max (last 5 years)
Approx after 1:200
dilution (worst case)
ANZECC/ARMCANZ (2000) guideline trigger values (µg L-1)1
Level of protection Low Reliability
Value (LRV)
99% 95% 90% 80%
Di-n-octyl phthalate <10 <0.05 n/a n/a n/a n/a n/a
PCB Aroclors (µg L-1)
Aroclor 1016 <0.1 <0.0005 ID ID ID ID 0.009
Aroclor 1221 <0.1 <0.0005 ID ID ID ID 1.0
Aroclor 1232 <0.1 <0.0005 ID ID ID ID 0.3
Aroclor 1242 <0.1 <0.0005 ID ID ID ID 0.3
Aroclor 1248 <0.1 <0.0005 ID ID ID ID 0.03
Aroclor 1254 <0.1 <0.0005 ID ID ID ID 0.01
Aroclor 1260 <0.1 <0.0005 ID ID ID ID 25
Total PCB's (as above)12 <0.1 <0.0005 ID ID ID ID n/a
Chlorinated hydrocarbons (µg L-1)
2-Chloronaphthalene <20 <0.1 n/a n/a n/a n/a n/a
1,4-Dichlorobenzene <20 <0.1 ID ID ID ID 60
1,2-Dichlorobenzene <20 <0.1 ID ID ID ID 160
1,3-Dichlorobenzene <20 <0.1 ID ID ID ID 260
Hexachlorobenzene <20 <0.1 ID ID ID ID 0.05
1,2,4-Trichlorobenzene <20 <0.1 20 80 140 240 -
Hexachloroethane <20 <0.1 ID ID ID ID 290
Hexachlorocyclopentadiene <20 <0.1 ID ID ID ID 0.05
Hexachloro-1,3-butadiene13 <20 <0.1 ID ID ID ID 0.03
Ethers (µg L-1)
4-Bromophenyl phenyl ether14
<20 <0.1 n/a n/a n/a n/a n/a
4-Chlorophenyl phenyl ether <20 <0.1 n/a n/a n/a n/a n/a
Bis(2-chloroethyl)ether <20 <0.1 n/a n/a n/a n/a n/a
Bis(2-chloroethoxy)methane <20 <0.1 n/a n/a n/a n/a n/a
Bis(2-chloroisopropyl)ether <20 <0.1 n/a n/a n/a n/a n/a
Amines, Nitroaromatics & Nitrosamines (µg L-1)
Azobenzene <20 <0.1 n/a n/a n/a n/a n/a
2,4-Dinitrotoluene <20 <0.1 ID ID ID ID 16
2,6-Dinitrotoluene <10 <0.1 n/a n/a n/a n/a 0.3
Nitrobenzene <20 <0.1 ID ID ID ID 550
N-Nitrosodimethylamine <20 <0.1 n/a n/a n/a n/a n/a
N-Nitrosodiphenylamine <20 <0.1 ID ID ID ID 6
N-Nitrosodi-n-propylamine <20 <0.1 n/a n/a n/a n/a n/a
Aniline <20 <0.1 ID ID ID ID 8
4-Chloroaniline <20 <0.1 n/a n/a n/a n/a n/a
2-Nitroaniline <20 <0.1 n/a n/a n/a n/a n/a
3-Nitroaniline <20 <0.1 n/a n/a n/a n/a n/a
4-Nitroaniline <20 <0.1 n/a n/a n/a n/a n/a
Other organics (µg L-1)
Dichlorobenzidine15 <20 <0.1 ID ID ID ID 0.5
2-Methylnaphthalene <10 <0.05 n/a n/a n/a n/a n/a

BMT Oceanica: Water Corporation: Sepia Depression Ocean Outlet: Monitoring and Management Plan 45
Parameter Max (last 5 years)
Approx after 1:200
dilution (worst case)
ANZECC/ARMCANZ (2000) guideline trigger values (µg L-1)1
Level of protection Low Reliability
Value (LRV)
99% 95% 90% 80%
Isophorone <20 <0.1 ID ID ID ID 130
Benzyl alcohol <20 <0.1 n/a n/a n/a n/a n/a
Carbazole <20 <0.1 n/a n/a n/a n/a n/a
Dibenzofuran <20 <0.1 n/a n/a n/a n/a n/a
BTEX (µg L-1)
Benzene <1.0 <0.005 500 700 900 1300 -
Toluene <1.0 <0.005 ID ID ID ID 180
Ethylbenzene <1.0 <0.005 ID ID ID ID 5
Xylene16 <2.0 <0.1 ID ID ID ID 75
Total BTEX12 <5.0 <0.025 n/a n/a n/a n/a n/a
TPH (µg L-1)
TPH C6 - C917 <25 <0.125 ID ID ID ID n/a
TPH C10 - C1417 41 0.205 ID ID ID ID n/a
TPH C15 - C2817 330 1.65 ID ID ID ID n/a
TPH C29 - C3617 480 2.4 ID ID ID ID n/a
Total TPH17,18 740 3.7 ID ID ID ID n/a
PAHs (µg L-1)
Naphthalene 0.011 0.000055 50 70 90 120 -
Acenaphthylene <10 <0.05 n/a n/a n/a n/a n/a
Acenaphthene <10 <0.05 n/a n/a n/a n/a n/a
Fluorene <10 <0.05 n/a n/a n/a n/a n/a
Phenanthrene 0.01 0.00005 ID ID ID ID 2
Anthracene <10 <0.05 ID ID ID ID 0.4
Fluoranthene <10 <0.05 ID ID ID ID 1.4
Pyrene <10 <0.05 n/a n/a n/a n/a n/a
Benz(a)anthracene <10 <0.05 n/a n/a n/a n/a n/a
Chrysene <10 <0.05 n/a n/a n/a n/a n/a
Benzo(b)&(k)fluoranthene <20 <0.1 n/a n/a n/a n/a n/a
Benzo(a)pyrene <10 <0.05 ID ID ID ID 0.2
Indeno(1,2,3-cd)pyrene <10 <0.05 n/a n/a n/a n/a n/a
Dibenz(ah)anthracene <10 <0.05 n/a n/a n/a n/a n/a
Benzo(ghi)perylene <10 <0.05 n/a n/a n/a n/a n/a
Surfactants (mg L-1)
Methylene Blue Active Substances (MBAS)19 1.2 0.006 n/a n/a n/a n/a 0.000119
Miscellaneous Other (mg L-1 except pH)
Chlorine-Free <0.02 <0.0001 ID ID ID ID 3
Chlorine-Total <0.02 <0.0001 ID ID ID ID 3
Dissolved Organic Carbon (DOC) 20 0.1 n/a n/a n/a n/a n/a
Total Organic Carbon (TOC) 38 0.19 n/a n/a n/a n/a n/a
Total Suspended Solids (TSS)20
121 0.605 n/a n/a n/a n/a n/a

46 BMT Oceanica: Water Corporation: Sepia Depression Ocean Outlet: Monitoring and Management Plan
Parameter Max (last 5 years)
Approx after 1:200
dilution (worst case)
ANZECC/ARMCANZ (2000) guideline trigger values (µg L-1)1
Level of protection Low Reliability
Value (LRV)
99% 95% 90% 80%
Biological Oxygen Demand (BOD)
51 0.255 n/a n/a n/a n/a n/a
pH21 7.5 n/a n/a n/a n/a n/a Notes: 1. Trigger values for marine water (Table 3.4.1; ANZECC/ARMCANZ (2000)). 2. Seafood safe for human consumption guideline for recreational marine waters the 95th percentile value of
Enterococci taken over the bathing season not to exceed 200 MPN/100 mL (EPA 2005). 3. n/a = ANZECC/ARMCANZ (2000) Guideline or Low Reliability Value not available for this parameter. 4. Primary contact guideline for recreational marine waters 150 faecal coliforms 100 mL-1 (ANZECC/ARMCANZ
2000), but now superseded by NHMRC (2008). 5. ID = insufficient data to derive a reliable national trigger value. 6. Recreational guideline for Dicamba = 1000 µg L-1 (Table 9.3; NHMRC (2008)). 7. Recreational guideline for Triclopyr = 100 µg L-1 (Table 9.3; NHMRC (2008)). 8. Recreational guideline for Pirimiphos-ethyl = 5 µg L-1 (Table 9.3; NHMRC (2008)). 9. Recreational guideline for Pirimiphos-methyl = 500 µg L-1 (Table 9.3; NHMRC (2008)). 10. Recreational guideline for Chlordane = 10 µg L-1 (Table 9.3; NHMRC (2008)). 11. Values for Endosulphan, not Endosulphan sulfate (Table 3.4.1; ANZECC/ARMCANZ (2000)). 12. ANZECC/ARMCANZ (2000) recommends using a formula to calculate total toxicity of the mixture if using total
PCBs and BTEX (page 8.3-65; ANZECC/ARMCANZ (2000)). 13. Environmental Concern Level (ECL) for Hexachloro-1,3-butadiene (not LRV) (definition of ECL on page 8.3-35;
page 8.3-231; ANZECC/ARMCANZ (2000)). 14. Recommended ECL for 4-Bromophenyl phenyl ether = 12 µg L-1 (page 8.3-232; ANZECC/ARMCANZ (2000)). 15. ECL for Dichlorobenzidine (not LRV) (page 8.3-187; ANZECC/ARMCANZ (2000)). 16. Guideline for o-Xylene = 350 µg/L, for m-xylene = 75 µg/L and for p-xylene = 200 µg L-1 (ANZECC/ARMZANC
(2000)). 17. Guideline values are for generic oils and petroleum hydrocarbons (Table 3.4.1; ANZECC/ARMCANZ (2000)). 18. A generic estimate of 7 µg L-1 for a total petroleum hydrocarbon chronic value has been estimated using USEPA
methods (page 8.3-297; ANZECC/ARMCANZ (2000)). 19. LRV is for linear alkylbenzene sulfonates (LAS). The MBAS assay detects all inorganic surfactants. Applying the
LRV for LAS to measured MBAS concentrations is likely to be conservative . 20. Suspended solids guidelines for the protection of saltwater aquaculture species = <10,000 µg L-1 (Table 4.4.2;
ANZECC/ARMCANZ (2000)). 21. pH guideline range for slightly disturbed inshore marine ecosystems in south-west Australia = 8.0 to 8.4
(Table 3.3.6; ANZECC/ARMCANZ (2000)).
5.3.4 Bioaccumulating toxicants Contaminant concentrations are compared directly to the ANZECC/ARMCANZ (2000) 80% species protection guidelines.
5.3.5 Dilution calculations Contaminants measured in the quarterly wastewater characterisation analysis (see Section 5.3.3) must meet the ANZECC/ARMCANZ (2000) 99% species protection guideline trigger levels (95% for cobalt), at the boundary of the LEPA. Modelling will be used to determine the number of dilutions at the LEPA boundary (Appendix C). Until the modelling is complete an interim dilution factor of 1:200 will be applied. Contaminant concentrations will be corrected for dilution and compared to the ANZECC/ARMCANZ (2000) 99% species protection guideline trigger levels (95% for cobalt). The formula used to correct contaminants for dilution is:
[After Dilution] = ( [Undiluted Toxicant]
) + [Background] Number of Dilutions
5.3.6 Total toxicity calculations Total toxicity calculation is an additional interpretative tool used for estimating the potential toxicity of treated wastewater, where the effects are ‘additive’. The potential toxicity of treated wastewater to marine biota after initial mixing at the ocean outlet (i.e. after dilution of the

BMT Oceanica: Water Corporation: Sepia Depression Ocean Outlet: Monitoring and Management Plan 47
wastewater with seawater) is assessed as per the ANZECC/ARMCANZ (2000) guidelines, based on the effects of ammonia, copper and zinc. These are the three contaminants identified as most likely to cause toxicity effects based on the degree to which they exceed ANZECC/ARMCANZ (2000) guidelines in undiluted wastewater. It is important to note, however, that the formula is only meant to be used for simple mixtures where the interactions are simple and predictable. The approach does not account for synergistic and/or antagonistic effects, or complex mixtures. It is noted that the effects of ammonia, copper and zinc (or other metals) in combination is assumed to be additive. If the mixture is complex (i.e. >5 components and/or has uncertain mixture effects), ANZECC/ARMCANZ (2000) recommends proceeding to direct toxicity assessment (refer to Section 5.3.7). The formula used to calculate the total toxicity of the mixture is:
Total Toxicity of Mixture =
[ammonia] +
[copper] +
[zinc] [Trigger Value] [Trigger Value] [Trigger Value]
The total toxicity of the mixture needs to be less than 1 in order to meet the total toxicity criteria, in accordance with ANZECC/ARMCANZ (2000) guidelines. An interim dilution of 200-fold will be applied until minimum levels of dilution are determined. A total toxicity calculation is undertaken quarterly, using the results from the quarterly wastewater characterisation analysis (see Section 5.3.2)
5.3.7 Whole-of-effluent toxicity (WET) testing The Water Corporation’s commitment 7 (Appendix A) requires that whole-of-effluent toxicity (WET) testing be implemented as part of the SDOOL M&MP. WET testing involves exposing organisms to different concentrations of an effluent (treated wastewater) and then measuring growth or reproduction characteristics after a selected period of time. The objectives of WET testing are to: determine whether further investigation of the potential toxicity of treated wastewater to
marine biota is required establish the potential toxicity to marine biota of the wastewater discharge using a full suite of
WET tests, as and when required ensure that the dilution of the wastewater at the boundary of the HEPA is protective of 99% of
species, as calculated using National (ANZECC/ARMCANZ 2000) protocols. To meet commitment 7, two types of WET tests are to be carried out: quarterly 1-hour sea urchin fertilisation test [interim test] full suite of WET testing.
1-hour sea urchin fertilisation test The 1-hour sea urchin fertilisation test will measure the rate of sea urchin sperm and egg fertilisation when exposed to a range of salt-adjusted treated wastewater solutions. The utility of this test lies in its fast turn-around time (3 days) together with its sensitivity to surfactants (i.e. detergents; one of the key constituents of domestic wastewater). This test is more sensitive than most other WET tests and consequently provides an early warning indication of potential toxicity concentrations of contaminants with wastewater (Appendix D). Triggering of this test results in further more detailed levels of assessment (see Full suite of WET testing).

48 BMT Oceanica: Water Corporation: Sepia Depression Ocean Outlet: Monitoring and Management Plan
Full suite of WET testing The full suite of WET testing is a more comprehensive assessment of the potential effects of the wastewater on marine organisms. WET testing measures the responses of a number of biota (from a number of trophic levels) to a range of salt-adjusted treated wastewater solutions. Data generated by WET testing are used to calculate the dilutions of treated wastewater required to protect 99% of species, using the BurrliOZ software, as per ANZECC/ARMCANZ (2000). The full suite of WET testing will use a selection of five of the available tests described below. All WET tests are chronic short-term tests with a sub-lethal endpoint.
Microtox test The Microtox test involves the use of luminescent bacteria, Vibrio fischeri, to determine toxicity in environmental samples. Bacterial luminescence is directly related to cell respiration, and hence any toxicity that inhibits cellular activity results in a decreased rate of respiration and a corresponding decrease in the rate of luminescence. The test involves exposing the bacteria to selected concentrations of wastewater for 15 min. Luminescence is measured at the beginning (T0) and end (T15) in a Microtox Model M500 analyser and any decrease in cellular activity is calculated by comparing the two readings. Results are then used to calculate the NOEC, LOEC and EC50.
Algae growth inhibition test (Nitzschia closterium and Isochrysis sp.) This test determines the inhibition and the stimulation of growth rate (expressed as cell yield) of the marine alga Nitzschia closterium and Isochrysis sp. over 72 hours. Known concentrations of the algae are added to the test chambers and dilute wastewater is added to the algae. The algae are incubated at 22°C for 72 hours. Growth is either measured by the amount of chlorophyll present (as absorbance at 750 nm wavelength) in the test chambers and comparing this to growth in the control chambers, or by cell density. The results are used to calculate the NOEC, LOEC and EC50.
Copepod 21–28 day reproduction test This test uses copepods (Gladioferens imparipes) collected from the Swan River. The copepods are exposed to dilute wastewater as neonates. Mature copepods are then paired (male and female) and the number of offspring produced is recorded and compared to the controls. These results are used to calculate the NOEC, LOEC and EC50.
Fish 7-day larval growth test This test is based on the growth of larval pink snapper (Pagrus auratus) after 7 days exposure to dilute wastewater. Larval pink snapper are placed in dilute wastewater and after 7 days the length of each larva is measured and compared to the growth of the controls. The NOEC, LOEC and EC50 are calculated.
Ecklonia (macroalga) 48-hour germination test This test uses a macroalga (Ecklonia radiata) collected from an uncontaminated site, dried and then the gametes collected from the alga’s blades. Male and female gametes are collected separately and placed together in selected concentrations of wastewater, left for 48 hours and then the percentage of zygotes with germination tubes are assessed. The percentages are compared with control results and the EC50, LOEC and NOEC are calculated.
BMT Oceanica: Water Corporation: Sepia Depression Ocean Outlet: Monitoring and Management Plan 49
Mussel larval development test This test uses fertilised eggs obtained from adult molluscs (Mytilus edulis), induced to spawn as required, which are exposed to a series of concentrations of wastewater and allowed to develop for 48 hours under controlled conditions. One hundred larvae are counted and the numbers of abnormal and normal larvae are recorded. Abnormal larvae are considered to be any larvae not exhibiting the classic D-shaped veliger. The percentages are compared with control results and the EC50, LOEC and NOEC are calculated.
Sea urchin fertilisation test The sea urchin fertilisation test determines the success of sea urchin fertilisation over a 1-hour period using the gametes of the sea urchin Heliocidaris tuberculata. The sperm of the sea urchin are exposed to dilute wastewater for a 1 hour period and then added to an egg suspension. The fertilised eggs are counted and the percent fertilisation calculated. These results are used to calculate the NOEC, LOEC and EC50.
Doughboy scallop 48-hour larval development test This test is a 48-hour larval development (abnormality) test that uses the gametes of Mimachlamys (Chlamys) asperrima. Fertilised eggs of the scallop are exposed to dilute wastewater for 48 hours. The larvae are then examined to determine the percentage of abnormal larvae. These results are used to calculate the NOEC, LOEC and EC50.
Timing The 1-hour sea urchin fertilisation WET tests will be conducted quarterly to yield results from a range of production conditions that may arise over a 12-month period. Sampling will coincide with the quarterly wastewater characterisation to yield concurrent information on the composition of the wastewater sample to aid the interpretation of results. The full suite of WET testing of the combined wastewater stream was undertaken after commencement of the discharge from the KWRP, following the discharge of wastewater from CSBP Ltd and again in 2009 following the inclusion of BP to the waste stream (Oceanica 2010c). A full suite of WET testing (combined with a comprehensive treated waste water characterisation for all parameters listed in Table 5.2) will be carried out when other approved industry participants begin discharging wastewater into the SDOOL. The full suite of WET testing (combined with a comprehensive treated waste water characterisation for all parameters list in Table 5.2) will also be carried out if there is an exceedance of the EQG for wastewater characterisation, if quarterly wastewater characterisation indicates an exceedance of the trigger for the combined toxicity of ammonia, copper and zinc in the wastewater stream and/or from the trigger for the 1 hour sea urchin (Heliocidaris tuberculata) EC50 fertilisation test. Previous waste stream characterisation data has identified concentrations of methylene blue activated substances (MBAS), an indicator of surfactants, and nonylphenol, a by-product of surfactants. ANZECC/ARMCANZ (2000) guidelines provide no reliable guideline for surfactants; an assessment will be made against the low reliability value but the LRV will not form an EQG trigger. In the absence of a reliable trigger, WET testing will be applied as an alternate line of evidence for the toxicity of the waste stream as suggest by EPA (2005a). The quarterly sea urchin fertilisation test provides a sensitive (and efficient) tests for the routine screening of surfactants and its quick turn-around time (days) allows for rapid management responses.

50 BMT Oceanica: Water Corporation: Sepia Depression Ocean Outlet: Monitoring and Management Plan
If the 1-hour WET testing EQG is exceeded, the first step will be to immediately collect and reanalyse a further sample of wastewater. If the trigger is exceeded in the repeat sampling exercise, then a full set of WET tests will be undertaken. The proposed triggers and details on WET testing are described below.
Sampling regime Samples of the combined wastewater stream collected from sample point D (Figure 5.1) will be sent to the relevant laboratories for analysis. All samples will be stored and transported according to the protocols stipulated by the relevant laboratories. Seawater (for use as the dilution water in the WET tests) will be provided by the laboratory undertaking the WET test (QA/QC of seawater is routinely undertaken under controlled conditions, as part of this process). The WET tests that will be undertaken are short-term chronic tests with sub-lethal end points. The ANZECC/ARMCANZ (2000) guidelines require the use of a suite of chronic tests using at least five different species representing at least four different taxonomic groups to obtain reliable trigger values. A variety of test statistics, including NOEC, LOEC, EC/IC10 and EC/IC50 values, will be generated from the proposed tests to determine (in discussion with the DER) which derivation protocol will be used to obtain a reliable guideline to ensure a high level of ecological protection outside the mixing zone, considering the level of dilution that occurs. It will therefore be important to ensure that the test statistics generated are as accurate as possible, via careful choice of the test concentrations used. Samples of 0.45 μm filtered Perth seawater will also be analysed for the same suite of contaminants (note that concentrations of pesticides and herbicides will not be analysed as these contaminants are likely to be present in very low concentrations, i.e. below analytical limits of reporting). The chemical characterisation of the combined wastewater stream will be undertaken using standard laboratory analytical procedures. Laboratories with NATA-accredited methods or appropriate QA/QC standards in place will undertake the analyses. Sample analysis will report against the lowest feasible analytical limits but where concentrations are reported as less than this limit, limits of reporting will be used in the calculations. The dilutions of wastewater used will typically be 0.5%, 6.25%, 12.5%, 25%, 50% and 100%, but may vary slightly for each WET test. All test dilutions for wastewater will be salt-adjusted (using artificial sea salts) to achieve marine salinities, so that only the toxicity due to the presence of contaminants is examined and not the toxic effect of freshwater on the marine organism. Testing will also be undertaken on a seawater control, and an artificial sea salt (brine) control.
5.4 Receiving waters: physico-chemical and direct biological measures
5.4.1 Compliance monitoring The objective of the compliance monitoring (CM) program, first introduced in 2003, was to meet the future requirement to develop an appropriate environmental monitoring program capable of measuring environmental quality against the EQOs. The overarching objectives of the CM program are: 1. to assess the environmental impacts of the treated wastewater discharge through regular and
intensive water quality monitoring 2. to compare the results with relevant Environmental Quality Criteria (EQC).

BMT Oceanica: Water Corporation: Sepia Depression Ocean Outlet: Monitoring and Management Plan 51
Timing Fortnightly sampling will be conducted over a 4-month period between December and March. Sampling is conducted during the summer to avoid potential confounding effects of riverine and groundwater discharge.
Sampling regime On each sampling occasion, a surface drogue will be deployed over the centre of the operational ocean outlet diffuser and retrieved approximately 30 min later. The time and location of the drogue at deployment and retrieval will be recorded using an on-board GPS. This information will be used to derive a directional vector along which sampling will be undertaken. These data will also provide an accurate estimate of surface current speed at the time of sampling. On each sampling occasion, samples will be collected at four reference sites and five compliance sites located at intervals of 0, 100, 350, 1000 and 1500 m down-current of the outlet. At each of the compliance and reference sites, the physico-chemical parameters measured are: irradiance salinity-depth profile temperature-depth profile dissolved oxygen depth profile. Irradiance measurements will be undertaken with one sensor positioned 1 m below the surface and a second sensor 7 m below the surface and the light attenuation coefficient calculated as follows:
Light Attenuation Coefficient = log10I1 – log10I7
6 A composite sample representative of the top half of the water column will be collected from each of the sites (Figure 5.2) for analysis of chlorophyll-a and nutrients. Two 10 mL filtered (on-site through a 45 µm filter) samples will be collected in polypropylene tubes for ortho-phosphate, ammonia and nitrate + nitrite analysis and 4–10 L of sample will be filtered (on-site through a Grade GF/C filter) and the filter retained for chlorophyll-a (and phaeophytin) analysis.

52 BMT Oceanica: Water Corporation: Sepia Depression Ocean Outlet: Monitoring and Management Plan
Figure 5.2 Conceptual diagram of the Compliance Monitoring program showing
hypothetical compliance sites and their relative distances from the outlet diffuser

BMT Oceanica: Water Corporation: Sepia Depression Ocean Outlet: Monitoring and Management Plan 53
5.4.2 Sentinel mussel monitoring Sedentary, filter-feeding shellfish (such as mussels) are often used as biomonitors. Filter-feeding shellfish process large volumes of water at a fixed location and have the tendency to accumulate a wide range of toxicants in their tissues. Shellfish therefore provide an integrated measure of the bioavailable portion of toxicants in the water column at a particular site, and consequently toxicant levels in shellfish provide a good proxy for overall levels in the surrounding water column. For many toxicants, shellfish are good indicators of toxicant transfer between the water column and the food web. The objective of the sentinel mussel monitoring program is to assess the risks to: EQO1 (Maintenance of Ecosystem Integrity) EQO2 (Maintenance of Aquatic Life for Human Consumption). Sentinel mussels will be deployed to monitor the assimilation of microbial organisms, bioaccumulating heavy metals and pesticides. Mytilus edulis mussels will be used, which have a number of features that make them suitable as biomarkers, including: their biology is well understood they are inexpensive and easily obtained they are easy to handle and process they are ecologically important they are frequently used in similar monitoring programs both nationally and internationally.
Timing Deployment of sentinel mussels at Sepia Depression Ocean Outlet was last undertaken in late summer 2010. Sentinel mussel deployment will be undertaken at 5-yearly intervals thereafter, unless annual wastewater characterisation results indicate that the concentrations of contaminants exceed ANZECC/ARMCANZ (2000) guidelines after 200-fold initial dilution: if this occurs, the sampling frequency will be reviewed in consultation with the DER. Results of previous sentinel mussel surveys at Sepia Depression (Oceanica 2007, Oceanica unpublished field data) and Ocean Reef (Oceanica 2010d) have indicated negligible bioaccumulation of heavy metals and pesticides by sentinel mussels deployed along the edge of the LEPA (only one analyte exceedance for metals) with results most often below analytical limits of detection. Consequently, a recommendation arising from the metals and pesticides survey for mussels at Ocean Reef and Sepia Depression (Oceanica 2010d) was to reduce the frequency of the surveys from 3- to 5-yearly, unless major changes in the quality or quantity of treated wastewater discharge warranted more frequent monitoring.
Sampling regime To address EQO1 (maintenance of ecosystem integrity), mussels will be deployed (Figure 5.3 and Table 5.4) at a site located in the immediate vicinity of the SDOOL ocean outlet (i.e. within the LEPA), at sites located 100 m upstream and downstream of the outlet (i.e. at the LEPA/HEPA boundary; Figure 5.3), and at a reference site located 4 000 m south of the outlet (Figure 5.3and Table 5.4). To address EQO2 (maintenance of aquatic life for human consumption), mussels will be deployed at the boundary of the proposed closed safety zone for aquaculture (Figure 5.3 and Table 5.4). Mussels of uniform size (50–70 mm in length) will be obtained from commercially cultured stocks. The use of a consistent size of mussel will reduce any influence of mussel size on bioaccumulation of toxicants.

54 BMT Oceanica: Water Corporation: Sepia Depression Ocean Outlet: Monitoring and Management Plan
At each monitoring site, replicate mussel lines will be deployed. On each line, mussels will be suspended 2-3 m below the surface and just above the seafloor (i.e. at approximately 18 m depth). Approximately 60 mussels will be suspended in mesh baskets on each of the mussel lines at each site. Mussels equilibrate with environmental conditions after a period of 4 weeks. To ensure equilibrium is met during SDOOL monitoring, the mussels will be deployed for a 6-week period (Regoli & Orlando 1994). The mussels and mesh baskets will be cleaned after 3 weeks to prevent the accumulation of algal growth that could smother and kill the mussels. After the 6 week deployment period, the mussels will be retrieved and the number of live mussels recorded. The live mussels will be placed into sterile bags and kept on ice while in transit to the analytical laboratory. Mussels from the same batch deployed on the mussel lines will be stored frozen prior to analysis to provide an indication of the initial toxicant load of the mussels. These will be the control mussels. Samples will be kept frozen until analysis. Samples for metal analysis will be thawed, the shells shucked and the soft tissue homogenised, and the samples freeze-dried and ground. Mussel tissue will be analysed for: metals: inorganic arsenic, cadmium, chromium, cobalt, copper, lead, mercury, nickel,
selenium, silver, zinc pesticides and herbicides: organochlorine pesticides, organophosphate pesticides, triazine
herbicides bacteriological indicators: E. coli, total plate counts. Standard laboratory analytical procedures will be employed throughout and laboratories with NATA-accredited methods or appropriate QA/QC standards in place will undertake the analyses.
Environmental quality and food health safety standards For EQO1 (Maintenance of Ecosystem Integrity), the median of data from mussels at site M1, M2 and M3 will be compared with the 80th percentile of data from the reference site R1. For EQO2 (Maintenance of Aquatic Life for Human Consumption), mussels from sites S1, S2 and S3 will be compared with the EQG and EQC in Table 5.3.
Table 5.3 EQG and EQS values for metal concentrations for the maintenance of seafood safe for human consumption
Metals Al As Cd Cr Co Cu Pb Hg Ni Se Ag Zn
LOR1 <20 <1 <0.06 <0.5 <0.2 <0.2 <1 <0.01 <0.4 <0.1 <1 <2
Units ug/g (wet wt)
EQG na na na na na 30 na na na 1.0 na 290
EQS na 1.0 2.0 na na na 2.0 0.5 na na na Notes: 1. Limit of reporting (LOR). Source: EPA (2005a)

BMT Oceanica: Water Corporation: Sepia Depression Ocean Outlet: Monitoring and Management Plan 55
Figure 5.3 Sentinel mussel and sediment sampling sites

56 BMT Oceanica: Water Corporation: Sepia Depression Ocean Outlet: Monitoring and Management Plan
Table 5.4 Sentinel mussel and sediment sampling site coordinates
Coordinate Description Easting Northing Proposed Closed Safety Zone for Shellfish Harvesting
1 North-west 371534 6429679
2 North-east 374297 6430691
3 South-east 375568 6426374
4 South-west 372797 6425393
Pesticides, metals and bacteriological monitoring sites
S1 Pesticides, Metals and Bacteriological monitoring site – north 372916 6430185
S2 Pesticides, Metals and Bacteriological monitoring site – east 374862 6428773
S3 Pesticides, Metals and Bacteriological monitoring site – south 374182 6425884
Bio-accumulating metals monitoring site
M1 Bio-accumulating metals monitoring site - north 373479 6426772
M2 Bio-accumulating metals monitoring site - west 373247 6426541
M3 Bio-accumulating metals monitoring site - south 373479 6426546
Reference site
R1 Reference location 373479 6422659
5.5 Toxicants in sediments
5.5.1 Sediment quality monitoring Concentrations of potential contaminants in the sediments can be a useful time-integrated measurement of the distribution and accumulation of toxicants from marine wastewater outlets. These measurements have particular applicability to the accumulation and/or toxicological effects of contaminants on benthic organisms in the vicinity of outlets. It should be noted, however, that the wastewater plume is positively buoyant and therefore rises rapidly to the surface and dissipates rapidly within the boundary of the mixing zone. There will, therefore, be limited contact of any components of the plume with the sediments before considerable dilution has occurred. Furthermore, sediments around the ocean outlet are generally fine/coarse-grained sands with a low capacity to bind contaminants, thus the potential for the accumulation of toxicants in the sediments is considered to be extremely low. The objective of the sediment surveys at Sepia Depression is to determine the spatial variability in concentrations of potential wastewater contaminants in sediments at sites in the vicinity of the SDOOL ocean outlet.
Timing Sediments will be collected every 5 years. The last sediment survey was undertaken in 2009 (Oceanica 2010d) with the next one scheduled for summer 2014/15.
Sampling regime Sediment samples will be collected from a site located in the immediate vicinity of the SDOOL ocean outlet (i.e. within the LEPA), at sites located 100 m upstream and downstream of the outlet (i.e. at the LEPA/HEPA boundary; labelled as bioaccumulating metals sites in Figure 5.3), and at a reference site located 4 000 m south of the outlet (labelled as R1 in Figure 5.3). At each site, five replicate surface sediment samples will be collected by divers using 9.5 cm diameter polycarbonate corers (according to the procedures set out in Australian Standard AS/NZS 5667.12:1999). Corers will be pre-rinsed with dilute acid, deionised water and a suitable solvent. The corers will be washed between sampling sites with site water before re-sampling.

BMT Oceanica: Water Corporation: Sepia Depression Ocean Outlet: Monitoring and Management Plan 57
Each replicate sample will comprise a composite from five sub-samples of the top 2 cm of sediment obtained from the four corners and the centre of a 1 m2 quadrat, in accordance with the Manual of Standard Operating Procedures for Cockburn Sound (EPA 2005b). Although five replicate samples will be taken at each site, only three samples from each site are to be analysed initially, in accordance with the minimum replicates for analysis (EPA 2005b). Sediment samples will be kept on ice and then frozen prior to analysis. Analyses will be undertaken by analytical laboratories with NATA-accredited methods. Sample analysis will report against the lowest practical analytical limits from a NATA commercial laboratory, and where possible analytical limits will achieve the guidelines in Table 5.5. Where concentrations are reported as less than this limit, the limits of reporting will be used in the calculations. Sediment samples will be analysed for: grain-size distribution (laser diffraction and sieving) organic matter content (loss on ignition at 550°C) carbonate content (loss on ignition at 1000°C) nutrients (TKN, TKP) metals (aluminium [Al], arsenic [As], cadmium [Cd], cobalt [Co], copper [Cu], lead [Pb],
mercury [Hg], nickel [Ni], selenium [Se], silver [Ag], zinc [Zn]). If the comprehensive treated wastewater characterisation (Section 5.3.3) reveals that pesticide and herbicides levels are below limits of reporting, these contaminants will not be measured in sediment samples. Recent and previous sediment sampling in the vicinity of Sepia Depression and Ocean Reef ocean outlets have consistently shown pesticide and herbicide levels to be below detection or at very low levels (Oceanica 2007, 2010d). If, on the other hand, treated wastewater characterisation shows an increases in pesticide and herbicide levels relative to the previous year’s analysis, then additional testing will be undertaken in the sediment surveys for organochlorine pesticides, organophosphate pesticides and triazine herbicides4. Additional testing will be undertaken under the following conditions: for pesticides/herbicides with guideline triggers >LOR: If concentrations exceed the
ANZECC/ARMCANZ (2000) guidelines following worst-case initial dilution for pesticides/herbicides with trigger values <LOR: If concentrations exceed the LOR
following worst case initial dilution.
4 Organochlorine pesticides [e.g. aldrin, dieldrin, heptachlor,], organophosphate pesticides [e.g. chloropyrifos,
malathion, parathion] and triazine herbicides [e.g. atrazine, metribuzine, simazine]).

58 BMT Oceanica: Water Corporation: Sepia Depression Ocean Outlet: Monitoring and Management Plan
Table 5.5 Sediment quality criteria
Parameter Value (high, moderate and low protection)1 Re-sampling trigger1
Metals (mg/kg dry weight)
Arsenic 20 70
Cadmium 1.5 10
Chromium 80 370
Copper 65 270
Lead 50 220
Mercury 0.15 1
Nickel 21 52
Silver 1 37
Zinc 200 410
Organics (µg/kg dry weight)2
Acenaphthene 16 500
Acenaphthalene 44 640
Anthracene 85 1100
Fluorene 19 540
Naphthalene 160 2100
Phenanthrene 240 1500
Benzo(a)anthracene 261 1600
Benzo(a)pyrene 430 1600
Dibenzo(a,h)anthracene 63 260
Chrysene 384 2800
Fluoranthene 600 5100
Pyrene 665 2600
Total Polycyclic Aromatic Hydrocarbons 4000 45000
Total DDT 1.6 46
pp-DDE 2.2 27
op-+pp-DDD 2 20
Chlordane 0.5 6
Dieldrin 0.02 8
Endrin 0.02 8
Lindane 0.32 1
Total Polychlorinated Biphenyls 23 180 Notes: 1. Values derived from Table 3 in EPA (2005a) 2. Sampling for organochlorine pesticides [e.g. aldrin, dieldrin and heptachlor], organophosphate pesticides [e.g.
chloropyrifos, malathion and parathion] and triazine herbicides [e.g. atrazine, metribuzine and simazine]) will only be undertaken if these contaminants are above detection in annual comprehensive treated wastewater characterisation.

BMT Oceanica: Water Corporation: Sepia Depression Ocean Outlet: Monitoring and Management Plan 59
5.6 Dam flushing events This document mostly addresses the effect of operations under normal operating conditions. The monitoring and management approach for short term/contingency events such as dam flushing requires a slightly different approach. Recognising that any exceedances of the continuous waste stream triggers during dam flushing events are not an indicator of upset plant conditions, the application of those triggers and subsequent management responses to an exceedance will be suspended during dam flushing events. All other EQG will be met during dam flushing events or associated management responses will be applied.
5.6.1 Interim measures A management system is required to ensure that when the balancing dam is flushed, dilution at the diffuser is sufficient to meet the relevant ANZECC/ARMCANZ species protection guideline values at the edge of the LEPA (particularly for ammonia). It is not yet clear whether dilution is sufficient for this purpose. The Water Corporation will provide evidence of the overall dilution at the edge of LEPZ during dam flushing events via modelling to determine whether they are sufficient to meet the relevant ANZECC/ARMCANZ species protection guidelines (including ammonia) (Appendix C). Measurements from wastewater characterisations collected during dam flushing (additional to the quarterly TWW characterisations) will be used to better identify maximum contaminant concentrations and will be used to determine whether the ANZECC/ARMCANZ guidelines are being met at the LEPA boundary. The outcome of this investigation will guide the management protocol that is derived but the protocol will ensure that EQG will be met during dam flushing events or associated management responses will be applied.
5.6.2 Ongoing monitoring After confirmation of the dilutions required to meet the ANZECC/ARMCANZ Species Protection Guidelines, ongoing diffuser validation (section 5.2.3) will serve as an annual check that dilution at the LEPA boundary remains adequate to achieve the guidelines during dam flushing events. Water Corporation will determine whether spikes in suspended solids are having an unacceptable impact on aesthetic values by monitoring the magnitude and distribution of any suspended sediment plumes arising from one dam flushing event per annum. Such an investigation would involve: timing one of the eight summer water quality sampling events to coincide with a dam flushing
discharge event measuring suspended solids, turbidity (light attenuation and secchi disk), ammonia and other
parameters in a down-current direction from the diffuser (but including the LEPA and post upgrade boundary)
Making a direct comparison between the relevant guidelines (i.e. ammonia at the LEPA boundary) or the 80th percentile of reference data (suspended solids and turbidity at the post upgrade boundary)

60 BMT Oceanica: Water Corporation: Sepia Depression Ocean Outlet: Monitoring and Management Plan
6. Monitoring to Maintain Seafood Safety
6.1 Overview This EQO for the Environmental Value Fishing and Aquaculture is aimed at ensuring seafood is safe for human consumption. To meet this objective, water quality around the Sepia Depression ocean outlet is to be maintained so that seafood is safe for consumption in all waters except areas designated otherwise. To ensure this EQO is being met, monitoring programs have been developed to measure compliance against EQC set for thermo-tolerant coliforms, metals, chemicals and algal biotoxins that may be a component of, or stimulated by, the treated wastewater discharged into the Sepia Depression.
6.2 Thermo-tolerant coliforms (TTC)
6.2.1 Microbial contaminant monitoring Many disease-causing organisms are transferred from human and animal faeces to water via sewage effluent, from where they can be ingested by marine fauna and infect them, adversely affecting their suitability for human consumption. Thermo-tolerant coliforms (TTC) are one such group of bacteria that primarily originate in the intestines of warm-blooded animals. By testing for TTC, it can be determined whether the ocean water around the Sepia Depression has potentially been exposed to faecal contamination. To adequately assess the risk to human health based on ingestion of infected seafood and to determine whether the EQC for maintenance of aquatic life for human consumption have been met numbers of TTC will be monitored at the boundary of the pre-designated Shellfish Harvesting Exclusion Zone (SHEZ; see Figure 4.4). As we are primarily considering contamination of bottom-dwelling sessile filter-feeding marine organisms seawater samples will be collected at the bottom of the water column. Samples will be collected on eight occasions during the non-river flow period at five fixed sites at the boundary of the SHEZ located immediately down-current of the diffuser (Figure 6.1 and Figure 6.2). The five monitoring sites are selected based on the current direction as indicated by the drogue release during compliance monitoring. Near-bottom water samples for microbiological contaminants will be collected in pre-sterilised bottles before being chilled in the dark to 4°C. Samples will then be transferred to a laboratory (e.g. Pathwest) and analyses for TTC undertaken according to NATA-accredited methods.

BMT Oceanica: Water Corporation: Sepia Depression Ocean Outlet: Monitoring and Management Plan 61
Figure 6.1 Fixed sites around the Sepia Depression outlet sampled for thermo-tolerant
coliforms (TTC), Enterococci spp. and phytoplankton during periods with northerly, easterly, westerly and southerly currents

62 BMT Oceanica: Water Corporation: Sepia Depression Ocean Outlet: Monitoring and Management Plan
Figure 6.2 Fixed sites around the Sepia Depression outlet sampled for thermo-tolerant
coliforms (TTC), Enterococci spp. and phytoplankton during periods with north-easterly, south-easterly, north-westerly and south-westerly currents

BMT Oceanica: Water Corporation: Sepia Depression Ocean Outlet: Monitoring and Management Plan 63
To ensure the maintenance of safe seafood for human consumption around the Sepia Depression ocean outlet, the EQG requires that the median TTC counts must not exceed 14 CFU/100 mL, with no more than 10% of the samples exceeding 21 CFU/100 mL as measured using the membrane filtration method. If this EQG is not met, assessment will proceed against the EQS for TTC (see below). The EQS requires that median TTC counts in seawater (outside of the SHEZ) are not to exceed 70 CFU/100 mL, with no more than 10% of the samples exceeding 85 CFU/100 mL.
6.2.2 Sentinel mussel monitoring See section 5.4.2.
6.3 Metals and chemicals
6.3.1 Sentinel mussel monitoring See section 5.4.2.
6.4 Algal biotoxins
6.4.1 Phytoplanktion community composition Blooms of planktonic algae, or 'red tides', are naturally-occurring events. Most of these blooms contain species of algae that are considered harmless and result only in water discolouration. However, other algal species can produce toxins that have a serious effect on the surrounding marine life. Some algae are capable of secreting compounds into the water that are toxic to filter-feeders and to planktivorous fish that may ingest the toxic algal cells directly from the water column and retain the toxins in their viscera (internal organs). Monitoring of algal biotoxins aims to target concentrations of species most likely to occur in local waters and involves a staged process, whereby water quality is assessed in the first instance (i.e. the EQG), and if this does not meet the required quality standards, a secondary assessment is required to assess toxin concentrations within sentinel mussels (i.e. EQS).
Table 6.1 EQG and EQS for the maintenance of seafood for human consumption
EQG EQS
Concentrations of potentially toxic algae at sites at the boundary of the SHEZ must not to exceed the WASQAP1 guideline concentrations for any of the following: Alexandrium spp. (100 cells L-1) Gymnodinium spp. (1000 cells L-1) Karenia spp. (1000 cells L-1) Dinophysis spp. (500 cells L-1) Dinophysis acuminta (3000 cells L-1) Prorocentrum spp. (500 cells L-1) Psuedo-nitzschia spp. (25 000 cells L-1) Gonyaulax cf. spinifera (100 cells L-1) Protoceratium reticulatum (Gonyaulax grindleyi) (500 cells L-1) If this EQG is not met, assessment will proceed against the EQS for sentinel mussel tissues.
Toxin concentrations in seafood not to exceed EQS2 in any sample at the boundary of the SHEZ3: Paralytic shellfish poison (0.8 mg
Saxitoxin eq. kg) Diarrhoetic shellfish poison (0.2 mg kg) Neurotoxic shellfish poison (200 mouse
units kg) Amnesic shellfish poison (domoic acid;
20 mg kg)
Notes: 1. Western Australian Shellfish Quality Assurance Program (DoF 2007). 2. As set out in the Australian New Zealand Food Standards Code (FSANZ 2006). 3. Western Australian Shellfish Quality Assurance Program (WASQAP) Operations Manual (DoF 2007).

64 BMT Oceanica: Water Corporation: Sepia Depression Ocean Outlet: Monitoring and Management Plan
Phytoplankton samples are collected at the same sites and same occasions as thermo-tolerant coliforms (Figure 6.1 and Figure 6.2). Composite water samples representative of the top half of the water column will be preserved in Lugol’s iodine solution and transported to a laboratory (i.e. Dalcon Environmental) for phytoplankton identification using the Utermöhl method. Phytoplankton will be identified to the lowest taxonomic level possible. On each sampling occasion only one sample (i.e. in the direct path of the drogue) will initially be analysed with the remaining four samples archived. In the event that toxic phytoplankton species are present in the sample analysed at concentrations that exceeded the recommended WASQAP guideline concentrations (DoF 2007), the archived phytoplankton samples collected on that sampling occasion will also be analysed (Table 6.2).
Table 6.2 Protocols for analysis of archived phytoplankton samples
Outcome of initial analysis Further action
No exceedance of WASQAP1 guideline concentrations No analysis of archived samples
Exceedance of WASQAP guideline concentrations at both the reference site and the CM site No analysis of archived samples
Exceedance of WASQAP guideline concentrations at the reference site, but not at the CM site
No analysis of archived samples
Exceedance of WASQAP guideline concentrations at the CM site but not at the reference site.
Additional samples analysed
Note: 1. Western Australian Shellfish Quality Assurance Program (DoF 2007)
6.4.2 Sentinel mussel monitoring See section 5.4.2.

BMT Oceanica: Water Corporation: Sepia Depression Ocean Outlet: Monitoring and Management Plan 65
7. Monitoring to Maintain Contact Recreation
7.1 Overview This EQO for the Environmental Value Recreation and Aesthetics is aimed at ensuring Perth’s coastal waters are safe for primary and secondary contact recreation activities such as swimming and boating. To meet this objective, water quality around the Sepia Depression ocean outlet is to be maintained so that typical recreation activities can be conducted in all waters except areas designated otherwise. To ensure this EQO is being met, monitoring programs have been developed to measure compliance against EQC set for Enterococci spp. and algal biotoxins that may be a component of, or stimulated by, the treated wastewater discharged into the Sepia Depression. As the maintenance of primary contact recreation EQO requires a higher water quality standard to be maintained than secondary contact recreation EQO, by default, it is assumed that if primary contact recreation EQC are met, secondary contact recreation EQC will also be achieved.
7.2 Faecal pathogens (Enterococci spp.) Disease-causing microorganisms (pathogens) associated with bathing areas include salmonellae, shigellae, enteropathogenic Escherichia coli, cysts of Entamoeba histolytica, parasite ova, enteroviruses and infectious hepatitis. Generally, the most common types of diseases that have been associated with swimming areas are eye, ear, nose and throat infections, skin diseases and gastrointestinal disorders. Direct detection of pathogens is not a feasible option for routine assessment, since they occur intermittently and are difficult to recover from water. For this reason, indicator microorganisms are generally used to assess the health risks associated with pathogens in recreational waters (Elliot & Colwell 1985). A number of organisms have been considered as indicators of health risks for swimming areas (Daly 1991). To determine whether the EQC for primary and secondary contact recreation have been met faecal streptococci (Enterococci spp.) samples will be collected on eight occasions at the boundary of the area where primary and secondary contact recreation is not recommended (Figure 4.6). Depth-integrated samples for analysis of Enterococci spp. will be collected from the top half of the water column from five sites selected based on the current direction indicated by a drogue (Figure 6.1 and Figure 6.2). Enterococci spp. samples will be collected in pre-sterilised bottles before being chilled to 4°C and placed in the dark. On completion of sampling, the samples will be transferred to a laboratoriy (e.g. Pathwest) and analysed according to NATA-accredited methods. The EQG for faecal pathogens (Enterococci spp.) requires that the 95th percentile of Enterococci spp. not exceed 200 MPN/100 mL at the boundary of the contact recreation zone.
7.3 Algal biotoxins Algal blooms (stimulated by nutrient inputs) can be harmful to human/animal health if encountered via ingestion or skin contact. For this reason, phytoplankton cell counts are monitored over the summer period to ensure concentrations are within acceptable limits (EPA 2005a). Phytoplankton samples (as an indicator of algal biotoxins present in certain phytoplankton) will be collected, preserved and analysed in the manner described in Section 6.4.1.

66 BMT Oceanica: Water Corporation: Sepia Depression Ocean Outlet: Monitoring and Management Plan
7.4 Toxic chemicals Toxic chemicals will be determined directly in the waste stream on an annual basis (Section 5.3.3). The list captures the relevant contaminants most likely to be present in the waste stream based (Appendix E). The recreational guidelines for toxic chemicals are high compared to the guidelines for ecosystem protection. An initial assessment for toxic chemicals will be made against the most sensitive guideline (the ecosystem protection guidelines) in the first instance. If the requirements of the most sensitive guidelines for ecosystem protection are met then the human health guidelines are also met. Further assessment against subsequent guidelines (Table 7.1) will only be made in the event of an exceedance of the most sensitive guideline. The recreational guidelines will apply at the post upgrade boundary. However, in the absence of dilution factors that apply at that boundary the concentrations of toxic chemicals will be corrected based on minimum dilutions achieved at the LEPA boundary in the first instance. If the recreational guidelines are exceeded at the LEPA boundary, dedicated modelling will be conducted to determine concentrations at the relevant management boundary to allow direct comparison against the guidelines.
Table 7.1 Parameters to be measured annually in the SDOOL wastewater stream and the EPA (2005a) recreational guidelines
Parameter Max (last 5 years)
After 1:200 dilutions Recreational Guidelines
Nutrients (µg L-1)
Nitrate-N+ Nitrite-N 7500 37.5 1 000 000
Metals and Metalloids (µg L-1)
Arsenic (As) 2 0.01 140
Cadmium (Cd) <0.1 <0.0005 40
Chromium (Cr) 3 0.015 1000
Copper (Cu) 11 0.055 40 000
Lead (Pb) <1 <0.005 200
Mercury (Hg) <0.1 <0.0005 20
Nickel (Ni) 9.9 0.0495 400
Selenium (Se) <1 <0.005 200
Silver (Ag) <0.8 <0.004 2000
Triazine herbicides (µg L-1)
Atrazine 1.4 0.007 400
Hexazinone <0.1 <0.0005 6000
Metribuzine <0.1 <0.0005 1000
Simazine 0.58 0.0029 400
Phenoxy-acid herbicides (µg L-1)
Dicamba <1 <0.005 2000
2,4-D 68 0.34 600
2,4,5-T <1 <0.005 2000
Triclopyr <1 <0.005 200
Organophosphate pesticides (µg L-1)
Azinphos-Methyl <0.2 <0.001 60
Chlorfenvinphos (E) <0.2 <0.001 200
Chlorfenvinphos (Z) <0.2 <0.001 200
Dichlorvos <0.2 <0.001 20
Diazinon <0.2 <0.001 60
Dimethoate <0.2 <0.001 6000

BMT Oceanica: Water Corporation: Sepia Depression Ocean Outlet: Monitoring and Management Plan 67
Parameter Max (last 5 years)
After 1:200 dilutions Recreational Guidelines
Ethion <0.2 <0.001 60
Fenitrothion <0.2 <0.001 200
Parathion (Ethyl) <0.2 <0.001 200
Parathion Methyl <0.2 <0.001 2000
Pirimiphos-Ethyl <0.2 <0.001 10
Pirimiphos-Methyl <0.2 <0.001 1000
Organochlorine pesticides (µg L-1)
Aldrin <0.05 <0.00025 6
trans-Chlordane <0.05 <0.00025 20
cis-Chlordane <0.05 <0.00025 20
gamma-BHC (Lindane) <0.05 <0.00025 400
p,p-DDT <0.05 <0.00025 400
Dieldrin <0.05 <0.00025 6
alpha-Endosulfan <0.05 <0.00025 600
beta-Endosulfan <0.05 <0.00025 600
Heptachlor <0.05 <0.00025 6
Methoxychlor <0.05 <0.00025 6000
Phenols (µg L-1)
2-Chorophenol <1 <0.005 6000
2,4-Dichlorophenol 2.1 0.0105 4000
2,4,6-Trichlorophenol <2 <0.01 400
Pentachlorophenol (PCP) <2 <0.01 200
Phthalates (µg L-1)
Bis(2-ethylhexyl)phthalate <20 <0.1 200
Chlorinated hydrocarbons (µg L-1)
1,4-Dichlorobenzene <20 <0.1 800
1,2-Dichlorobenzene <20 <0.1 30 000
Hexachloro-1,3-butadiene <20 <0.1 14
BTEX (µg L-1)
Benzene <1.0 <0.005 20
Toluene <1.0 <0.005 16 000
Ethylbenzene <1.0 <0.005 6000
PAHs (µg L-1)
Benzo(a)pyrene <10 <0.05 0.2
Miscellaneous Other (mg L-1 except pH)
Chlorine-Total <0.02 <0.0001 100

68 BMT Oceanica: Water Corporation: Sepia Depression Ocean Outlet: Monitoring and Management Plan
8. Monitoring to Maintain Aesthetic Values
8.1 Overview This EQO for the Environmental Value Recreation and Aesthetics ensures that Perth’s coastal waters are aesthetically pleasing and that the aesthetic value is protected. To ensure this EQO is being met, monitoring will routinely assess the quality of surface water appearance.
8.2 Aesthetic appearance Aesthetic appearance will be determined via a questionnaire supplied to field personnel (Table 8.1). It will be determine on eight occasions during the non-river flow period (see Section 5.4.1). On each occasion, the questionnaire will be completed at one location on the post upgrade boundary down-current of the diffuser (Figure 6.1 and Figure 6.2).
Table 8.1 Field sheet for demonstrating compliance with EQG for aesthetics
Site: Date: Recorder: Comments
Environmental Quality Guideline
Algal/plant material visible on surface? Yes/No
Dead marine organisms visible? Yes/No
Water clarity (light attenuation) Metres
Noticeable colour variation? Yes/No
Oil or other films visible on surface? Yes/No
Floating debris visible on the surface? Yes/No
Noticeable odour associated with water? Yes/No
A complaints register will be established that will be accessible via an email contact and phone number published on the Water Corporation website. The register will be monitored for complaints and a summary of those complaints (if any) reported in the Annual Report.
8.3 Fish tainting substances Fish tainting chemicals will be determined directly in the waste stream on an annual basis (Section 5.3.3). The guidelines for fish tainting substances are generally high compared to the guidelines for ecosystem protection. An initial assessment for fish tainting substances will be made against the most sensitive guideline (the ecological guidelines) in the first instance. If the requirements for the most sensitive guideline are met then it will be assumed that the aesthetics guidelines are also met. Further assessment against subsequent guidelines (Table 8.2) will only be made in the event of an exceedance of the most sensitive guideline. The aesthetics guidelines will apply at the post upgrade boundary. However, in the absence of dilution factors that apply at that boundary the concentrations of toxic chemicals will be corrected based on minimum dilutions achieved at the LEPA boundary in the first instance. If the aesthetics guidelines are exceeded at the LEPA boundary, dedicated modelling will be conducted to determine concentrations at the relevant management boundary to allow direct comparison against the guidelines.

BMT Oceanica: Water Corporation: Sepia Depression Ocean Outlet: Monitoring and Management Plan 69
Table 8.2 Parameters to be measured annually in the SDOOL wastewater stream and the EPA (2005a) guidelines for fish tainting substance
Parameter Max (last 5 years)
After 1:200 dilutions Aesthetics Guidelines
Metals and Metalloids (µg L-1)
Copper (Cu) 11 0.055 1000
Zinc (Zn) 68 0.34 5000
Phenols (µg L-1)
Phenol 16 0.08 300
2,4-Dichlorophenol 2.1 0.0105 0.3
2,4,6-Trichlorophenol <2 <0.01 2
Pentachlorophenol (PCP) <2 <0.01 30
Chlorinated hydrocarbons (µg L-1)
Hexachlorocyclopentadiene <20 <0.1 1
Ethers (µg L-1)
Nitrobenzene <20 <0.1 30
BTEX (µg L-1)
Toluene <1.0 <0.005 250
Ethylbenzene <1.0 <0.005 250
PAHs (µg L-1)
Napthalene 0.011 0.000055 1000
Acenaphthene <10 <0.05 20

70 BMT Oceanica: Water Corporation: Sepia Depression Ocean Outlet: Monitoring and Management Plan
9. Implementation
9.1 Reporting and auditing A SDOOL Monitoring Program Report will be produced annually. The Annual Report will include: Executive Summary: a brief summary that can be read as a stand-alone document. Introduction and Background: description of the SDOOL and current operating parameters;
history of the SDOOL Monitoring Program. Management of the SDOOL: description of the Ministerial Statement Conditions and the
Water Corporation’s Environmental Management Commitments; the current status of management of the SDOOL, including the Environmental Quality Management Framework in place for the SDOOL.
Methods: details of sampling frequency, sampling locations, sample collection protocols, parameters monitored and laboratory analyses undertaken.
Presentation, Interpretation and Discussion of Key Findings: presentation, interpretation and discussion of the key findings from each of the studies managed under the SDOOL Monitoring Program and the studies relevant to the SDOOL which have been managed by the Perth Long-Term Ocean Outlet Monitoring (PLOOM) Program including the characterisation of wastewater, the results from the initial dilution modelling and water quality monitoring. The data will be tabulated and presented graphically where appropriate to assist with interpretation.
Compliance with Environmental Quality Criteria/Ministerial Statement Conditions/Water Corporation’s Environmental Management Commitments: comparison of the results of the SDOOL Monitoring Program with the Environmental Quality Criteria, including presentation of the results from the SDOOL Monitoring Program in a summary compliance ‘Report Card’.
Program Review and Recommendations: assessment of all aspects of the SDOOL Monitoring Program and recommendations for any changes to the Program.
The SDOOL Monitoring Program Annual Report will be presented to the SDOOL Stakeholder Liaison Group for discussion prior to submission to the DER. In addition, the SDOOL Monitoring Program Annual Report will be publicly available via the Water Corporation’s web-site (http://www.watercorporation.com.au).
9.2 Monitoring and revision The requirements of this M&MP may be reviewed from time to time. Any change to the requirements of this plan resulting from such reviews will be determined by the Water Corporation on advice of the OEPA. All components of the monitoring and management program will be reviewed to ensure that meaningful results are obtained, that the objectives are still appropriate and the program is relevant. The review will consist of the continuous aggregation and consolidation of information collected throughout the conduct of the monitoring program and will be reported to the OEPA and the SDOOL Stakeholder Liaison Group.

BMT Oceanica: Water Corporation: Sepia Depression Ocean Outlet: Monitoring and Management Plan 71
10. Stakeholder consultation The Water Corporation undertook considerable community consultation on environmental aspects of the Sepia Depression WWTP during the development of the KWRP proposal, which commenced in December 1999. The approach to consultation was more formalised in late 2000, and a summary of community consultation carried out since December 2000 is fully described by Bailey et al. (2003) and provided in Appendix G. Further, ongoing liaison between the Water Corporation and a stakeholder reference group has been maintained, during which the outcomes of monitoring are reported annually (Appendix H). Informal consultation with a range of experts and the OEPA was undertaken in the development of EQC.

72 BMT Oceanica: Water Corporation: Sepia Depression Ocean Outlet: Monitoring and Management Plan
11. References ANZECC, ARMCANZ (2000) Australian and New Zealand Guidelines for Fresh and Marine Water
Quality. Volume 1: The Guidelines. Australian and New Zealand Environment and Conservation Council and Agriculture and Resource Management Council of Australia and New Zealand, Canberra, ACT, October 2000
Bailey MC, Hillman K, Baker A, Humphries R, Luketina D (2003) Kwinana water reclamation plant (KWRP): Expanding Perth's water options – use of Cape Peron outlet pipeline to dispose of industrial wastewater to sepia depression – Kwinana – Public environmental review. Prepared by Water Corporation of Western Australia, Perth, Western Australia, November 2003
Barceloux DG (2000) Vanadium. Journal of Toxicology - Clinical Toxicology 37:265–278
DAL (2001) Perth Long-Term Ocean Outlet Monitoring (PLOOM) Programme: Location of Water Quality Monitoring Sites. Prepared for Water Corporation of Western Australia by DA Lord & Associates, Report No 95/015/13, Perth, Western Australia, December 2001
Daly H (1991) Recreational water quality indicators: A brief discussion paper. Information Bulletin WQ2/91. Victorian Environment Protection Authority, Melbourne, Victoria
DoF (2007) Western Australian Shellfish Quality Assurance Program (WASQAP) Operations Manual. Department of Fisheries, Perth, Western Australia
Eklund BT, Kautsky L (2003) Review on toxicity testing with marine macroalgae and the need for method standardization-exemplified with copper and phenol. Marine Pollution Bulletin 46:171–181
Elliot EL, Colwell RR (1985) Indicator organisms for estuarine and marine waters. Federation of European Microbiological Societies Microbiology Reviews 32:61–79
EPA (2000) Perth Coastal Waters – Environmental Values and Objectives – the position of the EPA – a working document. Environmental Protection Authority, Perth, Western Australia, February 2000
EPA (2002) Implementation Framework for Western Australia for the Australian and New Zealand Guidelines for Fresh and Marine Water Quality and Water Quality Monitoring and Reporting (Guidelines Nos 4 & 7: National Water Quality Management Strategy). Environmental Protection Authority, Report No 1078, Perth, Western Australia, November 2002
EPA (2004) Use of the Cape Peron outlet pipeline to dispose of industrial wastewater, Kwinana. Prepared for Water Corporation by Environmental Protection Authority, Report No 1135, Perth, Western Australia, May 2004
EPA (2005a) Environmental Quality Criteria Reference Document for Cockburn Sound (2003–2004) – A supporting document to the State Environmental (Cockburn Sound) Policy 2005. Environmental Protection Authority, Report No 20, Perth, Western Australia
EPA (2005b) Manual of Standard Operating Procedures – For Environmental Monitoring against the Cockburn Sound Environmental Quality Criteria (2003–2004) – A supporting document to the State Environmental (Cockburn Sound) Policy 2005. Environmental Protection Authority, Report No 21, Perth, Western Australia, January 2005
FSANZ (2006) Safe Seafood Australia – A guide to the Australian Primary Production and Processing Standard for Seafood. Food Standards Australian New Zealand, Canberra, ACT, April 2006

BMT Oceanica: Water Corporation: Sepia Depression Ocean Outlet: Monitoring and Management Plan 73
Govt of WA (2005) State Environmental (Cockburn Sound) Policy 2005, Prepared by Government of Western Australia, Perth, Western Australia, January 2005
Kathrine KA, Lavercombe PS, Dillon J, Ginsberg J (2006) Accidental death from acute selenium poisoning. Medical Journal of Australia 185:388–389
McAlpine K, Wenziker K, Apte SC, Masini RJ (2005) Background quality for coastal marine waters of Perth, Western Australia. Department of Environment, Report No 117, Perth, Western Australia, March 2005
NHMRC (2008) Guidelines for Managing Risks in Recreational Water. National Health and Medical Research Council, Canberra, ACT, February 2008
Oceanica, CRC (2005) Benthic Habitat Mapping Owen Anchorage 2004. Prepared for Cockburn Cement Limited by Oceanica Consulting Pty Ltd and Cooperative Research Centre for Coastal Zone, Estuary and Waterway Management, Report No 344/1, Perth, Western Australia, December 2005
Oceanica (2007) Perth Long Term Ocean Outlet Monitoring (PLOOM) 4.2 – 2006/2007 Metals and Pesticides Survey at Ocean Reef and Sepia Depression Ocean Outlets. Prepared for Water Corporation of Western Australia by Oceanica Consulting Pty Ltd, Report No 562/1, Perth, Western Australia, June 2007
Oceanica (2009) PLOOM 5 Annual Reporting 2008 – Sepia Depression. Prepared for Water Corporation by Oceanica Consulting Pty Ltd, Report No 628_004/3, Perth, Western Australia, August 2009
Oceanica (2010a) Alkimos Wastewater Treatment Plant – Environmental management of temperate macroalgal communities exposed to treated domestic wastewater: developing appropriate triggers for action. Prepared for Water Corporation by Oceanica Consulting Pty Ltd, Report No 790_002/1, Perth, Western Australia, September 2010
Oceanica (2010b) Sepia Depression Ocean Outlet Landlines (SDOOL) – Annual Report 2010. Prepared for Water Corporation by Oceanica Consulting Pty Ltd, Report No 821_004/2, Perth, Western Australia, November 2010
Oceanica (2010c) Sepia Depression Ocean Outfall Landline (SDOOL) – Treated Wastewater Characterisation and Ecotoxicological (WET) testing of wastewater discharged through the SDOOL (September 2009 & March 2010). Prepared for Water Corporation by Oceanica Consulting Pty Ltd, Report No 821_002/1, Perth, Western Australia, July 2010
Oceanica (2010d) Perth Long Term Ocean Outlet Monitoring (PLOOM) 6.0 – 2009/10 Metals and Pesticides Survey at Ocean Reef and Sepia Depression Ocean Outlets. Prepared for Water Corporation of Western Australia by Oceanica Consulting Pty Ltd, Report No 834_001/1, Perth, Western Australia, June 2010
Opresko DM (1993) Toxicity summary for molybdenum. Report prepared for Oak Ridge Reservation Environmental Restoration Program Chemical Hazard Evaluation Group, Biomedical and Environmental Information Analysis Section, Health and Safety Research Division, Oak Ridge, Tennessee
Pattiaratchi C, Imberger J, Zaker N, Svenson T (1995) Perth Coastal Waters Study - Physical Measurements, Prepared for Water Authority of Western Australia by Centre for Water Research University of Western Australia, Perth, Western Australia, January 1995
Pattiaratchi C, Knock C (1995) Perth Coastal Waters Study – Model Tuning and Validation. Prepared for Water Authority of Western Australia by Centre for Water Research University of Western Australia, Perth, Western Australia, January 1995

74 BMT Oceanica: Water Corporation: Sepia Depression Ocean Outlet: Monitoring and Management Plan
Regoli F, Orlando E (1994) Accumulation and subcellular distribution of metals (Cu, Fe, Mn, Pb and Zn) in the Mediterranean mussel Mytilus galloprovincialis during a field transplant experiment. Marine Pollution Bulletin 28:592–600

Appendix A
Ministerial Statement 665


Appendix B
Management Response Framework flow diagrams


Figure B 1 ANZECC/ARMCANZ (2000) guidelines decision tree for toxicants in treated wastewater
EQG – do concentrations of contaminants exceed the ANZECC/ARMCANZ (2000) 80% species protection
guideline trigger levels for bioaccumulating toxicants at the diffuser?
EQG exceeded, initiate assessment against EQS
Sentinel mussel monitoring
EQS – do the median concentrations of metals that may bioaccumulate (cadmium and mercury) within
mussel tissue from sites at the boundary of the LEPA exceed the 80th percentile of values from reference
sites?
EQS exceeded
Any instances of an exceedance of the EQGS will be reported to the DEC and the OEPA within one working day of determining
that this has occurred. The significance of the exceedance, and any required investigation/action will be discussed with the OEPA.
If required, a detailed risk assessment to indicate potential risk to the environment will be conducted. Toxicity Reduction
Evaluation (TRE) will be undertaken, to identify the contaminant(s) of concern, and the management required to reduce them to
acceptable levels.
Management measures to reduce the contaminant(s) of concern will be implemented and ongoing wastewater characterisation
will be conducted to confirm that the required results are being achieved.
EQG 1
1. Do concentrations of contaminants exceed the
ANZECC/ARMCANZ (2000) 99% species protection
guideline trigger levels for toxicants at the LEPA
boundary?; and
Total Toxicity of the mixture (TTM)
2. Is the TTM of the additive effect of ammonia, copper and zinc (as per ANZECC/ARMCANZ (2000) guidelines) less
than 1.0?
Toxicants in Treated Wastewater Non-bioaccumulating substances
EQG 2
Whole of effluent (WET) testing
Has the 1-hour sea urchin test been exceeded the
ANZECC/ARMCANZ (2000) 99% species protection
guidelines: according to:
EQS
Initial dilution modelling
Have the full suite of WET testing exceeded the
ANZECC/ARMCANZ (2000) 99% species protection
guidelines according to:
1
%99
BurrliOZDR
DALEPA
Resample
EQS exceeded
Any instances of an exceedance of the EQGS will be reported to the DEC and the OEPA within one working day of determining that
this has occurred and the following course of action initiated:
1. A Toxicity Reduction Evaluation (TRE) will be undertaken to identify the contaminant(s) of concern and the management
required to reduce them to acceptable levels. This would include a detailed examination of the treated wastewater and
potentially include a Stage 1 Toxicity Identification Evaluation.
2. Management measures to reduce the contaminant(s) of concern will be implemented, along with monitoring to confirm
that the required results are being achieved. The monitoring could include wastewater characterisation, further WET
tests, and in situ monitoring, subject to further consultation with the OEPA.
Low
risk
No
Yes
Yes
Yes
Low
risk
No
Yes
Yes
Yes
Low
risk
No
No
Toxicants in Treated Wastewater Bioaccumulating substances

Figure B 2 Management response framework in the event of an exceedance of the EQC for bioaccumulating metal concentrations in sentinel mussel tissues
1 If investigations fail to establish a link between industrial processes associated with the SDOOL and exceedances of
bioaccumulating metals in mussel tissues, then it is assumed that results reflect natural variation, or an independent
influence, and the risk posed by the wastewater effluent is considered negligible.
Undertake routine sentinel mussel monitoring within and
at the boundary of the LEPA.
Does the median tissue concentration
for bioaccumulating metals exceed the
80th percentile of reference site
values?
Investigate cause of exceedance –
check with industries regarding
changes to industrial processes. Has
a WWTP upset condition occurred?
Confirm cause of difference between
sites and investigate the ecological
significance of the difference in
consultation with the DEC. If there is a high risk of an ongoing
environmental problem, then initiate
management response to prevent
further contamination.
Does the tissue concentration for
bioaccumulating metals exceed the
Australian New Zealand Food
Standards code?
Contact WA Dept
of Health.
EQO1: EQG
No
No Yes
Low risk
Acceptable risk
from wastewater
effluent 1
EQO2: EQS
Yes Yes No
Low risk

Figure B 3 Management response framework in the event of an exceedance of EQC triggers levels for receiving water quality: physico-chemical parameters and nutrient enrichment)
Undertake summer fortnightly water quality monitoring at
CM sites.
Does the median from samples exceed
the defined EQG for:
nutrient enrichment;
light attenuation; dissolved oxygen;
salinity; or
phytoplankton biomass
Resample sites to confirm exceedance
and check whether concentrations
exceed EQS for physico-chemical
parameters?
EQS triggered. Report to DEC and the OEPA
within one working day. Commence
management response.
Resample sites to confirm exceedance
and check whether concentrations
exceed EQS for direct biological
measures?
No
Low risk Yes
If the EQS is exceeded then a management response will be initiated in consultation with
the OEPA and other relevant regulatory agencies to investigate whether algal community
structure has shifted by a margin beyond that expected due to natural processes alone.
No
Low risk
Yes
No
EQG triggered. Report to DEC and the OEPA within one
working day. Commence assessment against EQS.
Yes

Figure B 4 Management response framework in the event of an exceedance of EQG (ISQG-low) triggers levels for sediment quality
Undertake routine sediment monitoring within and at the boundary of the LEPA
EQG Does the median from samples from within or at the boundary of the LEPA exceed either ISQG-low or ISQG-high triggers?
EQG Exceeded In the event that an EQG for sediment quality is exceeded, report to the DEC within one working day and an investigation of the exceedance will be conducted in accordance with the framework developed in the Environmental Quality Criteria Reference Document for Cockburn Sound (2003-2004) (EPA 2005a).
Proceed assessment against EQS
A. The 80%ile of bioavailable metal or metalloid concentrations (e.g. dilute acid extractable metals, SEM/AVS analysis) from the defined sampling area should not exceed the EQG. or B. The median bioavailable concentration for non-metallic contaminants (e.g. OC normalisation) from the defined sampling area should not exceed the EQG C. The 95%ile of bioavailable contaminant concentrations in porewater samples from the defined sampling area should not exceed high protection water quality guideline values (Table 2a of EQC Reference document).
D. Sediment toxicity tests should not result in a statistically significant effect (P < 0.05) on sublethal chronic or lethal acute endpoints for any species, compared to a matched reference sediment E. No significant change in any biological or ecological indicator beyond natural variation that can be demonstrably linked to a contaminant F. Where TBT concentrations exceed the guideline the incidence of imposex in Thais orbita should be ≤ 5%.
G. The median tissue concentration of chemicals that can adversely bioaccumulate or biomagnify should not exceed the 80th percentile of tissue concentrations from a suitable reference site.
EQS Exceeded, initiate management responses 1. A Toxicity Reduction Evaluation (TRE) will be undertaken to identify the contaminant(s) of concern and the management required to reduce them to acceptable levels. This would include a detailed examination of the treated wastewater and potentially include a Stage 1 Toxicity Identification Evaluation. 2. Management measures to reduce the contaminant(s) of concern will be implemented, along with monitoring to confirm that the required results are being achieved. The monitoring could include wastewater characterisation, further WET tests, and in situ monitoring, subject to further consultation with the OEPA.
Low
risk
No
Low
risk
No
Yes
Yes
Yes

Figure B 5 Management response framework in the event of an exceedance of the EQC for thermo-tolerant coliforms in water and sentinel mussel tissues
Undertake routine water quality monitoring within and at
the boundary of the SHEZ.
Does the median from samples within
and at the boundary of the SHEZ
exceed 14 CFU 100 mL-1, with no more
than 10% of the samples exceeding 21
CFU 100 mL-1?
1. Re-sample SHEZ sites to test whether the
EQS has been exceeded (70 CFU 100
mL-1, with no more than 10% of the
samples exceeding 85 CFU 100 mL-1)? 2. Initiate sentinel mussel monitoring along
the boundary of the SHEZ.
Investigate cause of exceedance.
Check industries regarding changes to
industrial processes and determine
whether plant upset condition occurred.
Does the thermo-tolerant coliform
concentration for water quality
exceed the EQS?
No
No
Yes
Low risk Yes
Does the thermo-tolerant
coliform concentration within
mussel flesh exceed the EQS?
EQS triggered. Report to DEC
and DoH within one working day.
Initiate management response to prevent further exceedances of thermo-tolerant coliforms
in water quality.
Yes
No
Low risk
No
Low risk
Low risk
Yes No
EQG at the SHEZ boundary triggered. Report to DEC and
DoH within one working day.
Yes

Figure B 6 Management response framework in the event of an exceedance of the EQC for algal biotoxins in water and sentinel mussel tissues
Undertake routine water quality monitoring within and at
the boundary of the SHEZ.
Do the concentrations of potentially toxic algae at sites at the boundary of SHEZ exceed the WASQAP trigger concentrations?
Initiate sentinel mussel monitoring along the
boundary of the SHEZ.
Do concentrations of potentially toxic algae at
sites at the boundary of SHEZ exceed the
WASQAP triggers:
Paralytic shellfish poison (0.8 mg
Saxitoxin eq./kg);
Diarrhoetic shellfish poison (0.2 mg/kg);
Neurotoxic shellfish poison (200 mouse
units/kg); and Amnesic shellfish poison (domoic acid; 20
mg/kg).
Investigate cause of exceedance.
Check industries regarding changes to
industrial processes and determine
whether plant upset condition occurred.
No
Yes
Low risk
Yes (to any of the above)
EQS triggered. Report to DEC
and DoH within one working day.
Initiate management response to prevent further exceedances of algal biotoxins in water
quality.
Low risk
No
Low risk
Yes No
EQG at the SHEZ boundary triggered. Report to DEC and DoH within one working day.
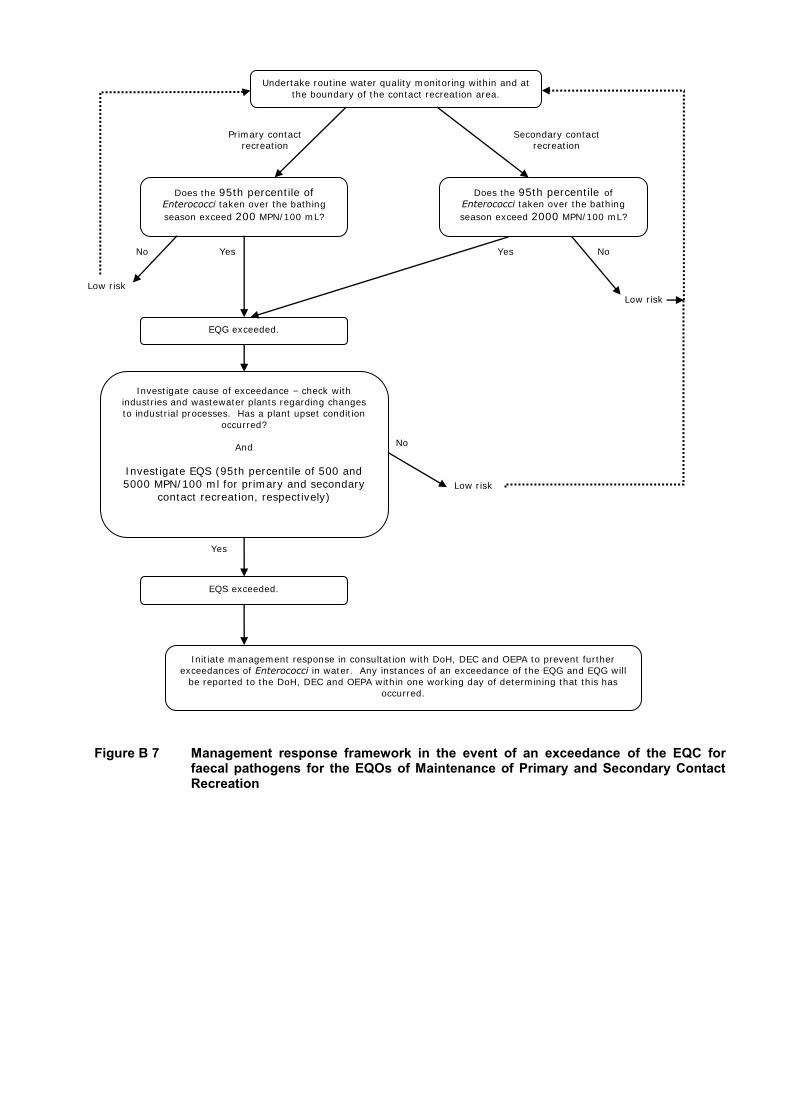
Figure B 7 Management response framework in the event of an exceedance of the EQC for faecal pathogens for the EQOs of Maintenance of Primary and Secondary Contact Recreation
Undertake routine water quality monitoring within and at
the boundary of the contact recreation area.
Does the 95th percentile of Enterococci taken over the bathing
season exceed 200 MPN/100 mL?
Investigate cause of exceedance – check with
industries and wastewater plants regarding changes
to industrial processes. Has a plant upset condition
occurred?
And
Investigate EQS (95th percentile of 500 and 5000 MPN/100 ml for primary and secondary
contact recreation, respectively)
Does the 95th percentile of
Enterococci taken over the bathing
season exceed 2000 MPN/100 mL?
Primary contact recreation
No
No
Yes
Low risk
Low risk
Secondary contact recreation
Yes Yes No
Low risk
Initiate management response in consultation with DoH, DEC and OEPA to prevent further
exceedances of Enterococci in water. Any instances of an exceedance of the EQG and EQG will
be reported to the DoH, DEC and OEPA within one working day of determining that this has
occurred.
EQG exceeded.
EQS exceeded.

Figure B 8 Management response framework in the event of an exceedance of the EQC for algal biotoxins for the EQOs of Maintenance of Primary and Secondary Contact Recreation
Undertake routine water quality monitoring within and at
the boundary of the contact recreation area
Does the median total phytoplankton
cell count for the area of concern
exceed 15000 cells/mL-1?
Proceed assessment against EQS.
Have there been any confirmed incidences (by the
DoH) of skin or eye irritation caused by toxic algae, or of algal poisoning in recreational users?
EQG exceeded.
Does the median total phytoplankton
cell count (either from one sampling
occasion or from a single site over an
agreed period of time) exceed
15000 cells/mL Karenia brevis
and/or have Lyngbya majuscula and/or Pfiesteria present in high
numbers2 outside the post-upgrade
boundary
Primary contact
recreation
No
No
Yes
Low risk
Low risk
Secondary contact
recreation
Yes
No
Low risk
If the EQS is exceeded, Water Corporation will notify the DEC and the OEPA within one
working day of determining that this has occurred. Management actions will be taken to
reduce the concentration to a level where the EQO assigned to the receiving environment is
achieved, and include:
1. An investigation into the conditions prevailing (metocean conditions and plant
operations) during the summer period; and then 2. Development of a management response on advice of the DoH and in consultation with
the OEPA, considering all relevant information collected.
Yes
EQG exceeded. Notify DoH,
DEC and OEPA within one
working day.
Yes
Yes

Appendix C
Approach for determining LEPA boundary dilution


BMT Oceanica Pty Ltd PO Box 462 Wembley WA 6913 Australia Tel: +61 8 6272 0000 Fax: +61 8 6272 0099 ABN 89 093 752 811
www.bmtoceanica.com.au [email protected]
\\oce-per-fs1\projects\WaterCorp\821_SDOOL2009_10\001_ProjectManagement\Reports\SDOOL MMP\Appendices\Appendix
C\appendix on dilution modelling.docm
2 April 2014 2:18 PM 1/2
MEMORANDUM
ATTN: Craig Byers CC: Mark Bailey and Glenn Shiell
ORGANISATION: Water Corporation FROM: Martin Lourey
PROJECT NO: 821 DATE: 31/03/2014
SUBJECT: A modelling approach to determine dilution at the LEPA boundary
Introduction Water Corporation discharges a combination of industrial wastewater and domestic treated
wastewater to the ocean via the Sepia Depression Ocean Outlet Landline (SDOOL). Water
Corporation has a Ministerial commitment (proponent commitment number 1 in Ministerial
Statement 665) to "attain an average dilution of the Sepia Depression Ocean Outlet Landline
(SDOOL) wastewater stream of at least 1:300 with the dilution being above 1:200 at least
99% of the time within 100 meters of the Sepia Depression Ocean Outlet diffuser". Water
Corporation are required to demonstrate compliance with this commitment.
The purpose of this document is to summarise the approach to the dilution calculations
undertaken to date, and the issues with this method which led the development of a new
approach, involving the development of a validated three dimensional hydrodynamic model.
Desktop calculations undertaken to date Monitoring data from two separate data sets (six years of sampling conducted fortnightly
over a period of four months each year as well as 18 consecutive years of annual summer
water quality surveys) was used to generate 146 individual estimates of dilution at or near to
the LEPA boundary. This analysis, while adequate to show that average dilution is above
1:300, was inadequate to unambiguously determine that dilution is above 1:200 99% of the
time. Poor correlation between waste water (quarterly) and field (8 times over summer)
sampling and some internal variability in the wastewater composition create uncertainty and
likely accounts for most of the ambiguous results.
Proposed modelling approach To satisfy the requirements of proponent commitment number 1, Water Corporation will
conduct three dimensional modelling to determine dilution at the LEPA boundary. A three
dimensional hydrodynamic model will be developed to determine dilution 100 m from the
Sepia Depression outlet. To produce a conservative estimate of minimum dilution, only worst
case conditions (summer and autumn) will be modelled. Periods where dilution is high
(winter) will not be considered. The result will be a highly conservative estimate of 1st
percentile dilutions at the LEPA boundary.
Oceanica notes that the OEPA require modelling to be calibrated using met-ocean data and
validated against the results of the monitoring. For calibration purposes, an ADCP (or
equivalent) deployment will be conducted in around 20 m of water in the Sepia Depression.
Three instruments will be deployed for a 60 day period during the low energy autumn period
(April–May). The model would be calibrated against the collected current meter data but
validated against solute fields from the plume monitoring data collected in situ during the
summer field campaigns described above. While the validation sampling is occurring during
December–March (rather than the low energy autumn period) the sampling will be conducted
to capture in low energy conditions.
Issues to be address by modelling The modelling will serve two separate purposes:

\\oce-per-fs1\projects\WaterCorp\821_SDOOL2009_10\001_ProjectManagement\Reports\SDOOL MMP\Appendices\Appendix
C\appendix on dilution modelling.docm
2 April 2014 2:18 PM 2/2
1. provide evidence that Water Corporation meets proponent commitment number 1 in
Ministerial Statement 665
2. provide a conservative estimate of minimum dilution at the LEPA boundary that will be
used to correct contaminant concentrations measured during quarterly and annual
wastewater characterisation surveys.
The current meter deployment will be conducted in autumn (April–May) to ensure validation
and modelling coincide with worst case conditions. Model validation will be ongoing using
compliance monitoring data.

Appendix D
WET Testing Sensitivity


BMT Oceanica Pty Ltd PO Box 462 Wembley WA 6913 Australia Tel: +61 8 6272 0000 Fax: +61 8 6272 0099 ABN 89 093 752 811
www.bmtoceanica.com.au [email protected]
\\oce-per-fs1\projects\WaterCorp\821_SDOOL2009_10\001_ProjectManagement\Reports\SDOOL MMP\Appendices\Appendix
D\WET_test_review_rev0.docm
2 April 2014 2:17 PM 1/3
MEMORANDUM
ATTN: Craig Byers CC: G Shiell and M Bailey
ORGANISATION: Water Corporation FROM: Martin Lourey
PROJECT NO: 821 DATE: 31/4/2013
SUBJECT: Selection of species for WET testing
The sea urchin sperm/fertilization bioassay provides a rapid assessment of toxicity in aqueous
samples. The test is conducted worldwide using a variety of species of urchin. It is most
commonly used in North America where it is an important component of effluent discharge
licensing based on methods in the USEPA’s Short-Term Methods for Estimating the Chronic
Toxicity of Effluents and Receiving Waters to West Coast Marine and Estuarine Organisms
(EPA/600/R-95/136). In Australia, gametes of the sea urchin Heliocidaris tuberculata has also
become widely used in toxicity assessment programs.
Sea urchin sperm are exposed to the sample, and the ability of the sperm to fertilize the egg
is evaluated. The short duration of the test (1-hour) and easily identifiable endpoint make the
test ideal for rapid turn around and reporting (McGibbon and Moldan 1986). The test turn-
around time is approximately 3 days making it a rapid and useful early warning indicator.
The rate of fertilisation in urchins is a sensitive indicator of effluent toxicity that is of
comparable (or greater sensitivity) to other marine test species and life stages (McGibbon
and Moldan 1986; Dinnel et al., 1989). The test has frequently been validated for use on
treated wastewater samples (Woodworth et al., 1999; Dinnel and Stober 1987). Sydney
Water, responsible for treatment and disposal of domestic wastewater in Sydney and
surrounds conducted an extensive study on WET testing and found the sea urchin fertilisation
test to be the most sensitive to wastewater. The test has therefore been incorporated into
their routine monitoring procedure at a number of plants (Woodworth et al. 1999).
The sea urchin fertilisation test is particularly sensitive to metal contamination (Dinnel et al.
1989) a major source of potential toxicity in Western Australian treated wastewater.
Comparisons of sensitivity to surfactants between ecotoxicity tests not been conducted,
presumably due to the large number of different surfactant compounds available. Urchin
ecotoxicity tests in general appear to be sensitive to surfactants (Bellas et al. 2005) and a
comparative investigation of the sensitivity of various urchin stages to a range of chemicals
suggests sperm viability/fertilisation is more sensitive to contaminants (including ABS
surfactants) than later stages (Kobayashi 1980). The general sensitivity of urchins to
surfactants and particular sensitivity of fertilisation to contaminants generally give some
confidence that the 1-hour test is likely to be of equal or greater sensitivity to other tests.
In WA, comprehensive WET testing assessments have been made at Beenyup (March 2004),
Subiaco (March 2004), Alkimos (May 2011) and the SDOOL (March 2004, November2004,
August 2006, September 2009 and March 2010). The most sensitive test varied depending
on when the test was conducted and the TWW analysed. Although not all tests were
conducted at each time the, the 1 hour urchin fertilisation test was the most (or equal most)
sensitive test on the most occasions (5/8) (Table 1). The results of the 1-hour urchin test
were also most consistent through time (SDOOL NOECS all 10 or 12.5%) (Table 1). Because
of this general sensitivity, constancy, rapid delivery of results and wider use with TWW the 1-
hour urchin test is considered an appropriate early warning indicator of toxicity for Perth
wastewaters.

\\oce-per-fs1\projects\WaterCorp\821_SDOOL2009_10\001_ProjectManagement\Reports\SDOOL MMP\Appendices\Appendix
D\WET_test_review_rev0.docm
2 April 2014 2:17 PM 2/3
References Bellas J, Beiras R, Marino-Balsa JC, Fernandez N (2005) Toxicity of organic compounds to
marine invertebrate embryos and larvae: a comparison between the sea urchin
embryogenesis bioassay and alternative test species. Ecotoxicology 14:337–353
Dinnel PA, Link JM, Stober QJ, Letourneau MW, Roberts WE (1989) Comparative sensitivity of
sea urchin sperm bioassays to metals and pesticides. Archives of Environmental
Contamination and Toxicology 18:748–755
Dinnel PA, Stober QJ (1987) Application of the sea urchin sperm bioassay to sewage
treatment efficiency and toxicity in marine waters. Marine Environmental Research
21:121–133
Kobayashi N (1980) Comparative sensitivity of various developmental stages of sea urchins
to some chemicals. Marine Biology 58:163–171
McGibbon S, Moldan AGS (1986) Routine toxicity testing of toxicants using a sea urchin
gamete bioassay. Marine Pollution Bulletin 17: 68–72
Woodworth JG, King C, Miskiewicz AG, Laginestra E, Simon J (1999) Assessment of the
Comparative Toxicity of Sewage Effluent from 10 Sewage Treatment Plants in the Area
of Sydney, Australia using an Amphipod and Two Sea Urchin Bioassays. Marine
Pollution Bulletin 39:1–12, January, Pages 174-178

\\oce-per-fs1\projects\WaterCorp\821_SDOOL2009_10\001_ProjectManagement\Reports\SDOOL MMP\Appendices\Appendix D\WET_test_review_rev0.docm
2 April 2014 2:17 PM 3/3
Table 1 Results of the historical full suite WET testing
TWW Date Microtox1 Algae2
Macro-algae3
Copepod4 Amphipod5 Fish ()6 Fish (imbal)7
Urchin (fert.)8
Urchin (devel.)9
Scallop10 Mussel11
Beenyup TWW
March 2004 11 100 100 30 30
Sunbiaco
TWW March 2004 25 10 10
SDOLL prior to KWRP
March 2004 33 100 10 10 10
SDOOL KWRP
March 2004 33 30 10 10 3
SDOOL Nov 2004 <5.6 <2.5 2.5 3.125 12.5 6.25
SDOOL August2006 25 <2.6 2.7 12.5 25 5.2
SDOOL September 2009
50 50 25 12.5 50 25 12.5
SDOOL March 201012
12.5 12.5 6.3 12.5 25 12.5
Alkimos May 2011 100 100 100 25 50 50
Notes: 1. 15 min microtox (Vibrio fischeri) test 2. 72 hr Nitzschia sp. Algal growth test 3. 72 hr macroalgae (Ecklonia radiata) germination test 4. 10 day copepod (Gladioferens imparipes) reproduction test
5. 96 hr juvenile amphipod (Allorchestes compressa) acute toxicity test 6. 7 day larval fish (Pagrus auratus) growth test 7. 48 Hr larval fish (Argyrosomus japonicus) imbalance test 8. 1 hr sea urchin (Heliocidaris tuberculata) fertilisation test 9. 72 hr sea urchin (Heliocidaris tuberculata) larval development test 10. 48 hr doughboy scallop (Mimachlamys asperrima) larval development test 11. 48 hr mussel (Mytilus galloprovincialis) larval development test 12. Sample collected during balancing dam flushing


Appendix E
Contaminants in Treated Wastewater


Appendix E Composition of secondary TWW relevant to recreational guidelines
Parameter Recreational guideline
Maximum value in secondary TWW After 1:200 dilutions
Antimony 60 0.81 Arsenic 140 Below LoR Barium 14 000 140 Boron 6 000 400 Bromate 400 Not detected Cadmium 40 Below LoR Chlorine (total residual) 100 000 300 (Wood Pt mean)
Chlorine dioxide 20 000 - Chlorite 6 000 390 Chromium 1 000 4 Copper 40 000 20 Cyanide 1 600 Not detected Fluoride 30 000 880 (Wood Pt mean) Iodide 2000 10 000 50 Lead 200 2.5 Manganese 10 000 40 Mercury 20 Below LoR Molybdenum 1 000 5 Monochloramine 60 000 290 (Wood Pt (mean) Nickel 400 6 Nitrate (as nitrate) 1000 000 4 400(Wood Pt mean) Nitrite (as nitrite) 60 000 200 (Wood Pt mean) Selenium 200 Below LoR Silver 2 000 Below LoR Sulfate 10 000 000 63 000 Organic Chemicals Acrylamide 4 - Benzene 20 0.11 Benzo(a)pyrene 0.2 0.024 Carbon tetrachloride 60 Not detected Chloroacetic acid 3 000 15 Chlorobenzene 6 000 Not detected 1,2-Dichlorobenzene 30 000 3 1,4-Dichlorobenzene 800 0.12 Cyanogen chloride (as cyanide) 1 600 -
Dichloroacetic acid 2 000 2 Trichloroacetic acid 2 000 3 1,1-Dichloroethene 600 0.21 1,2-Dichloroethene 1 200 Not detected 1,2-Dichloroethane 60 0.06 Dichloromethane 80 16 Epichlorohydrin 10 -

Parameter Recreational guideline
Maximum value in secondary TWW After 1:200 dilutions
Ethylbenzene 6 000 Not detected Ethylenediamine tetraacetic acid (EDTA)
5 000 185
Formaldehyde 10 000 - Hexachlorobutadiene 14 Not detected Nitrilotriacetic acid 4 000 4 Tetrachloroethene 1 000 32 Trichloroacetaldehyde (chloral hydrate) 400 0.12
Trihalomethanes (THMs) (total) 5 000 -
2-Chlorophenol 6 000 Not detected 2,4-Dichlorophenol 4 000 0.2 2,4,6-Trichlorophenol 400 0.12 Tributyltin oxide 20 - Di(2-ethylhexyl) phthalate 200 -
Styrene (vinylbenzene) 600 0.33
Toluene 16 000 0.24 Trichlorobenzenes (total) 600 Not detected
Vinyl chloride 6 Not detected Xylene 12 000 0.06 Pesticides Acephate 200 Not detected Aldicarb 20 Not detected Aldrin (and Dieldrin) 6 Not detected Ametryn 1 000 Not detected Amitrole 200 Not detected Atrazine 400 144 Azinphos-methyl 60 Not detected Benomyl 2 000 - Bentazone 600 Not detected Bioresmethrin 2 000 Not detected Bromazil 6 000 Not detected Bromophos-ethyl 200 Not detected Bromoxynil 600 - Carbaryl 600 Not detected Carbendazim 2 000 Not detected Carbofuran 200 Not detected Carbophenothion 10 Not detected Carboxin 6 000 Not detected Chlordane 20 Not detected Chlorphenvinphos 100 - Chlorothalonil 600 Not detected Chloroxuron 200 -

Parameter Recreational guideline
Maximum value in secondary TWW After 1:200 dilutions
Chlorfenvinphos 200 Not detected Chlorsulfuron 2 000 Not detected Clopyralid 20 000 Not detected 2,4-D 600 5400 27 DDT 400 Not detected Diazinon 60 Not detected Dicamba 2 000 Not detected Dichlobenil 200 Not detected Dichlorvos 20 Not detected Diclofop-methyl 100 Not detected Dicofol 60 Not detected Dieldrin (see Aldrin) 6 Not detected Difenzoquat 2 000 - Dimethoate 1 000 Not detected Diphenamid 6 000 Not detected Diquat 100 - Disulfoton 60 Not detected Diuron 600 Not detected DPA (2, 2-DPA) 10 000 - EDB 20 Not detected Endosulfan 600 Not detected Endothal 2 000 Not detected EPTC 600 Not detected Ethion 60 Not detected Ethoprophos 20 Not detected Etridiazole 2 000 - Fenamiphos 6 Not detected Fenarimol 600 Not detected Fenchlorphos 600 Not detected Fenitrothion 200 Not detected Fenoprop 200 Not detected Fensulphothion 200 Not detected Fenvalerate 1 000 Not detected Flamprop-methyl 60 Not detected Fluometuron 1 000 Not detected Formothion 1 000 Not detected Fosamine 600 - Glyphosate 20 000 - Heptachlor (including its epoxide) 6 Not detected
Hexaflurate 600 - Hexazinone 6000 Not detected Lindane 400 Not detected Maldison 1 000 Not detected Methidathion 600 Not detected Methiocarb 100 Not detected Methomyl 600 Not detected

Parameter Recreational guideline
Maximum value in secondary TWW After 1:200 dilutions
Methoxychlor 6 000 Not detected Metolachlor 6 000 1500 Metribuzin 1000 Not detected Metsulfuron-methyl 600 Not detected Mevinphos 100 Not detected Molinate 100 Not detected Monocrotophos 20 - Napropamide 20 000 Not detected Nitralin 10 000 - Norflurazon 1 000 Not detected Oryzalin 6 000 Not detected Oxamyl 2 000 - Paraquat 600 - Parathion 200 Not detected Parathion-methyl 2 000 Not detected Pebulate 600 Not detected Pendimethalin 6 000 Not detected Pentachlorophenol 200 Not detected Permethrin 2 000 Not detected Picloram 6 000 Not detected Piperonyl butoxide 2 000 0.62 Pirimicarb 100 Not detected Pirimiphos-ethyl 10 Not detected Pirimiphos-methyl 1 000 Not detected Profenofos 6 Not detected Promecarb 600 Not detected Propachlor 1 000 Not detected Propanil 10 000 Not detected Propargite 1 000 Not detected Propazine 1 000 Not detected Propiconazole 2 000 440 Propyzamide 6 000 Not detected Pyrazophos 600 Not detected Quintozene 600 Not detected Simazine 400 144 Sulprofos 200 Not detected 2,4,5-T 2 000 Not detected Temephos 6 000 Not detected Terbacil 600 Not detected Terbufos 10 Not detected Terbutryn 6 000 Not detected Tetrachlorvinphos 2 000 Not detected Thiobencarb 600 - Thiometon 60 Not detected Thiophanate 100 Not detected Thiram 60 - Triadimefon 40 Not detected

Parameter Recreational guideline
Maximum value in secondary TWW After 1:200 dilutions
Trichlorofon 100 Not detected Triclopyr 200 5 Trifluralin 1 000 1 200 6 Vernolate 600 Not detected


Appendix F
Comprehensive Annual Summer Water Quality Survey


Comprehensive annual summer water quality survey The operation of each of the WWTPs in Perth’s metropolitan region and the discharge of
treated wastewater to the marine environment is conducted under licence conditions set by
the DEC (Appendix A). The licence conditions include a requirement to undertake annual
summer surveys of ocean water to examine the effects of discharged treated wastewater on
the marine environment and will include the water quality parameters listed in Table C 1.
Table C 1 Parameters to be sampled during comprehensive annual summer water quality surveys
Nutrients Primary Productivity Microbiological indicators
Total phosphorus
Ortho-phosphate
Total nitrogen
Ammonium nitrogen
Nitrate + nitrite nitrogen
Chlorophyll-a
Phaeophytin
E. coli
Enterococci
Objectives With respect to the SDOOL, the purpose of the comprehensive annual summer water quality
surveys is to:
provide appropriate data on water quality in the vicinity of the SDOOL ocean outlet to
ensure compliance with the licence conditions
assess the performance of the SDOOL ocean outlet by determining the dilution and
dispersion characteristics of the treated wastewater
examine the extent of influence of the wastewater plume
allow for the ongoing assessment of the environmental impact of the wastewater
discharge in relation to the marine water quality and beneficial uses of the area
provide for ongoing assessment of the level of public health risk associated with ocean
disposal of treated wastewater.
Timing Offshore water samples will be collected annually at the commencement of summer, from
surface and bottom waters at 35 offshore sites located within a rectangular sampling grid
(Figure F 1). The monitoring requirements for each parameter are described below.
Sampling regime Wind, wave & tide conditions Information on the prevailing wind conditions (wind speed and direction) at Sepia Depression
immediately prior to and over the duration of each summer water quality survey will be
provided by the Bureau of Meteorology.
Information on the significant wave height and wave period will be provided by the
Department of Transport (DoT) from a wave rider buoy located south-west of Rottnest Island
in a water depth of 48 m. Attenuation of the wave energy, due to refraction and diffraction
processes around the offshore reefs, will cause the wave height near the outlet to be
considerably lower than that observed offshore of Rottnest Island. Water surface elevations
will provided by the DoT from a gauge in Fremantle Fishing Boat Harbour.
This information will be used to characterise the prevailing wind, wave and tide conditions at
Sepia Depression immediately prior to the summer water quality surveys. The prevailing flow
conditions will determine which sampling grid will be used for each summer water quality
survey (eg. Figure F 1; DAL 2001).

Surface drogue movement At the commencement of the summer water quality survey at each outlet, a surface drogue
will be released over the centre of the operational outlet diffuser. The location of the drogue
will be recorded at intervals throughout the summer water quality survey using an on-board
global positioning system (GPS). Surface drogue tracking will provide an estimate of mean
surface currents and this information will be used in the initial dilution modelling
(Section 5.3.7).
Water quality sampling Offshore water samples will be collected from 35 sites located within a rectangular sampling
grid appropriate for the prevailing flow conditions at the SDOOL ocean outlet on the day of
the survey (Figure F 1; DAL 2001). In addition, nine shoreline sites located along the coast
adjacent to each of the ocean outlets will be sampled.
At each offshore site, water samples will be collected from the surface (1 m depth) and the
bottom (approximately 2 m above the seafloor) of the water column. Samples will be
collected using two electric bilge pumps (one for the surface and one for the bottom
samples). Samples are to be obtained in sequence against the prevailing current flow (e.g.
during a northerly current flow, samples will be obtained from north to south), to minimise
the likelihood of re-sampling the same water mass. Shoreline samples are to be obtained by
filling the sample containers directly in waist-deep water.
Nutrient and primary production analyses are to be undertaken by a NATA-accredited
laboratory, using the analytical methods detailed in Table C 2.
Table C 2 Analytical methods and reporting limits for each of the water quality parameters to be measured during the comprehensive annual summer water quality surveys
Parameter Analytical method(1) Reporting limit Unit
Nutrients
Total Phosphorus Lachat-Automated Flow
Injection Analyser (4700) 5(2) µg P L-1
Ortho-phosphate Lachat-Automated Flow
Injection Analyser (4100) 2(2) µg P L-1
Total Nitrogen Lachat-Automated Flow
Injection Analyser (2700) 50(2) µg N L-1
Ammonium Lachat-Automated Flow
Injection Analyser (2000) 3(2) µg N L-1
Nitrate + Nitrite Lachat-Automated Flow
Injection Analyser (2100) 2(2) µg N L-1
Primary production
Chlorophyll a Fluorometric 0.01(3) µg L-1
Chlorophyll a Acetone extraction (3000) 0.1(2) µg L-1
Phaeophytin Acetone extraction (3000) 0.1(2) µg L-1
Microbiological indicators
Thermo-tolerant
coliforms Membrane filtration
Dilution
dependent(4) CFU/100 mL
Faecal streptococci (as
Enterococci) Membrane filtration
Dilution
dependent(4) MPN/100 mL
Notes: 1. Numbers in brackets refers to analysis method number at the Marine and Freshwater Research Laboratory. 2. Method reporting limit determine from 3.2 x standard deviation of ten standard samples. 3. Instrument reporting limit. 4. The upper and lower assay limits for thermo-tolerant coliforms and faecal streptococci are dependent on the
dilution of the original sample.

Replicate samples During each survey, three replicate samples will be obtained from a single offshore site in the
sampling grid. The samples will be analysed to identify variability in the measured water
quality parameters that may be introduced by small-scale spatial variability.
Water column structure A multi-parameter water quality sensor will be lowered through the water column at 7 or 8 of
the offshore sites in the sampling grid to provide information on the physical structure of the
water column, i.e. vertical profiles of temperature, salinity and density. The sites will be
located along a north-south transect through the middle of the sampling grid, with additional
sites measured around the diffuser.

Figure F 1 Sampling grid for comprehensive annual summer water quality surveys

Appendix G
Summary of public consultation process


KW
INA
NA
WA
TE
R R
EC
LA
MA
TIO
N P
LA
NT
PE
R
70
Ta
ble
7-1
K
win
an
a W
ate
r R
ecla
ma
tio
n P
lan
t –
Su
mm
ary o
f C
om
mu
nit
y C
on
su
lta
tio
n s
ince D
ecem
ber 2
000
Au
die
nc
e (
gro
up
s c
on
su
lte
d)
Ch
an
ne
ls
Wh
en
C
om
me
nts
/ I
ss
ue
s
Kw
ina
na
In
dustr
ies
•
Fa
ce
-to
-face
•
Me
etin
gs
•
Pre
se
nta
tio
ns
•
Info
rma
tio
n s
he
ets
On
go
ing
(De
c 2
00
0 to
p
resen
t)
Co
mp
reh
ensiv
e c
om
mu
nic
ation
th
roug
hou
t w
ith
KW
RP
in
dustr
y p
art
ne
rs.
Kw
ina
na
In
dustr
y C
ou
ncil
me
mb
ers
an
d s
taff
•
Me
etin
g p
rog
ress r
epo
rts
•
Fa
ct
Sh
ee
t
On
go
ing
(De
c 2
00
0 to
p
resen
t)
Bro
ad
co
mm
unic
ation
with
oth
er
indu
str
ies
thro
ugh
KIC
exe
cu
tive
an
d m
on
thly
C
om
mun
ity R
ela
tion
s A
dvis
ory
Co
mm
itte
e
me
etin
gs.
Co
mm
un
ity G
rou
ps
3.1
Com
mun
itie
s a
nd
In
dustr
ies
Fo
rum
•
Pu
blic
me
etin
g
•
Me
etin
g m
inu
tes
De
ce
mb
er
20
00
P
ositiv
e r
eaction
to
th
e p
ropo
sa
l.
Qu
estio
ns r
ais
ed
co
nce
rnin
g s
alt c
on
ten
t o
n r
eve
rse
osm
osis
pro
cess a
nd
wh
y t
he
w
ate
r h
as t
o b
e d
isp
ose
d in
to th
e S
epia
D
ep
ressio
n a
fte
r use
. ie
. W
hy c
an’t t
he
w
ate
r b
e c
on
tinu
ally
re
cycle
d.
3.2
Rockin
gh
am
IP
14
Com
mun
ity
Co
nsulta
tive
Ne
two
rk
•
Pre
se
nta
tio
n
•
Pe
rso
na
l b
rie
fin
gs t
o
me
mb
ers
De
ce
mb
er
20
00
3.3
Wood
ma
n P
oin
t (W
A2
1)
Co
mm
un
ity R
efe
rence
Gro
up
•
Pre
se
nta
tio
n
De
ce
mb
er
20
00
3.4
Cockbu
rn S
ou
nd
C
on
se
rva
tio
n C
om
mitte
e
•
Pre
se
nta
tio
n
De
ce
mb
er
20
00
Ove
rall
Co
mm
unity
•
Me
dia
re
lease
s
•
Ad
ve
rtis
ing
•
Ma
rke
t re
se
arc
h
De
ce
mb
er
20
00
Ja
nua
ry 2
00
2
Ma
y 2
00
2
Se
pte
mb
er
20
02
De
ce
mb
er
20
02
An
no
uncin
g p
rop
osa
l
KIC
de
cla
res s
up
po
rt f
or
the
pro
po
sa
l
An
no
uncem
en
t th
at th
e p
roje
ct w
ou
ld s
oon
co
mm
ence
No
tice o
f p
rop
osa
l to
co
nstr
uct th
e p
lan
t.
Qu
estio
ns o
n K
WR
P w
ere
in
co
rpo
rate
d in
th
e K
IC’s
200
0 C
om
mu
nity A
ttitu
des

KW
INA
NA
WA
TE
R R
EC
LA
MA
TIO
N P
LA
NT
PE
R
71
Au
die
nc
e (
gro
up
s c
on
su
lte
d)
Ch
an
ne
ls
Wh
en
C
om
me
nts
/ I
ss
ue
s
su
rve
y,
co
nd
ucte
d im
me
dia
tely
aft
er
the
an
no
un
cem
en
t o
f th
e p
roje
ct. A
wa
ren
ess
wa
s g
oo
d a
nd
th
e r
esu
lts in
dic
ate
d
ove
rwh
elm
ing
su
pp
ort
fo
r th
e p
roje
ct.
Go
ve
rnm
en
t a
gen
cie
s
Se
pte
mb
er
20
02
N
otice o
f p
rop
osa
l to
co
nstr
uct th
e p
lan
t.
5.1
Cockbu
rn S
ou
nd
M
an
ag
em
en
t C
ou
ncil
De
ce
mb
er
20
00
5.2
De
pt o
f E
nviro
nm
en
t
5.3
En
vir
on
men
tal P
rote
ctio
n
Au
tho
rity
5.4
Wate
r an
d R
ive
rs
Co
mm
issio
n
•
Dir
ect m
ail
•
Pre
se
nta
tio
ns
Me
mb
ers
of
Pa
rlia
men
t •
Dir
ect m
ail
/ e
•
Sta
ke
ho
lde
r M
gt
me
etin
gs
On
go
ing
N
ote
: C
onsultation a
lso o
ccurr
ed p
rior
to D
ecem
ber
2000,
befo
re s
taff c
hanges w
ithin
the W
ate
r C
orp
ora
tion.

Appendix H
Terms of Reference of the public consultation Stakeholder Liaison Group


Sepia Depression Ocean Outlet Landline – Stakeholder Liaison Group – terms of reference
SDOOL Stakeholder Liaison Group Terms of Reference
Use of Sepia Depression Ocean Outlet Landline to Discharge Treated
Wastewater and Industrial Effluents to Sepia Depression Context The Water Corporation is committed and bound by a Ministerial Condition (Statement No. 665), to ensure that the public has open access to information regarding the environmental performance of the Sepia Depression Ocean Outlet Landline (SDOOL) and has an avenue to address any significant issues arising. The formation of a Stakeholder Liaison Group (SLG) is a vital part of this process. Purpose The SLG will assist the Water Corporation in managing concerns regarding the discharging of treated wastewater and industrial effluents to the Sepia Depression, its environmental performance and the processes for identifying and reviewing possible future industry participant access to SDOOL. Specifically the SLG will;
Formulate the frequency and means of providing information to the broader community on the operation and performance of SDOOL,
Review annual reports and data on the SDOOL environmental performance and monitoring programs and provide feedback to the Water Corporation and regulators,
Provide a forum to review and comment on the results of the Perth Long Term Ocean Outlet Monitoring (PLOOM) program with particular reference to the Sepia Depression,
Review the complaints/response record of actions taken to address matters arising from the discharge of industrial effluent to Sepia Depression; and
Provide feedback on possible future Kwinana industry participation prior to any referral under Section 38 of the Environmental Protection Act 1986.
Working Principles
The SLG will meet at least six monthly unless otherwise agreed. Meetings will generally be outside normal working hours. Ad hoc meetings will be convened based on demand to review and resolve public complaints and provide a review process to address matters arising from the project from time to time.
The SLG will consist of up to 15 members (independent chair and
representatives from the Kwinana User Group, Water Corporation, Department of Environment and Conservation, City of Rockingham, Town of Kwinana, City of Cockburn, Kwinana Industries Council, environmental groups and members of the community).

Sepia Depression Ocean Outlet Landline – Stakeholder Liaison Group – terms of reference
Membership of the SLG will nominally be for a period of two years. This term will be flexible where ongoing projects will benefit from continuity of involvement. Terms can be extended with agreement from the SLG.
Meetings will be chaired by an independent chairperson appointed by the
SLG. A member from the Water Corporation will act as the Executive Officer for SLG meetings, taking minutes, distributing agendas, providing information and arranging venues. Minutes will be circulated for electronic endorsement by participants as soon as practicable following the meeting and will be posted on the website following endorsement.
SLG members will be provided with balanced and objective information to
communicate to the organisations they are representing. SLG members are expected to also provide balanced and objective information as required for the SLG.
SLG members will keep their respective organisations up to date with SDOOL
issues via the receipt and distribution of information from the Water Corporation and / or the SLG.
SLG members will be promptly notified, by email in the first instance, of any
unusual occurrence with respect to the performance of the SDOOL.
In the event that the SLG cannot achieve consensus, the full range of views will be reported.
Clear and transparent records are to be kept at the SLG meetings which
describe in detail how the resolutions have been made. Specialist expertise will be seconded into the group as required. Matters can
be referred to specialist areas for additional advice as necessary. SLG meetings are open to the public for attendance as observers. Members of
the public attending meetings in this capacity may raise issues through members of the SLG.
Agenda items to be circulated to SLG members at least 7 working days prior
to the meeting. SLG members to fully disclose to the group any potential conflicts of interest.
Comments made by any group member on behalf of the SLG may only be
made after a formal resolution by the group has been made. Comments representing separate interests must be stated as to that fact.
A quorum of at least 3 members in addition to Water Corporation members
and Chairman, must be present for a resolution to be passed by the group.
Proxies may be used to attend meetings in member’s absence.


BMT Oceanica Pty Ltd PO Box 462, Wembley,
WA 6913, Australia Tel: +61 8 6272 0000
Fax: +61 8 6272 0099 [email protected]
www.bmtoceanica.com.au