monitoring of fetal heart rate and uterine activity
TRANSCRIPT

Margo Graatsma
Monitoring of
fetal heart rate
and uterine activity
Graatsma_PROEF (all).ps Front - 1 T1 - Black CyanMagentaYellow

Monitoring of fetal heart rate and uterine activity
ISBN: 978-90-5335-334-9
Author: Margo Graatsma
Cover design: Ridderprint BV
Lay out: Stephan Lutke Holzik
Printed by: Ridderprint BV
The author gratefully acknowledges financial support for printing of this thesis by:
BMA BV (Mosos), Ferring BV, Nordic Pharma BV, Novo Nordisk BV, Medical Dynamics BV,
Mediq Direct Diabetes BV.
The author would like to thank Monica Healthcare Ltd (Nottingham, UK) for the provision
of the fECG/EHG holter systems and support during the studies described in this thesis.
The studies were partly supported financially by an unconditional grant from Monica
Healthcare Ltd.
© E. M. Graatsma, Amsterdam, 2010
All rights reserved. Save exceptions stated by the law, no part of this publication may be
stored in a retrieval system of any nature, or transmitted in any form or by any means,
electronic, mechanical, photocopying, recording or otherwise, included a complete or
partial transcription, without the prior written permission of the publishers, application
for which should be addressed to the author.
Graatsma_PROEF (all).ps Back - 1 T1 - Black CyanMagentaYellow
Monitoring of fetal heart rate
and uterine activity
Registreren van foetale hartfrequentie en
weeënactiviteit (met een samenvatting in het Nederlands)
Proefschrift
ter verkrijging van de graad van doctor aan de Universiteit Utrecht
op gezag van de rector magnificus, prof.dr. J.C. Stoof,
ingevolge het besluit van het college voor promoties
in het openbaar te verdedigen op
donderdag 18 november 2010
des middags te 4.15 uur
door
Elisabeth Margo Graatsma
geboren op 16 april 1979 te Gouda
Graatsma_PROEF (all).ps Front - 2 T1 - Black CyanMagentaYellow

Promotor Prof. dr. G.H.A. Visser
Co-promotoren Dr. E.J.H. Mulder
Dr. Ir. B.C. Jacod
Graatsma_PROEF (all).ps Back - 2 T1 - Black CyanMagentaYellow

Content
Chapter 1 Introduction 7
Part I. Monitoring of the fetal condition using fetal electrocardiography
Chapter 2 Fetal electrocardiography: feasibility of long term fetal heart rate
recordings
19
Chapter 3 Maternal Body Mass Index does not affect performance of fetal
electrocardiography
29
Chapter 4 Average acceleration and deceleration capacity of fetal heart rate
in normal pregnancy and in pregnancies complicated by
intrauterine growth restriction
39
Chapter 5 Glycaemic control throughout pregnancy in women with type 1
diabetes
55
Chapter 6 Continuous simultaneous monitoring of maternal glucose and
fetal heart rate in diabetic pregnancy
65
Part II. Monitoring uterine contractions using electrohysterography
Chapter 7 A validation of electrohysterography for uterine activity
monitoring during labour
79
Chapter 8 Towards the understanding of labour arrest using non-invasive
electrohysterography
93
Chapter 9 Summary & general discussion 107
Addendum Nederlandse samenvatting 119
List of co-authors
List of publications
Dankwoord
Curriculum Vitae
Graatsma_PROEF (all).ps Front - 3 T1 - Black CyanMagentaYellow

Graatsma_PROEF (all).ps Back - 3 T1 - Black CyanMagentaYellow

Chapter 1: Introduction 7
Chapter 1
Introduction
Graatsma_PROEF (all).ps Front - 4 T1 - Black CyanMagentaYellow

8 Monitoring of fetal heart rate and uterine activity
Graatsma_PROEF (all).ps Back - 4 T1 - Black CyanMagentaYellow

Chapter 1: Introduction 9
Introduction
While most pregnancies have an uncomplicated character and result in healthy newborns,
changes in demographics (rising maternal age and pre-pregnancy weight) and
environment (food intake, intoxications) account for a growing number of complicated
pregnancies. Frequent complications are hypertensive disorders, (with accompanying)
intra uterine growth restriction, obesity, (pre-) gestational diabetes, and chromosomal
and/or congenital abnormalities. For timely recognition of complications in these
pregnancies, monitoring of the maternal and fetal condition during pregnancy and labour
have become of increasing importance.
Throughout pregnancy the fetal condition can be assessed with a variety of tests, mainly
based on the ultrasound technique. Ultrasonography for measurement of fetal biometry;
real-time ultrasonography for observations of fetal movements and behavior1-4
; Doppler
velocity waveforms for measurements of the resistance to flow of uterine, placental and
fetal arterial and venous circulation5,6
; and Doppler cardiotocography (CTG) for
assessment of fetal heart rate (FHR) and its variation7. In order to achieve optimal
outcome of labour in complicated pregnancies, both the fetal condition and maternal
uterine activity are assessed by FHR monitoring and external tocography or intauterine
pressure recording, respectively.
Although FHR monitoring during pregnancy and monitoring of uterine activity during
labour are known to have limitations8-11
, their use is widely adopted. An alternative
technique for monitoring of FHR as well as uterine activity is the measurement of the
electromyography (EMG) as recorded from the maternal abdomen. This EMG-technique
has been studied in the past, but was hampered due to technical difficulties8,12-14
.
Improvements in technology, an increasing desire for a true non-invasive technique, and
awareness of the limitations of the traditional monitoring techniques for uterine activity
and FHR have led to the renewed interest in EMG measurements for fetal and uterine
monitoring. The recorder used for FHR - and uterine activity-monitoring in this thesis is
displayed in Figure 1.
Part I of this thesis will outline the validation of FHR monitoring using the fetal ECG (fECG)
signal. Furthermore, the use of the fECG-technique in pregnancies complicated with intra
uterine growth restriction and (pre)gestational diabetes will be described. Part II will focus
both on the validation and the potential clinical benefits of contraction monitoring using
uterine EMG during labour.
Graatsma_PROEF (all).ps Front - 5 T1 - Black CyanMagentaYellow

10 Monitoring of fetal heart rate and uterine activity
Figure 1: AN24 - fetal ECG and uterine contraction monitor. (Monica Healthcare, Nottingham, UK)
PART I
Monitoring of the fetal condition using fetal electrocardiography
Antepartum fetal surveillance constitutes an essential component of the standards of care
in managing high risk pregnancies. Ultrasound examination (growth, amniotic fluid index
and Doppler flow velocimetry) and FHR monitoring are the most commonly used
antepartum fetal surveillance tests. In current obstetrical practice, both techniques are
used for short durations at regular intervals, although long-term monitoring could help to
improve clinical management in some cases. To date, this is only possible using ultrasound
based cardiotocography (CTG)15
. However, its use for a prolonged period both in the
hospital and in the home-environment remains cumbersome due to discomfort and poor
signal quality in prolonged recordings8. Moreover, it exposes the fetus to prolonged
ultrasound insonation16
. An alternative is the continuous monitoring of fetal heart rate
through the measurement of the electrical signal of the fetal heart (fetal ECG; fECG).
Originally hampered by technical difficulties8, the method now seems ready for clinical
use.
In obese women fetal monitoring is difficult because the body fat layer interferes with all
traditional surveillance modalities. Ultrasound is attenuated, thereby hampering simple
biometry, CTG monitoring, Doppler velocimetry, and visualization of the fetus. This is
demonstrated in the literature by an increase in the rate of suboptimal ultrasound
visualization of fetal cardiac structures by 50% and of craniospinal structures by 31%17
.
Since the prevalence of obesity among women of reproductive age has reached epidemic
proportions18,19
, clinicians can benefit from an alternative technique to adequately
Graatsma_PROEF (all).ps Back - 5 T1 - Black CyanMagentaYellow

Chapter 1: Introduction 11
monitor the fetus’ condition in pregnancies complicated by obesity. As FHR monitoring
using the fECG signal utilizes a fundamentally different modality, it may overcome the
limitations of Doppler FHR monitoring in obese women.
While evaluating the validation of the improved fECG monitoring technique in terms of
signal quality in the (obese) pregnant population, next step will be to study the ‘true’ FHR
data in pathological pregnancies, for example in uterine growth restricted fetuses and in
diabetic pregnancy.
Although fetal monitoring using CTG and Doppler measurements is commonly used in
pregnancies complicated by intra uterine growth restriction (IUGR), decision making based
on the test results towards expectant management or indicated (preterm) delivery
remains difficult. In IUGR fetuses chronic oxygen and food deprivation is thought to lead
to a delayed maturation of the sympathetic nervous system, as confirmed by the
frequently found reduction in accelerations of FHR and reduced short term variability
(STV)20
. The parasympathetic nervous system (cardio-inhibitory) does not seem to be
affected in the same extent since the presence and duration of decelerations of FHR are
comparable to that in normal pregnancy. Separate analysis of the sympathetic and
parasympathetic nervous system using Phase Rectified Signal Averaging (PRSA) has proven
to provide a better prediction of survival in adults suffering from myocardial infarction21
.
Currently also in fetal medicine the PRSA technique is gaining interest. A pilot study
indicated that differentiation between the contributions of the sympathetic and
parasympathetic branches of the nervous system on FHR regulation may offer a more
specific assessment of the growth restricted fetus22,23
. Although the first studies using
PRSA in fetal medicine have been executed using FHR as recorded with CTG, the fECG
technique measures FHR with an accuracy of 1 ms and may therefore provide even more
specific assessment of fetal cardiovascular (patho-) physiology in pregnancies complicated
by IUGR.
In diabetic pregnancy most major complications (macrosomia, sudden intra uterine death,
congenital malformations and neonatal hypoglycaemia) seem associated with intermittent
hyperglycaemia of the mother during pregnancy. While a previous study in women with
type 1 diabetes demonstrated that high day-to-day glucose variability exists mainly in the
first trimester of pregnancy24
, it is unclear whether this high variability persists at
individual level in the second and third trimesters of pregnancy. Fetal exposure to large
fluctuations in maternal glucose levels may partly explain the ten-fold increased risk for
sudden unexplained intrauterine deaths in diabetic pregnancy compared to the normal
population25-27
. Difficulties are encountered in the recognition of the fetus at risk of intra
uterine death, since routine FHR monitoring during euglycaemia can falsely reassure
clinicians. Doppler velocity waveform patterns of the umbilical artery have also failed to
be of diagnostic importance28
. FHR monitoring during prolonged excursions in glucose
Graatsma_PROEF (all).ps Front - 6 T1 - Black CyanMagentaYellow

12 Monitoring of fetal heart rate and uterine activity
levels might offer insight into the fetal compensatory mechanisms. Novel techniques offer
the possibility to perform simultaneous and long term FHR - and glucose monitoring using
a portable fECG monitor and a continuous glucose monitoring system (CGMS), and thus to
observe the fetal response to spontaneous fluctuations in maternal glucose levels.
Aims of part I of the thesis
• To evaluate the quality of prolonged antenatal FHR recordings obtained with
abdominal ECG electrodes in the second half of gestation. In addition, to study the
accuracy of antenatal fetal ECG recordings by comparing the abdominal FHR
recordings with scalp electrode measurements using intrapartum FHR recordings
(Chapter 2).
• To study the quality of antenatal fetal ECG recordings in obese women. (Chapter 3)
• To describe the normal development of FHR, STV and the sympathetic - and
parasympathetic components of FHR throughout normal gestation, and to perform a
preliminary comparison of these FHR parameters between normal and IUGR fetuses.
(Chapter 4)
• To observe the extent and evaluation of day-to-day variability throughout pregnancy
in type 1 diabetes. (Chapter 5) To describe the fetal responses to spontaneous glucose
excursions monitored using simultaneous continuous measurements of FHR and
maternal glucose levels in the second half of gestation in women with (pre-)
gestational diabetes. (Chapter 6)
PART II
Monitoring uterine contractions using electrohysterography
Labour can be defined as the presence of regular, painful uterine contractions resulting in
cervical changes (effacement and dilation)29
. To achieve progress of labour adequate
uterine activity is a prerequisite. Labour progression can be monitored by a combination
of digital examination of the cervix and engagement of the presenting fetal part, and by
measurements of uterine activity using external tocodynamometry or internal monitoring
using intra-uterine pressure catheters (IUPC). Unfortunately, both external
tocodynamometry and IUPC have disadvantages. Intra-uterine pressure catheters are
invasive and have, in rare cases, been associated with intra-uterine infection, perforation
and placental abruption9,30-33
. Tocodynamometry is non-invasive and easy to use but its
recording quality depends on correct positioning of the sensor on the maternal abdomen
and is influenced by maternal movements and BMI9,33,34
. Additionally, the use of
tocodynamometry is limited to the frequency of contractions only, with no information
regarding force or efficiency35
. Finally, a recent randomized trial has demonstrated that
none of the current techniques of contraction monitoring improved labour outcome36
. The
search for an alternative has led to the investigation of methods measuring the uterus’
Graatsma_PROEF (all).ps Back - 6 T1 - Black CyanMagentaYellow

Chapter 1: Introduction 13
electrical activity. This approach, denoted either uterine electromyography (uterine EMG)
or electrohysterography (EHG) has been known for more than fifty years12,13,37
. It is
recently experiencing a renewed surge of interest thanks to technical improvements and
because of data indicating that it could be able to discriminate between efficient and
inefficient contractions. This distinction is particularly relevant in the context of
threatened preterm labour38-42
. Although promising results have been obtained on this
issue, EHG is a method that is still under development. Studies focusing on signal analysis
have shown that the EHG signal could be made to agree with IUPC measurements using
algorithms of varying complexity43-47
. Only few studies, however, have compared the
performance of EHG to other methods of uterine activity monitoring under conditions
representative of clinical practice39,48
.
Where the possibilities with IUPC and external tocodynamometry are limited, EHG can be
used for more than the determination of contraction frequency, duration and amplitude.
The acquired uterine activity can be analyzed using standard signal analysis techniques
such as the power density spectrum. The additional information following this analysis
might help in the understanding of the biological or pathological pathways leading to
dysfunctional contractility.
Aims of part II of the thesis
• To consolidate the validation of EHG during labour by comparing it to the method of
reference, the intrauterine pressure catheter. (Chapter 7)
• To examine whether non-invasive monitoring of uterine activity using
electrohysterography can help to differentiate between normal and dysfunctional
term labour in nulliparous women. (Chapter 8)
Graatsma_PROEF (all).ps Front - 7 T1 - Black CyanMagentaYellow

14 Monitoring of fetal heart rate and uterine activity
Reference List
1. Nijhuis IJ, Ten Hof J, Nijhuis JG, Mulder EJ, Narayan H, Taylor DJ, et al. Temporal
organization of fetal behavior from 24-weeks gestation onwards in normal and
complicated pregnancies. Dev.Psychobiol. 1999 05;34(0012-1630; 4):257-268.
2. Visser GH, Poelmann-Weesjes G, Cohen TM, Bekedam DJ. Fetal behavior at 30 to 32
weeks of gestation. Pediatr.Res. 1987 12;22(0031-3998; 6):655-658.
3. Visser GH. Fetal health assessment. Curr.Opin.Obstet.Gynecol. 1991 04;3(1040-872;
2):242-247.
4. Visser GH. Fetal behaviour and the cardiovascular system. J.Dev.Physiol. 1984
06;6(0141-9846; 3):215-224.
5. Hecher K, Bilardo CM, Stigter RH, Ville Y, Hackeloer BJ, Kok HJ, et al. Monitoring of
fetuses with intrauterine growth restriction: a longitudinal study. Ultrasound
Obstet.Gynecol. 2001 12;18(0960-7692; 6):564-570.
6. Hecher K, Campbell S, Snijders R, Nicolaides K. Reference ranges for fetal venous and
atrioventricular blood flow parameters. Ultrasound Obstet.Gynecol. 1994 Sep
1;4(5):381-390.
7. Visser GH. Antenatal cardiotocography in the evaluation of fetal well-being.
Aust.N.Z.J.Obstet.Gynaecol. 1984 05;24(0004-8666; 2):80-85.
8. Peters M, Crowe J, Pieri JF, Quartero H, Hayes-Gill B, James D, et al. Monitoring the
fetal heart non-invasively: a review of methods. J.Perinat.Med. 2001;29(0300-5577;
5):408-416.
9. Bakker PC, Zikkenheimer M, van Geijn HP. The quality of intrapartum uterine activity
monitoring. J.Perinat.Med. 2008;36(3):197-201.
10. Dawes GS, Moulden M, Redman CW. Limitations of antenatal fetal heart rate
monitors. Am.J.Obstet.Gynecol. 1990 Jan;162(1):170-173.
11. Pieri JF, Crowe JA, Hayes-Gill BR, Spencer CJ, Bhogal K, James DK. Compact long-term
recorder for the transabdominal foetal and maternal electrocardiogram.
Med.Biol.Eng.Comput. 2001 01;39(0140-0118; 1):118-125.
12. Steer CM, Hertsch GJ. Electrical activity of the human uterus in labor; the
electrohysterograph. Am.J.Obstet.Gynecol. 1950 Jan;59(1):25-40.
13. Wolfs GM, van Leeuwen M. Electromyographic observations on the human uterus
during labour. Acta Obstet.Gynecol.Scand.Suppl. 1979;90:1-61.
14. den Exter T, van Eykern L, de Kreek J., Mulder EJH., Peuscher JHJ., Visser GHA.
Simultaneous recording of fetal ECG and uterine activity by transcutaneous
electrodes: A new way for non-invasive cardiotocography. Fetal Neonatal Phys
Measur 1989.
15. Kuhnert M, Hellmeyer L, Stein W, Schmidt S. Twenty-four-hour CTG monitoring:
comparison of normal pregnancies of 25-30 weeks of gestation versus 36-42 weeks of
gestation. Arch.Gynecol.Obstet. 2007 06;275(0932-0067; 6):451-460.
Graatsma_PROEF (all).ps Back - 7 T1 - Black CyanMagentaYellow

Chapter 1: Introduction 15
16. Visser GH, de Vries JI, Mulder EJ, Ververs IA, van Geijn HP. Effects of frequent
ultrasound during pregnancy. Lancet 1993 11/27;342(0140-6736; 8883):1359-1360.
17. Hendler I, Blackwell SC, Bujold E, Treadwell MC, Wolfe HM, Sokol RJ, et al. The impact
of maternal obesity on midtrimester sonographic visualization of fetal cardiac and
craniospinal structures. Int.J.Obes.Relat.Metab.Disord. 2004 12;28(0307-0565;
12):1607-1611.
18. Chu SY, Kim SY, Bish CL. Prepregnancy obesity prevalence in the United States, 2004-
2005. Matern.Child Health J. 2009 Sep;13(5):614-620.
19. Ogden CL, Carroll MD, Curtin LR, McDowell MA, Tabak CJ, Flegal KM. Prevalence of
overweight and obesity in the United States, 1999-2004. JAMA 2006 Apr
5;295(13):1549-1555.
20. Snijders RJ, Ribbert LS, Visser GH, Mulder EJ. Numeric analysis of heart rate variation
in intrauterine growth-retarded fetuses: a longitudinal study. Am.J.Obstet.Gynecol.
1992 01;166(0002-9378; 1):22-27.
21. Bauer A, Kantelhardt JW, Barthel P, Schneider R, Makikallio T, Ulm K, et al.
Deceleration capacity of heart rate as a predictor of mortality after myocardial
infarction: cohort study. Lancet 2006 May 20;367(9523):1674-1681.
22. Huhn EA, Phasengleichgerichtete Signalmittelung der Kardiotokographie bei
intrauteriner Wachstums-retardierung. Munchen, Germany: Frauenklinik der
Technischen Universität München Klinikum rechts der Isar; 2007.
23. Lobmaier SM, Pildner von Steinburg S, Müller A, Schuster T, Ortiz J, Huhn EA,
Schneider KTM, Schmidt G. Phase-rectified signal averaging as a new method for
surveillance of growth restricted fetuses, a prospective observational study.
Munchen, Germany: Frauenklinik, Abt. Perinatalmedizin, TU München.
24. Kerssen A, de Valk HW, Visser GH. Day-to-day glucose variability during pregnancy in
women with Type 1 diabetes mellitus: glucose profiles measured with the Continuous
Glucose Monitoring System. BJOG 2004 09;111(1470-0328; 9):919-924.
25. Evers IM, de Valk HW, Visser GH. Risk of complications of pregnancy in women with
type 1 diabetes: nationwide prospective study in the Netherlands. BMJ 2004
04/17;328(1468-5833; 7445):915.
26. Macintosh MC, Fleming KM, Bailey JA, Doyle P, Modder J, Acolet D, et al. Perinatal
mortality and congenital anomalies in babies of women with type 1 or type 2 diabetes
in England, Wales, and Northern Ireland: population based study. BMJ 2006 Jul
22;333(7560):177.
27. Penney GC, Mair G, Pearson DW, Scottish Diabetes in Pregnancy Group. Outcomes of
pregnancies in women with type 1 diabetes in Scotland: a national population-based
study. BJOG 2003 Mar;110(3):315-318.
28. Salvesen DR, Higueras MT, Mansur CA, Freeman J, Brudenell JM, Nicolaides KH.
Placental and fetal Doppler velocimetry in pregnancies complicated by maternal
diabetes mellitus. Am.J.Obstet.Gynecol. 1993 Feb;168(2):645-652.
Graatsma_PROEF (all).ps Front - 8 T1 - Black CyanMagentaYellow

16 Monitoring of fetal heart rate and uterine activity
29. Norwitz ER, Robinson JN, Challis JR. The control of labor. N.Engl.J.Med. 1999 Aug
26;341(9):660-666.
30. Bakker PC, van Geijn HP. Uterine activity: implications for the condition of the fetus.
J.Perinat.Med. 2008;36(1):30-37.
31. Chan WH, Paul RH, Toews J. Intrapartum fetal monitoring. Maternal and fetal
morbidity and perinatal mortality. Obstet.Gynecol. 1973 Jan;41(1):7-13.
32. Trudinger BJ, Pryse-Davies J. Fetal hazards of the intrauterine pressure catheter: five
case reports. Br.J.Obstet.Gynaecol. 1978 Aug;85(8):567-572.
33. Miles AM, Monga M, Richeson KS. Correlation of external and internal monitoring of
uterine activity in a cohort of term patients. Am.J.Perinatol. 2001 May;18(3):137-140.
34. Vanner T, Gardosi J. Intrapartum assessment of uterine activity. Baillieres
Clin.Obstet.Gynaecol. 1996 Jun;10(2):243-257.
35. Schlembach D, Maner WL, Garfield RE, Maul H. Monitoring the progress of pregnancy
and labor using electromyography. Eur.J.Obstet.Gynecol.Reprod.Biol. 2009 May;144
Suppl 1:S33-9.
36. Bakker JJ, Verhoeven CJ, Janssen PF, van Lith JM, van Oudgaarden ED, Bloemenkamp
KW, et al. Outcomes after internal versus external tocodynamometry for monitoring
labor. N.Engl.J.Med. 2010 Jan 28;362(4):306-313.
37. Devedeux D, Marque C, Mansour S, Germain G, Duchene J. Uterine
electromyography: a critical review. Am.J.Obstet.Gynecol. 1993 Dec;169(6):1636-
1653.
38. Maner WL, Garfield RE. Identification of human term and preterm labor using artificial
neural networks on uterine electromyography data. Ann.Biomed.Eng. 2007
Mar;35(3):465-473.
39. Maul H, Maner WL, Olson G, Saade GR, Garfield RE. Non-invasive transabdominal
uterine electromyography correlates with the strength of intrauterine pressure and is
predictive of labor and delivery. J.Matern.Fetal.Neonatal Med. 2004 May;15(5):297-
301.
40. Garfield RE, Maner WL. Physiology and electrical activity of uterine contractions.
Semin.Cell Dev.Biol. 2007 Jun;18(3):289-295.
41. Maner WL, Garfield RE, Maul H, Olson G, Saade G. Predicting term and preterm
delivery with transabdominal uterine electromyography. Obstet.Gynecol. 2003
Jun;101(6):1254-1260.
42. Garfield RE, Maner WL, Maul H, Saade GR. Use of uterine EMG and cervical LIF in
monitoring pregnant patients. BJOG 2005 Mar;112 Suppl 1:103-108.
43. Maner WL, MacKay LB, Saade GR, Garfield RE. Characterization of abdominally
acquired uterine electrical signals in humans, using a non-linear analytic method.
Med.Biol.Eng.Comput. 2006 Mar;44(1-2):117-123.
Graatsma_PROEF (all).ps Back - 8 T1 - Black CyanMagentaYellow

Chapter 1: Introduction 17
44. Jezewski J, Horoba K, Matonia A, Wrobel J. Quantitative analysis of contraction
patterns in electrical activity signal of pregnant uterus as an alternative to mechanical
approach. Physiol.Meas. 2005 Oct;26(5):753-767.
45. Skowronski MD, Harris JG, Marossero DE, Edwards RK, Euliano TY. Prediction of
intrauterine pressure from electrohysterography using optimal linear filtering. IEEE
Trans.Biomed.Eng. 2006 Oct;53(10):1983-1989.
46. Euliano T, Skowronski M, Marossero D, Shuster J, Edwards R. Prediction of
intrauterine pressure waveform from transabdominal electrohysterography.
J.Matern.Fetal.Neonatal Med. 2006 Dec;19(12):811-816.
47. Rabotti C, Mischi M, van Laar JO, Oei GS, Bergmans JW. Estimation of internal uterine
pressure by joint amplitude and frequency analysis of electrohysterographic signals.
Physiol.Meas. 2008 Jul;29(7):829-841.
48. Euliano TY, Nguyen MT, Marossero D, Edwards RK. Monitoring contractions in obese
parturients: electrohysterography compared with traditional monitoring.
Obstet.Gynecol. 2007 May;109(5):1136-1140.
Graatsma_PROEF (all).ps Front - 9 T1 - Black CyanMagentaYellow

18 Monitoring of fetal heart rate and uterine activity
Graatsma_PROEF (all).ps Back - 9 T1 - Black CyanMagentaYellow
Chapter 2: Feasibility of long term fECG recordings 19
Chapter 2
Fetal electrocardiography: feasibility of
long term fetal heart rate recordings
E. M. Graatsma
B. C. Jacod
L. A. J. van Egmond
E. J. H. Mulder
G. H. A. Visser
Published: British journal of Obstetrics & Gynaecology 2009; 116: 334-338
Graatsma_PROEF (all).ps Front - 10 T1 - Black CyanMagentaYellow

20 Monitoring of fetal heart rate and uterine activity
Graatsma_PROEF (all).ps Back - 10 T1 - Black CyanMagentaYellow

Chapter 2: Feasibility of long term fECG recordings 21
Fetal electrocardiography: feasibility of long term
fetal heart rate recordings
Abstract
The feasibility and accuracy of long-term transabdominal fetal-ECG recordings throughout
pregnancy were studied using a portable fetal-ECG monitor. Fifteen-hour recordings of
fetal heart rate (FHR) were performed in 150 pregnant women at 20–40 weeks’ gestation,
and one-hour recordings were performed in 22 women in labour and compared to
simultaneous scalp-electrode recordings. When ≥60% of fECG-signals was present the
recording was defined as good. 82% (123/150) of antenatal recordings were of good
quality. This percentage increased to 90.7% (136/150 recordings) when only the night part
(11pm-7am) was considered. Trans-abdominal measurement of FHR and its variability
correlated well with scalp-electrode recordings (r=0.99,p<0.01; r=0.79,p<0.01,
respectively). We demonstrated the feasibility and accuracy of long-term transabdominal
fetal-ECG monitoring.
Introduction
Antepartum fetal surveillance constitutes an essential component of the standards of care
in managing high risk pregnancies, including maternal hypertensive disorders, intra-
uterine growth restriction (IUGR) and other maternal and fetal pathophysiological
conditions. Ultrasound examination (growth, Doppler flow velocimetry) and fetal heart
rate (FHR) monitoring are the most commonly used antepartum fetal surveillance tests. In
current obstetrical practice, both techniques are used for short durations at regular
intervals, although long-term monitoring could help improve clinical management in some
cases1. To date, this is only possible using ultrasound based cardiotocography (CTG)
1.
However, its use for a prolonged period both in the hospital and in the home-environment
remains cumbersome due to discomfort and poor signal quality in prolonged recordings2.
Moreover, it exposes the fetus to prolonged ultrasound insonation. An alternative is the
continuous monitoring of fetal heart rate through the measurement of the electrical signal
of the fetal heart (fetal electrocardiogram, fECG). Originally hampered by technical
difficulties2, the method seems now ready for clinical use. The primary aim of the present
study was to evaluate the quality of prolonged antenatal FHR recordings obtained with
abdominal ECG electrodes in the second half of gestation. In addition, the accuracy of
trans-abdominal recordings was evaluated by comparing to scalp electrode measurements
in a smaller set of intrapartum recordings.
Graatsma_PROEF (all).ps Front - 11 T1 - Black CyanMagentaYellow
22 Monitoring of fetal heart rate and uterine activity
Material and methods
The antenatal group consisted of 150 pregnant women at 20 – 40 weeks of gestation.
Exclusion criteria were multiple gestation and congenital malformations. Women were
recruited for a single overnight recording, either at home (n=110) or during admission at
the obstetrics ward (n=40). Maternal mobility was not restricted while being attached to
the monitor. Recordings were performed during 15 hours (5pm – 8am), mostly overnight
to minimize abdominal muscle activity that could result in distortion of the fECG signal2.
Fetal presentation was determined by ultrasound examination before starting the
recording. Table 1 summarizes patient distribution according to gestational age periods,
fetal presentation (cephalic, breech and transverse), and fetal-maternal complications.
The intrapartum group consisted of 22 women in labour at term recruited in the labour
ward of our tertiary centre. Trans-abdominal and scalp electrode recordings were
performed simultaneously for one hour in the first stage of labour. Medians of FHR and
short term variability (according to Dawes et al.3) were calculated as variables for
accuracy. The median and ranges for gestational age and BMI of the patients are
summarized in Table 1.
Signal processing
The recordings were performed with the AN24 fetal ECG monitor (Monica Healthcare,
Nottingham, UK). The electrophysiological signal, recorded using 5 disposable electrodes
placed on the maternal abdomen, contains the maternal ECG (mECG), fetal ECG and noise.
Maternal and fetal ECG complexes were used to calculate beat-to-beat (R-R) pulse
intervals, which correspond to the maternal (MHR) and fetal heart (FHR) rates,
respectively. The methodology used for signal extraction and analysis has been described
in detail by Pieri et al4. The five disposable electrodes were placed on the maternal
abdomen in a standardized manner, independent of fetal positioning; two electrodes
along the midline (at the side of the uterine fundus and above the symphysis), one at each
side of the uterus and the ground electrode on the left flank. Skin impedance was reduced
before placing the electrodes using abrading paper at the electrode placement site. Skin
impedance was below 5 kΩ in all recordings. Data was analysed off line after computer
download.
Quality assessment of fECG recordings
Signal loss was defined as the proportion of epochs (in %) during which no valid data were
available (after data reduction over 3.75s epochs)3. Instead of signal loss, we will use the
term recording quality (RQ; 100% – signal loss), with RQ ≥ 60% to indicate a successful
record based on Dawes et al3.
Graatsma_PROEF (all).ps Back - 11 T1 - Black CyanMagentaYellow

Chapter 2: Feasibility of long term fECG recordings 23
Table 1: Study population characteristics
Table legend: 1:Pre-eclampsia or Pregnancy induced hypertension; 2: Intra uterine growth
retardation; 3: Prelabour premature rupture of membranes; 4: Preterm Labour; 5: Diabetes Mellitus
or Gestational Diabetes Mellitus; 6: Vaginal blood loss; 7: Others include: fetal arrhythmias,
antidepressants, polyhydramnious, and Morbus Graves.
Statistics
SPSS for Windows (version 12.01, SPSS Inc., Chicago, Ill.) was used for statistical analysis.
Results were summarized with the use of standard descriptives for non-parametric tests:
medians, and (interquartile) ranges. Groups were compared with the Kruskal-Wallis test
with post hoc analysis where appropriate, and Spearman correlation was used to evaluate
the effect of potential confounders.
Gestational age 20+0
– 25+6
N=20 (13%)
26+0
– 31+6
N=45 (30%)
32+0
– 34+6
N=30 (20%)
35+0
– 37+6
N=28 (18%)
≥38+0
N=27 (18%)
Fetal Presentation (%)
Cephalic
Breech
Transverse
10 (50)
4 (20)
6 (30)
28 (62.2)
7 (15.6)
10 (22.2)
27 (90)
2 (6.7)
1 (3.3)
28 (100)
0
0
26 (96.3)
1 (3.7)
0
Fetal-maternal condition (%)
None
PE/PIH1
IUGR2
PPROM3
PTL4
DM/GDM5
VBL6
Others7
14 (70)
0
0
1 (5)
1 (5)
2 (10)
0
2 (10)
18 (40)
3 (6.7)
5 (11.1)
5 (11.1)
4 (8.9)
3 (6.7)
5 (11.1)
2 (4.4)
18 (60)
4 (13.3)
5 (16.7)
0
0
0
1 (3.3)
2 (6.7)
17 (60.7)
2 (7.1)
3 (10.7)
0
0
2 (7.1)
0
4 (14.3)
24 (88.9)
3 (11.1)
0
0
0
0
0
0
Recording location (%)
Home
Hospital
18 (90)
2 (10)
23 (51.1)
22 (48.9)
23 (76.7)
7 (23.3)
22 (78.6)
6 (21.4)
24 (88.9)
3 (11.1)
Intrapartum Recordings
Median Range
Gestational age
BMI (kg/m2)
40+1
24.5
37+2
– 42+2
16.9 – 40.4
Graatsma_PROEF (all).ps Front - 12 T1 - Black CyanMagentaYellow
24
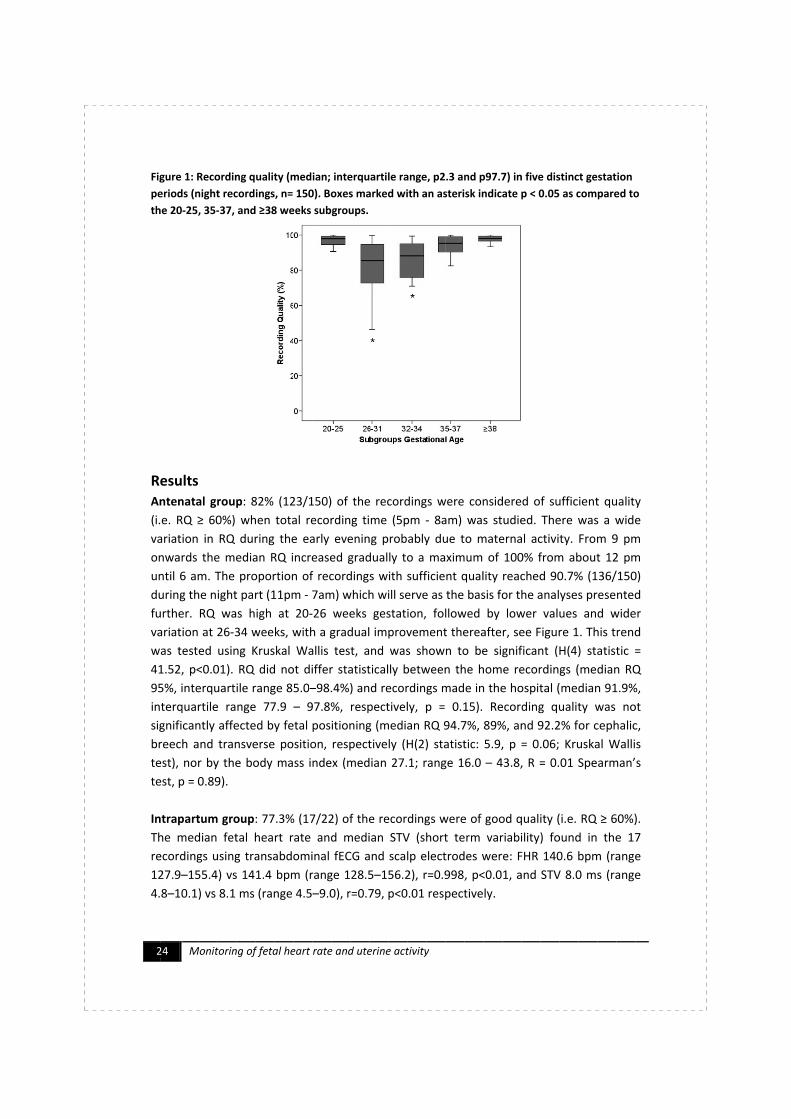
Figure 1: Recording quality (median; interquartile range, p2.3 and p97.7) in five distinct gestation
periods (night recordings, n= 150). Boxes marked with an asterisk indicate p < 0.05 as compared to
the
Results
Antenatal group
(i.e. RQ
variation in RQ during the early e
onwards the median RQ increased gradually to a maximum of 100% from about 12 pm
until 6 am. The proportion of recordings with sufficient quality reached 90.7% (136/150)
during the night part (11pm
further. RQ was high at 20
variation at 26
was tested using Kruskal Wa
41.52, p<0.01). RQ did not differ statistically between the home recordings (median RQ
95%, interquartile range 85.0
interquartile range
significantly affected by fetal positioning (median RQ 94.7%, 89%, and 92.2% for cephalic,
breech and transverse position, respectively (H(2) statistic: 5.9, p = 0.06; Kruskal Wallis
test), n
test, p = 0.89).
Intrapartum group
The median fetal heart rate and median STV (short term variability) fo
recordings using transabdominal fECG and scalp electrodes were: FHR 140.6 bpm (range
127.9
4.8
24
Figure 1: Recording quality (median; interquartile range, p2.3 and p97.7) in five distinct gestation
periods (night recordings, n= 150). Boxes marked with an asterisk indicate p < 0.05 as compared to
the 20
Results
Antenatal group
(i.e. RQ
variation in RQ during the early e
onwards the median RQ increased gradually to a maximum of 100% from about 12 pm
until 6 am. The proportion of recordings with sufficient quality reached 90.7% (136/150)
during the night part (11pm
further. RQ was high at 20
variation at 26
was tested using Kruskal Wa
41.52, p<0.01). RQ did not differ statistically between the home recordings (median RQ
95%, interquartile range 85.0
interquartile range
significantly affected by fetal positioning (median RQ 94.7%, 89%, and 92.2% for cephalic,
breech and transverse position, respectively (H(2) statistic: 5.9, p = 0.06; Kruskal Wallis
test), n
test, p = 0.89).
Intrapartum group
The median fetal heart rate and median STV (short term variability) fo
recordings using transabdominal fECG and scalp electrodes were: FHR 140.6 bpm (range
127.9
4.8–10.1) vs 8.1 ms (range 4.5
Monitoring
Figure 1: Recording quality (median; interquartile range, p2.3 and p97.7) in five distinct gestation
periods (night recordings, n= 150). Boxes marked with an asterisk indicate p < 0.05 as compared to
20-25, 35
Results
Antenatal group
(i.e. RQ ≥ 60%) when total recording time (5pm
variation in RQ during the early e
onwards the median RQ increased gradually to a maximum of 100% from about 12 pm
until 6 am. The proportion of recordings with sufficient quality reached 90.7% (136/150)
during the night part (11pm
further. RQ was high at 20
variation at 26
was tested using Kruskal Wa
41.52, p<0.01). RQ did not differ statistically between the home recordings (median RQ
95%, interquartile range 85.0
interquartile range
significantly affected by fetal positioning (median RQ 94.7%, 89%, and 92.2% for cephalic,
breech and transverse position, respectively (H(2) statistic: 5.9, p = 0.06; Kruskal Wallis
test), nor by the body mass index (median 27.1; range 16.0
test, p = 0.89).
Intrapartum group
The median fetal heart rate and median STV (short term variability) fo
recordings using transabdominal fECG and scalp electrodes were: FHR 140.6 bpm (range
127.9–155.4) vs 141.4 bpm (range 128.5
10.1) vs 8.1 ms (range 4.5
Monitoring
Figure 1: Recording quality (median; interquartile range, p2.3 and p97.7) in five distinct gestation
periods (night recordings, n= 150). Boxes marked with an asterisk indicate p < 0.05 as compared to
25, 35-
Antenatal group
≥ 60%) when total recording time (5pm
variation in RQ during the early e
onwards the median RQ increased gradually to a maximum of 100% from about 12 pm
until 6 am. The proportion of recordings with sufficient quality reached 90.7% (136/150)
during the night part (11pm
further. RQ was high at 20
variation at 26
was tested using Kruskal Wa
41.52, p<0.01). RQ did not differ statistically between the home recordings (median RQ
95%, interquartile range 85.0
interquartile range
significantly affected by fetal positioning (median RQ 94.7%, 89%, and 92.2% for cephalic,
breech and transverse position, respectively (H(2) statistic: 5.9, p = 0.06; Kruskal Wallis
or by the body mass index (median 27.1; range 16.0
test, p = 0.89).
Intrapartum group
The median fetal heart rate and median STV (short term variability) fo
recordings using transabdominal fECG and scalp electrodes were: FHR 140.6 bpm (range
155.4) vs 141.4 bpm (range 128.5
10.1) vs 8.1 ms (range 4.5
Monitoring
Figure 1: Recording quality (median; interquartile range, p2.3 and p97.7) in five distinct gestation
periods (night recordings, n= 150). Boxes marked with an asterisk indicate p < 0.05 as compared to
-37, and
Antenatal group
≥ 60%) when total recording time (5pm
variation in RQ during the early e
onwards the median RQ increased gradually to a maximum of 100% from about 12 pm
until 6 am. The proportion of recordings with sufficient quality reached 90.7% (136/150)
during the night part (11pm
further. RQ was high at 20
variation at 26-34 weeks, with a gradual improvement thereafter, see Figure 1. This trend
was tested using Kruskal Wa
41.52, p<0.01). RQ did not differ statistically between the home recordings (median RQ
95%, interquartile range 85.0
interquartile range
significantly affected by fetal positioning (median RQ 94.7%, 89%, and 92.2% for cephalic,
breech and transverse position, respectively (H(2) statistic: 5.9, p = 0.06; Kruskal Wallis
or by the body mass index (median 27.1; range 16.0
test, p = 0.89).
Intrapartum group
The median fetal heart rate and median STV (short term variability) fo
recordings using transabdominal fECG and scalp electrodes were: FHR 140.6 bpm (range
155.4) vs 141.4 bpm (range 128.5
10.1) vs 8.1 ms (range 4.5
Monitoring of fetal heart rate and uterine activity
Figure 1: Recording quality (median; interquartile range, p2.3 and p97.7) in five distinct gestation
periods (night recordings, n= 150). Boxes marked with an asterisk indicate p < 0.05 as compared to
37, and
Antenatal group: 82% (123/150) of the recordings were considered of sufficient quality
≥ 60%) when total recording time (5pm
variation in RQ during the early e
onwards the median RQ increased gradually to a maximum of 100% from about 12 pm
until 6 am. The proportion of recordings with sufficient quality reached 90.7% (136/150)
during the night part (11pm
further. RQ was high at 20
34 weeks, with a gradual improvement thereafter, see Figure 1. This trend
was tested using Kruskal Wa
41.52, p<0.01). RQ did not differ statistically between the home recordings (median RQ
95%, interquartile range 85.0
interquartile range
significantly affected by fetal positioning (median RQ 94.7%, 89%, and 92.2% for cephalic,
breech and transverse position, respectively (H(2) statistic: 5.9, p = 0.06; Kruskal Wallis
or by the body mass index (median 27.1; range 16.0
Intrapartum group: 77.3% (17/22) of the recordings were of good quality (i.e. RQ
The median fetal heart rate and median STV (short term variability) fo
recordings using transabdominal fECG and scalp electrodes were: FHR 140.6 bpm (range
155.4) vs 141.4 bpm (range 128.5
10.1) vs 8.1 ms (range 4.5
of fetal heart rate and uterine activity
Figure 1: Recording quality (median; interquartile range, p2.3 and p97.7) in five distinct gestation
periods (night recordings, n= 150). Boxes marked with an asterisk indicate p < 0.05 as compared to
37, and ≥38 weeks subgroups.
: 82% (123/150) of the recordings were considered of sufficient quality
≥ 60%) when total recording time (5pm
variation in RQ during the early e
onwards the median RQ increased gradually to a maximum of 100% from about 12 pm
until 6 am. The proportion of recordings with sufficient quality reached 90.7% (136/150)
during the night part (11pm
further. RQ was high at 20
34 weeks, with a gradual improvement thereafter, see Figure 1. This trend
was tested using Kruskal Wa
41.52, p<0.01). RQ did not differ statistically between the home recordings (median RQ
95%, interquartile range 85.0
interquartile range 77.9
significantly affected by fetal positioning (median RQ 94.7%, 89%, and 92.2% for cephalic,
breech and transverse position, respectively (H(2) statistic: 5.9, p = 0.06; Kruskal Wallis
or by the body mass index (median 27.1; range 16.0
: 77.3% (17/22) of the recordings were of good quality (i.e. RQ
The median fetal heart rate and median STV (short term variability) fo
recordings using transabdominal fECG and scalp electrodes were: FHR 140.6 bpm (range
155.4) vs 141.4 bpm (range 128.5
10.1) vs 8.1 ms (range 4.5
of fetal heart rate and uterine activity
Figure 1: Recording quality (median; interquartile range, p2.3 and p97.7) in five distinct gestation
periods (night recordings, n= 150). Boxes marked with an asterisk indicate p < 0.05 as compared to
≥38 weeks subgroups.
: 82% (123/150) of the recordings were considered of sufficient quality
≥ 60%) when total recording time (5pm
variation in RQ during the early e
onwards the median RQ increased gradually to a maximum of 100% from about 12 pm
until 6 am. The proportion of recordings with sufficient quality reached 90.7% (136/150)
during the night part (11pm
further. RQ was high at 20
34 weeks, with a gradual improvement thereafter, see Figure 1. This trend
was tested using Kruskal Wa
41.52, p<0.01). RQ did not differ statistically between the home recordings (median RQ
95%, interquartile range 85.0
77.9 –
significantly affected by fetal positioning (median RQ 94.7%, 89%, and 92.2% for cephalic,
breech and transverse position, respectively (H(2) statistic: 5.9, p = 0.06; Kruskal Wallis
or by the body mass index (median 27.1; range 16.0
: 77.3% (17/22) of the recordings were of good quality (i.e. RQ
The median fetal heart rate and median STV (short term variability) fo
recordings using transabdominal fECG and scalp electrodes were: FHR 140.6 bpm (range
155.4) vs 141.4 bpm (range 128.5
10.1) vs 8.1 ms (range 4.5
of fetal heart rate and uterine activity
Figure 1: Recording quality (median; interquartile range, p2.3 and p97.7) in five distinct gestation
periods (night recordings, n= 150). Boxes marked with an asterisk indicate p < 0.05 as compared to
≥38 weeks subgroups.
: 82% (123/150) of the recordings were considered of sufficient quality
≥ 60%) when total recording time (5pm
variation in RQ during the early e
onwards the median RQ increased gradually to a maximum of 100% from about 12 pm
until 6 am. The proportion of recordings with sufficient quality reached 90.7% (136/150)
during the night part (11pm - 7am)
further. RQ was high at 20-
34 weeks, with a gradual improvement thereafter, see Figure 1. This trend
was tested using Kruskal Wa
41.52, p<0.01). RQ did not differ statistically between the home recordings (median RQ
95%, interquartile range 85.0–
– 97.8%, respectively, p = 0.15). Recording quality was not
significantly affected by fetal positioning (median RQ 94.7%, 89%, and 92.2% for cephalic,
breech and transverse position, respectively (H(2) statistic: 5.9, p = 0.06; Kruskal Wallis
or by the body mass index (median 27.1; range 16.0
: 77.3% (17/22) of the recordings were of good quality (i.e. RQ
The median fetal heart rate and median STV (short term variability) fo
recordings using transabdominal fECG and scalp electrodes were: FHR 140.6 bpm (range
155.4) vs 141.4 bpm (range 128.5
10.1) vs 8.1 ms (range 4.5–
of fetal heart rate and uterine activity
Figure 1: Recording quality (median; interquartile range, p2.3 and p97.7) in five distinct gestation
periods (night recordings, n= 150). Boxes marked with an asterisk indicate p < 0.05 as compared to
≥38 weeks subgroups.
: 82% (123/150) of the recordings were considered of sufficient quality
≥ 60%) when total recording time (5pm
variation in RQ during the early e
onwards the median RQ increased gradually to a maximum of 100% from about 12 pm
until 6 am. The proportion of recordings with sufficient quality reached 90.7% (136/150)
7am)
-26 weeks gestation, followed by lower values and wider
34 weeks, with a gradual improvement thereafter, see Figure 1. This trend
was tested using Kruskal Wallis test, and was shown to be significant (H(4) statistic =
41.52, p<0.01). RQ did not differ statistically between the home recordings (median RQ
–98.4%) and recordings made in the hospital (median 91.9%,
97.8%, respectively, p = 0.15). Recording quality was not
significantly affected by fetal positioning (median RQ 94.7%, 89%, and 92.2% for cephalic,
breech and transverse position, respectively (H(2) statistic: 5.9, p = 0.06; Kruskal Wallis
or by the body mass index (median 27.1; range 16.0
: 77.3% (17/22) of the recordings were of good quality (i.e. RQ
The median fetal heart rate and median STV (short term variability) fo
recordings using transabdominal fECG and scalp electrodes were: FHR 140.6 bpm (range
155.4) vs 141.4 bpm (range 128.5
–9.0), r=0.79, p<0.01 respectively.
of fetal heart rate and uterine activity
Figure 1: Recording quality (median; interquartile range, p2.3 and p97.7) in five distinct gestation
periods (night recordings, n= 150). Boxes marked with an asterisk indicate p < 0.05 as compared to
≥38 weeks subgroups.
: 82% (123/150) of the recordings were considered of sufficient quality
≥ 60%) when total recording time (5pm
variation in RQ during the early evening probably due to maternal activity. From 9 pm
onwards the median RQ increased gradually to a maximum of 100% from about 12 pm
until 6 am. The proportion of recordings with sufficient quality reached 90.7% (136/150)
7am) which will serve as the basis for the analyses presented
26 weeks gestation, followed by lower values and wider
34 weeks, with a gradual improvement thereafter, see Figure 1. This trend
llis test, and was shown to be significant (H(4) statistic =
41.52, p<0.01). RQ did not differ statistically between the home recordings (median RQ
98.4%) and recordings made in the hospital (median 91.9%,
97.8%, respectively, p = 0.15). Recording quality was not
significantly affected by fetal positioning (median RQ 94.7%, 89%, and 92.2% for cephalic,
breech and transverse position, respectively (H(2) statistic: 5.9, p = 0.06; Kruskal Wallis
or by the body mass index (median 27.1; range 16.0
: 77.3% (17/22) of the recordings were of good quality (i.e. RQ
The median fetal heart rate and median STV (short term variability) fo
recordings using transabdominal fECG and scalp electrodes were: FHR 140.6 bpm (range
155.4) vs 141.4 bpm (range 128.5
9.0), r=0.79, p<0.01 respectively.
of fetal heart rate and uterine activity
Figure 1: Recording quality (median; interquartile range, p2.3 and p97.7) in five distinct gestation
periods (night recordings, n= 150). Boxes marked with an asterisk indicate p < 0.05 as compared to
≥38 weeks subgroups.
: 82% (123/150) of the recordings were considered of sufficient quality
≥ 60%) when total recording time (5pm
vening probably due to maternal activity. From 9 pm
onwards the median RQ increased gradually to a maximum of 100% from about 12 pm
until 6 am. The proportion of recordings with sufficient quality reached 90.7% (136/150)
which will serve as the basis for the analyses presented
26 weeks gestation, followed by lower values and wider
34 weeks, with a gradual improvement thereafter, see Figure 1. This trend
llis test, and was shown to be significant (H(4) statistic =
41.52, p<0.01). RQ did not differ statistically between the home recordings (median RQ
98.4%) and recordings made in the hospital (median 91.9%,
97.8%, respectively, p = 0.15). Recording quality was not
significantly affected by fetal positioning (median RQ 94.7%, 89%, and 92.2% for cephalic,
breech and transverse position, respectively (H(2) statistic: 5.9, p = 0.06; Kruskal Wallis
or by the body mass index (median 27.1; range 16.0
: 77.3% (17/22) of the recordings were of good quality (i.e. RQ
The median fetal heart rate and median STV (short term variability) fo
recordings using transabdominal fECG and scalp electrodes were: FHR 140.6 bpm (range
155.4) vs 141.4 bpm (range 128.5
9.0), r=0.79, p<0.01 respectively.
of fetal heart rate and uterine activity
Figure 1: Recording quality (median; interquartile range, p2.3 and p97.7) in five distinct gestation
periods (night recordings, n= 150). Boxes marked with an asterisk indicate p < 0.05 as compared to
: 82% (123/150) of the recordings were considered of sufficient quality
≥ 60%) when total recording time (5pm
vening probably due to maternal activity. From 9 pm
onwards the median RQ increased gradually to a maximum of 100% from about 12 pm
until 6 am. The proportion of recordings with sufficient quality reached 90.7% (136/150)
which will serve as the basis for the analyses presented
26 weeks gestation, followed by lower values and wider
34 weeks, with a gradual improvement thereafter, see Figure 1. This trend
llis test, and was shown to be significant (H(4) statistic =
41.52, p<0.01). RQ did not differ statistically between the home recordings (median RQ
98.4%) and recordings made in the hospital (median 91.9%,
97.8%, respectively, p = 0.15). Recording quality was not
significantly affected by fetal positioning (median RQ 94.7%, 89%, and 92.2% for cephalic,
breech and transverse position, respectively (H(2) statistic: 5.9, p = 0.06; Kruskal Wallis
or by the body mass index (median 27.1; range 16.0
: 77.3% (17/22) of the recordings were of good quality (i.e. RQ
The median fetal heart rate and median STV (short term variability) fo
recordings using transabdominal fECG and scalp electrodes were: FHR 140.6 bpm (range
155.4) vs 141.4 bpm (range 128.5–156.2), r=0.998, p<0.01, and STV 8.0 ms (range
9.0), r=0.79, p<0.01 respectively.
of fetal heart rate and uterine activity
Figure 1: Recording quality (median; interquartile range, p2.3 and p97.7) in five distinct gestation
periods (night recordings, n= 150). Boxes marked with an asterisk indicate p < 0.05 as compared to
: 82% (123/150) of the recordings were considered of sufficient quality
≥ 60%) when total recording time (5pm
vening probably due to maternal activity. From 9 pm
onwards the median RQ increased gradually to a maximum of 100% from about 12 pm
until 6 am. The proportion of recordings with sufficient quality reached 90.7% (136/150)
which will serve as the basis for the analyses presented
26 weeks gestation, followed by lower values and wider
34 weeks, with a gradual improvement thereafter, see Figure 1. This trend
llis test, and was shown to be significant (H(4) statistic =
41.52, p<0.01). RQ did not differ statistically between the home recordings (median RQ
98.4%) and recordings made in the hospital (median 91.9%,
97.8%, respectively, p = 0.15). Recording quality was not
significantly affected by fetal positioning (median RQ 94.7%, 89%, and 92.2% for cephalic,
breech and transverse position, respectively (H(2) statistic: 5.9, p = 0.06; Kruskal Wallis
or by the body mass index (median 27.1; range 16.0
: 77.3% (17/22) of the recordings were of good quality (i.e. RQ
The median fetal heart rate and median STV (short term variability) fo
recordings using transabdominal fECG and scalp electrodes were: FHR 140.6 bpm (range
156.2), r=0.998, p<0.01, and STV 8.0 ms (range
9.0), r=0.79, p<0.01 respectively.
of fetal heart rate and uterine activity
Figure 1: Recording quality (median; interquartile range, p2.3 and p97.7) in five distinct gestation
periods (night recordings, n= 150). Boxes marked with an asterisk indicate p < 0.05 as compared to
: 82% (123/150) of the recordings were considered of sufficient quality
≥ 60%) when total recording time (5pm -
vening probably due to maternal activity. From 9 pm
onwards the median RQ increased gradually to a maximum of 100% from about 12 pm
until 6 am. The proportion of recordings with sufficient quality reached 90.7% (136/150)
which will serve as the basis for the analyses presented
26 weeks gestation, followed by lower values and wider
34 weeks, with a gradual improvement thereafter, see Figure 1. This trend
llis test, and was shown to be significant (H(4) statistic =
41.52, p<0.01). RQ did not differ statistically between the home recordings (median RQ
98.4%) and recordings made in the hospital (median 91.9%,
97.8%, respectively, p = 0.15). Recording quality was not
significantly affected by fetal positioning (median RQ 94.7%, 89%, and 92.2% for cephalic,
breech and transverse position, respectively (H(2) statistic: 5.9, p = 0.06; Kruskal Wallis
or by the body mass index (median 27.1; range 16.0
: 77.3% (17/22) of the recordings were of good quality (i.e. RQ
The median fetal heart rate and median STV (short term variability) fo
recordings using transabdominal fECG and scalp electrodes were: FHR 140.6 bpm (range
156.2), r=0.998, p<0.01, and STV 8.0 ms (range
9.0), r=0.79, p<0.01 respectively.
of fetal heart rate and uterine activity
Figure 1: Recording quality (median; interquartile range, p2.3 and p97.7) in five distinct gestation
periods (night recordings, n= 150). Boxes marked with an asterisk indicate p < 0.05 as compared to
: 82% (123/150) of the recordings were considered of sufficient quality
- 8am) was studied. There was a wide
vening probably due to maternal activity. From 9 pm
onwards the median RQ increased gradually to a maximum of 100% from about 12 pm
until 6 am. The proportion of recordings with sufficient quality reached 90.7% (136/150)
which will serve as the basis for the analyses presented
26 weeks gestation, followed by lower values and wider
34 weeks, with a gradual improvement thereafter, see Figure 1. This trend
llis test, and was shown to be significant (H(4) statistic =
41.52, p<0.01). RQ did not differ statistically between the home recordings (median RQ
98.4%) and recordings made in the hospital (median 91.9%,
97.8%, respectively, p = 0.15). Recording quality was not
significantly affected by fetal positioning (median RQ 94.7%, 89%, and 92.2% for cephalic,
breech and transverse position, respectively (H(2) statistic: 5.9, p = 0.06; Kruskal Wallis
or by the body mass index (median 27.1; range 16.0
: 77.3% (17/22) of the recordings were of good quality (i.e. RQ
The median fetal heart rate and median STV (short term variability) fo
recordings using transabdominal fECG and scalp electrodes were: FHR 140.6 bpm (range
156.2), r=0.998, p<0.01, and STV 8.0 ms (range
9.0), r=0.79, p<0.01 respectively.
Figure 1: Recording quality (median; interquartile range, p2.3 and p97.7) in five distinct gestation
periods (night recordings, n= 150). Boxes marked with an asterisk indicate p < 0.05 as compared to
: 82% (123/150) of the recordings were considered of sufficient quality
8am) was studied. There was a wide
vening probably due to maternal activity. From 9 pm
onwards the median RQ increased gradually to a maximum of 100% from about 12 pm
until 6 am. The proportion of recordings with sufficient quality reached 90.7% (136/150)
which will serve as the basis for the analyses presented
26 weeks gestation, followed by lower values and wider
34 weeks, with a gradual improvement thereafter, see Figure 1. This trend
llis test, and was shown to be significant (H(4) statistic =
41.52, p<0.01). RQ did not differ statistically between the home recordings (median RQ
98.4%) and recordings made in the hospital (median 91.9%,
97.8%, respectively, p = 0.15). Recording quality was not
significantly affected by fetal positioning (median RQ 94.7%, 89%, and 92.2% for cephalic,
breech and transverse position, respectively (H(2) statistic: 5.9, p = 0.06; Kruskal Wallis
or by the body mass index (median 27.1; range 16.0 – 43.8, R = 0.01 Spearman’s
: 77.3% (17/22) of the recordings were of good quality (i.e. RQ
The median fetal heart rate and median STV (short term variability) fo
recordings using transabdominal fECG and scalp electrodes were: FHR 140.6 bpm (range
156.2), r=0.998, p<0.01, and STV 8.0 ms (range
9.0), r=0.79, p<0.01 respectively.
Figure 1: Recording quality (median; interquartile range, p2.3 and p97.7) in five distinct gestation
periods (night recordings, n= 150). Boxes marked with an asterisk indicate p < 0.05 as compared to
: 82% (123/150) of the recordings were considered of sufficient quality
8am) was studied. There was a wide
vening probably due to maternal activity. From 9 pm
onwards the median RQ increased gradually to a maximum of 100% from about 12 pm
until 6 am. The proportion of recordings with sufficient quality reached 90.7% (136/150)
which will serve as the basis for the analyses presented
26 weeks gestation, followed by lower values and wider
34 weeks, with a gradual improvement thereafter, see Figure 1. This trend
llis test, and was shown to be significant (H(4) statistic =
41.52, p<0.01). RQ did not differ statistically between the home recordings (median RQ
98.4%) and recordings made in the hospital (median 91.9%,
97.8%, respectively, p = 0.15). Recording quality was not
significantly affected by fetal positioning (median RQ 94.7%, 89%, and 92.2% for cephalic,
breech and transverse position, respectively (H(2) statistic: 5.9, p = 0.06; Kruskal Wallis
43.8, R = 0.01 Spearman’s
: 77.3% (17/22) of the recordings were of good quality (i.e. RQ
The median fetal heart rate and median STV (short term variability) fo
recordings using transabdominal fECG and scalp electrodes were: FHR 140.6 bpm (range
156.2), r=0.998, p<0.01, and STV 8.0 ms (range
Figure 1: Recording quality (median; interquartile range, p2.3 and p97.7) in five distinct gestation
periods (night recordings, n= 150). Boxes marked with an asterisk indicate p < 0.05 as compared to
: 82% (123/150) of the recordings were considered of sufficient quality
8am) was studied. There was a wide
vening probably due to maternal activity. From 9 pm
onwards the median RQ increased gradually to a maximum of 100% from about 12 pm
until 6 am. The proportion of recordings with sufficient quality reached 90.7% (136/150)
which will serve as the basis for the analyses presented
26 weeks gestation, followed by lower values and wider
34 weeks, with a gradual improvement thereafter, see Figure 1. This trend
llis test, and was shown to be significant (H(4) statistic =
41.52, p<0.01). RQ did not differ statistically between the home recordings (median RQ
98.4%) and recordings made in the hospital (median 91.9%,
97.8%, respectively, p = 0.15). Recording quality was not
significantly affected by fetal positioning (median RQ 94.7%, 89%, and 92.2% for cephalic,
breech and transverse position, respectively (H(2) statistic: 5.9, p = 0.06; Kruskal Wallis
43.8, R = 0.01 Spearman’s
: 77.3% (17/22) of the recordings were of good quality (i.e. RQ
The median fetal heart rate and median STV (short term variability) found in the 17
recordings using transabdominal fECG and scalp electrodes were: FHR 140.6 bpm (range
156.2), r=0.998, p<0.01, and STV 8.0 ms (range
Figure 1: Recording quality (median; interquartile range, p2.3 and p97.7) in five distinct gestation
periods (night recordings, n= 150). Boxes marked with an asterisk indicate p < 0.05 as compared to
: 82% (123/150) of the recordings were considered of sufficient quality
8am) was studied. There was a wide
vening probably due to maternal activity. From 9 pm
onwards the median RQ increased gradually to a maximum of 100% from about 12 pm
until 6 am. The proportion of recordings with sufficient quality reached 90.7% (136/150)
which will serve as the basis for the analyses presented
26 weeks gestation, followed by lower values and wider
34 weeks, with a gradual improvement thereafter, see Figure 1. This trend
llis test, and was shown to be significant (H(4) statistic =
41.52, p<0.01). RQ did not differ statistically between the home recordings (median RQ
98.4%) and recordings made in the hospital (median 91.9%,
97.8%, respectively, p = 0.15). Recording quality was not
significantly affected by fetal positioning (median RQ 94.7%, 89%, and 92.2% for cephalic,
breech and transverse position, respectively (H(2) statistic: 5.9, p = 0.06; Kruskal Wallis
43.8, R = 0.01 Spearman’s
: 77.3% (17/22) of the recordings were of good quality (i.e. RQ
und in the 17
recordings using transabdominal fECG and scalp electrodes were: FHR 140.6 bpm (range
156.2), r=0.998, p<0.01, and STV 8.0 ms (range
Figure 1: Recording quality (median; interquartile range, p2.3 and p97.7) in five distinct gestation
periods (night recordings, n= 150). Boxes marked with an asterisk indicate p < 0.05 as compared to
: 82% (123/150) of the recordings were considered of sufficient quality
8am) was studied. There was a wide
vening probably due to maternal activity. From 9 pm
onwards the median RQ increased gradually to a maximum of 100% from about 12 pm
until 6 am. The proportion of recordings with sufficient quality reached 90.7% (136/150)
which will serve as the basis for the analyses presented
26 weeks gestation, followed by lower values and wider
34 weeks, with a gradual improvement thereafter, see Figure 1. This trend
llis test, and was shown to be significant (H(4) statistic =
41.52, p<0.01). RQ did not differ statistically between the home recordings (median RQ
98.4%) and recordings made in the hospital (median 91.9%,
97.8%, respectively, p = 0.15). Recording quality was not
significantly affected by fetal positioning (median RQ 94.7%, 89%, and 92.2% for cephalic,
breech and transverse position, respectively (H(2) statistic: 5.9, p = 0.06; Kruskal Wallis
43.8, R = 0.01 Spearman’s
: 77.3% (17/22) of the recordings were of good quality (i.e. RQ ≥ 60%).
und in the 17
recordings using transabdominal fECG and scalp electrodes were: FHR 140.6 bpm (range
156.2), r=0.998, p<0.01, and STV 8.0 ms (range
Figure 1: Recording quality (median; interquartile range, p2.3 and p97.7) in five distinct gestation
periods (night recordings, n= 150). Boxes marked with an asterisk indicate p < 0.05 as compared to
: 82% (123/150) of the recordings were considered of sufficient quality
8am) was studied. There was a wide
vening probably due to maternal activity. From 9 pm
onwards the median RQ increased gradually to a maximum of 100% from about 12 pm
until 6 am. The proportion of recordings with sufficient quality reached 90.7% (136/150)
which will serve as the basis for the analyses presented
26 weeks gestation, followed by lower values and wider
34 weeks, with a gradual improvement thereafter, see Figure 1. This trend
llis test, and was shown to be significant (H(4) statistic =
41.52, p<0.01). RQ did not differ statistically between the home recordings (median RQ
98.4%) and recordings made in the hospital (median 91.9%,
97.8%, respectively, p = 0.15). Recording quality was not
significantly affected by fetal positioning (median RQ 94.7%, 89%, and 92.2% for cephalic,
breech and transverse position, respectively (H(2) statistic: 5.9, p = 0.06; Kruskal Wallis
43.8, R = 0.01 Spearman’s
≥ 60%).
und in the 17
recordings using transabdominal fECG and scalp electrodes were: FHR 140.6 bpm (range
156.2), r=0.998, p<0.01, and STV 8.0 ms (range
Graatsma_PROEF (all).ps Back - 12 T1 - Black CyanMagentaYellow

Chapter 2: Feasibility of long term fECG recordings 25
Side effects
After removal of the electrodes 30 out of the 150 women (20%) complained of skin
irritation. In most cases, irritation consisted of transient redness of the skin and itchiness
on the site where we had abraded the skin. Almost all of these women were in late
gestation and had no history of skin irritation. When asked whether they would like to use
the monitor again, they replied not to mind in case there would be an indication for fetal
monitoring. Overall, women did not experience any other discomfort while using the
monitor.
Discussion
This study evaluated the feasibility and accuracy of an improved FHR monitoring
technique using the external fECG signal. This technique is an alternative to ultrasound for
long-term antenatal fetal monitoring. To date, all studies on long-term fetal monitoring
are based on FHR data acquired in a hospital setting1,5-7
. They used either
transabdominally placed needle electrodes6, transabdominally placed “sucking-cup”
electrodes7, or ultrasound heart rate monitors
1,5. Since the quality of Doppler CTG
recordings is dependent on fetal movements, long-term monitoring requires frequent
repositioning, while the woman is restricted to a fixed position. The current method, being
truly ambulatory, can perform long-term recordings also in the home environment. We
showed that it can obtain approximately eight hours of qualitatively good FHR records
without the necessity of interference of any care-givers from 20 weeks of gestation
onwards. There is a slight decrease in recording quality between 26 and 34 weeks of
gestation but the signal quality remains acceptable. The 25th percentile of the night RQ
remained far above the required minimum of 60% in this subgroup of gestational age. A
subset analysis comparing pregnancies with fetal-maternal complications with healthy
pregnancies found no significant difference in the magnitude of this effect. This is thus
unlikely to be due to the occurrence of fetal-maternal complications at this stage of
gestation and is probably related to the formation of the vernix caseosa at this gestational
age as suggested by others2. Interestingly, the quality of fECG recordings was not
influenced by maternal obesity as our results show no decline of RQ with increasing BMI.
The findings were validated in a smaller set of intrapartum recordings by comparing fetal
heart rate and STV to measurements performed with the actual gold standard, the scalp
electrode. Both methods were found to correlate well. The correlation was similar to the
values reported in previous comparisons in the literature between non-invasive methods
and scalp electrodes8,9
. Trans-abdominal fetal ECG, therefore seems to be a valid and
accurate substitute for other non-invasive fetal heart rate monitoring techniques. The
fECG technique has the advantages that its true ambulatory character enables long-term
recordings, that the quality of its recording is not influenced by the patient’s BMI, which is
becoming of increasing importance, and that the technique is purely noninvasive. Trans-
Graatsma_PROEF (all).ps Front - 13 T1 - Black CyanMagentaYellow

26 Monitoring of fetal heart rate and uterine activity
abdominal fECG recording is, however, probably more than an adequate substitute for
current methods given its potential for true beat-to-beat heart rate, variability, and ECG
complex analysis. At this point, however, the technology available to the researchers did
not allow for the computation of true beat-to-beat interval variability and fetal ECG
morphology. Following adult cardiology standards an abdominal signal sample rate of
1000Hz is required in order to calculate a true measure of beat-to-beat variability and
follow changes in fECG morphology. The current version of this fECG monitor has a sample
frequency of 300Hz. This will be increased to 1000Hz in subsequent research devices. It is
worth noting that modern conventional fetal monitors only provide an accuracy of +/- 1
beat per minute and update the FHR every 250ms (a sample of 4Hz).
Conclusion
Our findings demonstrate the feasibility and accuracy of an improved fetal monitoring
technique using the externally obtained fetal ECG signal. Quality was optimal when the
recording was performed overnight. Fetal ECG monitoring will be most applicable in high
risk pregnancies that require extended fetal monitoring.
Graatsma_PROEF (all).ps Back - 13 T1 - Black CyanMagentaYellow

Chapter 2: Feasibility of long term fECG recordings 27
Acknowledgement
The authors would like to thank Monica Healthcare Ltd (Biocity, Pennyfoot street ,
Nottingham NG1 1GF, UK, www.monicahealthcare.com) for the provision of the FECG
holter systems and support during this study.
Reference List
1. Kuhnert M, Hellmeyer L, Stein W, Schmidt S. Twenty-four-hour CTG monitoring:
comparison of normal pregnancies of 25-30 weeks of gestation versus 36-42 weeks of
gestation. Arch Gynecol Obstet 2007; 275(6):451-460.
2. Peters M, Crowe J, Pieri JF, Quartero H, Hayes-Gill B, James D et al. Monitoring the
fetal heart non-invasively: a review of methods. J Perinat Med 2001; 29(5):408-416.
3. Dawes GS, Houghton CR, Redman CWG, Visser GHA. Pattern of the normal human
fetal heart rate. Br J Obstet Gynaecol 1982; 89(4):276-284.
4. Pieri JF, Crowe JA, Hayes-Gill BR, Spencer CJ, Bhogal K, James DK. Compact long-term
recorder for the transabdominal foetal and maternal electrocardiogram. Med Biol Eng
Comput 2001; 39(1):118-125.
5. De Vries JIP, Visser GHA, Mulder EJH, Prechtl HFR. Diurnal and other variations in fetal
movement and heart rate patterns at 20-22 weeks. Early Hum Dev 1987; 15(6):333-
348.
6. Patrick J, Campbell K, Carmichael L, Natale R, Richardson B. Daily relationships
between fetal and maternal heart rates at 38 to 40 weeks of pregnancy. Can Med
Assoc J 1981; 124(9):1177-1178.
7. Visser GHA, Goodman JD, Levine DH, Dawes GS. Diurnal and other cyclic variations in
human fetal heart rate near term. Am J Obstet Gynecol 1982; 142(5):535-544.
8. Kariniemi V, Hukkinen K, Katila T, Laine H. Quantification of fetal heart rate variability
by abdominal electrocardiography. J Perinat Med 1979; 7(1):27-32.
9. Solum T, Ingemarsson I, Nygren A. The accuracy of abdominal ECG for fetal electronic
monitoring. J Perinat Med 1980; 8(3):142-149.
Graatsma_PROEF (all).ps Front - 14 T1 - Black CyanMagentaYellow

28 Monitoring of fetal heart rate and uterine activity
Graatsma_PROEF (all).ps Back - 14 T1 - Black CyanMagentaYellow
Chapter 3: Maternal BMI and fetal electrocardiography 29
Chapter 3
Maternal Body Mass Index does not
affect performance of fetal
electrocardiography
E. M. Graatsma
J. Miller
E. J. H. Mulder
C. Harman
A. A. Baschat
G. H. A. Visser
Published: American Journal of Perinatology 2010 Aug;27(7):573-7.
Graatsma_PROEF (all).ps Front - 15 T1 - Black CyanMagentaYellow

30 Monitoring of fetal heart rate and uterine activity
Graatsma_PROEF (all).ps Back - 15 T1 - Black CyanMagentaYellow

Chapter 3: Maternal BMI and fetal electrocardiography 31
Maternal Body Mass Index does not affect
performance of fetal electrocardiography
Abstract
Objective The obesity epidemic challenges traditional antenatal fetal heart rate (FHR)
monitoring technologies. Doppler signals in particular are attenuated. We sought to
evaluate whether the performance of a novel transabdominal fetal-ECG (fECG) device
(AN24, Monica Healthcare) is influenced by Body Mass Index (BMI).
Study Design Prospective observational study of singleton pregnancies (gestational age;
GA; 20–41 weeks) monitored overnight with fECG. Recording quality (RQ; %) of both the
best hour and the total recording time of the FHR-record were related to BMI.
Results 204 women were monitored. BMI ranged from 16.0–50.7 (median BMI 26.9). The
correlation coefficient (r; with 95% confidence interval (CI)) between BMI and RQ was -
0.35 (CI -0.60; -0.03) for the gestational age group 20+0
-25+6
weeks, -0.08 (CI -0.28; 0.13)
for GA 26+0
-33+6
weeks, and -0.20 (CI -0.40; 0.03) for GA group ≥34+0
weeks. Median RQ in
obese women (BMI ≥30kg/m2) was 97.4%, 98.9% and 100%, respectively.
Conclusion BMI has no clinically significant influence on recording quality of FHR
monitored with fECG. It can therefore be considered a good method for monitoring the
fetal condition in pregnancies of obese women.
Introduction
Obesity in pregnancy is associated with a higher incidence of complications, including
spontaneous abortions, fetal malformations, fetal macrosomia, preeclampsia,
(gestational) diabetes, preterm birth, stillbirth, induction of labour, and instrumental
delivery1,2
. The incidence of complications increases with the degree of obesity. Further
the prevalence of obesity among women of reproductive age has reached epidemic
proportions3,4
. Fetal monitoring is difficult in obese women because the body fat layer
interferes with all traditional surveillance modalities. Ultrasound is attenuated, hampering
simple biometry, fetal heart rate (FHR) monitoring, and Doppler velocimetry. This is
demonstrated in the literature by an increase in the rate of suboptimal ultrasound
visualization of fetal cardiac structures by 50% and of craniospinal structures by 31%5.
An alternative to traditional Doppler ultrasound based cardiotocography (CTG) is the
transabdominal fetal electrocardiogram (fECG). With this technique intra-abdominal
electrical activity is recorded using skin electrodes on the maternal abdomen. The signals
derived from the fetal heart are then extracted to display a continuous record of the fetal
heart rate. The validity and feasibility of this technique using a novel portable five
Graatsma_PROEF (all).ps Front - 16 T1 - Black CyanMagentaYellow

32 Monitoring of fetal heart rate and uterine activity
electrode system, (AN24, Monica Healthcare, Nottingham, UK) has been described
elsewhere6. Because the fECG utilizes a fundamentally different modality, it may
overcome the limitations of Doppler FHR monitoring in obese women. We studied the
influence of BMI on the performance of this novel fetal ECG device in the second half of
pregnancy.
Materials and Methods
A prospective observational study was conducted at the University Medical Center
Utrecht, The Netherlands, and at the University of Maryland, Baltimore, United States.
The study was approved by the local medical ethical committees. Women appearing for
fetal assessment with singleton pregnancies between 20 – 42 weeks of gestation were
eligible. Exclusion criteria were multiple gestation and congenital malformations. Women
were recruited for a single overnight recording, either at home (low risk pregnancies) or in
the hospital (high risk pregnancies). After informed consent was obtained, recordings
were performed overnight, during sleep, to minimize maternal abdominal muscle activity
that can distort the fECG signal. Using the AN24, the fECG signal was extracted from the
electrophysiological signal measured over the maternal abdomen using five disposable
electrodes. The electrodes were placed on the abdomen in a standardized manner,
independent of fetal positioning6. As recording begins, the AN24 indicates receipt of a
valid electrical signal. Maternal mobility was not restricted during monitoring. After
recording is completed, the electrodes are removed and the data are downloaded from
the portable device into the computer. The derived fECG signal is converted into
continuous FHR (Figure 1). The computer output of the data is identical to the FHR pattern
derived from standard, Doppler derived, electronic fetal monitoring techniques. The
methodology used for the signal extraction and analysis has been described in detail by
Pieri et al7.
Quality Analysis
Recording quality (RQ) was defined as the percentage of continuous fECG data per hour of
monitoring. During the period between 11pm – 7am, each one hour epoch of the tracing
was analyzed and median RQ for total recording time was calculated. As well, the hour
with the highest RQ within each recording was defined as the “best hour”.
Previous research described differences in RQ in relation to gestational age probably due
to the formation of the vernix caseosa6,8
. As the lowest quality was found between 26-34
weeks gestation, data in this study were analyzed in three gestational age subgroups (20+0
– 25+6
weeks, 26+0
–33+6
weeks and 34+0
weeks – term). The Body mass Index (BMI) was
calculated using the maternal weight and height at the time of recording.
Graatsma_PROEF (all).ps Back - 16 T1 - Black CyanMagentaYellow

Chapter 3: Maternal BMI and fetal electrocardiography 33
Figure 1: Computer output of fetal heart rate (FHR; upper trace) and maternal heart rate (MHR;
lower trace) are displayed in the users preferred ‘paper speed’. The lower frame shows the
compressed data for trend analysis.
Table 1: Study population characteristics
Gestational Age 20+0
– 25+6
N=38 (19%)
26+0
– 33+6
N=92 (45%)
34+0
– term
N=74 (36%)
Total
N=204
Median GA 23+6
30+6
36+4
31+3
BMI (kg/m2)
Median
Range
BMI Subgroups (n; %)
≤ 24.9 kg/m2
25.0 – 29.9 kg/m2
≥ 30.0 kg/m2
26.7
(22.1–50.7)
15 (39)
15 (39)
8 (22)
26.0
(19.4–42.2)
37 (40)
35 (38)
20 (22)
28.3
(16.0–41.1)
17 (23)
41 (55)
16 (22)
26.9
(16.0–50.7)
69
91
44
Abbreviations: GA: gestational age; BMI: body mass index.
Graatsma_PROEF (all).ps Front - 17 T1 - Black CyanMagentaYellow

34 Monitoring of fetal heart rate and uterine activity
Statistics
Results were summarized with the use of standard descriptives for non-parametric tests:
medians, and (interquartile) ranges. Spearman correlation (r; 95% confidence interval) was
used to evaluate the relationship between BMI and recording quality. For the main
analysis BMI is analysed as a continuous variable. For descriptive purposes BMI is
described as categorical value. (Table 1: BMI; normal weight ≤24.9 kg/m2, overweight 25.0
– 29.9 kg/m2, obesity ≥ 30.0 kg/m2). The distribution of RQ values relative to gestational
age groups was compared with the Kruskal-Wallis test. SPSS for Windows (version 15.01,
SPSS Inc., Chicago, III.) was used for statistical analysis. Significance was defined as a p
value <0.05.
Results
Two hundred and four women underwent a single overnight fECG recording. One hundred
and sixteen low-risk women were recorded at home, and 88 women with maternal or
fetal complications of pregnancy were recorded in the hospital. BMI of patients ranged
from 16-50.7 kg/m2. The medians and ranges of BMI in each gestational age subgroup are
described in Table 1.
For the total analyzed recording time (11pm-7am) the median recording quality was 92.3%
(interquartile range; IQR = 79.4% - 97.9%). Neither fetal position nor fetal- or maternal
condition affected RQ. A significant difference in RQ between subgroups for gestational
age was found for both the total recording time, and the ‘best hour’ of recording (Table 2;
Kruskal-Wallis: H(3) = 31.96, p<0.001, H(3) = 13.1, p= 0.001, respectively). Therefore,
further analysis was done for the gestational age subgroups independently. The median
RQ for the ‘best hour’ within all recordings was 100% (IQR: 97.8%–100%). For an indirect
comparison with standard practice, where the analysis is based on the best ‘readable CTG
trace’, the ‘best hour’ of fECG recording will be used in further analyses rather than the RQ
values of the total recording. The RQ ‘best hour’ values for the GA subgroups are displayed
in Table 2 and Figures 2a-2c.
Recording quality did correlate negatively with BMI in the periviable group (20+0
– 25+6
weeks; r= -0.35, CI [-0.60; -0.03], p=0.04), but not in later gestation (Table 2). However, RQ
for the ‘best hour’ reached high values, even in obese women (BMI≥30 kg/m2). In early
gestation (20+0
– 25+6
weeks) the median ‘best hour’ RQ was 97.4%, increasing to 98.9%
and 100% in the next gestational age windows (Table 2). Given the fact that most results
are close to 100% and the distribution along the effect was quite small, the effect of BMI
categories on RQ per GA group was also analysed using a non parametric test (Kruskal-
Wallis; Table 2).
In 4/44 women with a BMI ≥ 30 kg/m2 the RQ of the ‘best hour’ did not reach 60%; three
of them were in the GA subgroup 26+0
–33+6
weeks.
Graatsma_PROEF (all).ps Back - 17 T1 - Black CyanMagentaYellow
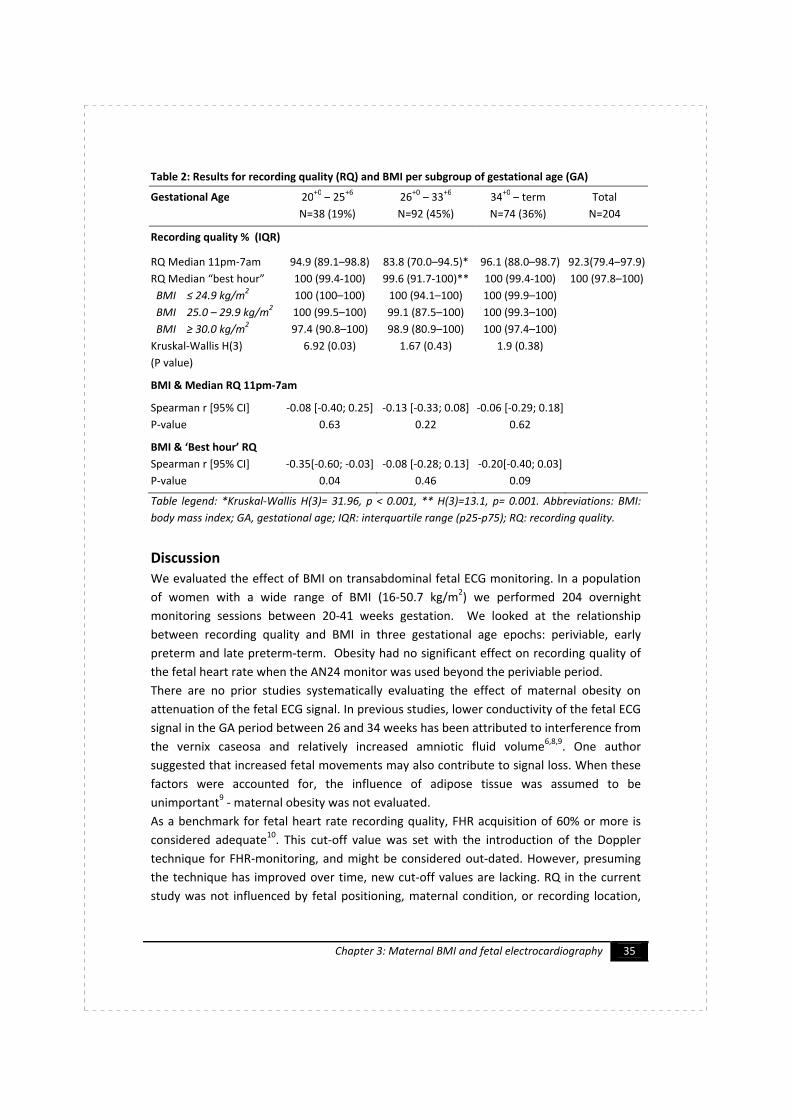
Chapter 3: Maternal BMI and fetal electrocardiography 35
Table 2: Results for recording quality (RQ) and BMI per subgroup of gestational age (GA)
Gestational Age 20+0
– 25+6
N=38 (19%)
26+0
– 33+6
N=92 (45%)
34+0
– term
N=74 (36%)
Total
N=204
Recording quality % (IQR)
RQ Median 11pm-7am
RQ Median “best hour”
BMI ≤ 24.9 kg/m2
BMI 25.0 – 29.9 kg/m2
BMI ≥ 30.0 kg/m2
Kruskal-Wallis H(3)
(P value)
94.9 (89.1–98.8)
100 (99.4-100)
100 (100–100)
100 (99.5–100)
97.4 (90.8–100)
6.92 (0.03)
83.8 (70.0–94.5)*
99.6 (91.7-100)**
100 (94.1–100)
99.1 (87.5–100)
98.9 (80.9–100)
1.67 (0.43)
96.1 (88.0–98.7)
100 (99.4-100)
100 (99.9–100)
100 (99.3–100)
100 (97.4–100)
1.9 (0.38)
92.3(79.4–97.9)
100 (97.8–100)
BMI & Median RQ 11pm-7am
Spearman r [95% CI]
P-value
-0.08 [-0.40; 0.25]
0.63
-0.13 [-0.33; 0.08]
0.22
-0.06 [-0.29; 0.18]
0.62
BMI & ‘Best hour’ RQ
Spearman r [95% CI]
P-value
-0.35[-0.60; -0.03]
0.04
-0.08 [-0.28; 0.13]
0.46
-0.20[-0.40; 0.03]
0.09
Table legend: *Kruskal-Wallis H(3)= 31.96, p < 0.001, ** H(3)=13.1, p= 0.001. Abbreviations: BMI:
body mass index; GA, gestational age; IQR: interquartile range (p25-p75); RQ: recording quality.
Discussion
We evaluated the effect of BMI on transabdominal fetal ECG monitoring. In a population
of women with a wide range of BMI (16-50.7 kg/m2) we performed 204 overnight
monitoring sessions between 20-41 weeks gestation. We looked at the relationship
between recording quality and BMI in three gestational age epochs: periviable, early
preterm and late preterm-term. Obesity had no significant effect on recording quality of
the fetal heart rate when the AN24 monitor was used beyond the periviable period.
There are no prior studies systematically evaluating the effect of maternal obesity on
attenuation of the fetal ECG signal. In previous studies, lower conductivity of the fetal ECG
signal in the GA period between 26 and 34 weeks has been attributed to interference from
the vernix caseosa and relatively increased amniotic fluid volume6,8,9
. One author
suggested that increased fetal movements may also contribute to signal loss. When these
factors were accounted for, the influence of adipose tissue was assumed to be
unimportant9 - maternal obesity was not evaluated.
As a benchmark for fetal heart rate recording quality, FHR acquisition of 60% or more is
considered adequate10
. This cut-off value was set with the introduction of the Doppler
technique for FHR-monitoring, and might be considered out-dated. However, presuming
the technique has improved over time, new cut-off values are lacking. RQ in the current
study was not influenced by fetal positioning, maternal condition, or recording location,
Graatsma_PROEF (all).ps Front - 18 T1 - Black CyanMagentaYellow

36 Monitoring of fetal heart rate and uterine activity
even in obese women. This suggests that the technology may be widely applicable and
technically feasible for resting patients.
BMI has no significant effect on RQ except in the periviable period. The reason for this
gestational age effect is unclear. Because FHR monitoring is uncommon this early in
pregnancy, and the overall recording quality is high, we consider this finding not clinically
relevant.
Basing the analysis on the ‘best hour’ of recording may introduce bias, as this does
account for the total time required to obtain one best hour. However, our recordings were
all performed at fixed (overnight) times and an effect of BMI on median RQ (total
recording time) was absent (Table 2). Furthermore, the start-times for the best hours
were defined by the clock rather than determined by the best RQ in a moving window of
60 minutes. Finally, in our study, the AN24 fECG monitor was applied and the recording
was completed before RQ was assessed.
Figure 2: ‘Best hour’ RQ per recording and BMI with Spearman r and 95% confidence interval for
gestational age subgroups 20+0
-25+6
weeks (figure A: n=38), 26+0-33+6 weeks (figure B: n=92), and
> 34+0 weeks (figure C: n=74).
A B
C
Graatsma_PROEF (all).ps Back - 18 T1 - Black CyanMagentaYellow

Chapter 3: Maternal BMI and fetal electrocardiography 37
If monitoring with the AN24 fECG monitor was inadequate, there was no opportunity for
adjustment as there was no real time display. Finally, there is no literature available
evaluating the effect of obesity on Doppler-CTG monitoring.
The fECG technique still bears some limitations as the attenuation of the fECG by
abdominal muscle activity may limit clinical situations where the AN24 can be used, such
as during active labour, when accurate monitoring is especially important. This restricts
the use of the AN24 to the antepartum period and/or first phase of labour.
Conclusion
The prevalence of obesity among women in the reproductive age is rising. Maternal
obesity is associated with complications which may require frequent monitoring.
Unfortunately, obesity impairs the quality of current recording methods using ultrasound
technology. Our findings demonstrate that FHR monitoring using a fECG monitor can be
considered an adequate alternative to Doppler CTG during a restful state in these high-risk
pregnancies.
Graatsma_PROEF (all).ps Front - 19 T1 - Black CyanMagentaYellow

38 Monitoring of fetal heart rate and uterine activity
Acknowledgement
The authors would like to thank Monica Healthcare Ltd (www.monicahealthcare.com) for
the provision of the FECG holter systems and support during this study. This study is partly
supported financially by an unconditional grant from Monica Healthcare, Nottingham, UK.
Reference List
1. Galtier F, Raingeard I, Renard E, Boulot P, Bringer J. Optimizing the outcome of
pregnancy in obese women: from pregestational to long-term management. Diabetes
Metab 2008 February;34(1):19-25.
2. Yogev Y, Visser GHA. Obesity, gestational diabetes and pregnancy outcome. Semin
Fetal Neonatal Med 2009;14: 77-84
3. Chu SY, Kim SY, Bish CL. Prepregnancy Obesity Prevalence in the United States, 2004-
2005. Matern Child Health J 2009 September;13(5):614-20.
4. Ogden CL, Carroll MD, Curtin LR, McDowell MA, Tabak CJ, Flegal KM. Prevalence of
overweight and obesity in the United States, 1999-2004. JAMA 2006 April
5;295(13):1549-55.
5. Hendler I, Blackwell SC, Bujold E et al. The impact of maternal obesity on midtrimester
sonographic visualization of fetal cardiac and craniospinal structures. Int J Obes Relat
Metab Disord 2004 December;28(12):1607-11.
6. Graatsma EM, Jacod BC, van Egmond LA, Mulder EJH, Visser GHA. Fetal
electrocardiography: feasibility of long-term fetal heart rate recordings. BJOG 2009
January;116(2):334-7.
7. Pieri JF, Crowe JA, Hayes-Gill BR, Spencer CJ, Bhogal K, James DK. Compact long-term
recorder for the transabdominal foetal and maternal electrocardiogram. Med Biol Eng
Comput 2001 January;39(1):118-25.
8. Peters M, Crowe J, Pieri JF et al. Monitoring the fetal heart non-invasively: a review of
methods. J Perinat Med 2001;29(5):408-16.
9. Stinstra JG, Peters MJ. The influence of fetoabdominal tissues on fetal ECGs and
MCGs. Arch Physiol Biochem 2002 July;110(3):165-76.
10. Dawes GS, Visser GHA, Goodman JD, Redman CW. Numerical analysis of the human
fetal heart rate: the quality of ultrasound records. Am J Obstet Gynecol 1981
September 1;141(1):43-52.
Graatsma_PROEF (all).ps Back - 19 T1 - Black CyanMagentaYellow

Chapter 4: Acceleration and deceleration capacity of FHR in normal and IUGR pregnancies 39
Chapter 4
Average acceleration and
deceleration capacity of fetal heart
rate in normal pregnancy and in
pregnancies complicated by
intrauterine growth restriction
E. M. Graatsma
E. J. H. Mulder
S. M. Lobmaier
S. Pildner von Steinburg
K. T. M. Schneider
G. Schmidt
G. H. A. Visser
Submitted for publication
Graatsma_PROEF (all).ps Front - 20 T1 - Black CyanMagentaYellow

40 Monitoring of fetal heart rate and uterine activity
Graatsma_PROEF (all).ps Back - 20 T1 - Black CyanMagentaYellow

Chapter 4: Acceleration and deceleration capacity of FHR in normal and IUGR pregnancies 41
Average acceleration and deceleration capacity of
fetal heart rate in normal pregnancy and in
pregnancies complicated by intrauterine growth
restriction
Abstract Background Although a variety of antenatal tests is available to monitor pregnancies
complicated by intrauterine growth restriction (IUGR), decision making based on antenatal
test results towards expectant management or (preterm) delivery remains difficult.
Differentiation between contributions of the cardio-acceleratory and cardio-inhibitory
components of the nervous system on fetal heart rate (FHR) regulation may offer a more
specific assessment of the IUGR fetus.
Objective To study FHR, its short term variability (STV), average acceleration capacity
(AAC) and average deceleration capacity (ADC) throughout uncomplicated gestation, and
to perform a preliminary comparison of these FHR parameters between IUGR and control
fetuses.
Study design Prospective observational study of FHR recordings as obtained with a fetal-
ECG recorder in second half of uncomplicated (n=90) and IUGR (n=30) pregnancy. FHR and
STV were calculated according to established analysis. True beat-to-beat FHR, recorded at
1ms accuracy, was used to calculate AAC and ADC using Phase Rectified Signal Averaging
(PRSA). Mean values of the FHR, STV, AAC, and ADC from recordings in IUGR pregnancies
were plotted in the reference curves as obtained from control recordings.
Results AAC and ADC remained relatively constant throughout gestation, whereas FHR
decreased and STV increased with advancing gestation. 36% of AAC and ADC values were
below the 2.5th percentile in IUGR pregnancies, compared to 8% of STV values (p<0.05;
Fisher exact test). The degree of umbilical artery Doppler abnormalities did not contribute
to the level of deviation of FHR parameters.
Conclusions Analysis of the AAC and ADC as recorded with a high resolution fECG recorder
may differentiate better between normal and IUGR fetuses than STV. Whether this
indicates that AAC or ADC represent a more sensitive parameter of fetal compromise
compared to the currently used fetal parameter (STV) remains to be elucidated in future
studies with longitudinal follow up of IUGR fetuses.
Graatsma_PROEF (all).ps Front - 21 T1 - Black CyanMagentaYellow

42 Monitoring of fetal heart rate and uterine activity
Introduction
There are a number of antenatal assessment techniques which are suitable for the
diagnosis, classification and monitoring of pregnancies complicated by intra uterine
growth restriction (IUGR): assessment of fundal height, kick-charts, ultrasound biometry,
pulsatility index of the umbilical artery (PI UA) and fetal heart rate (FHR) testing. With
progressive deterioration of the fetal condition a certain rank order can be determined in
which test results become abnormal1-5
. While it is relatively easy to recognize the severely
IUGR fetus in poor condition, difficulties are encountered with the vast majority of IUGR
fetuses that exhibit less severe degrees of compromise. Furthermore, the rank order of
fetal assessment holds especially for the preterm period, as near term most Doppler
indices are not particularly suitable3,6,20
.
Early studies of FHR monitoring in IUGR fetuses have demonstrated that the presence and
amplitude of accelerations in IUGR fetuses after 30 weeks’ gestation is comparable to
those of healthy fetuses before 30 weeks’ gestation7. This might indicate a delay in
functional maturation of the beta-sympathetic (cardio-acceleratory) nervous system due
to chronic nutritional deprivation and hypoxemia5,7
. FHR decelerations appear after a
gradual decrease in FHR variability and are considered a late sign of fetal impairment8,9
. In
case of mild hypoxemia the presence and duration of decelerations are comparable to
those in healthy fetuses. It has therefore been suggested that the parasympathetic
(cardio-inhibitory) system is probably not affected to the same extent as is the
sympathetic tone7.
Differentiation between contributions of the sympathetic and parasympathetic branches
of the nervous system on FHR regulation may offer a more specific assessment of the
(term) IUGR fetus. Such a differentiation is feasible using a signal processing technique
called phase rectified signal averaging (PRSA). This technique provides separate
characterizations of acceleration-related (sympathetic) and deceleration-related
(parasympathetic) modulations in FHR, quantified by ‘average acceleration capacity’ (AAC)
and ‘average deceleration capacity’ (ADC), respectively10
. The PRSA methodology, proven
to provide better prediction of survival in patients suffering myocardial infarction in adult
cardiology, is currently gaining interest in fetal medicine11,12
. Results from a pilot study
indicated that the AAC, calculated from FHR recorded with Doppler cardiotocography
(CTG), has the potential to provide better differentiation between normal and
compromised fetuses compared to the calculation of short term variability (STV)11,12
.
Although this study demonstrated promising results, PRSA analysis of FHR recorded with
CTG is not recommended, since conventional Doppler CTG devices have a low sample rate
of 4 Hz and average FHR through a process of autocorrelation13
. A preferable method for
PSRA analysis of FHR is available using a high resolution fetal-ECG recorder, offering true
beat-to-beat FHR with an accuracy of 1 ms due to a high sample rate of 1000 Hz. Since it is
assumed that true beat-to-beat FHR provides a more accurate assessment of fetal
cardiovascular (patho-) physiology compared to conventional Doppler FHR14
, PRSA
Graatsma_PROEF (all).ps Back - 21 T1 - Black CyanMagentaYellow

Chapter 4: Acceleration and deceleration capacity of FHR in normal and IUGR pregnancies 43
analysis of true beat-to-beat FHR may offer an even better recognition of the
compromised IUGR fetus.
Is was the objective of this investigation to study FHR, its short term variability, AAC and
ADC throughout normal gestation as recorded with a high resolution fetal-ECG monitor,
and to perform a preliminary comparison of these FHR parameters between IUGR and
normal fetuses.
Methods
Study design and participants
A prospective observational study was performed from December 2006 until July 2008 at
the University Medical Center Utrecht, The Netherlands. The study was approved by the
local Institutional Review Board. Women with singleton pregnancies between 20 and 42
weeks gestation were considered eligible for participation. Exclusion criteria were multiple
gestation and pregnancies complicated by congenital malformations and/or chromosomal
abnormalities.
The control group consisted of 90 healthy women at 20-40 weeks’ gestation at study
entry. These pregnancies remained uncomplicated and no medication was administered.
Thirty women with pregnancies complicated by intra uterine growth restriction were
approached to participate in the study. For all participants, the pregnancies were reliably
dated using the last menstrual period and/or by early ultrasound scan. After informed
consent was obtained a single overnight FHR recording (17:00 – 08:00 h) was performed,
either at home (controls) or in hospital (IUGR). Maternal co-morbidities and treatment,
fetal characteristics (ultrasound measurements) and neonatal characteristics were noted
from the women’s medical charts.
Intra uterine growth restriction
IUGR was defined as estimated fetal weight ≤10th percentile, and birth weight ≤10
percentile corrected for gestational age (GA), sex and parity15
. In some women IUGR was
accompanied by hypertensive disorders. All women were admitted to the antenatal care
unit and received daily computerized FHR monitoring, twice weekly Doppler
measurements (pulsatility index of the umbilical artery; PI UA), and every two weeks
ultrasound measurements of fetal biometry.
Subgroups of IUGR pregnancies were made to distinguish between the different degrees
of fetal compromise based on PI UA. Both the results from the PI UA before and after
study participation (if present) were retrieved from the women’s chart. The first group
was defined as IUGR fetuses with normal PI UA both before and after participation in this
study. The second group had normal PI UA before participation, but showed progressive
deterioration with abnormal PI UA later in gestation. Finally, the third group consisted of
IUGR fetuses with abnormal PI UA (> 2SD, GA related) before and after participation.
Graatsma_PROEF (all).ps Front - 22 T1 - Black CyanMagentaYellow
44 Monitoring of fetal heart rate and uterine activity
FHR analysis and parameters
FHR recordings were performed with the AN24 fetal ECG monitor (Monica Healthcare,
Nottingham, UK). The electrophysiological signal contains the maternal ECG (mECG), fetal
ECG (fECG) and noise, and is recorded with a sample frequency of 1000 Hz using 5
disposable electrodes placed on the maternal abdomen in a standardized manner14
. The
methodology used for fECG signal extraction and analysis has been described in detail by
Pieri et al16
. Fetal ECG complexes were used to calculate true beat-to-beat (R-R) pulse
intervals with an accuracy of approximately 1 millisecond. Short term variability (in
milliseconds) was calculated from the derived FHR according to the analysis described by
Dawes et al.13
.
For differentiation between the contributions of the parasympathetic and sympathetic
branches, a signal processing technique called phase rectified signal averaging (PRSA) was
used. PRSA provides separate characterizations of acceleration-related and deceleration-
related modulations in FHR, quantified by average acceleration capacity (AAC) and
average deceleration capacity (ADC), respectively10
. The methodology has been described
in detail by Bauer et al. and is summarized in Figure 110
.
FHR recordings lasted for approximately 15 hours (17:00 – 08:00 h). For the present study
we selected for analysis the time frame between 23:00 and 06:00h, since signal loss is
known to be lowest during that period14
. Cases with signal loss that exceeded 50% of time
were excluded from analysis.
Statistics
SPSS for Windows (version 15.01, SPSS Inc., Chicago, Ill.) was used for statistical analysis.
Results were summarized with the use of standard descriptives for parametric or non-
parametric tests, where appropriate. For both uncomplicated and IUGR pregnancies the
mean basal FHR, STV, ADC and AAC values were calculated over the selected time period
(23:00-06:00).
A linear regression model was estimated using a FHR parameter (basal FHR, STV, AAC,
ADC) and potential confounders (neonatal sex and gestational age; linear, quadratic and
cubic functions were tested) to calculate reference percentiles. The reference ranges
were compared to established normograms for FHR/STV as reported in literature17,18
.
Mean values of the FHR parameters from recordings in IUGR pregnancies were then
plotted against the obtained reference curves.
Results
The control group had a median gestational age at FHR recording of 34 weeks (range 21-
40 weeks). All neonates were born after 36 weeks’ gestation (median 39+2
weeks, range
36+1
– 41+6
weeks). Median birth weight was 3170 grams (range 2660-4650 grams). All
neonates had a birth weight >10th percentile for GA according to customized growth
charts15
. Five FHR recordings were excluded from the analysis due to poor signal quality.
Graatsma_PROEF (all).ps Back - 22 T1 - Black CyanMagentaYellow
Chapter 4: Acceleration and deceleration capacity of FHR in normal and IUGR pregnancies 45
Reference curves of FHR, STV, AAC and ADC were constructed for this control group
(n=85).
The IUGR fetuses eligible for the study had a median gestational age at participation of
31+6
weeks (range 27+0
- 36+2
weeks). Two out of 30 fetuses were excluded due to
congenital malformations and/or chromosomal abnormalities diagnosed at delivery, and
in 3/30 the derived FHR data was not suitable for analysis due to high signal loss. The
characteristics of the remaining 25 IUGR pregnancies are displayed in Table 1.
Neonatal sex did not contribute significantly to the regression model and was therefore
not included. Gestational age (either linear or with linear and cubic components)
appeared to have a significant effect on FHR, STV, AAC, and ADC. The reference curves of
FHR, STV, AAC and ADC are displayed in Figures 2 A-D, with the coefficients used to
construct these figures displayed in Table 2. FHR decreased with advancing gestation,
whereas short term variability increased in early gestation with stable values around term.
The reference curve of FHR was comparable to those described previously in a large cross-
sectional and a smaller longitudinal study, respectively17,18
. Short term variability in our
dataset was higher in early gestation as compared to the published normal curves17,18
.
Although gestational age (linear and cubic functions) showed significant contributions to
the regression models of AAC and ADC, both parameters remained relatively constant
throughout pregnancy (Figure 2 C-D).
In all IUGR fetuses, except one, mean FHR was within the boundaries of the reference
curves. Short term variability was below the 2.5th percentile in 2/25 (8%) fetuses, while
both the AAC and ADC values of IUGR fetuses were below the 2.5th percentile in 9/25
(36%), which was significantly more frequent compared with the STV values (P < 0.05;
Fisher exact test). Inconsistent patterns were found when the PI UA was plotted against
the various FHR parameters (Figure 2 A-D). It is noteworthy that 3/9 of the IUGR fetuses
with AAC (and 3/9 with ADC -) values ≤ 2.5th percentile had received antenatal steroids ≤
3 days prior to study participation.
Graatsma_PROEF (all).ps Front - 23 T1 - Black CyanMagentaYellow
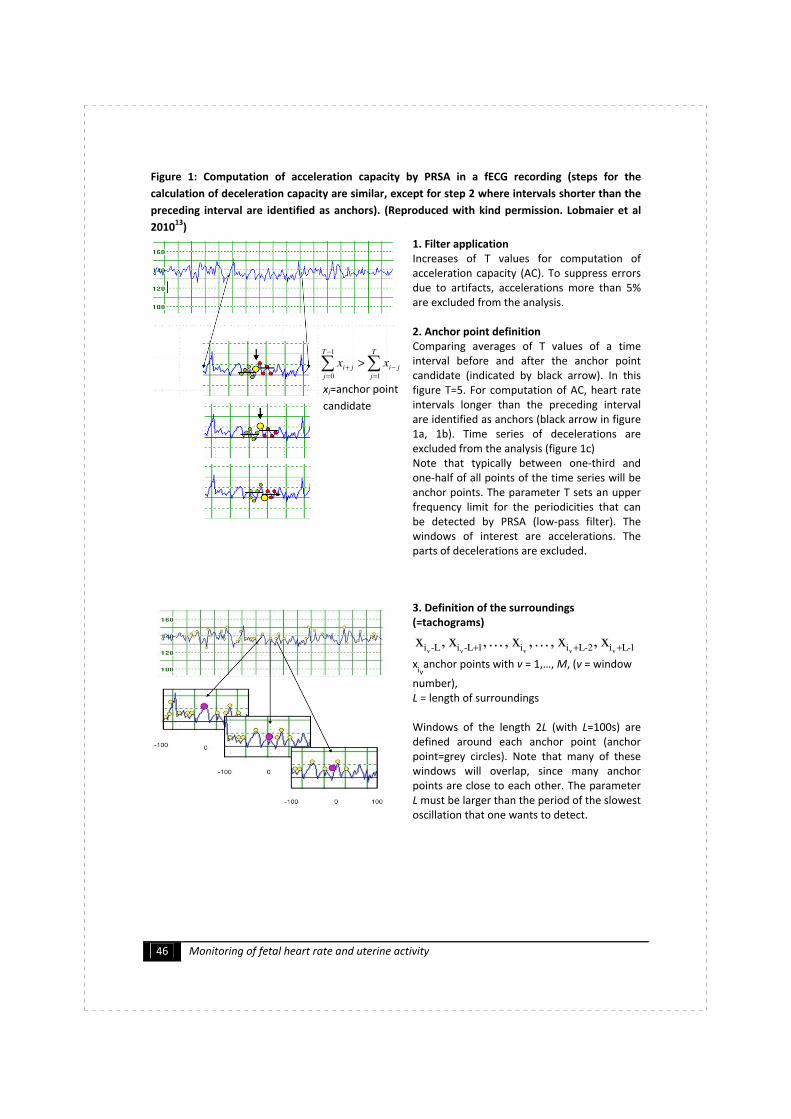
46 Monitoring of fetal heart rate and uterine activity
Figure 1: Computation of acceleration capacity by PRSA in a fECG recording (steps for the
calculation of deceleration capacity are similar, except for step 2 where intervals shorter than the
preceding interval are identified as anchors). (Reproduced with kind permission. Lobmaier et al
201013
)
1. Filter application
Increases of T values for computation of
acceleration capacity (AC). To suppress errors
due to artifacts, accelerations more than 5%
are excluded from the analysis.
2. Anchor point definition
Comparing averages of T values of a time
interval before and after the anchor point
candidate (indicated by black arrow). In this
figure T=5. For computation of AC, heart rate
intervals longer than the preceding interval
are identified as anchors (black arrow in figure
1a, 1b). Time series of decelerations are
excluded from the analysis (figure 1c)
Note that typically between one-third and
one-half of all points of the time series will be
anchor points. The parameter T sets an upper
frequency limit for the periodicities that can
be detected by PRSA (low-pass filter). The
windows of interest are accelerations. The
parts of decelerations are excluded.
3. Definition of the surroundings
(=tachograms)
1-Li2-Lii1L-iL-i vvvvv x, x, . . . , x, . . . , x,x
+++
xiv
anchor points with v = 1,…, M, (v = window
number),
L = length of surroundings
Windows of the length 2L (with L=100s) are
defined around each anchor point (anchor
point=grey circles). Note that many of these
windows will overlap, since many anchor
points are close to each other. The parameter
L must be larger than the period of the slowest
oscillation that one wants to detect.
xi=anchor point
candidate
∑∑=
−
−
=
+>
T
j
ji
T
j
ji xx1
1
0
Graatsma_PROEF (all).ps Back - 23 T1 - Black CyanMagentaYellow

Chapter 4: Acceleration and deceleration capacity of FHR in normal and IUGR pregnancies 47
4. Phase Rectification
Tachograms are aligned at the anchors
(interlined circles). All the periodicities are
superposed at the center. Averaging over all
windows.
5. Signal averaging
The phase-rectified signal averaging is
obtained by averaging over all windows
aligned to each other with the anchor points
(grey circle) at the center. Nonperiodic
components that are not phase-synchronized
with the anchor points cancel out. Only events
that have a fixed phase relationship with the
anchor points (all periodicities or quasi-
periodicities) “survive” the procedure.
6. Quantification of Average Acceleration
Capacity (AAC):
The central amplitude is a measure for the
dynamic capacity of the whole system. It
characterizes the average capacity of the heart
to accelerate the cardiac rhythm from one
beat to the next. FHR variation reflects
complex non-linear dynamics, a loss of which
is a sign of reduced reactivity and adaptability,
indicating fetal distress.
AAC: the difference of the
mean of X values after the
anchor point (i=0 until i=X-1)
and the mean of X values
()
− ()
=
Graatsma_PROEF (all).ps Front - 24 T1 - Black CyanMagentaYellow
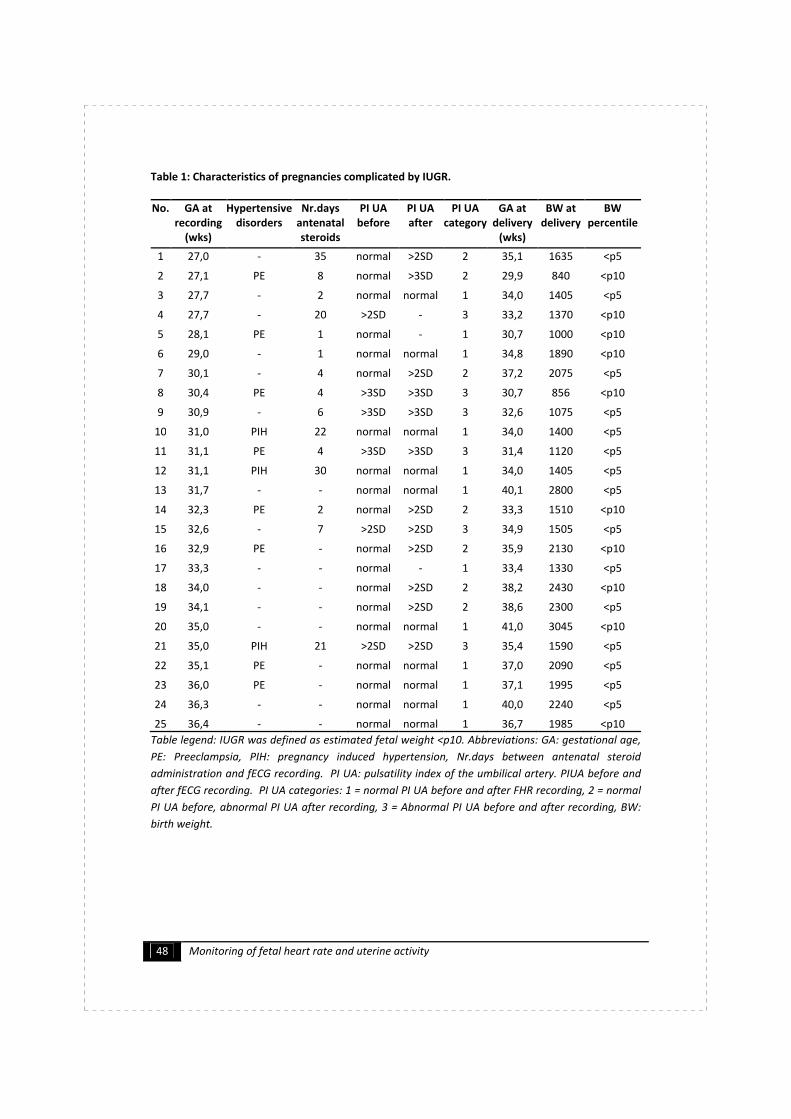
48 Monitoring of fetal heart rate and uterine activity
Table 1: Characteristics of pregnancies complicated by IUGR.
No. GA at
recording
(wks)
Hypertensive
disorders
Nr.days
antenatal
steroids
PI UA
before
PI UA
after
PI UA
category
GA at
delivery
(wks)
BW at
delivery
BW
percentile
1 27,0 - 35 normal >2SD 2 35,1 1635 <p5
2 27,1 PE 8 normal >3SD 2 29,9 840 <p10
3 27,7 - 2 normal normal 1 34,0 1405 <p5
4 27,7 - 20 >2SD - 3 33,2 1370 <p10
5 28,1 PE 1 normal - 1 30,7 1000 <p10
6 29,0 - 1 normal normal 1 34,8 1890 <p10
7 30,1 - 4 normal >2SD 2 37,2 2075 <p5
8 30,4 PE 4 >3SD >3SD 3 30,7 856 <p10
9 30,9 - 6 >3SD >3SD 3 32,6 1075 <p5
10 31,0 PIH 22 normal normal 1 34,0 1400 <p5
11 31,1 PE 4 >3SD >3SD 3 31,4 1120 <p5
12 31,1 PIH 30 normal normal 1 34,0 1405 <p5
13 31,7 - - normal normal 1 40,1 2800 <p5
14 32,3 PE 2 normal >2SD 2 33,3 1510 <p10
15 32,6 - 7 >2SD >2SD 3 34,9 1505 <p5
16 32,9 PE - normal >2SD 2 35,9 2130 <p10
17 33,3 - - normal - 1 33,4 1330 <p5
18 34,0 - - normal >2SD 2 38,2 2430 <p10
19 34,1 - - normal >2SD 2 38,6 2300 <p5
20 35,0 - - normal normal 1 41,0 3045 <p10
21 35,0 PIH 21 >2SD >2SD 3 35,4 1590 <p5
22 35,1 PE - normal normal 1 37,0 2090 <p5
23 36,0 PE - normal normal 1 37,1 1995 <p5
24 36,3 - - normal normal 1 40,0 2240 <p5
25 36,4 - - normal normal 1 36,7 1985 <p10
Table legend: IUGR was defined as estimated fetal weight <p10. Abbreviations: GA: gestational age,
PE: Preeclampsia, PIH: pregnancy induced hypertension, Nr.days between antenatal steroid
administration and fECG recording. PI UA: pulsatility index of the umbilical artery. PIUA before and
after fECG recording. PI UA categories: 1 = normal PI UA before and after FHR recording, 2 = normal
PI UA before, abnormal PI UA after recording, 3 = Abnormal PI UA before and after recording, BW:
birth weight.
Graatsma_PROEF (all).ps Back - 24 T1 - Black CyanMagentaYellow
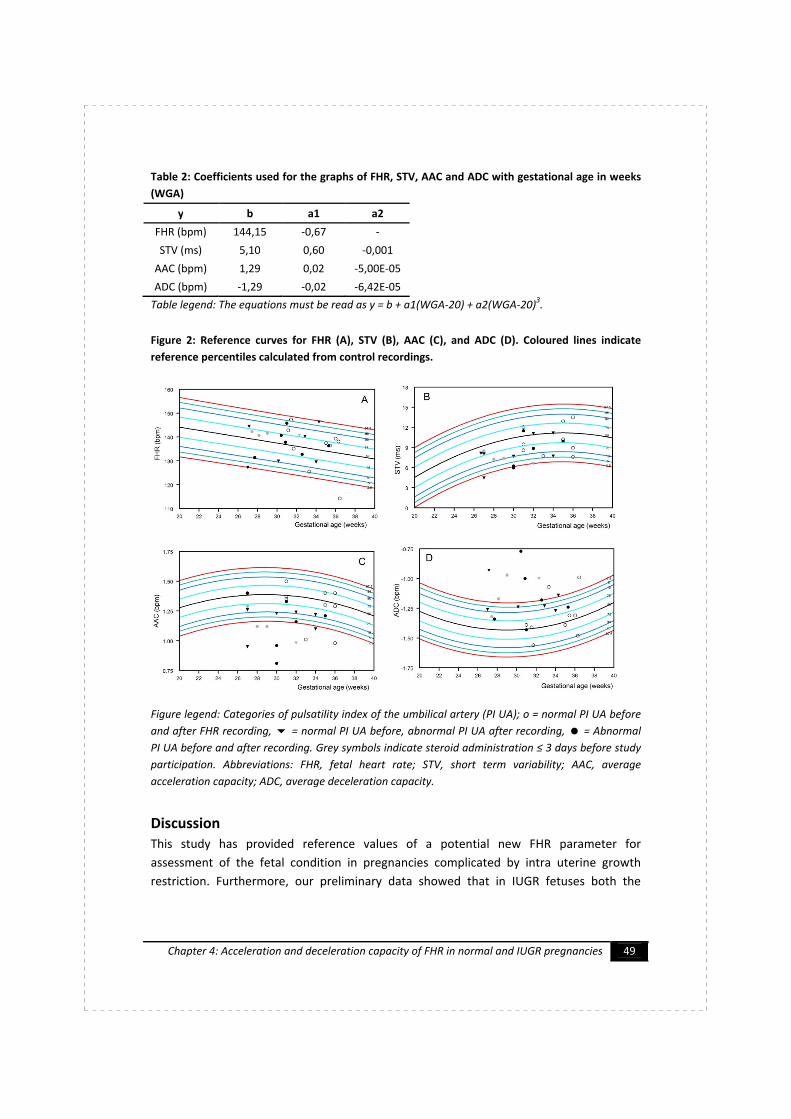
Chapter 4: Acceleration and deceleration capacity of FHR in normal and IUGR pregnancies 49
Table 2: Coefficients used for the graphs of FHR, STV, AAC and ADC with gestational age in weeks
(WGA)
y b a1 a2
FHR (bpm) 144,15 -0,67 -
STV (ms) 5,10 0,60 -0,001
AAC (bpm) 1,29 0,02 -5,00E-05
ADC (bpm) -1,29 -0,02 -6,42E-05
Table legend: The equations must be read as y = b + a1(WGA-20) + a2(WGA-20)3.
Figure 2: Reference curves for FHR (A), STV (B), AAC (C), and ADC (D). Coloured lines indicate
reference percentiles calculated from control recordings.
Figure legend: Categories of pulsatility index of the umbilical artery (PI UA); o = normal PI UA before
and after FHR recording, = normal PI UA before, abnormal PI UA after recording, = Abnormal
PI UA before and after recording. Grey symbols indicate steroid administration ≤ 3 days before study
participation. Abbreviations: FHR, fetal heart rate; STV, short term variability; AAC, average
acceleration capacity; ADC, average deceleration capacity.
Discussion
This study has provided reference values of a potential new FHR parameter for
assessment of the fetal condition in pregnancies complicated by intra uterine growth
restriction. Furthermore, our preliminary data showed that in IUGR fetuses both the
Graatsma_PROEF (all).ps Front - 25 T1 - Black CyanMagentaYellow

50 Monitoring of fetal heart rate and uterine activity
acceleration capacity and the deceleration capacity reveal more prominent differences
from the normograms than short term variability of FHR.
Recently, the advanced technique of phase rectified signal analysis (PRSA) has gained
interest in fetal medicine11,12
. PRSA enables differentiation of the FHR components of the
parasympathetic and sympathetic nervous system. Since chronic oxygen and nutrient
deprivation is suggested to lead to delayed maturation of the sympathetic nervous
system5,7
, separate analysis of the sympathetic (or cardio-accelatory) and parasympathetic
(or cardio-inhibitory) nervous system might offer a better recognition of compromise in
IUGR fetuses .
Although FHR recordings as acquired with Doppler CTG are not ideal for PRSA analysis,
previous research using this technique has similarly found significant differences between
normal and IUGR fetuses, with the AAC showing a better differentiation between normal
control fetuses than STV11,12
. In those studies the average acceleration capacity (AAC),
representing the sympathetic nervous system, showed better differentiation between
normal and IUGR fetuses than the ADC, indicating that the role of the parasympathetic (or
cardio-inhibitory) nervous system might not be affected to the same extent as the
sympathetic tone. However, in our study we could not confirm superiority of the AAC
over the ADC.
The reference values as calculated from our control group in the present study are
comparable to those found in literature for FHR, but not for STV17,18
. The latter is most
likely due to diurnal differences in FHR variation, with highest values around midnight19
.
FHR recordings for the calculation of normograms as described in literature were
performed in daytime, whereas our data were collected between 23:00-06:00h.
Since values of AAC and ADC as calculated with PRSA are dependent on the sample
frequency of the (high resolution) FHR recorder, the reference curves for AAC and ADC as
described in this study are only representative for FHR recordings with a sample frequency
of 1000 Hz. It is remarkable that gestational age had only minimal effects on both AAC and
ADC as indicated by the relative horizontal reference curve (Figure 2C-D).
Although the present study is limited by the small and rather heterogeneous character of
the pregnancies complicated by IUGR (co-morbidities of hypertensive disorders with
antihypertensive treatment, and administration of antenatal steroids) a large number of
fetuses had AAC and ADC values below the 2.5th percentile. This is especially remarkable
since only few (6/25) of the IUGR pregnancies showed abnormal velocity waveforms of
the umbilical artery prior to study participation, and since it is known that abnormalities of
UA Doppler usually precede a reduction in FHR variation before term age3,6
. Interpretation
of the presented data should, however, be performed with caution since environmental
influences, such as administration of antenatal steroids and potentially other reasons not
evident in the current dataset, could also cause deviations from normality.
Graatsma_PROEF (all).ps Back - 25 T1 - Black CyanMagentaYellow

Chapter 4: Acceleration and deceleration capacity of FHR in normal and IUGR pregnancies 51
The new technology of FHR assessment might especially be important at term to assess
the condition of the small for gestational age fetus, since at that age Doppler waveform
patterns do not discriminate between low and high risk small fetuses6,20
.
In conclusion, separate analysis of the cardio-acceleratory and cardio-inhibitory
components of FHR as recorded with a high resolution fECG recorder seems to
differentiate better between normal and IUGR fetuses than conventional methods of FHR
variability. Whether this indicates that AAC or ADC represent a more sensitive parameter
of fetal compromise compared to the currently used fetal parameter remains to be
elucidated in future longitudinal studies in IUGR fetuses.
Graatsma_PROEF (all).ps Front - 26 T1 - Black CyanMagentaYellow
52 Monitoring of fetal heart rate and uterine activity
Reference List
1. Visser GH, Stigter RH, Bruinse HW. Management of the growth-retarded fetus.
Eur.J.Obstet.Gynecol.Reprod.Biol. 1991 12;42 Suppl(0301-2115):S73-S78.
2. Bekedam DJ, Visser GH, van der Zee AG, Snijders RJ, Poelmann-Weesjes G. Abnormal
velocity waveforms of the umbilical artery in growth retarded fetuses: relationship to
antepartum late heart rate decelerations and outcome. Early Hum.Dev. 1990
10;24(0378-3782; 1):79-89.
3. Hecher K, Bilardo CM, Stigter RH, Ville Y, Hackeloer BJ, Kok HJ, et al. Monitoring of
fetuses with intrauterine growth restriction: a longitudinal study. Ultrasound
Obstet.Gynecol. 2001 12;18(0960-7692; 6):564-570.
4. Bilardo CM, Wolf H, Stigter RH, Ville Y, Baez E, Visser GH, et al. Relationship between
monitoring parameters and perinatal outcome in severe, early intrauterine growth
restriction. Ultrasound Obstet.Gynecol. 2004 02;23(0960-7692; 2):119-125.
5. Baschat AA. Fetal responses to placental insufficiency: an update. BJOG 2004
Oct;111(10):1031-1041.
6. Visser G.H.A. Monitoring the growth-restricted fetus during the preterm period. In:
Petraglia F., Gabbe S.G., Weiss G., Strauss J.F., editors. Preterm Birth: Mechanisms,
Mediators, Prediction, Prevention and Interventions. first ed.: Informa Healthcare;
2007. p. 192.
7. Gagnon R, Hunse C, Bocking AD. Fetal heart rate patterns in the small-for-gestational-
age human fetus. Am.J.Obstet.Gynecol. 1989 Sep;161(3):779-784.
8. Bekedam DJ, Visser GH, Mulder EJ, Poelmann-Weesjes G. Heart rate variation and
movement incidence in growth-retarded fetuses: the significance of antenatal late
heart rate decelerations. Am.J.Obstet.Gynecol. 1987 07;157(0002-9378; 1):126-133.
9. Snijders RJ, Ribbert LS, Visser GH, Mulder EJ. Numeric analysis of heart rate variation
in intrauterine growth-retarded fetuses: a longitudinal study. Am.J.Obstet.Gynecol.
1992 01;166(0002-9378; 1):22-27.
10. Bauer A, Kantelhardt JW, Barthel P, Schneider R, Makikallio T, Ulm K, et al.
Deceleration capacity of heart rate as a predictor of mortality after myocardial
infarction: cohort study. Lancet 2006 May 20;367(9523):1674-1681.
11. Huhn EA, et.al. Phasengleichgerichtete Signalmittelung der Kardiotokographie bei
intrauteriner Wachstums-retardierung. Munchen, Germany: Frauenklinik der
Technischen Universität München Klinikum rechts der Isar; 2007.
12. Lobmaier SM, Pildner von Steinburg S, Müller A, Schuster T, Huhn EA, Ortiz JU,
Schneider KTM, Schmidt G. Phase rectified signal averaging as a new method for
surveillance of growth restricted fetuses, a prospective observational study.
Munchen, Germany: Frauenklinik, Abt. Perinatalmedizin, TU München.
13. Dawes GS. Computerised analysis of the fetal heart rate.
Eur.J.Obstet.Gynecol.Reprod.Biol. 1991 Dec;42 Suppl:S5-8.
Graatsma_PROEF (all).ps Back - 26 T1 - Black CyanMagentaYellow

Chapter 4: Acceleration and deceleration capacity of FHR in normal and IUGR pregnancies 53
14. Graatsma EM, Jacod BC, van Egmond LA, Mulder EJ, Visser GH. Fetal
electrocardiography: feasibility of long-term fetal heart rate recordings. BJOG 2009
Jan;116(2):334-7; discussion 337-8.
15. Visser GH, Eilers PH, Elferink-Stinkens PM, Merkus HM, Wit JM. New Dutch reference
curves for birthweight by gestational age. Early Hum.Dev. 2009 Dec;85(12):737-744.
16. Pieri JF, Crowe JA, Hayes-Gill BR, Spencer CJ, Bhogal K, James DK. Compact long-term
recorder for the transabdominal foetal and maternal electrocardiogram.
Med.Biol.Eng.Comput. 2001 01;39(0140-0118; 1):118-125.
17. Serra V, Bellver J, Moulden M, Redman CW. Computerized analysis of normal fetal
heart rate pattern throughout gestation. Ultrasound Obstet.Gynecol. 2009
Jul;34(1):74-79.
18. Nijhuis IJ, Ten Hof J, Mulder EJ, Nijhuis JG, Narayan H, Taylor DJ, et al. Fetal heart rate
in relation to its variation in normal and growth retarded fetuses.
Eur.J.Obstet.Gynecol.Reprod.Biol. 2000 03;89(0301-2115; 1):27-33.
19. Visser GHA, Goodman JDS, Levine DH, Dawes GS. Diurnal and other cyclic variations in
human fetal heart rate near term. Obstet.Gynecol. 1982 03/01;142(0002-9378;
5):535-544.
20. Baschat AA. Fetal growth restriction - from observation to intervention.
J.Perinat.Med. 2010 May;38(3):239-246.
Graatsma_PROEF (all).ps Front - 27 T1 - Black CyanMagentaYellow

54 Monitoring of fetal heart rate and uterine activity
Graatsma_PROEF (all).ps Back - 27 T1 - Black CyanMagentaYellow

Chapter 5: Glycaemic control in diabetic pregnancy 55
Chapter 5
Glycaemic control throughout
pregnancy in women with
type 1 diabetes
E. M. Graatsma
H. W. de Valk
A. Kerssen
G. H. A. Visser
Submitted for publication
Graatsma_PROEF (all).ps Front - 28 T1 - Black CyanMagentaYellow

56 Monitoring of fetal heart rate and uterine activity
Graatsma_PROEF (all).ps Back - 28 T1 - Black CyanMagentaYellow
Chapter 5: Glycaemic control in diabetic pregnancy 57
Glycaemic control throughout pregnancy in
women with type 1 diabetes
Abstract
Objective In pregnant women with type 1 diabetes severe hypoglycaemia and
accompanying large fluctuations in glucose values have been described in the first
trimester of pregnancy. This study evaluated whether glycaemic control improves with
advancing pregnancy.
Methods Prospective observational study of pregnant women with type 1 diabetes. In
each trimester of pregnancy HbA1c-levels were assessed. Main outcome measures were
the comparisons per trimester of median glucose values and measures of glucose
variability calculated from 48-hour measurements with a continuous glucose monitoring
system (CGM).
Results Twenty-six pregnant women with type 1 DM performed CGM in each trimester of
pregnancy, resulting in 78 continuous glucose measurements. There were no differences
between the trimesters for HbA1c-levels, median glucose values, glucose variability nor
for the presence of hyper- and hypoglycaemia. Large variations for all parameters existed
throughout pregnancy at both inter- and intra-individual level. The presence of mild or
asymptomatic ((biochemical) hypoglycaemia was not restricted to early pregnancy.
Extrapolation of the findings to the general pregnant diabetic population was confirmed
by 46 cross-sectional CGM recordings.
Conclusions At individual level the degree of glycaemic variability during the first trimester
does not predict variability in later pregnancy. Extrapolation of these results to the general
diabetic population seems justified.
Introduction
The risk of adverse outcome in diabetic pregnancy is related to the degree of glycaemic
control1. In order to reach optimal glycaemic control, insight has to be obtained in the
evolution of glycaemic patterns in the course of pregnancy.
Continuous glucose monitoring (CGM) has gained interest as a method to acquire more in-
depth insight into glycaemic control in diabetic patients and offers a variety of glucose
parameters2-4
. Self-measurement of glucose levels in capillary blood has the disadvantage
that it only offers a snapshot image of the glucose profile and at least 10 measurements a
day are needed to approach the degree of information on hyperglycaemia that CGM
offers whereas at the same time hypoglycaemic episodes will still be missed5. Sequential
determinations of glycosylated haemoglobin-levels (HbA1c) are of limited value since a
Graatsma_PROEF (all).ps Front - 29 T1 - Black CyanMagentaYellow

58 Monitoring of fetal heart rate and uterine activity
physiologic decrease occurs during pregnancy6. Moreover, HbA1c is poorly related to
macrosomia at birth, which is in contrast to data from 24 hour CGM recordings7.
Currently, data on the patterns of mean glucose levels and parameters of glucose
variability throughout the three trimesters of pregnancy in women with type 1 diabetes is
limited. In an earlier study, we have found large day-to-day fluctuations during pregnancy
in type 1 diabetes4. However, since most recordings were performed during the first
trimester, it is unclear whether large day-to-day glucose variability persists at individual
level in the second and third trimester of pregnancy.
It was the purpose of this study to evaluate the evolution of glucose patterns and (day-to-
day) glucose variability with advancing gestation in type 1 diabetes.
Methods
Study design and patients
A prospective observational study was conducted from December 2003 until July 2008 at
the University Medical Center Utrecht, The Netherlands. The study was approved by the
local Institutional Review Board. Women with type 1 diabetes mellitus with singleton
pregnancies were eligible for participation. All women gave their written informed
consent.
Parameters of glycaemic control
Glycaemic control during the three trimesters of pregnancy was assessed using HbA1c-
levels, median glucose levels and parameters of (day-to-day) glucose variability calculated
from measurements with CGM. HbA1c-levels were assessed every four weeks of
pregnancy and retrieved from the medical records. In each trimester of pregnancy the
HbA1c level, matched +/- two weeks within the date of CGM measurement, was used for
analysis.
The study participants were asked to use CGM (Medtronic MiniMed, Northridge, CA, USA).
in each trimester of pregnancy irrespective of the glycaemic control at first antenatal visit
during the first trimester. Glucose values were stored off-line and blinded during CGM.
After completing the measurement, the clinician discussed the results with the
participants and, when necessary, insulin therapy was adjusted. The CGM-system stores
values within a range of 2.2 – 22.2 mmol/l (40 – 400 mg/dl) every 5 minutes providing 288
readings in 24 hours. The methodology and criteria for optimal accuracy of CGM have
been described in detail previously8.
Median glucose levels and the standard deviation (mmol/l) were calculated for each 24
hours of CGM. As a representative of ‘day-to-day variability’ the mean absolute difference
(MAD; mmol/l) was selected (mean absolute difference between glucose values obtained
at the same time of day on two consecutive days). A previous study defined high day-to-
day variability when MAD values exceed 2.35 mmol/l4. Finally, the extent of glucose
control was studied using the percentage of time spent in hyperglycaemia
Graatsma_PROEF (all).ps Back - 29 T1 - Black CyanMagentaYellow

Chapter 5: Glycaemic control in diabetic pregnancy 59
(hyperglycaemia ≥ 7.8 mmol/l; severe hyperglycaemia ≥ 10.0 mmol/l), and time spent in
hypoglycaemia (hypoglycaemia ≤ 3.9 mmol/l; severe hypoglycaemia ≤ 2.8 mmol/l).
In order to test whether data from longitudinal measurements (in each trimester of
pregnancy) could be extrapolated to the general pre-gestational diabetic population,
cross-sectional data from women using CGM in only one or two trimesters was used for
comparison. Women in the cross-sectional study-group, equal to women in the
longitudinal study-group, were asked to use CGM irrespective of their current glycaemic
control.
Statistics
SPSS for Windows (version 15.01; SPSS Inc., Chicago, IL, USA) was used for statistical
analysis. Results were summarised with the use of standard descriptives, where
appropriate, for parametric or non-parametric tests.
Parameters of median glucose and glucose variability were compared between the three
trimesters of pregnancy using longitudinal mixed linear models. Comparison between
longitudinal – and cross-sectional data was performed using independent samples t-test,
with significance defined as a p value <0.05.
Results
Twenty-six women contributed to the longitudinal dataset by using CGM in each trimester
of pregnancy. Median age was 34 years (interquartile range (IQR) 31-37 years), median
duration of diabetes was 13 years (IQR 7 - 21 years). Median gestational age at CGM was
12+1
weeks in the first trimester, 25+0
weeks in the second trimester and 34+5
weeks in the
third trimester of pregnancy. All women received intensive insulin treatment with half of
them using continuous subcutaneous insulin infusion, and half of them using multiple
injection treatment.
Multilevel analysis demonstrated that, when duration of diabetes was included in the
model, no effect of gestational age on mean HbA1c levels, median glucose values,
standard deviation and day-to-day variability (MAD) could be found (Figure 1). The mean
MADs were 2.6, 2.5 and 2.1 mmol/l in 1st, 2nd, and 3rd trimester of pregnancy,
respectively (non-significant). MAD values were found to be ≥ 2.35 mmol/l in 39/78 (50%)
recordings. Analysis of the incidence and duration of (severe) hypoglycaemia and (severe)
hyperglycaemia showed no differences between the trimesters of pregnancy (Figure 2A-
B). Results were comparable between women using multiple injection therapy and
continuous insulin infusion systems.
All glucose parameters showed wide distributions (Figures 1 and 2) due to large inter-
individual differences. Moreover, when analysing the data at intra-individual level, first
trimester glucose values did not predict the values found in advancing pregnancy (Figure
3).
Graatsma_PROEF (all).ps Front - 30 T1 - Black CyanMagentaYellow

60
Cross
comparability to the longitudinal results. 12 women used CGM in two trimesters of
pre
sectional recordings in total. No significant differences for all glucose parameters were
found when comparing cross
values
Figure 1: Median HbA1c, median glucose, standard deviation (SD) and mean absolute difference
(MAD) per trimester of pregnancy displayed in box plots with medians and interquartile ranges
(IQR).
Figure
were comparable between trimesters of pregnancy.
60
Cross
comparability to the longitudinal results. 12 women used CGM in two trimesters of
pregnancy and 22 women performed a single CGM recording, resulting in 46 cross
sectional recordings in total. No significant differences for all glucose parameters were
found when comparing cross
values
Figure 1: Median HbA1c, median glucose, standard deviation (SD) and mean absolute difference
(MAD) per trimester of pregnancy displayed in box plots with medians and interquartile ranges
(IQR).
Figure
were comparable between trimesters of pregnancy.
Monitoring
Cross-sectional data from 34 women with pre
comparability to the longitudinal results. 12 women used CGM in two trimesters of
gnancy and 22 women performed a single CGM recording, resulting in 46 cross
sectional recordings in total. No significant differences for all glucose parameters were
found when comparing cross
values ≥ 2.35 mmol/l in 20/46 (43%) recordings.
Figure 1: Median HbA1c, median glucose, standard deviation (SD) and mean absolute difference
(MAD) per trimester of pregnancy displayed in box plots with medians and interquartile ranges
Figure legend: Ou
were comparable between trimesters of pregnancy.
Monitoring
sectional data from 34 women with pre
comparability to the longitudinal results. 12 women used CGM in two trimesters of
gnancy and 22 women performed a single CGM recording, resulting in 46 cross
sectional recordings in total. No significant differences for all glucose parameters were
found when comparing cross
≥ 2.35 mmol/l in 20/46 (43%) recordings.
Figure 1: Median HbA1c, median glucose, standard deviation (SD) and mean absolute difference
(MAD) per trimester of pregnancy displayed in box plots with medians and interquartile ranges
legend: Ou
were comparable between trimesters of pregnancy.
Monitoring of fetal heart rate and uterine activity
sectional data from 34 women with pre
comparability to the longitudinal results. 12 women used CGM in two trimesters of
gnancy and 22 women performed a single CGM recording, resulting in 46 cross
sectional recordings in total. No significant differences for all glucose parameters were
found when comparing cross
≥ 2.35 mmol/l in 20/46 (43%) recordings.
Figure 1: Median HbA1c, median glucose, standard deviation (SD) and mean absolute difference
(MAD) per trimester of pregnancy displayed in box plots with medians and interquartile ranges
legend: Outliers are indicated by an asterisk. Median HbA1c, median glucose, MAD and SD
were comparable between trimesters of pregnancy.
of fetal heart rate and uterine activity
sectional data from 34 women with pre
comparability to the longitudinal results. 12 women used CGM in two trimesters of
gnancy and 22 women performed a single CGM recording, resulting in 46 cross
sectional recordings in total. No significant differences for all glucose parameters were
found when comparing cross
≥ 2.35 mmol/l in 20/46 (43%) recordings.
Figure 1: Median HbA1c, median glucose, standard deviation (SD) and mean absolute difference
(MAD) per trimester of pregnancy displayed in box plots with medians and interquartile ranges
tliers are indicated by an asterisk. Median HbA1c, median glucose, MAD and SD
were comparable between trimesters of pregnancy.
of fetal heart rate and uterine activity
sectional data from 34 women with pre
comparability to the longitudinal results. 12 women used CGM in two trimesters of
gnancy and 22 women performed a single CGM recording, resulting in 46 cross
sectional recordings in total. No significant differences for all glucose parameters were
found when comparing cross-sectional and longitudinal data, with in the former MAD
≥ 2.35 mmol/l in 20/46 (43%) recordings.
Figure 1: Median HbA1c, median glucose, standard deviation (SD) and mean absolute difference
(MAD) per trimester of pregnancy displayed in box plots with medians and interquartile ranges
tliers are indicated by an asterisk. Median HbA1c, median glucose, MAD and SD
were comparable between trimesters of pregnancy.
of fetal heart rate and uterine activity
sectional data from 34 women with pre
comparability to the longitudinal results. 12 women used CGM in two trimesters of
gnancy and 22 women performed a single CGM recording, resulting in 46 cross
sectional recordings in total. No significant differences for all glucose parameters were
sectional and longitudinal data, with in the former MAD
≥ 2.35 mmol/l in 20/46 (43%) recordings.
Figure 1: Median HbA1c, median glucose, standard deviation (SD) and mean absolute difference
(MAD) per trimester of pregnancy displayed in box plots with medians and interquartile ranges
tliers are indicated by an asterisk. Median HbA1c, median glucose, MAD and SD
were comparable between trimesters of pregnancy.
of fetal heart rate and uterine activity
sectional data from 34 women with pre-
comparability to the longitudinal results. 12 women used CGM in two trimesters of
gnancy and 22 women performed a single CGM recording, resulting in 46 cross
sectional recordings in total. No significant differences for all glucose parameters were
sectional and longitudinal data, with in the former MAD
≥ 2.35 mmol/l in 20/46 (43%) recordings.
Figure 1: Median HbA1c, median glucose, standard deviation (SD) and mean absolute difference
(MAD) per trimester of pregnancy displayed in box plots with medians and interquartile ranges
tliers are indicated by an asterisk. Median HbA1c, median glucose, MAD and SD
were comparable between trimesters of pregnancy.
of fetal heart rate and uterine activity
-gestational diabetes was analysed to test
comparability to the longitudinal results. 12 women used CGM in two trimesters of
gnancy and 22 women performed a single CGM recording, resulting in 46 cross
sectional recordings in total. No significant differences for all glucose parameters were
sectional and longitudinal data, with in the former MAD
≥ 2.35 mmol/l in 20/46 (43%) recordings.
Figure 1: Median HbA1c, median glucose, standard deviation (SD) and mean absolute difference
(MAD) per trimester of pregnancy displayed in box plots with medians and interquartile ranges
tliers are indicated by an asterisk. Median HbA1c, median glucose, MAD and SD
of fetal heart rate and uterine activity
gestational diabetes was analysed to test
comparability to the longitudinal results. 12 women used CGM in two trimesters of
gnancy and 22 women performed a single CGM recording, resulting in 46 cross
sectional recordings in total. No significant differences for all glucose parameters were
sectional and longitudinal data, with in the former MAD
Figure 1: Median HbA1c, median glucose, standard deviation (SD) and mean absolute difference
(MAD) per trimester of pregnancy displayed in box plots with medians and interquartile ranges
tliers are indicated by an asterisk. Median HbA1c, median glucose, MAD and SD
gestational diabetes was analysed to test
comparability to the longitudinal results. 12 women used CGM in two trimesters of
gnancy and 22 women performed a single CGM recording, resulting in 46 cross-
sectional recordings in total. No significant differences for all glucose parameters were
sectional and longitudinal data, with in the former MAD
Figure 1: Median HbA1c, median glucose, standard deviation (SD) and mean absolute difference
(MAD) per trimester of pregnancy displayed in box plots with medians and interquartile ranges
tliers are indicated by an asterisk. Median HbA1c, median glucose, MAD and SD
Graatsma_PROEF (all).ps Back - 30 T1 - Black CyanMagentaYellow

Figure 2:
hyperglycaemia (B) per trimes
(IQR)).
Figure legend: Mild hypoglycaemia <3.9 mmol/l, severe hypoglycaemia <2.8 mmol/l, mild
hyperglycaemia >7.8 mmol/l, severe hyperglycaemia >10.0 mmol/l. Outliers are indicated by a
asterisk. Comparison between trimesters showed no significant differences in time spent in hypo
hyperglycaemia.
Figure 2: Percentages of time of the 48 hour CGM spent in mild
hyperglycaemia (B) per trimes
(IQR)).
Figure legend: Mild hypoglycaemia <3.9 mmol/l, severe hypoglycaemia <2.8 mmol/l, mild
hyperglycaemia >7.8 mmol/l, severe hyperglycaemia >10.0 mmol/l. Outliers are indicated by a
asterisk. Comparison between trimesters showed no significant differences in time spent in hypo
hyperglycaemia.
Percentages of time of the 48 hour CGM spent in mild
hyperglycaemia (B) per trimes
Figure legend: Mild hypoglycaemia <3.9 mmol/l, severe hypoglycaemia <2.8 mmol/l, mild
hyperglycaemia >7.8 mmol/l, severe hyperglycaemia >10.0 mmol/l. Outliers are indicated by a
asterisk. Comparison between trimesters showed no significant differences in time spent in hypo
Percentages of time of the 48 hour CGM spent in mild
hyperglycaemia (B) per trimester of pregnancy (box plots with medians and interquartile ranges
Figure legend: Mild hypoglycaemia <3.9 mmol/l, severe hypoglycaemia <2.8 mmol/l, mild
hyperglycaemia >7.8 mmol/l, severe hyperglycaemia >10.0 mmol/l. Outliers are indicated by a
asterisk. Comparison between trimesters showed no significant differences in time spent in hypo
Percentages of time of the 48 hour CGM spent in mild
ter of pregnancy (box plots with medians and interquartile ranges
Figure legend: Mild hypoglycaemia <3.9 mmol/l, severe hypoglycaemia <2.8 mmol/l, mild
hyperglycaemia >7.8 mmol/l, severe hyperglycaemia >10.0 mmol/l. Outliers are indicated by a
asterisk. Comparison between trimesters showed no significant differences in time spent in hypo
Chapter 5:
Percentages of time of the 48 hour CGM spent in mild
ter of pregnancy (box plots with medians and interquartile ranges
Figure legend: Mild hypoglycaemia <3.9 mmol/l, severe hypoglycaemia <2.8 mmol/l, mild
hyperglycaemia >7.8 mmol/l, severe hyperglycaemia >10.0 mmol/l. Outliers are indicated by a
asterisk. Comparison between trimesters showed no significant differences in time spent in hypo
Chapter 5: Glycaemic control in diabetic pregnancy
Percentages of time of the 48 hour CGM spent in mild
ter of pregnancy (box plots with medians and interquartile ranges
Figure legend: Mild hypoglycaemia <3.9 mmol/l, severe hypoglycaemia <2.8 mmol/l, mild
hyperglycaemia >7.8 mmol/l, severe hyperglycaemia >10.0 mmol/l. Outliers are indicated by a
asterisk. Comparison between trimesters showed no significant differences in time spent in hypo
Glycaemic control in diabetic pregnancy
Percentages of time of the 48 hour CGM spent in mild - or severe hypoglycaemia (A) and
ter of pregnancy (box plots with medians and interquartile ranges
Figure legend: Mild hypoglycaemia <3.9 mmol/l, severe hypoglycaemia <2.8 mmol/l, mild
hyperglycaemia >7.8 mmol/l, severe hyperglycaemia >10.0 mmol/l. Outliers are indicated by a
asterisk. Comparison between trimesters showed no significant differences in time spent in hypo
Glycaemic control in diabetic pregnancy
or severe hypoglycaemia (A) and
ter of pregnancy (box plots with medians and interquartile ranges
Figure legend: Mild hypoglycaemia <3.9 mmol/l, severe hypoglycaemia <2.8 mmol/l, mild
hyperglycaemia >7.8 mmol/l, severe hyperglycaemia >10.0 mmol/l. Outliers are indicated by a
asterisk. Comparison between trimesters showed no significant differences in time spent in hypo
61
or severe hypoglycaemia (A) and
ter of pregnancy (box plots with medians and interquartile ranges
Figure legend: Mild hypoglycaemia <3.9 mmol/l, severe hypoglycaemia <2.8 mmol/l, mild
hyperglycaemia >7.8 mmol/l, severe hyperglycaemia >10.0 mmol/l. Outliers are indicated by an
asterisk. Comparison between trimesters showed no significant differences in time spent in hypo- or
or severe hypoglycaemia (A) and
ter of pregnancy (box plots with medians and interquartile ranges
Figure legend: Mild hypoglycaemia <3.9 mmol/l, severe hypoglycaemia <2.8 mmol/l, mild
n
or
Graatsma_PROEF (all).ps Front - 31 T1 - Black CyanMagentaYellow

62
Figure 3: Estimates of median glucose values for women with type 1 diabetes obtained from
applying generalised linear mixed models to
trimester of pregnancy.
Figure
how for most individuals the glucose values in first trimester do not predict v
trimester.
Discussion
This study emphasises the difficulties encountered in glucose control in type 1 diabetic
pregnancy reflected by the large inter
all glucose parameters th
This is the first study on glycaemic variability longitudinally throughout the three
trimesters of pregnancy exclusively in women with type 1 diabetes. Murphy et al.
described a decrease in hyperglycaemic episode
advancing pregnancy in a mixed group of women with either type
However, it seems that their described effect might mainly be explained by the
contribution
Comparison
recordings per pregnancy showed no significant differences indicating that our results can
be extrapolated to the general pre
Classically, sever
to actively administer carbohydrates or injections of glucagon or glucose, is most frequent
during the first tri
hypoglycaemic events in our study population. However, in accordance with other studies,
our data show that mild or asymptomatic (biochemical) hypoglycaemic episodes occur at
62
Figure 3: Estimates of median glucose values for women with type 1 diabetes obtained from
applying generalised linear mixed models to
trimester of pregnancy.
Figure
how for most individuals the glucose values in first trimester do not predict v
trimester.
Discussion
This study emphasises the difficulties encountered in glucose control in type 1 diabetic
pregnancy reflected by the large inter
all glucose parameters th
This is the first study on glycaemic variability longitudinally throughout the three
trimesters of pregnancy exclusively in women with type 1 diabetes. Murphy et al.
described a decrease in hyperglycaemic episode
advancing pregnancy in a mixed group of women with either type
However, it seems that their described effect might mainly be explained by the
contribution
Comparison
recordings per pregnancy showed no significant differences indicating that our results can
be extrapolated to the general pre
Classically, sever
to actively administer carbohydrates or injections of glucagon or glucose, is most frequent
during the first tri
ypoglycaemic events in our study population. However, in accordance with other studies,
our data show that mild or asymptomatic (biochemical) hypoglycaemic episodes occur at
Monitoring
Figure 3: Estimates of median glucose values for women with type 1 diabetes obtained from
applying generalised linear mixed models to
trimester of pregnancy.
Figure legend: Each line represents changes in median glucose values for individual subjects. Note
how for most individuals the glucose values in first trimester do not predict v
trimester.
Discussion
This study emphasises the difficulties encountered in glucose control in type 1 diabetic
pregnancy reflected by the large inter
all glucose parameters th
This is the first study on glycaemic variability longitudinally throughout the three
trimesters of pregnancy exclusively in women with type 1 diabetes. Murphy et al.
described a decrease in hyperglycaemic episode
advancing pregnancy in a mixed group of women with either type
However, it seems that their described effect might mainly be explained by the
contribution
Comparison
recordings per pregnancy showed no significant differences indicating that our results can
be extrapolated to the general pre
Classically, sever
to actively administer carbohydrates or injections of glucagon or glucose, is most frequent
during the first tri
ypoglycaemic events in our study population. However, in accordance with other studies,
our data show that mild or asymptomatic (biochemical) hypoglycaemic episodes occur at
Monitoring
Figure 3: Estimates of median glucose values for women with type 1 diabetes obtained from
applying generalised linear mixed models to
trimester of pregnancy.
egend: Each line represents changes in median glucose values for individual subjects. Note
how for most individuals the glucose values in first trimester do not predict v
Discussion
This study emphasises the difficulties encountered in glucose control in type 1 diabetic
pregnancy reflected by the large inter
all glucose parameters th
This is the first study on glycaemic variability longitudinally throughout the three
trimesters of pregnancy exclusively in women with type 1 diabetes. Murphy et al.
described a decrease in hyperglycaemic episode
advancing pregnancy in a mixed group of women with either type
However, it seems that their described effect might mainly be explained by the
contribution of women with type 2 diabetes
of our longitudinal data to cross
recordings per pregnancy showed no significant differences indicating that our results can
be extrapolated to the general pre
Classically, sever
to actively administer carbohydrates or injections of glucagon or glucose, is most frequent
during the first tri
ypoglycaemic events in our study population. However, in accordance with other studies,
our data show that mild or asymptomatic (biochemical) hypoglycaemic episodes occur at
Monitoring of fetal heart rate and uterine activity
Figure 3: Estimates of median glucose values for women with type 1 diabetes obtained from
applying generalised linear mixed models to
trimester of pregnancy.
egend: Each line represents changes in median glucose values for individual subjects. Note
how for most individuals the glucose values in first trimester do not predict v
This study emphasises the difficulties encountered in glucose control in type 1 diabetic
pregnancy reflected by the large inter
all glucose parameters th
This is the first study on glycaemic variability longitudinally throughout the three
trimesters of pregnancy exclusively in women with type 1 diabetes. Murphy et al.
described a decrease in hyperglycaemic episode
advancing pregnancy in a mixed group of women with either type
However, it seems that their described effect might mainly be explained by the
of women with type 2 diabetes
of our longitudinal data to cross
recordings per pregnancy showed no significant differences indicating that our results can
be extrapolated to the general pre
Classically, severe clinical hypoglycaemia, defined as requiring help from another person
to actively administer carbohydrates or injections of glucagon or glucose, is most frequent
during the first trimester
ypoglycaemic events in our study population. However, in accordance with other studies,
our data show that mild or asymptomatic (biochemical) hypoglycaemic episodes occur at
of fetal heart rate and uterine activity
Figure 3: Estimates of median glucose values for women with type 1 diabetes obtained from
applying generalised linear mixed models to
trimester of pregnancy.
egend: Each line represents changes in median glucose values for individual subjects. Note
how for most individuals the glucose values in first trimester do not predict v
This study emphasises the difficulties encountered in glucose control in type 1 diabetic
pregnancy reflected by the large inter
all glucose parameters th
This is the first study on glycaemic variability longitudinally throughout the three
trimesters of pregnancy exclusively in women with type 1 diabetes. Murphy et al.
described a decrease in hyperglycaemic episode
advancing pregnancy in a mixed group of women with either type
However, it seems that their described effect might mainly be explained by the
of women with type 2 diabetes
of our longitudinal data to cross
recordings per pregnancy showed no significant differences indicating that our results can
be extrapolated to the general pre
e clinical hypoglycaemia, defined as requiring help from another person
to actively administer carbohydrates or injections of glucagon or glucose, is most frequent
mester
ypoglycaemic events in our study population. However, in accordance with other studies,
our data show that mild or asymptomatic (biochemical) hypoglycaemic episodes occur at
of fetal heart rate and uterine activity
Figure 3: Estimates of median glucose values for women with type 1 diabetes obtained from
applying generalised linear mixed models to
egend: Each line represents changes in median glucose values for individual subjects. Note
how for most individuals the glucose values in first trimester do not predict v
This study emphasises the difficulties encountered in glucose control in type 1 diabetic
pregnancy reflected by the large inter
all glucose parameters throughout the three trimesters of pregnancy.
This is the first study on glycaemic variability longitudinally throughout the three
trimesters of pregnancy exclusively in women with type 1 diabetes. Murphy et al.
described a decrease in hyperglycaemic episode
advancing pregnancy in a mixed group of women with either type
However, it seems that their described effect might mainly be explained by the
of women with type 2 diabetes
of our longitudinal data to cross
recordings per pregnancy showed no significant differences indicating that our results can
be extrapolated to the general pre
e clinical hypoglycaemia, defined as requiring help from another person
to actively administer carbohydrates or injections of glucagon or glucose, is most frequent
mester10,11
ypoglycaemic events in our study population. However, in accordance with other studies,
our data show that mild or asymptomatic (biochemical) hypoglycaemic episodes occur at
of fetal heart rate and uterine activity
Figure 3: Estimates of median glucose values for women with type 1 diabetes obtained from
applying generalised linear mixed models to
egend: Each line represents changes in median glucose values for individual subjects. Note
how for most individuals the glucose values in first trimester do not predict v
This study emphasises the difficulties encountered in glucose control in type 1 diabetic
pregnancy reflected by the large inter
roughout the three trimesters of pregnancy.
This is the first study on glycaemic variability longitudinally throughout the three
trimesters of pregnancy exclusively in women with type 1 diabetes. Murphy et al.
described a decrease in hyperglycaemic episode
advancing pregnancy in a mixed group of women with either type
However, it seems that their described effect might mainly be explained by the
of women with type 2 diabetes
of our longitudinal data to cross
recordings per pregnancy showed no significant differences indicating that our results can
be extrapolated to the general pre
e clinical hypoglycaemia, defined as requiring help from another person
to actively administer carbohydrates or injections of glucagon or glucose, is most frequent 10,11
. Unfortunately our study does not provide data on clinical
ypoglycaemic events in our study population. However, in accordance with other studies,
our data show that mild or asymptomatic (biochemical) hypoglycaemic episodes occur at
of fetal heart rate and uterine activity
Figure 3: Estimates of median glucose values for women with type 1 diabetes obtained from
applying generalised linear mixed models to
egend: Each line represents changes in median glucose values for individual subjects. Note
how for most individuals the glucose values in first trimester do not predict v
This study emphasises the difficulties encountered in glucose control in type 1 diabetic
pregnancy reflected by the large inter
roughout the three trimesters of pregnancy.
This is the first study on glycaemic variability longitudinally throughout the three
trimesters of pregnancy exclusively in women with type 1 diabetes. Murphy et al.
described a decrease in hyperglycaemic episode
advancing pregnancy in a mixed group of women with either type
However, it seems that their described effect might mainly be explained by the
of women with type 2 diabetes
of our longitudinal data to cross
recordings per pregnancy showed no significant differences indicating that our results can
be extrapolated to the general pre
e clinical hypoglycaemia, defined as requiring help from another person
to actively administer carbohydrates or injections of glucagon or glucose, is most frequent
. Unfortunately our study does not provide data on clinical
ypoglycaemic events in our study population. However, in accordance with other studies,
our data show that mild or asymptomatic (biochemical) hypoglycaemic episodes occur at
of fetal heart rate and uterine activity
Figure 3: Estimates of median glucose values for women with type 1 diabetes obtained from
applying generalised linear mixed models to
egend: Each line represents changes in median glucose values for individual subjects. Note
how for most individuals the glucose values in first trimester do not predict v
This study emphasises the difficulties encountered in glucose control in type 1 diabetic
pregnancy reflected by the large inter
roughout the three trimesters of pregnancy.
This is the first study on glycaemic variability longitudinally throughout the three
trimesters of pregnancy exclusively in women with type 1 diabetes. Murphy et al.
described a decrease in hyperglycaemic episode
advancing pregnancy in a mixed group of women with either type
However, it seems that their described effect might mainly be explained by the
of women with type 2 diabetes
of our longitudinal data to cross
recordings per pregnancy showed no significant differences indicating that our results can
be extrapolated to the general pre-gestational diabetic population.
e clinical hypoglycaemia, defined as requiring help from another person
to actively administer carbohydrates or injections of glucagon or glucose, is most frequent
. Unfortunately our study does not provide data on clinical
ypoglycaemic events in our study population. However, in accordance with other studies,
our data show that mild or asymptomatic (biochemical) hypoglycaemic episodes occur at
of fetal heart rate and uterine activity
Figure 3: Estimates of median glucose values for women with type 1 diabetes obtained from
applying generalised linear mixed models to
egend: Each line represents changes in median glucose values for individual subjects. Note
how for most individuals the glucose values in first trimester do not predict v
This study emphasises the difficulties encountered in glucose control in type 1 diabetic
pregnancy reflected by the large inter- and intra
roughout the three trimesters of pregnancy.
This is the first study on glycaemic variability longitudinally throughout the three
trimesters of pregnancy exclusively in women with type 1 diabetes. Murphy et al.
described a decrease in hyperglycaemic episode
advancing pregnancy in a mixed group of women with either type
However, it seems that their described effect might mainly be explained by the
of women with type 2 diabetes
of our longitudinal data to cross
recordings per pregnancy showed no significant differences indicating that our results can
gestational diabetic population.
e clinical hypoglycaemia, defined as requiring help from another person
to actively administer carbohydrates or injections of glucagon or glucose, is most frequent
. Unfortunately our study does not provide data on clinical
ypoglycaemic events in our study population. However, in accordance with other studies,
our data show that mild or asymptomatic (biochemical) hypoglycaemic episodes occur at
of fetal heart rate and uterine activity
Figure 3: Estimates of median glucose values for women with type 1 diabetes obtained from
applying generalised linear mixed models to the median glucose values acquired with CGM in each
egend: Each line represents changes in median glucose values for individual subjects. Note
how for most individuals the glucose values in first trimester do not predict v
This study emphasises the difficulties encountered in glucose control in type 1 diabetic
and intra
roughout the three trimesters of pregnancy.
This is the first study on glycaemic variability longitudinally throughout the three
trimesters of pregnancy exclusively in women with type 1 diabetes. Murphy et al.
described a decrease in hyperglycaemic episode
advancing pregnancy in a mixed group of women with either type
However, it seems that their described effect might mainly be explained by the
of women with type 2 diabetes
of our longitudinal data to cross
recordings per pregnancy showed no significant differences indicating that our results can
gestational diabetic population.
e clinical hypoglycaemia, defined as requiring help from another person
to actively administer carbohydrates or injections of glucagon or glucose, is most frequent
. Unfortunately our study does not provide data on clinical
ypoglycaemic events in our study population. However, in accordance with other studies,
our data show that mild or asymptomatic (biochemical) hypoglycaemic episodes occur at
of fetal heart rate and uterine activity
Figure 3: Estimates of median glucose values for women with type 1 diabetes obtained from
the median glucose values acquired with CGM in each
egend: Each line represents changes in median glucose values for individual subjects. Note
how for most individuals the glucose values in first trimester do not predict v
This study emphasises the difficulties encountered in glucose control in type 1 diabetic
and intra
roughout the three trimesters of pregnancy.
This is the first study on glycaemic variability longitudinally throughout the three
trimesters of pregnancy exclusively in women with type 1 diabetes. Murphy et al.
described a decrease in hyperglycaemic episode
advancing pregnancy in a mixed group of women with either type
However, it seems that their described effect might mainly be explained by the
of women with type 2 diabetes9.
of our longitudinal data to cross-sectional results from a single or two CGM
recordings per pregnancy showed no significant differences indicating that our results can
gestational diabetic population.
e clinical hypoglycaemia, defined as requiring help from another person
to actively administer carbohydrates or injections of glucagon or glucose, is most frequent
. Unfortunately our study does not provide data on clinical
ypoglycaemic events in our study population. However, in accordance with other studies,
our data show that mild or asymptomatic (biochemical) hypoglycaemic episodes occur at
of fetal heart rate and uterine activity
Figure 3: Estimates of median glucose values for women with type 1 diabetes obtained from
the median glucose values acquired with CGM in each
egend: Each line represents changes in median glucose values for individual subjects. Note
how for most individuals the glucose values in first trimester do not predict v
This study emphasises the difficulties encountered in glucose control in type 1 diabetic
and intra-individual differences that were found for
roughout the three trimesters of pregnancy.
This is the first study on glycaemic variability longitudinally throughout the three
trimesters of pregnancy exclusively in women with type 1 diabetes. Murphy et al.
described a decrease in hyperglycaemic episodes, mean blood glucose and HbA1c with
advancing pregnancy in a mixed group of women with either type
However, it seems that their described effect might mainly be explained by the
sectional results from a single or two CGM
recordings per pregnancy showed no significant differences indicating that our results can
gestational diabetic population.
e clinical hypoglycaemia, defined as requiring help from another person
to actively administer carbohydrates or injections of glucagon or glucose, is most frequent
. Unfortunately our study does not provide data on clinical
ypoglycaemic events in our study population. However, in accordance with other studies,
our data show that mild or asymptomatic (biochemical) hypoglycaemic episodes occur at
of fetal heart rate and uterine activity
Figure 3: Estimates of median glucose values for women with type 1 diabetes obtained from
the median glucose values acquired with CGM in each
egend: Each line represents changes in median glucose values for individual subjects. Note
how for most individuals the glucose values in first trimester do not predict v
This study emphasises the difficulties encountered in glucose control in type 1 diabetic
individual differences that were found for
roughout the three trimesters of pregnancy.
This is the first study on glycaemic variability longitudinally throughout the three
trimesters of pregnancy exclusively in women with type 1 diabetes. Murphy et al.
s, mean blood glucose and HbA1c with
advancing pregnancy in a mixed group of women with either type
However, it seems that their described effect might mainly be explained by the
sectional results from a single or two CGM
recordings per pregnancy showed no significant differences indicating that our results can
gestational diabetic population.
e clinical hypoglycaemia, defined as requiring help from another person
to actively administer carbohydrates or injections of glucagon or glucose, is most frequent
. Unfortunately our study does not provide data on clinical
ypoglycaemic events in our study population. However, in accordance with other studies,
our data show that mild or asymptomatic (biochemical) hypoglycaemic episodes occur at
Figure 3: Estimates of median glucose values for women with type 1 diabetes obtained from
the median glucose values acquired with CGM in each
egend: Each line represents changes in median glucose values for individual subjects. Note
how for most individuals the glucose values in first trimester do not predict values in second and third
This study emphasises the difficulties encountered in glucose control in type 1 diabetic
individual differences that were found for
roughout the three trimesters of pregnancy.
This is the first study on glycaemic variability longitudinally throughout the three
trimesters of pregnancy exclusively in women with type 1 diabetes. Murphy et al.
s, mean blood glucose and HbA1c with
advancing pregnancy in a mixed group of women with either type
However, it seems that their described effect might mainly be explained by the
sectional results from a single or two CGM
recordings per pregnancy showed no significant differences indicating that our results can
gestational diabetic population.
e clinical hypoglycaemia, defined as requiring help from another person
to actively administer carbohydrates or injections of glucagon or glucose, is most frequent
. Unfortunately our study does not provide data on clinical
ypoglycaemic events in our study population. However, in accordance with other studies,
our data show that mild or asymptomatic (biochemical) hypoglycaemic episodes occur at
Figure 3: Estimates of median glucose values for women with type 1 diabetes obtained from
the median glucose values acquired with CGM in each
egend: Each line represents changes in median glucose values for individual subjects. Note
alues in second and third
This study emphasises the difficulties encountered in glucose control in type 1 diabetic
individual differences that were found for
roughout the three trimesters of pregnancy.
This is the first study on glycaemic variability longitudinally throughout the three
trimesters of pregnancy exclusively in women with type 1 diabetes. Murphy et al.
s, mean blood glucose and HbA1c with
1 or type 2 diabetes.
However, it seems that their described effect might mainly be explained by the
sectional results from a single or two CGM
recordings per pregnancy showed no significant differences indicating that our results can
e clinical hypoglycaemia, defined as requiring help from another person
to actively administer carbohydrates or injections of glucagon or glucose, is most frequent
. Unfortunately our study does not provide data on clinical
ypoglycaemic events in our study population. However, in accordance with other studies,
our data show that mild or asymptomatic (biochemical) hypoglycaemic episodes occur at
Figure 3: Estimates of median glucose values for women with type 1 diabetes obtained from
the median glucose values acquired with CGM in each
egend: Each line represents changes in median glucose values for individual subjects. Note
alues in second and third
This study emphasises the difficulties encountered in glucose control in type 1 diabetic
individual differences that were found for
This is the first study on glycaemic variability longitudinally throughout the three
trimesters of pregnancy exclusively in women with type 1 diabetes. Murphy et al.
s, mean blood glucose and HbA1c with
1 or type 2 diabetes.
However, it seems that their described effect might mainly be explained by the
sectional results from a single or two CGM
recordings per pregnancy showed no significant differences indicating that our results can
e clinical hypoglycaemia, defined as requiring help from another person
to actively administer carbohydrates or injections of glucagon or glucose, is most frequent
. Unfortunately our study does not provide data on clinical
ypoglycaemic events in our study population. However, in accordance with other studies,
our data show that mild or asymptomatic (biochemical) hypoglycaemic episodes occur at
Graatsma_PROEF (all).ps Back - 31 T1 - Black CyanMagentaYellow
Chapter 5: Glycaemic control in diabetic pregnancy 63
least as frequent in advanced pregnancy9,10
. An explanation for the decrease in incidence
of severe clinical hypoglycaemia in the second half of gestation with persisting presence of
mild or asymptomatic (biochemical) hypoglycaemia remains to be elucidated.
Our previous study defined a cut-off value of 2.35 mmol/l for MAD to distinguish between
high and low day-to-day glucose variability, based on CGM, and predominantly in first
trimester of pregnancy4. The current study demonstrates that approximately half of the
women in each trimester of pregnancy show high day-to-day glucose variability, with MAD
values above the cut-off in both the longitudinal as the cross-sectional dataset.
A recent randomised study using repetitive offline CGM during pregnancy has shown the
potential of CGM to reduce macrosomia with improved glycaemic control12
. Although
offline use of CGM gives both clinicians and diabetic women insight into the daily
fluctuations of glucose patterns in retrospect, insulin adjustment is hampered in women
with high glucose variability4. In the non-pregnant diabetic population frequent use of real
time CGM measurements with instantaneous feedback has proven to result in
improvement of glycaemic control since insulin schemes can be adjusted according to real
time glucose levels13
. Whether real time CGM in pregnancy results in improved glycaemic
control and further reduction of macrosomia remains to be established.
In conclusion this study shows the difficulties encountered in optimising glycaemic control
in pregnancy. Large variations for all parameters of glycaemic control including day-to-day
variations hamper treatment in all three trimesters of pregnancy.
Graatsma_PROEF (all).ps Front - 32 T1 - Black CyanMagentaYellow

64 Monitoring of fetal heart rate and uterine activity
Reference List
1. Evers IM, de Valk HW, Visser GH. Risk of complications of pregnancy in women with
type 1 diabetes: nationwide prospective study in the Netherlands. BMJ 2004
04/17;328(1468-5833; 7445):915.
2. Yogev Y, Chen R, Ben-Haroush A, Phillip M, Jovanovic L, Hod M. Continuous glucose
monitoring for the evaluation of gravid women with type 1 diabetes mellitus.
Obstet.Gynecol. 2003 Apr;101(4):633-638.
3. Rodbard D. Interpretation of continuous glucose monitoring data: glycemic variability
and quality of glycemic control. Diabetes Technol.Ther. 2009 Jun;11 Suppl 1:S55-67.
4. Kerssen A, de Valk HW, Visser GH. Day-to-day glucose variability during pregnancy in
women with Type 1 diabetes mellitus: glucose profiles measured with the Continuous
Glucose Monitoring System. BJOG 2004 09;111(1470-0328; 9):919-924.
5. Kerssen A, de Valk HW, Visser GH. Do HbA1c levels and the self-monitoring of blood
glucose levels adequately reflect glycaemic control during pregnancy in women with
type 1 diabetes mellitus? Diabetologia 2006 01;49(0012-186; 1):25-28.
6. Nielsen LR, Ekbom P, Damm P, Glumer C, Frandsen MM, Jensen DM, et al. HbA1c
levels are significantly lower in early and late pregnancy. Diabetes Care 2004
May;27(5):1200-1201.
7. Kerssen A, de Valk HW, Visser GH. Increased second trimester maternal glucose levels
are related to extremely large-for-gestational-age infants in women with type 1
diabetes. Diabetes Care 2007 May;30(5):1069-1074.
8. Kerssen A, de Valk HW, Visser GH. The Continuous Glucose Monitoring System during
pregnancy of women with type 1 diabetes mellitus: accuracy assessment. Diabetes
Technol.Ther. 2004 10;6(1520-9156; 5):645-651.
9. Murphy HR, Rayman G, Duffield K, Lewis KS, Kelly S, Johal B, et al. Changes in the
glycemic profiles of women with type 1 and type 2 diabetes during pregnancy.
Diabetes Care 2007 Nov;30(11):2785-2791.
10. Nielsen LR, Pedersen-Bjergaard U, Thorsteinsson B, Johansen M, Damm P, Mathiesen
ER. Hypoglycemia in pregnant women with type 1 diabetes: predictors and role of
metabolic control. Diabetes Care 2008 Jan;31(1):9-14.
11. Kimmerle R, Heinemann L, Delecki A, Berger M. Severe hypoglycemia incidence and
predisposing factors in 85 pregnancies of type I diabetic women. Diabetes Care 1992
Aug;15(8):1034-1037.
12. Murphy HR, Rayman G, Lewis K, Kelly S, Johal B, Duffield K, et al. Effectiveness of
continuous glucose monitoring in pregnant women with diabetes: randomised clinical
trial. BMJ 2008 Sep 25;337:a1680.
13. Juvenile Diabetes Research Foundation Continuous Glucose Monitoring Study Group,
Tamborlane WV, Beck RW, Bode BW, Buckingham B, Chase HP, et al. Continuous
glucose monitoring and intensive treatment of type 1 diabetes. N.Engl.J.Med. 2008
Oct 2;359(14):1464-1476.
Graatsma_PROEF (all).ps Back - 32 T1 - Black CyanMagentaYellow

Chapter 6: Monitoring maternal glucose & FHR 65
Chapter 6
Continuous simultaneous
monitoring of maternal glucose
and fetal heart rate in diabetic
pregnancy
E. M. Graatsma
E. J. H. Mulder
H. W. de Valk
G. H. A Visser
Submitted for publication
Graatsma_PROEF (all).ps Front - 33 T1 - Black CyanMagentaYellow

66 Monitoring of fetal heart rate and uterine activity
Graatsma_PROEF (all).ps Back - 33 T1 - Black CyanMagentaYellow
Chapter 6: Monitoring maternal glucose & FHR 67
Continuous simultaneous monitoring of maternal
glucose and fetal heart rate in diabetic pregnancy
Abstract
Background Diabetic pregnancy is associated with an increased risk of intrauterine fetal
death. Difficulties are encountered in the recognition of the fetus at risk, since routine
fetal heart rate (FHR) monitoring during euglycaemia can falsely reassure clinicians. FHR
monitoring during prolonged excursions in glucose levels might offer insight into the fetal
compensatory mechanisms.
Objectives To assess the effect of spontaneous occurring excursions of maternal glucose
measured with continuous glucose monitoring (CGM) on fetal heart rate (FHR)
parameters.
Study Design Prospective observational study in twenty-two women with (pre)gestational
diabetes. Simultaneous recording of FHR by abdominal ECG-electrodes and CGM was
performed continuously for 15 hours. Main outcome measure was FHR and its short term
variability (STV) in relation to excursions of glucose into the hypo- and hyperglycaemic
range (≤3.9 and ≥7.8 mmol/l, respectively).
Results Maternal glucose levels ranged between 2.2 mmol/l (lowest detectable value) and
18.1 mmol/l. FHR and STV were within limits of normality during all episodes of
hyperglycaemia (n=28 events) and hypoglycaemia (n=18 events). Multilevel analysis of the
hyperglycaemic events showed a significant effect of glucose on FHR, but not on STV.
During hypoglycaemia no significant effect of glucose on FHR or STV could be established.
Conclusions This study confirms an effect of maternal glucose on FHR during
hyperglycaemia. This effect probably represents an expression of physiology rather than
pathology. Whether simultaneous recording of FHR and CGM offers additional value in
high risk cases (macrosomia and poor glucose control) needs to be consolidated.
Introduction
Despite improvements in fetal monitoring diabetic pregnancy is still associated with a ten-
fold increased risk for sudden unexplained intrauterine deaths in the third trimester of
pregnancy1-4
. Poor maternal glycaemic control is implicated to play a role in this high
incidence, since maternal hyperglycaemia has been demonstrated to coincidence with
fetal hyperglycaemia, hyperinsulinaemia, acidaemia and (chronic) hypoxia5,6
.
Various monitoring techniques are available for antenatal assessment of fetal wellbeing in
diabetic pregnancy; ultrasound assessment of fetal biometry, Doppler velocimetry and
fetal heart rate (FHR) monitoring. There exists no consensus towards the optimal method
Graatsma_PROEF (all).ps Front - 34 T1 - Black CyanMagentaYellow

68 Monitoring of fetal heart rate and uterine activity
and frequency of antenatal monitoring7-9
and the question remains how to recognize the
fetus at increased risk of deterioration.
Several studies have used FHR monitoring to assess fetal compensatory behaviour
following induced or natural occurring changes in maternal glucose values, however the
findings are inconsistent. Some authors described significant changes of FHR following
hyperglycaemia10,11
, whereas others failed to establish a relationship between FHR and
maternal glucose levels8,12-14
. Although in diabetic pregnancy spontaneous excursions of
maternal glucose have been described lasting for many hours and sometimes reaching
extreme values15
, fetal compensatory behaviour during prolonged and/or extreme hypo-
and hyperglycaemia has not been studied. Recently, an improved technique for
continuous FHR monitoring using abdominal ECG-electrodes has been validated16
,
allowing combined assessment of continuous FHR monitoring and continuous glucose
monitoring. The objective of this study was to assess the relationship between
computerized fetal heart rate parameters and spontaneous glucose excursions present
during the second half of gestation in women with (pre)gestational diabetes.
Materials and methods
Study design and patients
A prospective observational study was conducted at University Medical Center Utrecht,
The Netherlands. The study was approved by the local medical ethical committee. Women
with (pre)gestational diabetes with singleton pregnancies were eligible for participation.
Exclusion criteria were multiple gestation, congenital malformations, and hypertensive
disorders. Twenty-two diabetic women, irrespective of their current glycaemic control,
were approached to participate in a simultaneous FHR and maternal glucose recording to
be performed either at home or in the obstetric ward. After informed consent was
obtained, patients were asked to simultaneously wear a Continuous Glucose Monitoring
System (CGMS, MiniMed, etc) and a fetal-ECG monitor (AN24, Monica Healthcare,
Nottingham, UK) for a combined continuous measurement of FHR and maternal glucose.
The control group consisted of 90 healthy non-diabetic women at 21-40 weeks’ gestation
at study entry. These pregnancies remained uncomplicated and no medication was
administered. Control women participated in the fetal ECG part of the study only;
recordings were made at home16
.
For all participants, the pregnancies were reliably dated using the last menstrual period
and by early ultrasound scan. Recordings started around 17:00 hours lasting for
approximately 15 consecutive hours. Demographic and clinical characteristics were
collected from the patients’ medical charts.
Fetal heart rate monitoring and analysis
The FHR signal was recorded with a portable fetal ECG monitor using five disposable
electrodes placed on the maternal abdomen. The placement of electrodes and
Graatsma_PROEF (all).ps Back - 34 T1 - Black CyanMagentaYellow

Chapter 6: Monitoring maternal glucose & FHR 69
methodology for signal extraction have been described previously16
. All recordings were
performed overnight, during sleep, to minimize maternal abdominal muscle activity that
can distort the fECG signal. Data was downloaded offline. Basal FHR (in bpm) and its short
term variability (STV; in ms) were calculated from consecutive R-R intervals according to
established definitions for computerized FHR analysis17-19
. The FHR data was averaged
over 30-minute periods; time periods with FHR data loss of ≥50% were considered
inappropriate for analysis. For each recording, we also calculated night time (23:00 to
06:00 h) FHR parameters as the mean basal FHR and STV values over twelve 30-min
periods. This way, cross-sectional reference curves over gestation were constructed for
FHR data from the control patients. The night time FHR parameters similarly obtained
from diabetic patients were plotted against the reference curves for comparison.
Continuous Glucose Monitoring
The CGMS measures glucose levels (values blinded to patient and clinician) in the
extracellular fluid of the abdominal subcutaneous tissue, and stores values within a range
of 2.2 – 22.2 mmol/l (40 – 400 mg/dl) every 5 minutes providing 288 readings in 24 hours.
Glucose recordings were considered valid if the criteria for optimal accuracy were met as
defined in previous studies20,21
.
Simultaneous recording of FHR parameters and maternal glucose
Glucose levels of the diabetic women were averaged over 30-minute periods and coupled
to the simultaneously recorded FHR data. In case multiple recordings were performed in a
single participant, a maximum of two recordings were considered appropriate for the
overall analysis only if the recordings were made at least three weeks apart. The dataset
was searched for the occurrence of hyper- and hypoglycaemic events to study the effect
of spontaneous maternal glucose excursions on FHR parameters. Hyperglycaemia was
defined as glucose levels equal to or above 7.8 mmol/l, whereas hypoglycaemia was
defined as glucose levels equal to or below 3.9 mmol/l during at least one hour (two
successive periods of 30 minutes). FHR parameters were examined for two hours prior to
and during the hyper- or hypoglycaemic events.
Graatsma_PROEF (all).ps Front - 35 T1 - Black CyanMagentaYellow

70 Monitoring of fetal heart rate and uterine activity
Figure 1: FHR (A) and STV (B) from women with (pre-)gestational DM plotted against reference
values of FHR as obtained from uncomplicated pregnancies.
Graatsma_PROEF (all).ps Back - 35 T1 - Black CyanMagentaYellow
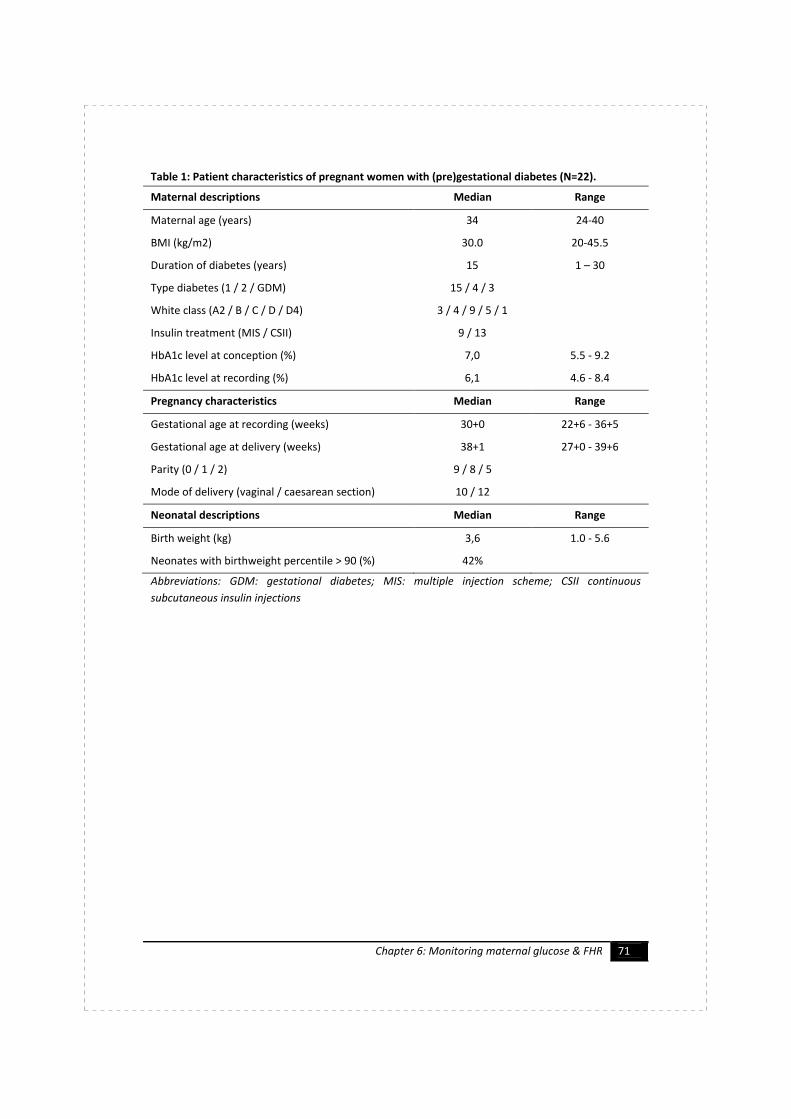
Chapter 6: Monitoring maternal glucose & FHR 71
Table 1: Patient characteristics of pregnant women with (pre)gestational diabetes (N=22).
Maternal descriptions Median Range
Maternal age (years) 34 24-40
BMI (kg/m2) 30.0 20-45.5
Duration of diabetes (years) 15 1 – 30
Type diabetes (1 / 2 / GDM) 15 / 4 / 3
White class (A2 / B / C / D / D4) 3 / 4 / 9 / 5 / 1
Insulin treatment (MIS / CSII) 9 / 13
HbA1c level at conception (%) 7,0 5.5 - 9.2
HbA1c level at recording (%) 6,1 4.6 - 8.4
Pregnancy characteristics Median Range
Gestational age at recording (weeks) 30+0 22+6 - 36+5
Gestational age at delivery (weeks) 38+1 27+0 - 39+6
Parity (0 / 1 / 2) 9 / 8 / 5
Mode of delivery (vaginal / caesarean section) 10 / 12
Neonatal descriptions Median Range
Birth weight (kg) 3,6 1.0 - 5.6
Neonates with birthweight percentile > 90 (%) 42%
Abbreviations: GDM: gestational diabetes; MIS: multiple injection scheme; CSII continuous
subcutaneous insulin injections
Graatsma_PROEF (all).ps Front - 36 T1 - Black CyanMagentaYellow

72 Monitoring of fetal heart rate and uterine activity
Table 2: Results for multilevel analysis of basal fetal heart rate (FHR) and short term variability
(STV) before and during hyper- and hypoglycaemic events (repeated measurements for 5
successive 30-min periods; Time). Model estimates are presented as beta (β) and standard error
(SE) or as F-statistic with their level of significance. A single event per participant was selected for
analysis.
Hyperglycaemia (n = 15) Hypoglycaemia (n = 13)
FHR (bpm) STV (ms) FHR (bpm) STV (ms)
Intercept (β; SE) # 135.0 (3.6) * 8.3 (1.3) * 139.5 (3.4) * 9.6 (1.6) *
Glucose (β; SE) 0.83 (0.32) & -0.09 (0.12) n.s. -0.21 (0.56) n.s. 0.03 (0.21) n.s.
GA at recording (β; SE) -0.40 (0.16) & 0.21 (0.06) $ -0.40 (0.27) n.s. 0.11 (0.14) n.s.
Time (F-statistic; df=4) 0.57 n.s. 0.44 n.s. 1.01 n.s. 1.37 n.s.
Time x Glucose
(F-statistic; df=4)
1.14 n.s. 1.10 n.s. 0.89 n.s. 0.41 n.s.
Table legend: # intercept for gestational age at recording centered at 20 weeks; * p<0.0001; &
p<0.05; $ p<0.005. GA: gestational age.
Statistics
SPSS for Windows (version 15, SPSS Inc., Chicago III.) was used for data management and
statistical analysis. Variables were summarized with the use of standard descriptive
statistics. Reference curves for the FHR parameters in the control group were constructed
using linear regression analysis with linear and cubic components of gestational age.
Relationships between maternal glucose and FHR parameters before and during hyper-
and hypoglycaemic events (five successive 30-min periods) were studied by multilevel
analysis. Duration of maternal diabetes, and HbA1c level and gestational age at recording
were considered as potential confounders. With all tests, significance was assumed at the
level of α = 0.05 (two sided tests).
Results
Twenty-eight simultaneous recordings (total recording time 424 hours) of maternal
glucose and FHR parameters were performed in 22 women with (pre)gestational diabetes.
Six women were monitored on two occasions ≥ 3 weeks apart. Fifteen women (68%) had
type 1 diabetes. Patient baseline characteristics are summarized in Table 1.
In the control group, single FHR recordings were obtained from 90 women at 20-40
weeks’ gestation (median 34 weeks). Five FHR recordings were excluded due to poor
overall signal quality. All fetuses were born after 36 weeks’ gestation (median 39+2
, range
36+1
– 41+6
), weighed between 2660 and 4650 g (median weight 3170 g), and all had a
birth weight <90th percentile for gestation according to customized growth charts22
.
Graatsma_PROEF (all).ps Back - 36 T1 - Black CyanMagentaYellow
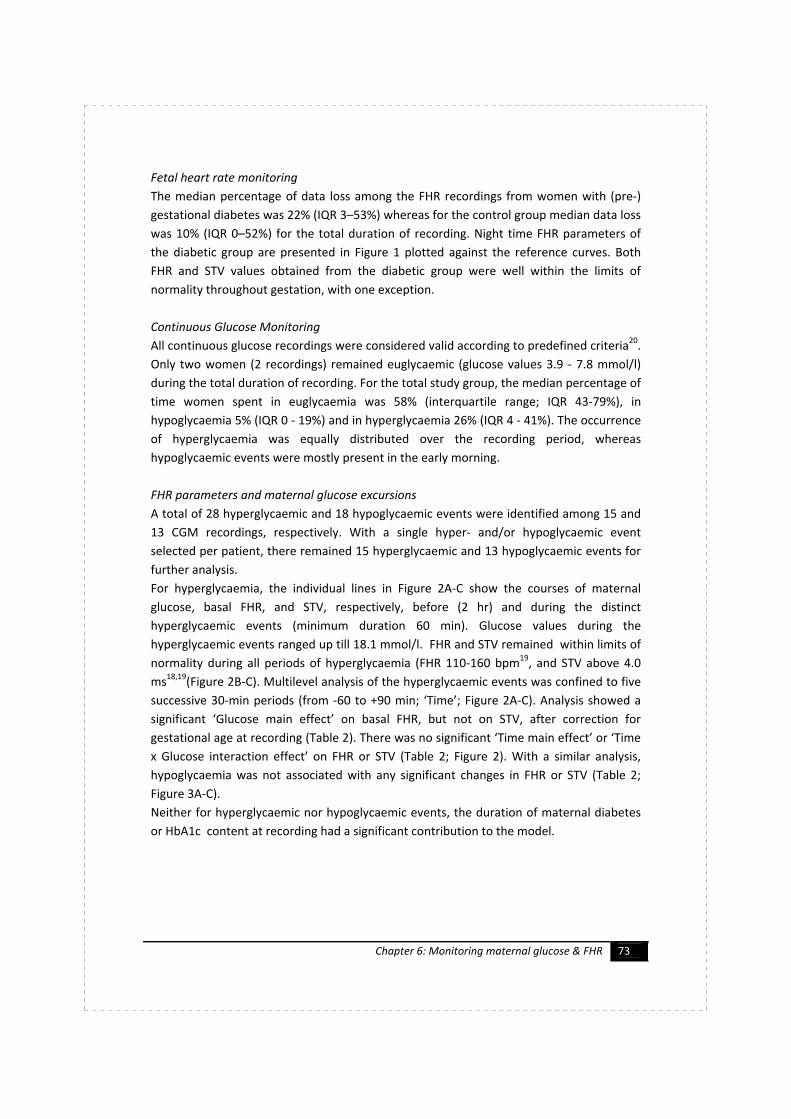
Chapter 6: Monitoring maternal glucose & FHR 73
Fetal heart rate monitoring
The median percentage of data loss among the FHR recordings from women with (pre-)
gestational diabetes was 22% (IQR 3–53%) whereas for the control group median data loss
was 10% (IQR 0–52%) for the total duration of recording. Night time FHR parameters of
the diabetic group are presented in Figure 1 plotted against the reference curves. Both
FHR and STV values obtained from the diabetic group were well within the limits of
normality throughout gestation, with one exception.
Continuous Glucose Monitoring
All continuous glucose recordings were considered valid according to predefined criteria20
.
Only two women (2 recordings) remained euglycaemic (glucose values 3.9 - 7.8 mmol/l)
during the total duration of recording. For the total study group, the median percentage of
time women spent in euglycaemia was 58% (interquartile range; IQR 43-79%), in
hypoglycaemia 5% (IQR 0 - 19%) and in hyperglycaemia 26% (IQR 4 - 41%). The occurrence
of hyperglycaemia was equally distributed over the recording period, whereas
hypoglycaemic events were mostly present in the early morning.
FHR parameters and maternal glucose excursions
A total of 28 hyperglycaemic and 18 hypoglycaemic events were identified among 15 and
13 CGM recordings, respectively. With a single hyper- and/or hypoglycaemic event
selected per patient, there remained 15 hyperglycaemic and 13 hypoglycaemic events for
further analysis.
For hyperglycaemia, the individual lines in Figure 2A-C show the courses of maternal
glucose, basal FHR, and STV, respectively, before (2 hr) and during the distinct
hyperglycaemic events (minimum duration 60 min). Glucose values during the
hyperglycaemic events ranged up till 18.1 mmol/l. FHR and STV remained within limits of
normality during all periods of hyperglycaemia (FHR 110-160 bpm19
, and STV above 4.0
ms18,19
(Figure 2B-C). Multilevel analysis of the hyperglycaemic events was confined to five
successive 30-min periods (from -60 to +90 min; ‘Time’; Figure 2A-C). Analysis showed a
significant ‘Glucose main effect’ on basal FHR, but not on STV, after correction for
gestational age at recording (Table 2). There was no significant ‘Time main effect’ or ‘Time
x Glucose interaction effect’ on FHR or STV (Table 2; Figure 2). With a similar analysis,
hypoglycaemia was not associated with any significant changes in FHR or STV (Table 2;
Figure 3A-C).
Neither for hyperglycaemic nor hypoglycaemic events, the duration of maternal diabetes
or HbA1c content at recording had a significant contribution to the model.
Graatsma_PROEF (all).ps Front - 37 T1 - Black CyanMagentaYellow

74 Monitoring of fetal heart rate and uterine activity
Figure 2: The courses of maternal glucose (A),
basal FHR (B), and STV (C), before, during, and
following hyperglycaemic events. The black
box indicates the first 30-min period of
hyperglycaemia.
Figure 3: The courses of maternal glucose (A),
basal FHR (B), and STV (C), before, during, and
following hypoglycaemic events. The black box
indicates the first 30-min period of
hypoglycaemia.
Discussion
The results of the present study demonstrate an effect of glucose on FHR, but not on STV,
during episodes of hyperglycaemia. Maternal hypoglycaemia, in some studies described to
increase fetal activity23,24
, did not have any effect on FHR parameters.
FHR remained within the ranges of normality during hyperglycaemia18,19
, demonstrating
that hyperglycaemic excursions were well tolerated by the fetuses in our study
population. This finding is comparable to results found in previous studies assessing the
effect of prandial or spontaneous glycaemic changes on FHR parameters with the use of
two or three capillary glucose measurements during 1 hour FHR monitoring11,14
. In studies
failing to demonstrate any changes the primary objective was not to study the effect of
maternal glycaemia on FHR parameters, but to investigate deviations from normality of
FHR parameters regardless of maternal glucose level8,12
. Finally, poor fetal toleration with
A
B
C
Graatsma_PROEF (all).ps Back - 37 T1 - Black CyanMagentaYellow

Chapter 6: Monitoring maternal glucose & FHR 75
tachycardia and late decelerations has been described during extreme hyperglycaemia
with maternal ketoacidosis, but was not found in our study group25,26
.
This is the first study presenting data derived from simultaneous and continuous maternal
glucose and FHR monitoring. Previous studies have shown that in pregnant women with
diabetes glucose values vary largely over the day with hyper- or hypoglycaemia occurring
during prolonged periods and/or reaching extreme values15
. Therefore, combining FHR
and glucose monitoring techniques enables clinicians to assess fetal compensatory
behaviour during such spontaneous glucose excursions. Although the median percentage
of time spent in euglycaemia was only 58%, the number of extreme fluctuations into the
hypo- or hyperglycaemic range was limited in this study. Therefore, the interpretation of
our results remains restricted to the effect of mild glycaemic excursions on FHR.
This study was initiated because of the spontaneous remark of some women with type-1
diabetes to one of us (G.H.A.V.) over the years, that they did not feel the baby moving
anymore in case of high glucose values. This seems plausible given the relationship
between increased fetal glucose and low pH as has been found at cordocentesis5. High
glucose values and placental immaturity with increased distance between maternal
intervillous space and placental capillaries, as has been found in case of maternal
diabetes27,28
may hamper oxygen diffusion and result in lactate accumulation/acidosis.
‘Sudden’ fetal death in case of type-1 diabetes occurs in 1-2 percent of cases1-4
, so our
study may have lacked the power to identify cases at risk. However, it seems a good habit
to ask women about fetal movements in relation to their glucose values.
In conclusion, this study confirms a relationship between maternal glucose and FHR as
present during hyperglycaemia. Since FHR values during hyperglycaemia remain within
levels of normality, these findings are probably a physiological response rather than
pathological. Further studies, assessing fetal behaviour during extreme hyperglycaemia,
need to consolidate whether simultaneous and continuous monitoring of glucose and FHR
can help in the recognition of the fetus increased risk of deterioration.
Graatsma_PROEF (all).ps Front - 38 T1 - Black CyanMagentaYellow
76 Monitoring of fetal heart rate and uterine activity
Reference List
1. Evers IM, de Valk HW, Visser GH. Risk of complications of pregnancy in women with
type 1 diabetes: nationwide prospective study in the Netherlands. BMJ 2004
04/17;328(1468-5833; 7445):915.
2. Macintosh MC, Fleming KM, Bailey JA, Doyle P, Modder J, Acolet D, et al. Perinatal
mortality and congenital anomalies in babies of women with type 1 or type 2 diabetes
in England, Wales, and Northern Ireland: population based study. BMJ 2006 Jul
22;333(7560):177.
3. Penney GC, Mair G, Pearson DW, Scottish Diabetes in Pregnancy Group. Outcomes of
pregnancies in women with type 1 diabetes in Scotland: a national population-based
study. BJOG 2003 Mar;110(3):315-318.
4. Jensen DM, Damm P, Moelsted-Pedersen L, Ovesen P, Westergaard JG, Moeller M, et
al. Outcomes in type 1 diabetic pregnancies: a nationwide, population-based study.
Diabetes Care 2004 Dec;27(12):2819-2823.
5. Salvesen DR, Freeman J, Brudenell JM, Nicolaides KH. Prediction of fetal acidaemia in
pregnancies complicated by maternal diabetes mellitus by biophysical profile scoring
and fetal heart rate monitoring. Br.J.Obstet.Gynaecol. 1993 Mar;100(3):227-233.
6. Lauenborg J, Mathiesen E, Ovesen P, Westergaard JG, Ekbom P, Molsted-Pedersen L,
et al. Audit on stillbirths in women with pregestational type 1 diabetes. Diabetes Care
2003 May;26(5):1385-1389.
7. Landon MB, Gabbe SG. Fetal surveillance and timing of delivery in pregnancy
complicated by diabetes mellitus. Obstet.Gynecol.Clin.North Am. 1996 Mar;23(1):109-
123.
8. Tincello D, White S, Walkinshaw S. Computerised analysis of fetal heart rate
recordings in maternal type I diabetes mellitus. BJOG 2001 Aug;108(8):853-857.
9. Kontopoulos EV, Vintzileos AM. Condition-specific antepartum fetal testing.
Am.J.Obstet.Gynecol. 2004 Nov;191(5):1546-1551.
10. Kariniemi V, Forss M, Siegberg R, Ammala P. Reduced short-term variability of fetal
heart rate in association with maternal hyperglycemia during pregnancy in insulin-
dependent diabetic women. Am.J.Obstet.Gynecol. 1983 Dec 1;147(7):793-794.
11. Costa VN, Nomura RM, Reynolds KS, Miyadahira S, Zugaib M. Effects of maternal
glycemia on fetal heart rate in pregnancies complicated by pregestational diabetes
mellitus. Eur.J.Obstet.Gynecol.Reprod.Biol. 2009 Mar;143(1):14-17.
12. Devoe LD, Youssef AA, Castillo RA, Croom CS. Fetal biophysical activities in third-
trimester pregnancies complicated by diabetes mellitus. Am.J.Obstet.Gynecol. 1994
Aug;171(2):298-303; discussion 303-5.
13. Reece EA, Hagay Z, Roberts AB, DeGennaro N, Homko CJ, Connolly-Diamond M, et al.
Fetal Doppler and behavioral responses during hypoglycemia induced with the insulin
clamp technique in pregnant diabetic women. Am.J.Obstet.Gynecol. 1995 Jan;172(1
Pt 1):151-155.
Graatsma_PROEF (all).ps Back - 38 T1 - Black CyanMagentaYellow
Chapter 6: Monitoring maternal glucose & FHR 77
14. Serra-Serra V, Camara R, Sarrion P, Jareno M, Cervera J, Bellver J, et al. Effects of
prandial glycemic changes on objective fetal heart rate parameters. Acta
Obstet.Gynecol.Scand. 2000 Nov;79(11):953-957.
15. Kerssen A, de Valk HW, Visser GH. Day-to-day glucose variability during pregnancy in
women with Type 1 diabetes mellitus: glucose profiles measured with the Continuous
Glucose Monitoring System. BJOG 2004 09;111(1470-0328; 9):919-924.
16. Graatsma EM, Jacod B, van Egmond L, Mulder E, Visser G. Fetal electrocardiography:
feasibility of long-term fetal heart rate recordings. BJOG 2008 05/18;2008(1471-
0528).
17. Dawes GS. Computerised analysis of the fetal heart rate.
Eur.J.Obstet.Gynecol.Reprod.Biol. 1991 Dec;42 Suppl:S5-8.
18. Nijhuis IJ, Ten Hof J, Mulder EJ, Nijhuis JG, Narayan H, Taylor DJ, et al. Fetal heart rate
in relation to its variation in normal and growth retarded fetuses.
Eur.J.Obstet.Gynecol.Reprod.Biol. 2000 03;89(0301-2115; 1):27-33.
19. Serra V, Bellver J, Moulden M, Redman CW. Computerized analysis of normal fetal
heart rate pattern throughout gestation. Ultrasound Obstet.Gynecol. 2009
Jul;34(1):74-79.
20. Kerssen A, de Valk HW, Visser GH. The Continuous Glucose Monitoring System during
pregnancy of women with type 1 diabetes mellitus: accuracy assessment. Diabetes
Technol.Ther. 2004 10;6(1520-9156; 5):645-651.
21. Mastrototaro J. The MiniMed Continuous Glucose Monitoring System (CGMS).
J.Pediatr.Endocrinol.Metab. 1999;12 Suppl 3:751-758.
22. Visser GH, Eilers PH, Elferink-Stinkens PM, Merkus HM, Wit JM. New Dutch reference
curves for birthweight by gestational age. Early Hum.Dev. 2009 Dec;85(12):737-744.
23. Holden KP, Jovanovic L, Druzin ML, Peterson CM. Increased fetal activity with low
maternal blood glucose levels in pregnancies complicated by diabetes. Am.J.Perinatol.
1984 Jan;1(2):161-164.
24. Persson B, Hanson U. Insulin dependent diabetes in pregnancy: impact of maternal
blood glucose control on the offspring. J.Paediatr.Child Health 1993 Feb;29(1):20-23.
25. Hughes AB. Fetal heart rate changes during diabetic ketosis. Acta
Obstet.Gynecol.Scand. 1987;66(1):71-73.
26. LoBue C, Goodlin RC. Treatment of fetal distress during diabetic keto-acidosis.
J.Reprod.Med. 1978 Feb;20(2):101-104.
27. Evers IM, Nikkels PG, Sikkema JM, Visser GH. Placental pathology in women with type
1 diabetes and in a control group with normal and large-for-gestational-age infants.
Placenta 2003 09;24(0143-4004; 8-9):819-825.
28. Laurini RN, Visser GH, van Ballegooie E. Morphological fetoplacental abnormalities
despite well-controlled diabetic pregnancy. Lancet 1984 04/07;1(0140-6736;
8380):800.
Graatsma_PROEF (all).ps Front - 39 T1 - Black CyanMagentaYellow

78 Monitoring of fetal heart rate and uterine activity
Graatsma_PROEF (all).ps Back - 39 T1 - Black CyanMagentaYellow

Chapter 7: EHG during labour 79
Chapter 7
A validation of
electrohysterography for uterine
activity monitoring during labour
B. C. Jacod
E. M. Graatsma
E. van Hagen
G. H. A. Visser
Journal of Maternal-Fetal and Neonatal Medicine, 2010 Jan;23(1):17-22.
Graatsma_PROEF (all).ps Front - 40 T1 - Black CyanMagentaYellow

80 Monitoring of fetal heart rate and uterine activity
Graatsma_PROEF (all).ps Back - 40 T1 - Black CyanMagentaYellow

Chapter 7: EHG during labour 81
A validation of electrohysterography for uterine
activity monitoring during labour
Abstract
Objectives Validation of electrohysterography (EHG) as a method for uterine activity
monitoring during labour by comparing with intra-uterine pressure catheter (IUPC)
recordings.
Study design Thirty two women in labour participated in a prospective observational study
and performed simultaneous recordings of uterine activity with EHG and IUPC for at least
30 minutes.
Main outcome measures Number of uterine contractions detected by both EHG and IUPC
(sensitivity). Number of contractions detected by EHG only (positive predictive value
(PPV)). Correlation between contraction amplitude and duration measured by EHG and
IUPC.
Results EHG detects uterine contractions accurately: sensitivity=94.5% (95%CI: 87.5–100),
PPV=88.3% (95%CI: 76.2–100). The correlation of contractions’ duration and amplitude
between both methods is r=0.31 (95%CI: 0.23–0.39) and r=0.45 (95%CI: 0.38–0.52),
respectively.
Conclusions EHG detects uterine contractions accurately during labour but the
contraction’s characteristics it measures are not directly comparable with that of IUPC.
Introduction
Recording uterine activity is a standard component of obstetric care during labour. It
informs on the adequacy of uterine activity and is therefore essential to assess progress of
labour. It also gives information on fetal condition when combined with fetal heart rate
recording. The two methods currently used, external tocodynamometry or internal
monitoring using intra-uterine pressure catheters (IUPC) have disadvantages.
Tocodynamometry is non-invasive and easy to use but its recording quality depends on
correct positioning of the sensor on the maternal abdomen and is influenced by maternal
movements and BMI1-3
. Intra-uterine pressure catheters are invasive and have been
associated in rare cases with intra-uterine infection, uterus perforation and placental
abruption1,4
. The search for an alternative has led to the investigation of methods
measuring the uterus’ electrical activity. This approach, denoted either uterine
electromyography (uterine EMG) or electrohysterography (EHG) has been known for more
than fifty years5-7
. It is experiencing a renewed surge of interest recently thanks to
technical improvements and because of indications that it could be able to discriminate
Graatsma_PROEF (all).ps Front - 41 T1 - Black CyanMagentaYellow

82 Monitoring of fetal heart rate and uterine activity
between efficient and inefficient contractions. This distinction is particularly relevant in
the context of threatened preterm labour8-13
.
Although promising results have been obtained on this issue, EHG is a method that is still
under development. Studies focusing on signal analysis have shown that the EHG signal
could be made to agree with IUPC measurements using algorithms of varying complexity14-
18. Only few studies, however, have compared the performance of EHG to other methods
of uterine activity monitoring under conditions representative of clinical practice9,19
. The
objective of the current study is to further consolidate the validation of EHG by comparing
it with the method of reference, IUPC, in clinical practice.
Methods
Population
Thirty two women at term (gestational age ≥37 weeks and <42weeks) admitted to the
labour ward of the University Medical Centre, Utrecht, the Netherlands, for whom use of
an IUPC was considered necessary following the local obstetrical protocol (induction of
labour or labour augmentation). The study was approved by the institutional medical
ethical committee.
Uterine activity registration
Once informed consent had been obtained, the five electrodes of the EHG apparatus
(AN24 Maternal Heart rate/Fetal Heart Rate/EHG recorder, Monica Healthcare,
Nottingham, UK) were positioned on the abdomen: two electrodes along the midline (at
the side of the uterine fundus and above the symphysis), one on each side of the uterus
and the ground electrode on the left flank. Skin impedance was reduced before placing
the electrodes using abrading paper at the electrode placement site. Skin impedance was
below 5 kΩ in all recordings. Data were analysed off line after computer download. The
aim was to register EHG and IUPC simultaneously for at least 30 minutes, although
participants were free to stop prematurely or prolong the EHG registration.
Processing EHG signal
The original raw electrophysiological signal from one pair of electrodes was processed to
extract the EHG signal contained in one low frequency band (0.1 – 0.9 Hz) and
subsequently filtered using a low-pass filter (0.01Hz) to provide an envelope of the signal
comparable with the IUPC recording. This process is illustrated in Figure 1.
Contraction detection
Contractions were identified from both IUPC and EHG signals automatically using a simple
algorithm. The algorithm identifies all maxima in the signal as potentially representing the
top of a contraction. It discards maxima with an amplitude smaller than 5 mmHg (IUPC) or
10 microvolts (EHG) and those maxima much lower than others in the vicinity. The exact
Graatsma_PROEF (all).ps Back - 41 T1 - Black CyanMagentaYellow
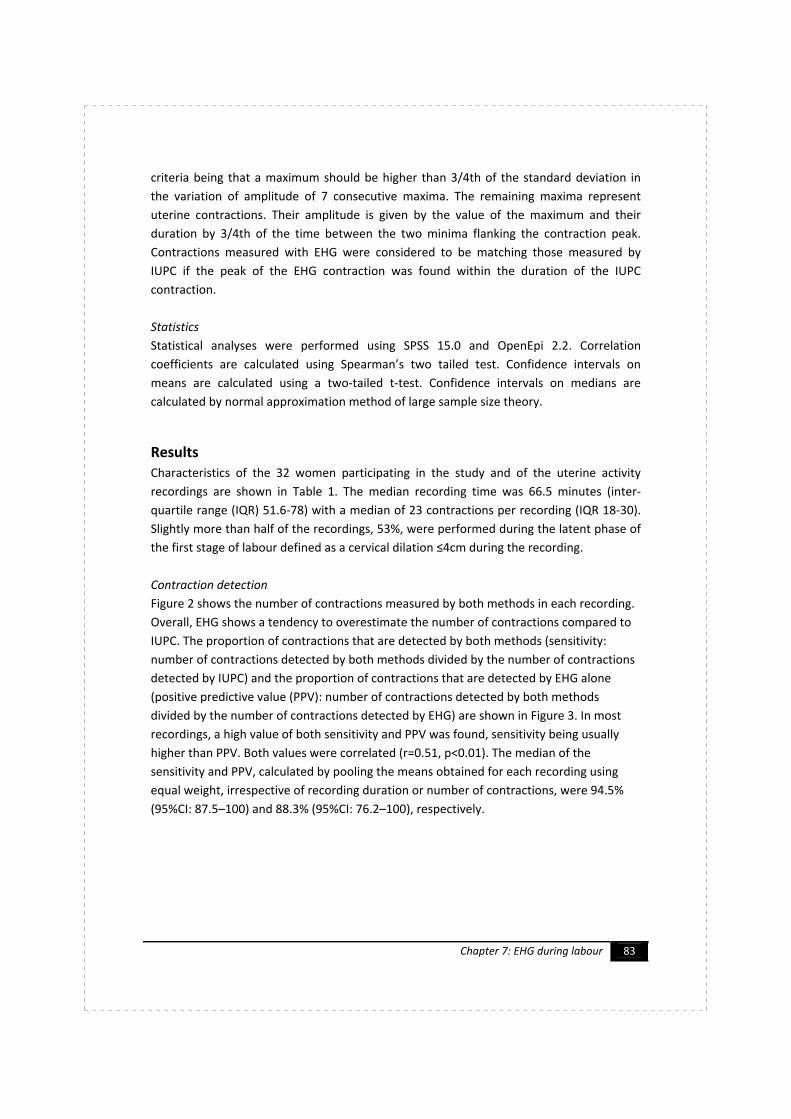
Chapter 7: EHG during labour 83
criteria being that a maximum should be higher than 3/4th of the standard deviation in
the variation of amplitude of 7 consecutive maxima. The remaining maxima represent
uterine contractions. Their amplitude is given by the value of the maximum and their
duration by 3/4th of the time between the two minima flanking the contraction peak.
Contractions measured with EHG were considered to be matching those measured by
IUPC if the peak of the EHG contraction was found within the duration of the IUPC
contraction.
Statistics
Statistical analyses were performed using SPSS 15.0 and OpenEpi 2.2. Correlation
coefficients are calculated using Spearman’s two tailed test. Confidence intervals on
means are calculated using a two-tailed t-test. Confidence intervals on medians are
calculated by normal approximation method of large sample size theory.
Results
Characteristics of the 32 women participating in the study and of the uterine activity
recordings are shown in Table 1. The median recording time was 66.5 minutes (inter-
quartile range (IQR) 51.6-78) with a median of 23 contractions per recording (IQR 18-30).
Slightly more than half of the recordings, 53%, were performed during the latent phase of
the first stage of labour defined as a cervical dilation ≤4cm during the recording.
Contraction detection
Figure 2 shows the number of contractions measured by both methods in each recording.
Overall, EHG shows a tendency to overestimate the number of contractions compared to
IUPC. The proportion of contractions that are detected by both methods (sensitivity:
number of contractions detected by both methods divided by the number of contractions
detected by IUPC) and the proportion of contractions that are detected by EHG alone
(positive predictive value (PPV): number of contractions detected by both methods
divided by the number of contractions detected by EHG) are shown in Figure 3. In most
recordings, a high value of both sensitivity and PPV was found, sensitivity being usually
higher than PPV. Both values were correlated (r=0.51, p<0.01). The median of the
sensitivity and PPV, calculated by pooling the means obtained for each recording using
equal weight, irrespective of recording duration or number of contractions, were 94.5%
(95%CI: 87.5–100) and 88.3% (95%CI: 76.2–100), respectively.
Graatsma_PROEF (all).ps Front - 42 T1 - Black CyanMagentaYellow

84 Monitoring of fetal heart rate and uterine activity
Figure 1: Illustration of the different step of signal processing applied to the raw
electrophysiological signal. Top: raw signal. Second from top: signal after filtering (0.1 -0.9 Hz) to
extract uterine activity information. Third from top: absolute values of filtered signal. Bottom:
Filtering with low-pass 0.01Hz filter to obtain the envelope for comparison with IUPC signal.
Contraction amplitude and duration
The amplitude and duration of the contractions detected by both EHG and IUPC were
compared. Note that the amplitude of the contractions can not be compared directly as
one measures pressure (mmHg) with IUPC compared to electrical activity (μV) with EHG. A
correlation coefficient was calculated in each recording by comparing the amplitude
obtained by both methods in paired contractions. The results are plotted in Figure 4 as a
function of the sensitivity obtained in each recording. The value of the correlation
coefficient varied widely, from below 0.1 to 0.8. It is correlated to the sensitivity (r=0.46,
p<0.01). Overall, the mean correlation coefficient for amplitude obtained by pooling the
results obtained for each recording was 0.45 (95%CI: 0.38–0.52).
A similar approach was used to calculate the correlation coefficient for contraction
duration between both methods (Figure 5). There also, the values of the correlation
Graatsma_PROEF (all).ps Back - 42 T1 - Black CyanMagentaYellow

Chapter 7: EHG during labour 85
coefficient varied widely and were correlated to the sensitivity, albeit, less strongly
(r=0.38, p<0.05). The mean correlation coefficient for duration was 0.31 (95%CI: 0.23–
0.39). In addition, the agreement between both methods was evaluated by calculating the
mean difference in contraction duration for each recording and comparing it to the mean
duration of contractions for that recording. The mean difference is calculated by taking
the mean of the absolute values of the difference in duration in each pair of contractions
in the recording. This data is shown in Figure 6. The agreement between both methods
was best for contractions of short duration but became poorer when contractions lasted
longer. Overall the mean difference in contraction duration represented 27.3% (95%CI:
22.6-32.1) of the mean contraction duration.
All results are summarized in Table 2. We performed statistical analyses to identify factors
influencing the agreement between EHG and IUPC. Age and BMI of the patients were not
correlated to sensitivity, PPV, or correlation coefficients for amplitude or duration of
contractions. Furthermore, we did not find significant differences in the proportion of
recordings with a sensitivity or PPV above 90% or correlation coefficients above 0.5
between nullipara and multipara, between induction and augmentation of labour and
between recordings performed before or after 5cm of cervical dilation. We could not
identify, based on this limited set of data, the conditions for which agreement between
EHG and IUPC can be expected to be poor. On the other hand, the fact that the agreement
between IUPC and EHG does not seem to depend on BMI is an important finding given the
rise of obesity in western countries and confirms previous reports19
.
Table 1: Characteristics of the study population and of the uterine activity recordings.
Study population, N=32
Age (mean (SD)) 31.2 (5.4)
BMI (kg/m 2
) (mean (SD)) 27.2 (6.0)
Nullipara (%) 46.9
Indication for IUPC (%)
Induction of labour 13 (40.6)
Augmentation of labour 17 (53.1)
Epidural anaesthesia 2 (6.3)
Cervical dilation ≤4cm during the recording (%) 53.1
Duration of recordings (min) [median (IQR)] 66.5 (51.6 – 78.0)
Nbr of contractions per recording [median (IQR)] 23 (18 – 30)
Abbreviation: IQR, inter quartile range
Graatsma_PROEF (all).ps Front - 43 T1 - Black CyanMagentaYellow

86 Monitoring of fetal heart rate and uterine activity
Table 2: Results.
Median* or mean
(95% CI)
IQR or SD
Sensitivity (%) 94.5* (87.5 - 100) 86.8-100
Positive predictive value (%) 88.3* (76.2 - 100) 75.9 - 100
Correlation coefficient for the contractions' amplitude, r(a) 0.45 (0.38 - 0.52) 0.2
Correlation coefficient for the contractions' duration, r(d) 0.31 (0.23 - 0.39) 0.21
Normalized mean difference in contration duration (%) 27.3 (22.6 - 32.1) 13.1
Figure 2: Number of contractions measured by
EHG and IUPC for each recording. Grey circles
indicate two recordings with an identical
number of contractions.
Figure 3: Sensitivity and positive predictive
value obtained for each recording. Grey and
black circle indicates two and five recordings
with identical values, respectively.
0
10
20
30
40
50
60
70
80
90
100
0 10 20 30 40 50 60 70 80 90 100
Nu
mb
er
of
co
ntr
ac
tio
ns
on
IU
PC
Number of contractions on EHG
40
50
60
70
80
90
100
50 60 70 80 90 100
PP
V (%
)
Sensitivity (%)
Graatsma_PROEF (all).ps Back - 43 T1 - Black CyanMagentaYellow

Chapter 7: EHG during labour 87
Figure 4: Correlation coefficient of the
contractions’ amplitude between EHG and
IUPC for each recording plotted as a function
of the sensitivity obtained in that recording.
The grey circle indicates 2 recordings with the
same values.
Figure 5: Correlation coefficient of the
contractions’ duration between EHG and IUPC
for each recording plotted as a function of the
sensitivity obtained in that recording. The grey
circle indicates 2 recordings with the same
values.
Figure 6: Agreement between EHG and IUPC in terms of contraction duration. The mean difference
between contraction duration normalized on the mean duration of the contractions is plotted for
each recording as a function of the mean duration of the contractions in this recording. The grey
circle indicates 2 recordings with the same values.
0,0
0,2
0,4
0,6
0,8
1,0
60 70 80 90 100
r (a
mp
litu
de
)
Sensitivity (%)
0,0
0,2
0,4
0,6
0,8
1,0
60 70 80 90 100
r (d
ura
tio
n)
Sensitivity (%)
0
10
20
30
40
50
60
70
80
1,00 1,25 1,50 1,75 2,00 2,25
Me
an
dif
fere
nc
e/M
ea
n d
ura
tio
n (
%)
Mean duration (min)
Graatsma_PROEF (all).ps Front - 44 T1 - Black CyanMagentaYellow

88 Monitoring of fetal heart rate and uterine activity
Discussion
Our study shows that EHG detects uterine contractions accurately during labour but that
the correlation between the two methods regarding contraction’s characteristics
(amplitude and duration) is moderate.
The high rate of concordance between EHG and IUPC concerning the occurrence of
uterine contractions found in the current study confirms results published previously in a
smaller study19
. The sensitivity and PPV values found in that study were 97.2% and 90.6%,
respectively. This is slightly higher than the findings in our cohort. However, the values in
that study were calculated by pooling the contractions of all registrations together. This
means that a long registration with very good agreement could influence the overall
results. Our study shows that EHG can detect most of the contractions that an IUPC would
detect and “adds” a small number of bursts of uterine electrical activity that do not seem
to lead to an increase in intra-uterine pressure. This is due either to the existence of bursts
of electrical activity in the uterus that are not coordinated enough to give rise to a
contraction, or to noise from, for instance, abdominal muscles being mistaken for a
uterine contraction. The latter hypothesis seems more likely given the fact that sensitivity
and PPV are correlated. In other words, there are relatively few extra contractions in those
recordings of good quality where a large proportion of the IUPC contractions are detected
by EHG. Overall, EHG shows the tendency to detect a slightly higher number of
contractions than IUPC.
The comparison of contractions’ amplitude measured by both methods is difficult because
of the different nature of the signal measured. Electrohysterography monitors the process
by which contractions are formed while intra-uterine pressure catheters measure the end
result of that process. Intra-uterine pressure, for instance, depends strongly on the
synchronisation of myometrial activity. Only synchronized contractions will lead to high
intrauterine pressures. On the other hand, even unsynchronized contractions from
myometrial cells can be associated with a high total electrical energy and therefore high
readings with EHG. Moreover, the absolute value of the electrical signal does not have to
be linearly related to intra-uterine pressure but may contain a non-linear component. One
study has reported a good correlation between the total energy of a burst and intra-
uterine pressure (r=0.762, p=0.002)9. This is not confirmed by our study although we only
considered the maximum amplitude and not the total energy. However, an additional
analysis using the product of the maximum amplitude and contraction duration as a
surrogate for the total energy did not improve the correlation coefficient.
Similarly, there is no compelling reason to consider that the duration of the depolarization
phase in the uterus should directly be related to the duration of its effect in terms of intra-
uterine pressure. Uterine activity might start or end with a period of unsynchronized
depolarisation which would not lead to a rise in intra-uterine pressure but be recorded by
EHG. Long IUPC contractions are likely to represent merging double contractions. The
electrical activity of the uterus might not show the same sustained character. The
Graatsma_PROEF (all).ps Back - 44 T1 - Black CyanMagentaYellow

Chapter 7: EHG during labour 89
increasing lack of agreement between IUPC and EHG with increasing contraction’s
duration found in the current study supports this view. Our findings do not agree with that
of Euliano et al.19
who reported that “contraction lengths closely approximated those
calculated from the intra-uterine pressure catheter signal”. It is, however, difficult to
compare their analysis with ours given the fact that they pooled the results of all
contractions while we considered each recording separately.
Overall, the correlation found between EHG and IUPC is nevertheless comparable or
slightly better than that found between IUPC and external tocodynamometry. Miles et al.2
reported a correlation coefficient of only 0.26 for the contraction amplitude and 0.27 for
the contraction duration while there the physiological basis of the measurement methods
are more similar.
Electrohysterography has been studied for more than 50 years but there is still no uniform
way of acquiring and processing the electrical signal coming from the uterus. This lack of
uniformity and the varying definitions for uterine contractions form a limitation of any
study aiming to validate the method, the present one included. We have tried to limit the
influence of having had to define our own set of criteria by applying them consistently to
EHG as well as to IUPC recordings. In addition, the method has been tested under
conditions representative of common clinical practice with prolonged recording time at
each stage of labour. Bearing these limitations in mind, the agreement between the
detection rate found in the current study and the only other study comparable in design,
is noteworthy19
.
The method now seems accurate enough for one to be confident that the EHG signal
represents uterine activity. One should bear in mind, though, that signals of different
nature are measured compared to the usual uterine monitoring techniques and that EHG
is not a direct alternative. The access it provides to the basis of uterine activity, instead of
being a limitation of the method, could, however, be one of its main advantages. The
recent studies published on the characterization of preterm contractions are an example
thereof 8-11,13,20,21
: they have shown that information contained in the power spectrum of
contractions could indicate a difference in the quality of contractions leading to early
delivery compared to those that do not. Additionally, EHG also opens the possibility to
follow the build-up of contractions spatially22,23
. The current study contributes to establish
the validity of this promising method and forms a basis from which more studies along the
directions outlined above can be performed.
Graatsma_PROEF (all).ps Front - 45 T1 - Black CyanMagentaYellow

90 Monitoring of fetal heart rate and uterine activity
Aknowledgements
The authors would like to thank Monica Healthcare, Nottingham, UK, for providing the
EHG recorders and technical assistance on signal processing issues.
Reference List
1. Vanner T, Gardosi J. Intrapartum assessment of uterine activity. Baillieres Clin Obstet
Gynaecol 1996; Jun;10(2):243-57.
2. Miles AM, Monga M, Richeson KS. Correlation of external and internal monitoring of
uterine activity in a cohort of term patients. Am J Perinatol 2001; May;18(3):137-40.
3. Bakker PC, Zikkenheimer M, van Geijn HP. The quality of intrapartum uterine activity
monitoring. J Perinat Med 2008;36(3):197-201.
4. Bakker PC, van Geijn HP. Uterine activity: implications for the condition of the fetus. J
Perinat Med 2008;36(1):30-7.
5. Steer CM, Hertsch GJ. Electrical activity of the human uterus in labor; the
electrohysterograph. Am J Obstet Gynecol 1950; Jan;59(1):25-40.
6. Wolfs GM, van Leeuwen M. Electromyographic observations on the human uterus
during labour. Acta Obstet Gynecol Scand Suppl 1979;90:1-61.
7. Devedeux D, Marque C, Mansour S, Germain G, Duchene J. Uterine
electromyography: a critical review. Am J Obstet Gynecol 1993; Dec;169(6):1636-53.
8. Maner WL, Garfield RE. Identification of human term and preterm labor using artificial
neural networks on uterine electromyography data. Ann Biomed Eng 2007;
Mar;35(3):465-73.
9. Maul H, Maner WL, Olson G, Saade GR, Garfield RE. Non-invasive transabdominal
uterine electromyography correlates with the strength of intrauterine pressure and is
predictive of labor and delivery. J Matern Fetal Neonatal Med 2004; May;15(5):297-
301.
10. Garfield RE, Maner WL. Physiology and electrical activity of uterine contractions.
Semin Cell Dev Biol 2007; Jun;18(3):289-95.
11. Garfield RE, Maner WL, MacKay LB, Schlembach D, Saade GR. Comparing uterine
electromyography activity of antepartum patients versus term labor patients. Am J
Obstet Gynecol 2005; Jul;193(1):23-9.
12. Garfield RE, Maner WL, Maul H, Saade GR. Use of uterine EMG and cervical LIF in
monitoring pregnant patients. BJOG 2005; Mar;112 Suppl 1:103-8.
13. Maner WL, Garfield RE, Maul H, Olson G, Saade G. Predicting term and preterm
delivery with transabdominal uterine electromyography. Obstet Gynecol 2003;
Jun;101(6):1254-60.
14. Maner WL, MacKay LB, Saade GR, Garfield RE. Characterization of abdominally
acquired uterine electrical signals in humans, using a non-linear analytic method. Med
Biol Eng Comput 2006; Mar;44(1-2):117-23.
Graatsma_PROEF (all).ps Back - 45 T1 - Black CyanMagentaYellow

Chapter 7: EHG during labour 91
15. Jezewski J, Horoba K, Matonia A, Wrobel J. Quantitative analysis of contraction
patterns in electrical activity signal of pregnant uterus as an alternative to mechanical
approach. Physiol Meas 2005; Oct;26(5):753-67.
16. Skowronski MD, Harris JG, Marossero DE, Edwards RK, Euliano TY. Prediction of
intrauterine pressure from electrohysterography using optimal linear filtering. IEEE
Trans Biomed Eng 2006; Oct;53(10):1983-9.
17. Euliano T, Skowronski M, Marossero D, Shuster J, Edwards R. Prediction of
intrauterine pressure waveform from transabdominal electrohysterography. J Matern
Fetal Neonatal Med 2006; Dec;19(12):811-6.
18. Rabotti C, Mischi M, van Laar JO, Oei GS, Bergmans JW. Estimation of internal uterine
pressure by joint amplitude and frequency analysis of electrohysterographic signals.
Physiol Meas 2008; Jul;29(7):829-41.
19. Euliano TY, Nguyen MT, Marossero D, Edwards RK. Monitoring contractions in obese
parturients: electrohysterography compared with traditional monitoring. Obstet
Gynecol 2007; May;109(5):1136-40.
20. Verdenik I, Pajntar M, Leskosek B. Uterine electrical activity as predictor of preterm
birth in women with preterm contractions. Eur J Obstet Gynecol Reprod Biol 2001;
Apr;95(2):149-53.
21. Marque CK, Terrien J, Rihana S, Germain G. Preterm labour detection by use of a
biophysical marker: the uterine electrical activity. BMC Pregnancy Childbirth 2007; Jun
1;7 Suppl 1:S5.
22. Rabotti C, Mischi M, van Laar J, Oei G, Bergmans J. Electrohysterographic analysis of
uterine contraction propagation with labor progression: a preliminary study. Conf
Proc IEEE Eng Med Biol Soc 2007;2007:4135-8.
23. Jiang W, Li G, Lin L. Uterine electromyogram topography to represent synchronization
of uterine contractions. Int J Gynaecol Obstet 2007; May;97(2):120-4.
Graatsma_PROEF (all).ps Front - 46 T1 - Black CyanMagentaYellow

92 Monitoring of fetal heart rate and uterine activity
Graatsma_PROEF (all).ps Back - 46 T1 - Black CyanMagentaYellow

Chapter 8: Towards the understanding of labour arrest using EHG 93
Chapter 8
Towards the understanding of
labour arrest using non-invasive
electrohysterography
E. M. Graatsma
B. C. Jacod
B. Vasak
R. K. Stellato
E. J. H. Mulder
G. H. A. Visser
Preliminary report
Graatsma_PROEF (all).ps Front - 47 T1 - Black CyanMagentaYellow

94 Monitoring of fetal heart rate and uterine activity
Graatsma_PROEF (all).ps Back - 47 T1 - Black CyanMagentaYellow

Chapter 8: Towards the understanding of labour arrest using EHG 95
Towards the understanding of labour arrest using
non-invasive electrohysterography
Abstract
Background Approximately 50% of caesarean sections (CS) in nulliparous women at term
are performed because of arrest of labour despite augmentation and continuous
monitoring of uterine activity.
Objectives To study uterine activity in the course of normal dilation using abdominal
electrohysterography (EHG) and to investigate if this technique may help to understand
the aetiology of labour arrest in nulliparous women.
Methods Prospective multi-centre observational study. Uterine activity during (induced or
spontaneous) labour was measured using EHG in nulliparous women with singleton
pregnancies in cephalic position at term (≥ 37 weeks). Progress of labour was monitored
using standard cervical examination from admission to delivery. Electrical activity of the
myometrium during contractions was characterized by its power density spectrum (PDS).
Peak frequencies (PF) of the PDS observed in women undergoing CS for failure to progress
were compared with PF in women reaching full cervical dilation using a matched case-
control analysis.
Results A total of 95 EHG-recordings were made, of which 50 were performed during
spontaneous labour and 45 in induced labour. In both groups the peak frequency
increased significantly with increasing cervical dilation. CS was performed in 19 women
because of arrest of labour (10 in spontaneous and 9 in induced labour). The peak
frequency was higher (borderline significant) in women with CS for first stage labour arrest
compared to women reaching full cervical dilation (OR 1.75; 95%CI [0.97 – 3.16]). This
effect was present in spontaneous labour but not in induced labour.
Conclusions Labour arrest showed a trend towards an association with abnormal
myometrial depolarization patterns in spontaneous term labour. In induced labour this
effect was not observed.
Introduction
The rate of caesarean sections (CS) has increased significantly in all western countries over
the past 20 years1-4
. Low risk nulliparous women, i.e. women with a term singleton fetus in
cephalic presentation, account for a large part to this rise5, with labour arrest as the
leading indication for intervention6. Causes of the rise in CS rate are diverse including an
Graatsma_PROEF (all).ps Front - 48 T1 - Black CyanMagentaYellow
96 Monitoring of fetal heart rate and uterine activity
increase in induced labours, rising maternal age and prepregnancy weight and changing
attitudes towards obstetric risk management and liability3,7,8
. Ultimately, in CS performed
for first stage labour arrest these risk factors often result in dysfunctional uterine
contractility. Understanding of the biological or pathological pathways leading to
dysfunctional contractility is still mostly lacking. There have been several relatively small
studies coupling in-vitro analysis of myometrium contractility to either maternal age or
myometrial pH levels7,9
. These studies provide interesting insights in what might cause
dysfunctional contractions. They are, however, limited by the difficulty to translate
specific laboratory conditions into conditions during labour, and more importantly the
impossibility to consider the uterus as a whole. Nevertheless, they do show that an
understanding of uterine dysfunctionality might be achieved by focusing on its
contractility. Non-invasive electromyography of the uterus’ activity, i.e.
electrohysterography (EHG) provides the possibility of an in-vivo analysis10-13
. Seemingly
chaotic electrical activity caused by myocyte depolarisations can be analysed by several
methods. Most commonly used until now is the power density spectrum (PDS) which
enables to identify the frequency at which most of the myocytes depolarize14
. In preterm
labour there are indications that PDS analysis of the EHG may help in the recognition of
true labour15
. In term labour it is not the recognition of the onset of labour, but the
differentiation between progression of labour and labour arrest that is essential to
improve pregnancy outcome and reduce obstetric interventions.
It was the aim of this study to investigate whether non-invasive monitoring of uterine
activity using electrohysterography may help to differentiate between dysfunctional
labour and normal labour in nulliparous women.
Methods
Study design and population
A prospective multi-center observational study was conducted in The Netherlands from
December 2009 to May 2010. The study was approved by the institutional medical ethical
committees of the participating hospitals.
Inclusion criteria involved nulliparous women with singleton term fetus in cephalic
position (gestational age ≥ 37 weeks) admitted to the labour ward for spontaneous or
induced labour (Figure 1). Exclusion criteria were suspected congenital or chromosomal
abnormalities. After informed consent was obtained, measurements of uterine activity
were performed using the electrohysterogram (EHG) as recorded non-invasively from the
maternal abdominal surface. EHG-recordings started from the onset of labour or during
the first stage of labour upon arrival at the labour ward, until delivery. Progress of labour
was monitored by digital cervical examinations. According to clinical protocol regulations,
cervical examination was performed at least every two hours or more frequently when
indicated. Maternal characteristics, labour characteristics, and neonatal characteristics
were collected from the patients’ charts.
Graatsma_PROEF (all).ps Back - 48 T1 - Black CyanMagentaYellow

Chapter 8: Towards the understanding of labour arrest using EHG 97
Figure 1: Flowchart for the diagnosis of (spontaneous or induced) labour.
Monitoring of uterine activity
Uterine activity was monitored using the portable AN24 Maternal Heart Rate/Fetal Heart
Rate/EHG recorder (AN24, Monica Healthcare Ltd. Nottingham, UK) through five
disposable electrodes that were positioned on the maternal abdomen in a standardized
manner13
. The raw abdominal electromyogram was recorded at 300 Hz and filtered in the
0.1 – 1 Hz bandwidth to obtain the EHG. The algorithm for the identification of
contractions and validation of the method has been described previously in detail13
.
Power density spectral (PDS) analysis was performed to calculate the peak frequency for
each contraction using Scilab and Visual C++. The signal processing steps are illustrated in
Figure 2.
Painful, regular
contractions, ≥2 /10
Ruptured
membranes
In labour
Portio effacement
≥75%
and/or
Not in labour
Induction of labour
because of PROM
Painful, regular
contractions, ≥2 /10 min
AND
Portio effacement ≥75%
and/or
cervical dilation ≥2cm
YES
NO
NO
NO
NO
YES
YES
YES
YES
Induction
of labour
Spontaneous
labour
Inclusion criteria
Nulliparous
Singleton
Cephalic position
Gestational age ≥37
wks
NO
Graatsma_PROEF (all).ps Front - 49 T1 - Black CyanMagentaYellow

98
Figure 2: EHG signal processing steps
Figure
maternal abdomen during labour. Step 2: EHG extraction;
line represents an electrical burst/contraction. Step 3: For each burst/contraction the peak frequency
is calculated with PDS analysis.
St
A matched case
labour. Cases were defined as women with a c
arrest, whereas controls were women who had reached full cervical di
delivery was either vaginal, instrumental (vacuum
second stage labour arrest. Two physicians (M.G., B.V.) independently reviewed each
woman’s chart to ensure that for cases CS was performed only for
and not for other confounding reasons such as fetal distress. Each case was matched with
4 controls within +/
Intravenous oxytocin was administered following local prot
women in the spontaneous subgroup also received oxytocin for labour augmentation.
The main explanatory outcome was the peak frequency (PF) as calculated from PDS
analysis of the EHG. The PF of each contraction was coupled t
determined by cervical examination performed by midwives and obstetricians. For
example, if a CS for first stage labour arrest was performed at approximately 5
cervical dilation, the peak frequencies of all contractions between
cervical dilation minus 1 (5
98
Figure 2: EHG signal processing steps
Figure
maternal abdomen during labour. Step 2: EHG extraction;
line represents an electrical burst/contraction. Step 3: For each burst/contraction the peak frequency
is calculated with PDS analysis.
Statistical analysis
A matched case
labour. Cases were defined as women with a c
arrest, whereas controls were women who had reached full cervical di
delivery was either vaginal, instrumental (vacuum
second stage labour arrest. Two physicians (M.G., B.V.) independently reviewed each
woman’s chart to ensure that for cases CS was performed only for
and not for other confounding reasons such as fetal distress. Each case was matched with
4 controls within +/
Intravenous oxytocin was administered following local prot
women in the spontaneous subgroup also received oxytocin for labour augmentation.
The main explanatory outcome was the peak frequency (PF) as calculated from PDS
analysis of the EHG. The PF of each contraction was coupled t
determined by cervical examination performed by midwives and obstetricians. For
example, if a CS for first stage labour arrest was performed at approximately 5
cervical dilation, the peak frequencies of all contractions between
cervical dilation minus 1 (5
Monitoring
Figure 2: EHG signal processing steps
Figure legend: Step 1: Raw electromyogram from onset of labour until delivery as re
maternal abdomen during labour. Step 2: EHG extraction;
line represents an electrical burst/contraction. Step 3: For each burst/contraction the peak frequency
is calculated with PDS analysis.
atistical analysis
A matched case
labour. Cases were defined as women with a c
arrest, whereas controls were women who had reached full cervical di
delivery was either vaginal, instrumental (vacuum
second stage labour arrest. Two physicians (M.G., B.V.) independently reviewed each
woman’s chart to ensure that for cases CS was performed only for
and not for other confounding reasons such as fetal distress. Each case was matched with
4 controls within +/
Intravenous oxytocin was administered following local prot
women in the spontaneous subgroup also received oxytocin for labour augmentation.
The main explanatory outcome was the peak frequency (PF) as calculated from PDS
analysis of the EHG. The PF of each contraction was coupled t
determined by cervical examination performed by midwives and obstetricians. For
example, if a CS for first stage labour arrest was performed at approximately 5
cervical dilation, the peak frequencies of all contractions between
cervical dilation minus 1 (5
Monitoring
Figure 2: EHG signal processing steps
legend: Step 1: Raw electromyogram from onset of labour until delivery as re
maternal abdomen during labour. Step 2: EHG extraction;
line represents an electrical burst/contraction. Step 3: For each burst/contraction the peak frequency
is calculated with PDS analysis.
atistical analysis
A matched case
labour. Cases were defined as women with a c
arrest, whereas controls were women who had reached full cervical di
delivery was either vaginal, instrumental (vacuum
second stage labour arrest. Two physicians (M.G., B.V.) independently reviewed each
woman’s chart to ensure that for cases CS was performed only for
and not for other confounding reasons such as fetal distress. Each case was matched with
4 controls within +/
Intravenous oxytocin was administered following local prot
women in the spontaneous subgroup also received oxytocin for labour augmentation.
The main explanatory outcome was the peak frequency (PF) as calculated from PDS
analysis of the EHG. The PF of each contraction was coupled t
determined by cervical examination performed by midwives and obstetricians. For
example, if a CS for first stage labour arrest was performed at approximately 5
cervical dilation, the peak frequencies of all contractions between
cervical dilation minus 1 (5
Monitoring of fetal heart rate and uterine activity
Figure 2: EHG signal processing steps
legend: Step 1: Raw electromyogram from onset of labour until delivery as re
maternal abdomen during labour. Step 2: EHG extraction;
line represents an electrical burst/contraction. Step 3: For each burst/contraction the peak frequency
is calculated with PDS analysis.
atistical analysis
A matched case-control analysis was performed separately for spontaneous and induced
labour. Cases were defined as women with a c
arrest, whereas controls were women who had reached full cervical di
delivery was either vaginal, instrumental (vacuum
second stage labour arrest. Two physicians (M.G., B.V.) independently reviewed each
woman’s chart to ensure that for cases CS was performed only for
and not for other confounding reasons such as fetal distress. Each case was matched with
4 controls within +/
Intravenous oxytocin was administered following local prot
women in the spontaneous subgroup also received oxytocin for labour augmentation.
The main explanatory outcome was the peak frequency (PF) as calculated from PDS
analysis of the EHG. The PF of each contraction was coupled t
determined by cervical examination performed by midwives and obstetricians. For
example, if a CS for first stage labour arrest was performed at approximately 5
cervical dilation, the peak frequencies of all contractions between
cervical dilation minus 1 (5
of fetal heart rate and uterine activity
Figure 2: EHG signal processing steps
legend: Step 1: Raw electromyogram from onset of labour until delivery as re
maternal abdomen during labour. Step 2: EHG extraction;
line represents an electrical burst/contraction. Step 3: For each burst/contraction the peak frequency
is calculated with PDS analysis.
control analysis was performed separately for spontaneous and induced
labour. Cases were defined as women with a c
arrest, whereas controls were women who had reached full cervical di
delivery was either vaginal, instrumental (vacuum
second stage labour arrest. Two physicians (M.G., B.V.) independently reviewed each
woman’s chart to ensure that for cases CS was performed only for
and not for other confounding reasons such as fetal distress. Each case was matched with
4 controls within +/-
Intravenous oxytocin was administered following local prot
women in the spontaneous subgroup also received oxytocin for labour augmentation.
The main explanatory outcome was the peak frequency (PF) as calculated from PDS
analysis of the EHG. The PF of each contraction was coupled t
determined by cervical examination performed by midwives and obstetricians. For
example, if a CS for first stage labour arrest was performed at approximately 5
cervical dilation, the peak frequencies of all contractions between
cervical dilation minus 1 (5
of fetal heart rate and uterine activity
Figure 2: EHG signal processing steps
legend: Step 1: Raw electromyogram from onset of labour until delivery as re
maternal abdomen during labour. Step 2: EHG extraction;
line represents an electrical burst/contraction. Step 3: For each burst/contraction the peak frequency
is calculated with PDS analysis.
control analysis was performed separately for spontaneous and induced
labour. Cases were defined as women with a c
arrest, whereas controls were women who had reached full cervical di
delivery was either vaginal, instrumental (vacuum
second stage labour arrest. Two physicians (M.G., B.V.) independently reviewed each
woman’s chart to ensure that for cases CS was performed only for
and not for other confounding reasons such as fetal distress. Each case was matched with
1 cm of the maximal achieved cervical dilation prior to CS.
Intravenous oxytocin was administered following local prot
women in the spontaneous subgroup also received oxytocin for labour augmentation.
The main explanatory outcome was the peak frequency (PF) as calculated from PDS
analysis of the EHG. The PF of each contraction was coupled t
determined by cervical examination performed by midwives and obstetricians. For
example, if a CS for first stage labour arrest was performed at approximately 5
cervical dilation, the peak frequencies of all contractions between
cervical dilation minus 1 (5 -
of fetal heart rate and uterine activity
Figure 2: EHG signal processing steps
legend: Step 1: Raw electromyogram from onset of labour until delivery as re
maternal abdomen during labour. Step 2: EHG extraction;
line represents an electrical burst/contraction. Step 3: For each burst/contraction the peak frequency
control analysis was performed separately for spontaneous and induced
labour. Cases were defined as women with a c
arrest, whereas controls were women who had reached full cervical di
delivery was either vaginal, instrumental (vacuum
second stage labour arrest. Two physicians (M.G., B.V.) independently reviewed each
woman’s chart to ensure that for cases CS was performed only for
and not for other confounding reasons such as fetal distress. Each case was matched with
1 cm of the maximal achieved cervical dilation prior to CS.
Intravenous oxytocin was administered following local prot
women in the spontaneous subgroup also received oxytocin for labour augmentation.
The main explanatory outcome was the peak frequency (PF) as calculated from PDS
analysis of the EHG. The PF of each contraction was coupled t
determined by cervical examination performed by midwives and obstetricians. For
example, if a CS for first stage labour arrest was performed at approximately 5
cervical dilation, the peak frequencies of all contractions between
1 = 4 cm) until the CS were assessed and compared to the
of fetal heart rate and uterine activity
legend: Step 1: Raw electromyogram from onset of labour until delivery as re
maternal abdomen during labour. Step 2: EHG extraction;
line represents an electrical burst/contraction. Step 3: For each burst/contraction the peak frequency
control analysis was performed separately for spontaneous and induced
labour. Cases were defined as women with a ca
arrest, whereas controls were women who had reached full cervical di
delivery was either vaginal, instrumental (vacuum
second stage labour arrest. Two physicians (M.G., B.V.) independently reviewed each
woman’s chart to ensure that for cases CS was performed only for
and not for other confounding reasons such as fetal distress. Each case was matched with
1 cm of the maximal achieved cervical dilation prior to CS.
Intravenous oxytocin was administered following local prot
women in the spontaneous subgroup also received oxytocin for labour augmentation.
The main explanatory outcome was the peak frequency (PF) as calculated from PDS
analysis of the EHG. The PF of each contraction was coupled t
determined by cervical examination performed by midwives and obstetricians. For
example, if a CS for first stage labour arrest was performed at approximately 5
cervical dilation, the peak frequencies of all contractions between
1 = 4 cm) until the CS were assessed and compared to the
of fetal heart rate and uterine activity
legend: Step 1: Raw electromyogram from onset of labour until delivery as re
maternal abdomen during labour. Step 2: EHG extraction; Upper
line represents an electrical burst/contraction. Step 3: For each burst/contraction the peak frequency
control analysis was performed separately for spontaneous and induced
aesarean section for first stage labour
arrest, whereas controls were women who had reached full cervical di
delivery was either vaginal, instrumental (vacuum -
second stage labour arrest. Two physicians (M.G., B.V.) independently reviewed each
woman’s chart to ensure that for cases CS was performed only for
and not for other confounding reasons such as fetal distress. Each case was matched with
1 cm of the maximal achieved cervical dilation prior to CS.
Intravenous oxytocin was administered following local prot
women in the spontaneous subgroup also received oxytocin for labour augmentation.
The main explanatory outcome was the peak frequency (PF) as calculated from PDS
analysis of the EHG. The PF of each contraction was coupled t
determined by cervical examination performed by midwives and obstetricians. For
example, if a CS for first stage labour arrest was performed at approximately 5
cervical dilation, the peak frequencies of all contractions between
1 = 4 cm) until the CS were assessed and compared to the
legend: Step 1: Raw electromyogram from onset of labour until delivery as re
Upper
line represents an electrical burst/contraction. Step 3: For each burst/contraction the peak frequency
control analysis was performed separately for spontaneous and induced
esarean section for first stage labour
arrest, whereas controls were women who had reached full cervical di
- or forcipal extraction), or CS for
second stage labour arrest. Two physicians (M.G., B.V.) independently reviewed each
woman’s chart to ensure that for cases CS was performed only for
and not for other confounding reasons such as fetal distress. Each case was matched with
1 cm of the maximal achieved cervical dilation prior to CS.
Intravenous oxytocin was administered following local prot
women in the spontaneous subgroup also received oxytocin for labour augmentation.
The main explanatory outcome was the peak frequency (PF) as calculated from PDS
analysis of the EHG. The PF of each contraction was coupled t
determined by cervical examination performed by midwives and obstetricians. For
example, if a CS for first stage labour arrest was performed at approximately 5
cervical dilation, the peak frequencies of all contractions between
1 = 4 cm) until the CS were assessed and compared to the
legend: Step 1: Raw electromyogram from onset of labour until delivery as re
line indicates uterine activity;
line represents an electrical burst/contraction. Step 3: For each burst/contraction the peak frequency
control analysis was performed separately for spontaneous and induced
esarean section for first stage labour
arrest, whereas controls were women who had reached full cervical di
or forcipal extraction), or CS for
second stage labour arrest. Two physicians (M.G., B.V.) independently reviewed each
woman’s chart to ensure that for cases CS was performed only for
and not for other confounding reasons such as fetal distress. Each case was matched with
1 cm of the maximal achieved cervical dilation prior to CS.
Intravenous oxytocin was administered following local protocol for labour induction; some
women in the spontaneous subgroup also received oxytocin for labour augmentation.
The main explanatory outcome was the peak frequency (PF) as calculated from PDS
analysis of the EHG. The PF of each contraction was coupled t
determined by cervical examination performed by midwives and obstetricians. For
example, if a CS for first stage labour arrest was performed at approximately 5
cervical dilation, the peak frequencies of all contractions between
1 = 4 cm) until the CS were assessed and compared to the
legend: Step 1: Raw electromyogram from onset of labour until delivery as re
line indicates uterine activity;
line represents an electrical burst/contraction. Step 3: For each burst/contraction the peak frequency
control analysis was performed separately for spontaneous and induced
esarean section for first stage labour
arrest, whereas controls were women who had reached full cervical di
or forcipal extraction), or CS for
second stage labour arrest. Two physicians (M.G., B.V.) independently reviewed each
woman’s chart to ensure that for cases CS was performed only for
and not for other confounding reasons such as fetal distress. Each case was matched with
1 cm of the maximal achieved cervical dilation prior to CS.
ocol for labour induction; some
women in the spontaneous subgroup also received oxytocin for labour augmentation.
The main explanatory outcome was the peak frequency (PF) as calculated from PDS
analysis of the EHG. The PF of each contraction was coupled t
determined by cervical examination performed by midwives and obstetricians. For
example, if a CS for first stage labour arrest was performed at approximately 5
cervical dilation, the peak frequencies of all contractions between
1 = 4 cm) until the CS were assessed and compared to the
legend: Step 1: Raw electromyogram from onset of labour until delivery as re
line indicates uterine activity;
line represents an electrical burst/contraction. Step 3: For each burst/contraction the peak frequency
control analysis was performed separately for spontaneous and induced
esarean section for first stage labour
arrest, whereas controls were women who had reached full cervical di
or forcipal extraction), or CS for
second stage labour arrest. Two physicians (M.G., B.V.) independently reviewed each
woman’s chart to ensure that for cases CS was performed only for first stage labour arrest
and not for other confounding reasons such as fetal distress. Each case was matched with
1 cm of the maximal achieved cervical dilation prior to CS.
ocol for labour induction; some
women in the spontaneous subgroup also received oxytocin for labour augmentation.
The main explanatory outcome was the peak frequency (PF) as calculated from PDS
analysis of the EHG. The PF of each contraction was coupled to labour progression as
determined by cervical examination performed by midwives and obstetricians. For
example, if a CS for first stage labour arrest was performed at approximately 5
cervical dilation, the peak frequencies of all contractions between
1 = 4 cm) until the CS were assessed and compared to the
legend: Step 1: Raw electromyogram from onset of labour until delivery as re
line indicates uterine activity;
line represents an electrical burst/contraction. Step 3: For each burst/contraction the peak frequency
control analysis was performed separately for spontaneous and induced
esarean section for first stage labour
arrest, whereas controls were women who had reached full cervical dilation Their mode of
or forcipal extraction), or CS for
second stage labour arrest. Two physicians (M.G., B.V.) independently reviewed each
first stage labour arrest
and not for other confounding reasons such as fetal distress. Each case was matched with
1 cm of the maximal achieved cervical dilation prior to CS.
ocol for labour induction; some
women in the spontaneous subgroup also received oxytocin for labour augmentation.
The main explanatory outcome was the peak frequency (PF) as calculated from PDS
o labour progression as
determined by cervical examination performed by midwives and obstetricians. For
example, if a CS for first stage labour arrest was performed at approximately 5
the maximal reached
1 = 4 cm) until the CS were assessed and compared to the
legend: Step 1: Raw electromyogram from onset of labour until delivery as re
line indicates uterine activity;
line represents an electrical burst/contraction. Step 3: For each burst/contraction the peak frequency
control analysis was performed separately for spontaneous and induced
esarean section for first stage labour
lation Their mode of
or forcipal extraction), or CS for
second stage labour arrest. Two physicians (M.G., B.V.) independently reviewed each
first stage labour arrest
and not for other confounding reasons such as fetal distress. Each case was matched with
1 cm of the maximal achieved cervical dilation prior to CS.
ocol for labour induction; some
women in the spontaneous subgroup also received oxytocin for labour augmentation.
The main explanatory outcome was the peak frequency (PF) as calculated from PDS
o labour progression as
determined by cervical examination performed by midwives and obstetricians. For
example, if a CS for first stage labour arrest was performed at approximately 5
the maximal reached
1 = 4 cm) until the CS were assessed and compared to the
legend: Step 1: Raw electromyogram from onset of labour until delivery as recorded from the
line indicates uterine activity;
line represents an electrical burst/contraction. Step 3: For each burst/contraction the peak frequency
control analysis was performed separately for spontaneous and induced
esarean section for first stage labour
lation Their mode of
or forcipal extraction), or CS for
second stage labour arrest. Two physicians (M.G., B.V.) independently reviewed each
first stage labour arrest
and not for other confounding reasons such as fetal distress. Each case was matched with
1 cm of the maximal achieved cervical dilation prior to CS.
ocol for labour induction; some
women in the spontaneous subgroup also received oxytocin for labour augmentation.
The main explanatory outcome was the peak frequency (PF) as calculated from PDS
o labour progression as
determined by cervical examination performed by midwives and obstetricians. For
example, if a CS for first stage labour arrest was performed at approximately 5
the maximal reached
1 = 4 cm) until the CS were assessed and compared to the
corded from the
line indicates uterine activity; Lower
line represents an electrical burst/contraction. Step 3: For each burst/contraction the peak frequency
control analysis was performed separately for spontaneous and induced
esarean section for first stage labour
lation Their mode of
or forcipal extraction), or CS for
second stage labour arrest. Two physicians (M.G., B.V.) independently reviewed each
first stage labour arrest
and not for other confounding reasons such as fetal distress. Each case was matched with
1 cm of the maximal achieved cervical dilation prior to CS.
ocol for labour induction; some
women in the spontaneous subgroup also received oxytocin for labour augmentation.
The main explanatory outcome was the peak frequency (PF) as calculated from PDS
o labour progression as
determined by cervical examination performed by midwives and obstetricians. For
example, if a CS for first stage labour arrest was performed at approximately 5-6 cm
the maximal reached
1 = 4 cm) until the CS were assessed and compared to the
corded from the
Lower
line represents an electrical burst/contraction. Step 3: For each burst/contraction the peak frequency
control analysis was performed separately for spontaneous and induced
esarean section for first stage labour
lation Their mode of
or forcipal extraction), or CS for
second stage labour arrest. Two physicians (M.G., B.V.) independently reviewed each
first stage labour arrest
and not for other confounding reasons such as fetal distress. Each case was matched with
1 cm of the maximal achieved cervical dilation prior to CS.
ocol for labour induction; some
women in the spontaneous subgroup also received oxytocin for labour augmentation.
The main explanatory outcome was the peak frequency (PF) as calculated from PDS
o labour progression as
determined by cervical examination performed by midwives and obstetricians. For
6 cm
the maximal reached
1 = 4 cm) until the CS were assessed and compared to the
corded from the
Lower
line represents an electrical burst/contraction. Step 3: For each burst/contraction the peak frequency
control analysis was performed separately for spontaneous and induced
esarean section for first stage labour
lation Their mode of
or forcipal extraction), or CS for
second stage labour arrest. Two physicians (M.G., B.V.) independently reviewed each
first stage labour arrest
and not for other confounding reasons such as fetal distress. Each case was matched with
1 cm of the maximal achieved cervical dilation prior to CS.
ocol for labour induction; some
The main explanatory outcome was the peak frequency (PF) as calculated from PDS
o labour progression as
determined by cervical examination performed by midwives and obstetricians. For
6 cm
the maximal reached
1 = 4 cm) until the CS were assessed and compared to the
Graatsma_PROEF (all).ps Back - 49 T1 - Black CyanMagentaYellow

Chapter 8: Towards the understanding of labour arrest using EHG 99
peak frequency of controls between -1cm and +1cm cervical dilation (for this example the
PF’s of contractions of the control recording from 4-7 cm cervical dilation).
Baseline characteristics of the matched study population were calculated with the use of
standard descriptive statistics; medians and ranges (minimum and maximum), unless
reported otherwise. The optimal measure of peak frequency (mean-PF, PF-standard
deviation, median-PF, and PF-percentiles) was chosen using Receiver Operating
Characteristics (ROC) curves. Median PF values and interquartile ranges for five stages of
cervical dilation were calculated from all contractions in controls. Median PF per ‘stage’ of
cervical dilation were compared using one way ANOVA with Bonferroni post hoc testing.
A conditional logistic regression model was estimated using the optimal measure of peak
frequency and potential confounders (gestational age, maternal age and BMI) to calculate
odds ratios (OR) for the occurrence of CS for first stage labour arrest. Potential
confounders were added to the model using forward stepwise selection; as a final step the
optimal measure of peak frequency was added. Neonatal birth weight was not included as
a potential confounder since antenatal birth weight estimations (by ultrasound or manual)
have been found to exhibit large variations compared to true birth weight. ORs for the
measures of peak frequency are presented for an increase of 0.05 Hz, and ORs for
gestational age for an increase of 1 week.
In order to investigate the potential effect of oxytocin within the spontaneous labour
subgroup, a separate model was estimated.
Results
A total of nineteen cases with a CS during the first stage, were randomly matched with
seventy-six controls (ratio 1:4). Baseline characteristics for matched cases and controls are
described in Table 1. In the induced labour subgroup, all cases and nearly all controls
received intravenous oxytocin administration, whereas in the spontaneous subgroup 65%
of controls received oxytocin and 100% of cases. The indications for induction of labour
and/or referral for medically assisted delivery are summarized in Table 2. The mode of
delivery in controls and cervical dilation (cm) at CS for labour arrest in cases are displayed
in Table 3.
Graatsma_PROEF (all).ps Front - 50 T1 - Black CyanMagentaYellow

100 Monitoring of fetal heart rate and uterine activity
Table 1: Study characteristics of the matched cases and controls. All values displayed as medians,
ranges (min-max) or numbers and percentages.
Spontaneous labour (N = 50) Labour induction (N = 45)
Controls
(N = 40)
Cases
(N=10)
Controls
(N = 36)
Cases
(N = 9)
Maternal characteristics
Maternal age 31 (20-42) 32 (26-37) 32 (23-45) 33 (27-42)
Body Mass Index 27.0
(18.8-32.2)
27.0
(17.7-42,0)
27.9
(19.7-47.5)
31.1
(23.6-37.6)
Gestational age (weeks) 39+6
(37+6 - 41+6)
41+0
(39+3 - 42+2)
39+1
(37+0 - 42+0)
40+5
(38+0 - 42+0)
Labour characteristics
Labour induction
(prostaglandines)
- - 13/36 (36%) 3/9 (33%)
Labour augmentation
(oxytocin)
26/40 (65%) 10/10 (100%) 34/36 (94%) 9/9 (100%)
Epidural analgesia 21/40 (53%) 8/10 (80%) 22/36 (61%) 7/9 (78%)
Neonatal characteristics
Birth weight (grams) 3500
(2330-4290)
3863
(3400-4460)
3200
(2320-4800)
3820
(2650-4960)
Table 2: Most frequent indication for induction and complications of pregnancy of delivery.
% N
Spontaneous labour
Meconium stained amniotic fluid 10% 5/50
First stage labour arrest 30% 15/50
Epidural analgesia 32% 16/50
Induction of labour
Meconium stained amniotic fluid 7% 3/45
(Pre)gestational diabetes 11% 5/45
Post term pregnancy 16% 7/45
Hypertensive disorders in pregnancy 27% 12/45
Graatsma_PROEF (all).ps Back - 50 T1 - Black CyanMagentaYellow

Chapter 8: Towards the understanding of labour arrest using EHG 101
Table 3: Mode of delivery in matched population and cervical dilation at labour arrest in cases.
Mode of delivery in matched population Spontaneous N (%) Induction N (%)
Vaginal 31/50 (62%) 24/45 (54%)
Instrumental 4/50 (8%) 6/45 (13%)
CS second stage arrest 5/50 (10%) 6/45 (13%)
CS first stage arrest 10/50 (20%) 9/45 (20%)
Cervical dilation (cm) at caesarean section in CASES Spontaneous N (%) Induction N (%)
0-2 cm - -
2-4 cm 2/10 (20%) 1/9 (11%)
4-6 cm 5/10 (50%) 2/9 (22%)
6-8 cm 2/10 (20%) 3/9 (33%)
8-10 cm 1/10 (10%) 3/9 (33%)
The median peak frequency (median-PF) was selected as optimal value on the basis of the
ROC analyses (data not shown). Median and interquartile ranges of the median-PF in
spontaneous labour were 0.49 (IQR 0.46-0.53) in controls and 0.55 (IQR 0.47-0.60) in
cases, and in induced labour 0.53 (IQR 0.49-0.57) in controls and 0.49 (IQR 0.47-0.57) in
cases. The number of contractions, median peak frequency (PF) and interquartile range
(IQR) per centimeter cervical dilation as calculated from both spontaneous - and induced
labour are displayed in table 4 (uterine characteristics from women receiving CS for arrest
of labour were excluded). Compared to spontaneous labour the median PF was generally
higher in induced labour. The median PF increased significantly with increasing cervical
dilation (spontaneous labour F(4, 6695) = 18.24, p-value < 0.001, induced labour
F(4,13019) = 36.6, p-value <0.001).
Maternal age and BMI did not contribute significantly to the conditional logistic regression
models, and were therefore not included. Gestational age was a significant predictor of CS
in both the spontaneous (OR=1.12, 95% CI: [1.02 – 1.22]) and induced labour groups
(OR=1.09, 95% CI: [1.01 – 1.17]). In spontaneous labour the median-PF was borderline
significant (OR=1.75, 95% CI [0.97 – 3.16]), whereas for induction of labour the median-PF
was not a significant predictor of CS (OR=0.63, 95% CI [0.32 – 1.24]), see Table 5.
A separate model within the spontaneous subgroup of cases and controls with oxytocin
administration for labour augmentation showed inconclusive results due to a small
number of cases and controls (data not shown).
Graatsma_PROEF (all).ps Front - 51 T1 - Black CyanMagentaYellow

102 Monitoring of fetal heart rate and uterine activity
Table 4: Number of contractions, median peak frequency (PF, in Hz) and interquartile range (IQR)
per centimeter cervical dilation as calculated from uncomplicated spontaneous - and induced
labour.
Spontaneous labour Induction of labour
Cervial
dilation
Number of
contractions
Median
PF (Hz)
IQR Cervial
dilation
Number of
contractions
Median
PF (Hz)
IQR
0-2 cm 101 0.45 0.39-0.50 0-2 cm 1126 0.51 0.45-0.57
2-4 cm 924 0.49 0.41-0.59 2-4 cm 3419 0.53 0.45-0.61
4-6 cm 1350 0.49 0.41-0.57 4-6 cm 2548 0.53 0.45-0.59
6-8 cm 1693 0.51 0.43-0.59 6-8 cm 2736 0.53 0.45-0.61
8-10 cm 2632 0.51 0.45-0.59 8-10 cm 3195 0.55 0.47-0.63
Table legend: PF values (in Hz) from all contractions from controls were included in the table.
Comparison of the median PF with One way ANOVA demonstrated a significant rise in median PF
with increasing cervical dilation in both spontaneous and induced labour ((F4,6695) = 18.24, p <0.001
and (F(4:13019) = 36.6, p <0.001, respectively). Abbreviations:PF, peak frequency; IQR,inter quartile
range
Table 5: Results of conditional logistic regression analysis for the prediction of caesarean section.
OR 95% CI
Spontaneous labour Gestational age 1.12 (1.02-1.22)
Median PF 1.75 (0.97-3.16)
Induced labour Gestational age 1.09 (1.01-1.17)
Median PF 0.63 (0.32-1.24)
Table legend: Odds ratios for the measures of peak frequency (median PF) are presented for an
increase of 0.05 Hz, and OR for gestational age for an increase of 1 week. Abbreviations: OR: odds
ratio, PF: peak frequency
Discussion
This article reports preliminary data of the first large scale prospective study using power
density spectral analysis of non-invasive EHG to differentiate between normal progression
of term labour and first stage labour arrest leading to caesarean section. Our data
demonstrate that EHG peak frequencies show a trend towards significance in predicting
CS for labour arrest in spontaneous labour, but not in induced labour. This is a novel
finding that has not been reported earlier. The fact that the peak frequency of the power
spectrum density increases with increasing cervical dilation is in agreement with studies
on preterm labour. These studies have shown that a higher PF was predictive of a short
recording-delivery interval14,15
. Similarly, it has been shown that the PF decreases after the
administration of tocolytic drugs16
.
Power spectrum analysis of EHG has proven to be particularly useful in quantifying uterine
EMG13,14
and has been demonstrated to differentiate between true and false labour in
Graatsma_PROEF (all).ps Back - 51 T1 - Black CyanMagentaYellow
Chapter 8: Towards the understanding of labour arrest using EHG 103
women with (pre)term contractions10,14
. We hypothesized that this effect in preterm
labour could be translated into a difference between efficient and inefficient contractions
in term labour. First stage labour arrest is easy to diagnose with advancing time and
regular cervical examinations. Therefore, the added value of EHG does not lie in the
diagnosis of the condition but in its potential for understanding its pathophysiological
background. It is of interest that none of the current techniques of contraction monitoring
have an impact on reducing CS rates17
. Faced with labour arrest, the obstetrician has
limited options. Until now, no augmentation protocol has been proven to be superior.
Likewise, active management of labour, a concept including several aspects, from one-to-
one nursing to strict definition of labour, has not been shown to decrease the rate of CS
significantly18
, apart from the presence of a doula19
.
It is time for a more thorough understanding of the pathophysiology of labour arrest. EHG
might help to target different types of intervention in appropriate groups of women in
labour. Some women might show good response to early, high dosage oxytocin schemes
while others might benefit more from expectant management. In this context it is
particularly interesting that a recent study by Quenby discussed that oxytocin, instead of
increasing the contraction efficiency, might degrade uterine efficiency by increasing the
degree of lactic acidosis present in myometrial cells9. Furthermore, similar to our study
results, the study by Quenby could only describe significant differences in myometrial pH
in spontaneous labour and not in induced labour9. This finding suggests that the
mechanisms underlying normal or dysfunctional induced labour might be different in case
of spontaneous labour onset as compared to induced labour .
One of the strengths of the present study is the homogeneous study population; solely
nulliparous women, cervical assessment at set times (every 2 hours, or more when
indicated) and standard augmentation protocol was followed. Furthermore diagnosis of
labour arrest was confirmed by independent obstetricians to prevent selection bias. There
are, however, also several limitations to this study. Due to the small number of cases, we
could not match cases on a number of potential confounders (BMI, maternal age, and
gestational age) instead these potential confounders were added to logistic regression
models according to a stepwise procedure. Furthermore, although several authors
performed EHG recordings to study (pre)term labour there is no consensus on the
technique to be used for EHG analysis. For identification of the optimal technique for EHG
analysis, our data should be reassessed with other available analysis techniques.
The results presented are preliminary data from an ongoing study. Improvement of both
the EHG analysis technique and larger numbers of cases might further consolidate the
value of EHG monitoring for the identification of labour arrest.
Graatsma_PROEF (all).ps Front - 52 T1 - Black CyanMagentaYellow

104 Monitoring of fetal heart rate and uterine activity
Conclusion
Labour arrest showed a trend towards an association with abnormal myometrial
depolarization patterns in spontaneous term labour. In induced labour this effect was
absent.
Graatsma_PROEF (all).ps Back - 52 T1 - Black CyanMagentaYellow

Chapter 8: Towards the understanding of labour arrest using EHG 105
Reference List
1. Martin JA, Hamilton BE, Sutton PD, Ventura SJ, Menacker F, Kirmeyer S, et al. Births:
final data for 2005. Natl.Vital Stat.Rep. 2007 Dec 5;56(6):1-103.
2. RCOG. Caesarean sectio. 2008.
3. Kwee A, Elferink-Stinkens PM, Reuwer PJ, Bruinse HW. Trends in obstetric
interventions in the Dutch obstetrical care system in the period 1993-2002.
Eur.J.Obstet.Gynecol.Reprod.Biol. 2007 May;132(1):70-75.
4. Odlind V, Haglund B, Pakkanen M, Otterblad Olausson P. Deliveries, mothers and
newborn infants in Sweden, 1973-2000. Trends in obstetrics as reported to the
Swedish Medical Birth Register. Acta Obstet.Gynecol.Scand. 2003 Jun;82(6):516-528.
5. Menacker F. Trends in cesarean rates for first births and repeat cesarean rates for
low-risk women: United States, 1990-2003. Natl.Vital Stat.Rep. 2005 Sep 22;54(4):1-8.
6. Gifford DS, Morton SC, Fiske M, Keesey J, Keeler E, Kahn KL. Lack of progress in labor
as a reason for cesarean. Obstet.Gynecol. 2000 Apr;95(4):589-595.
7. Smith GC, Cordeaux Y, White IR, Pasupathy D, Missfelder-Lobos H, Pell JP, et al. The
effect of delaying childbirth on primary cesarean section rates. PLoS Med. 2008 Jul
1;5(7):e144.
8. Bergholt T, Lim LK, Jorgensen JS, Robson MS. Maternal body mass index in the first
trimester and risk of cesarean delivery in nulliparous women in spontaneous labor.
Am.J.Obstet.Gynecol. 2007 Feb;196(2):163.e1-163.e5.
9. Quenby S, Pierce SJ, Brigham S, Wray S. Dysfunctional labor and myometrial lactic
acidosis. Obstet.Gynecol. 2004 Apr;103(4):718-723.
10. Garfield RE, Chwalisz K, Shi L, Olson G, Saade GR. Instrumentation for the diagnosis of
term and preterm labour. J.Perinat.Med. 1998;26(6):413-436.
11. Euliano TY, Nguyen MT, Marossero D, Edwards RK. Monitoring contractions in obese
parturients: electrohysterography compared with traditional monitoring.
Obstet.Gynecol. 2007 May;109(5):1136-1140.
12. Marque CK, Terrien J, Rihana S, Germain G. Preterm labour detection by use of a
biophysical marker: the uterine electrical activity. BMC Pregnancy Childbirth 2007 Jun
1;7 Suppl 1:S5.
13. Jacod BC, Graatsma EM, Van Hagen E, Visser GH. A validation of electrohysterography
for uterine activity monitoring during labour. J.Matern.Fetal.Neonatal Med. 2010
Jan;23(1):17-22.
14. Maner WL, Garfield RE, Maul H, Olson G, Saade G. Predicting term and preterm
delivery with transabdominal uterine electromyography. Obstet.Gynecol. 2003
Jun;101(6):1254-1260.
15. Garfield RE, Maner WL, MacKay LB, Schlembach D, Saade GR. Comparing uterine
electromyography activity of antepartum patients versus term labor patients.
Am.J.Obstet.Gynecol. 2005 Jul;193(1):23-29.
Graatsma_PROEF (all).ps Front - 53 T1 - Black CyanMagentaYellow

106 Monitoring of fetal heart rate and uterine activity
16. Vinken MP, Rabotti C, Mischi M, van Laar JO, Oei SG. Nifedipine-induced changes in
the electrohysterogram of preterm contractions: feasibility in clinical practice.
Obstet.Gynecol.Int. 2010;2010:325635.
17. Bakker JJ, Verhoeven CJ, Janssen PF, van Lith JM, van Oudgaarden ED, Bloemenkamp
KW, et al. Outcomes after internal versus external tocodynamometry for monitoring
labor. N.Engl.J.Med. 2010 Jan 28;362(4):306-313.
18. Brown HC, Paranjothy S, Dowswell T, Thomas J. Package of care for active
management in labour for reducing caesarean section rates in low-risk women.
Cochrane Database Syst.Rev. 2008 Oct 8;(4)(4):CD004907.
19. Zhang J, Bernasko JW, Leybovich E, Fahs M, Hatch MC. Continuous labor support from
labor attendant for primiparous women: a meta-analysis. Obstet.Gynecol. 1996
Oct;88(4 Pt 2):739-744.
Graatsma_PROEF (all).ps Back - 53 T1 - Black CyanMagentaYellow

Chapter 9: Summary & general discussion 107
Chapter 9
Summary & general discussion
Graatsma_PROEF (all).ps Front - 54 T1 - Black CyanMagentaYellow

108 Monitoring of fetal heart rate and uterine activity
Graatsma_PROEF (all).ps Back - 54 T1 - Black CyanMagentaYellow

Chapter 9: Summary & general discussion 109
Summary & general discussion
In this thesis a renewed monitoring technique for fetal heart rate (FHR) and uterine
activity has been investigated. Through non-invasive measurements of electrical signals as
recorded from the maternal abdomen, both the fetal electrocardiogram (fECG) and
uterine electrohysterogram (EHG) can be filtered for calculation of FHR and uterine
contractions, respectively. This monitoring technique has been known for over 100 years,
however due to technical difficulties clinical implementation has not yet been feasible1,2
.
Recently, thanks to technical improvements, both fECG - and EHG monitoring have
experienced a renewed surge of interest. Moreover, the use of fECG - and EHG signals
yield more information compared to FHR and uterine activity as acquired with
conventional monitoring techniques. For example, the high resolution characteristics of
current fECG monitors offers true beat-to-beat FHR, enabling more specific assessment of
the fetal condition in complicated pregnancies3-6
. EHG monitoring holds the promise that
it might discriminate between efficient and inefficient contractions, by using power
density spectral analysis7-9
.
Therefore the aims of part I of this thesis were to validate FHR monitoring using the fetal
ECG signal and to study the fetal condition in pregnancies complicated by intra uterine
growth restriction (IUGR) and (pre)gestational diabetes by using this technique.
The aims of part II of this thesis were to validate monitoring of uterine contractions using
EHG during labour by comparing it to the method of reference, intrauterine pressure
recording (IUP), and to study whether non-invasive monitoring of uterine activity using
EHG may help to differentiate between normal and dysfunctional term labour in
nulliparous women.
PART I
Monitoring of the fetal condition using fetal electrocardiography
In chapter 2 the accuracy and quality of FHR monitoring using the fECG signal were
studied. First the accuracy of transabdominal fECG recordings was confirmed by
comparison to scalp electrode measurements in 22 women during early labour.
Furthermore, the results of antepartum fECG recordings showed optimal recording quality
overnight (23:00-07:00h) during maternal sleep. A slight decrease in recording quality was
found between 26 and 34 weeks of gestation, which is in line with previous studies10-12
.
This transient decrease in recording quality is most probably due to the formation of a
vernix caseosa which interferes with electrical conductivity10
, but does not hamper
adequate recording in over 90 percent of women3.
Since the obesity epidemic challenges traditional antenatal FHR monitoring technologies,
we also studied the association between maternal Body Mass Index (BMI) and fECG
Graatsma_PROEF (all).ps Front - 55 T1 - Black CyanMagentaYellow
110 Monitoring of fetal heart rate and uterine activity
recording quality (Chapter 3). It was remarkable that the quality of fECG-monitoring was
not influenced by maternal obesity. This finding indicates that fECG monitoring can be
regarded as an alternative in cases where Doppler ultrasound FHR monitoring is hampered
by maternal obesity.
After validation of fECG monitoring in terms of accuracy and recording quality, it was the
next step to study the potential benefits of fECG monitoring for assessment of fetal
wellbeing as compared to conventional FHR monitoring with Doppler ultrasound.
In pregnancies complicated by intra uterine growth restriction monitoring of fetal
biometry, FHR, its variability (STV) and Doppler measurements (pulsatility index of the
uterine artery) is recommended for assessment of the fetal condition13
. However, decision
making as to when to deliver the growth restricted fetus based remains difficult. With high
resolution fECG recorders, true beat-to-beat FHR can be recorded for the calculation of
the average acceleration - and deceleration capacity of FHR (AAC and ADC, respectively).
These parameters, reflecting the sympathetic and parasympathetic components of the
nervous system, have proven to provide better prediction of survival in adults suffering
myocardial infarction, however are new in fetal medicine. Previous studies have indicated
that chronic nutritional deprivation may lead to a delay or disturbance in functional
maturation of the sympathetic nervous system13-15
. Therefore we hypothesized that
separate analysis of the sympathetic and parasympathetic components of FHR might lead
to a better recognition of fetal compromise as compared to conventional FHR parameters
(rate and variability).
In chapter 4 mean values of FHR, STV, AAC and ADC from recordings in twenty-five IUGR
pregnancies were plotted in the reference curves as obtained from ninety control
recordings. It was a remarkable finding that 36% (9/25) of AAC and ADC values in IUGR
fetuses were below the 2.5th percentile as compared to only 8% (2/25) when using
conventional measures of FHR variation (STV values; p<0.05). The degree of Doppler
abnormalities did not contribute to the level of deviation of the FHR parameters. These
findings suggest that AAC and ADC may well differentiate better between normal and
IUGR fetuses. Whether this indicates that AAC and ADC represent a more sensitive
parameter of fetal compromise remains to be elucidated in future studies with
longitudinal follow up of IUGR fetuses. This might especially be important near term, since
discrimination between low risk small for gestational age fetuses and truly growth
restricted fetuses is difficult, given the absence of Doppler anomalies at that age16,17
.
Similar to fetuses suffering intrauterine growth restriction, fetuses of mothers with pre-
gestational diabetes are also at high risk for fetal deterioration. Unfortunately, the
etiology for this increased risk is only partly understood. It is most likely associated to
maternal hyperglycaemia, and a (sub)acute development of fetal lactic acidosis ( due to
the combination of high glucose values and a relative hypoxemia)18,19
. Occasionally, some
of these women indeed indicate that fetal movements decrease in case of
Graatsma_PROEF (all).ps Back - 55 T1 - Black CyanMagentaYellow
Chapter 9: Summary & general discussion 111
hyperglycaemia. Therefore, we first studied the occurrence of hyperglycaemia in the three
trimesters of pregnancy (chapter 5). In addition, the relationship between maternal
glucose and fetal heart rate parameters was evaluated by combining continuous
subcutaneous glucose monitoring with continuous fECG monitoring (chapter 6).
We hypothesized that glycaemic control would improve with advancing gestation, since
severe hypoglycaemia has especially been associated with the first trimester of
pregnancy20
. We were surprised to find that overall glycaemic control, and the occurrence
of both hyper and hypoglycaemia remained relatively stable throughout gestation.
However, between individuals large differences were found per trimester of pregnancy,
whereas within individuals large variation existed in the course of pregnancy. This
indicates that glycaemic control in women with pre-gestational diabetes is highly
unpredictable, thereby not only increasing maternal risks associated with poor glycaemic
control, but also increasing fetal risks such as macrosomia, and sudden intrauterine death.
Difficulties are encountered in the recognition of the fetus at increased risk of
deterioration, since routine FHR monitoring can falsely reassure clinicians and since
Doppler blood flow measurement in the umbilical artery have failed to identify these
fetuses21
. We hypothesized that FHR monitoring during prolonged excursions of maternal
glucose levels might offer insight into the fetal compensatory mechanisms, especially in
case of maternal hyperglycaemia. Simultaneous measurements of continuous glucose
monitoring and fECG monitoring were performed in 22 women with (pre)gestational
diabetes in second half of pregnancy. In this study-group neither hyperglycaemia nor
hypoglycaemia had a significant effect on FHR and its short-term variability (STV).
However, fetuses showing a hyperglycaemic period had a somewhat higher basal FHR not
only during hyperglycaemia but also during the hour prior to the onset of hyperglycaemia
when glucose levels were still in the normal range. In other words, most fetuses of
women with diabetes tolerate hyperglycaemia well. Whether simultaneous recording of
FHR and CGM offers additional value in high risk cases (macrosomia and poor glucose
control) needs to be investigated in a larger study population.
In conclusion, our studies using fECG have shown that: True beat-to-beat recordings can
be obtained throughout pregnancy, also in obese women. Long recordings are feasible
during night time when women are asleep. And some promising observations have been
made in IUGR fetuses. This indicates that there will be place for this innovative technique.
This will hold especially for monitoring of the IUGR fetus and fetuses of women with
diabetes, although this has to be substantiated in larger series. Moreover, this technique
may be used in home monitoring of pregnancies at risk and for indications warranting
prolonged recordings, such as in the assessment of the effects of medication given to treat
fetal tachycardia. In this respect it should also be emphasized, that when the electrode
position is adequate, prolonged recordings can be made without adjustment, with is in
Graatsma_PROEF (all).ps Front - 56 T1 - Black CyanMagentaYellow

112 Monitoring of fetal heart rate and uterine activity
contrast to the conventional Doppler recording of FHR. Moreover, fECG monitoring is truly
non-invasive, again in contrast to Doppler recording.
PART II
Monitoring uterine contractions using electrohysterography
The objective of chapter 7 was to validate electrohysterography (EHG) as a method for
uterine activity monitoring during labour by comparing with the reference test, intra
uterine pressure (IUP) recordings. Following thirty-two simultaneous recordings of EHG
and IUP in labour we concluded that EHG detects uterine contractions accurately, but the
contractions characteristics as measured with IUP (amplitude and duration) were not
directly comparable. The latter was possibly due to the different nature of the signals
measured (electrical activity versus pressure).
As outlined in the introduction of this thesis, EHG offers more than recognition of the
presence of uterine contractions. When EHG is analyzed using a power density spectrum,
it can be utilized to study (dys-)functional uterine activity. Given the relatively high
proportion of low risk nulliparous women undergoing a Caesarean section (CS) because of
arrest of labour (despite augmentation and continuous monitoring of uterine activity)22,23
,
additional information regarding the characteristics of uterine activity might well lead to
an earlier recognition and treatment of dysfunctional uterine activity.
In chapter 8 we described the preliminary results of our study using non-invasive
registrations of uterine activity using EHG to differentiate between normal term labour
and arrest of labour. Uterine activity during (induced or spontaneous) labour was
measured using EHG in nulliparous women with singleton pregnancies in cephalic position
at term (≥ 37 weeks). Progress of labour was monitored using standard cervical
examination from admission to delivery. Electrical activity of the myometrium during
contractions was characterized by its power density spectrum (PDS). Peak frequencies (PF)
of the PDS observed in women undergoing CS for failure to progress were compared to
those of women reaching full cervical dilation using a matched case-control analysis. A
total of 95 EHG-recordings were analyzed, of which 50 were performed during
spontaneous and 45 during induced labour. CS was performed in 19 women because of
arrest of labour (10 in spontaneous -, 9 in induced labour). In both groups the peak
frequency increased significantly with increasing cervical dilatation, which is in agreement
with studies on preterm labour7,8
. PDS was higher (borderline significant) in women with
CS for first stage labour arrest compared to women reaching full cervical dilation (OR 1.75;
95%CI [0.97 – 3.16]). This effect was present in case of spontaneous labour but not in
induced labour. In conclusion, labour arrest showed a trend towards an association with
abnormal myometrial depolarisation patterns (i.e. higher peak frequencies) in
spontaneous term labour.
Graatsma_PROEF (all).ps Back - 56 T1 - Black CyanMagentaYellow
Chapter 9: Summary & general discussion 113
In part II of this thesis we presented our first results on a renewed EHG technique for
monitoring of uterine activity. Limitations of conventional techniques have enhanced the
search for a true non-invasive technique, which preferably would also correlate to
relevant clinical outcomes such as progress of labour, or identification of true preterm
labour.
Our validation study on EHG has shown that uterine activity can be monitored accurately
in term labour24
. This is in line with findings from other research groups who reported
similar data while using different devices and signal analysis techniques25-27
. Work still
needs to be undertaken to reach uniformity in the acquisition and processing of the
uterine electrical signal.
The preliminary results from this thesis on differences in peak frequency of efficient and
inefficient contractions during labour (chapter 8) together with the findings of other
groups on propagation patterns seem to indicate that EHG may give access to additional
and clinical relevant information not provided by either tocodynamometry or IUPC28-30
.
Obviously, these results need to be confirmed by large scale studies and coupled to
interventions to evaluate their clinical relevance during labour. Encouraged by those
findings one can, however, already think of other fields of application of EHG. It can
potentially be complementary in the assessment of women with induced labour or
threatened preterm labour. Currently the mode of induction of labour, using local
hormonal therapy (prostaglandins), or oxytocin infusion, is based on digital assessment of
cervical ripening (Bishop score). Unfortunately, the process (and progress) of labour
following cervical ripening with prostaglandins or augmentation with oxytocin is highly
unpredictable. Potentially EHG analysis of the uterus could give additional information on
the stage of uterine ripening, thereby facilitating the choice and/or dosage of treatment.
Furthermore, the role of labour augmentation needs to be studied more in detail since
recent research implies that arrest of labour due to uterine exhaustion might not benefit
from extra uterine stimulation through administration of oxytocin31
.
Preterm labour is another area of great interest. For women with threatened preterm
labour the recognition of ‘true’ preterm labour would dramatically reduce the number of
unnecessary treatments since approximately 70% of women admitted to hospital with
threatened preterm labour eventually deliver at term32
. Several research groups have
already published interesting results on the capacity of EHG to distinguish between
preterm contractions leading to short term delivery or not8,25
. A recent article considering
EHG characteristics of contractions before and after tocolysis in threatened preterm
labour is of great interest in this context30
. It shows that clinically successful tocolysis is
reflected by a decrease of the peak frequency of contractions registered by EHG. This is in
line with other studies showing that the higher the peak frequency, the higher the risk of
an imminent preterm delivery7,8
.
Graatsma_PROEF (all).ps Front - 57 T1 - Black CyanMagentaYellow

114 Monitoring of fetal heart rate and uterine activity
Concluding, EHG while still having to be standardized, is now established as an accurate
technique to measure the incidence of contractions during labour. Moreover, there is
converging evidence towards a possible role in the diagnosis of preterm labour and
encouraging preliminary results from our group and others over a potentially clinically
relevant role in the understanding of dysfunctional labour.
Main conclusions of this thesis
• Fetal ECG recording is a valid and accurate and truly non-invasive method for FHR
monitoring in the (obese) pregnant population during the second half of gestation.
• Reference ranges of FHR and its short term variation as recorded with fECG
monitoring are comparable to those recorded with conventional cardiotocography.
• FHR monitoring using high resolution fECG devices offers true beat-to-beat FHR with
an accuracy of 1 ms, potentially offering more accurate assessment of fetal
cardiovascular (patho-)physiology.
• Differentiation between contributions of the sympathetic and parasympathetic
branches of the nervous system on FHR regulation may offer a more specific
assessment of the condition of the IUGR fetus.
• Continuous and simultaneous recording of maternal glucose and fetal heart rate in
women with type 1 diabetes, enables to study their interaction.
• In women with type 1 diabetes large variations in glucose values are present in all
trimesters of pregnancy.
• In these women the fetus generally tolerates both hypo and hyperglycaemia well, but
is remains uncertain if this will hold for the total population
• With electrohysterography (EHG) uterine contractions can be adequately identified
during labour. Power density spectral analysis of EHG offers additional information on
the efficiency of uterine activity.
• Interpretation of EHG-validation studies is complicated by the lack of uniformity in
EHG signal acquisition and processing.
• Labour arrest may be associated with abnormal myometrial depolarization patterns in
spontaneous term labour.
Graatsma_PROEF (all).ps Back - 57 T1 - Black CyanMagentaYellow

Chapter 9: Summary & general discussion 115
Reference List
1. Steer CM, Hertsch GJ. Electrical activity of the human uterus in labor; the
electrohysterograph. Am.J.Obstet.Gynecol. 1950 Jan;59(1):25-40.
2. Roche JB, HON EH. The fetal electrocardiogram. V. comparison of lead systems.
Obstet.Gynecol. 1965 08/15;92(0002-9378):1149-1159.
3. Graatsma EM, Jacod BC, van Egmond LA, Mulder EJ, Visser GHA. Fetal
electrocardiography: feasibility of long-term fetal heart rate recordings. BJOG 2009
Jan;116(2):334-7; discussion 337-8.
4. Taylor MJ, Thomas MJ, Smith MJ, Oseku-Afful S, Fisk NM, Green AR, et al. Non-
invasive intrapartum fetal ECG: preliminary report. BJOG 2005 08;112(1470-0328;
8):1016-1021.
5. Cleal JK, Thomas M, Hanson MA, Paterson-Brown S, Gardiner HM, Green LR.
Noninvasive fetal electrocardiography following intermittent umbilical cord occlusion
in the preterm ovine fetus. BJOG 2010 Mar;117(4):438-444.
6. van Laar JO, Peters CH, Vullings R, Houterman S, Bergmans JW, Oei SG. Fetal
autonomic response to severe acidaemia during labour. BJOG 2010 Mar;117(4):429-
437.
7. Garfield RE, Maner WL, MacKay LB, Schlembach D, Saade GR. Comparing uterine
electromyography activity of antepartum patients versus term labor patients.
Am.J.Obstet.Gynecol. 2005 Jul;193(1):23-29.
8. Maner WL, Garfield RE, Maul H, Olson G, Saade G. Predicting term and preterm
delivery with transabdominal uterine electromyography. Obstet.Gynecol. 2003
Jun;101(6):1254-1260.
9. Marque CK, Terrien J, Rihana S, Germain G. Preterm labour detection by use of a
biophysical marker: the uterine electrical activity. BMC Pregnancy Childbirth 2007 Jun
1;7 Suppl 1:S5.
10. Oldenburg JT, Macklin M. Changes in the conduction of the fetal electrocardiogram to
the maternal abdominal surface during gestation. Obstet.Gynecol. 1977
10/15;129(0002-9378; 4):425-433.
11. Crowe JA, Woolfson MS, Hayes-Gill BR, Peasgood W, Mohd-Ali MA, Huang Y, et al.
Antenatal assessment using the FECG obtained via abdominal electrodes.
J.Perinat.Med. 1996;24(0300-5577; 1):43-53.
12. Pieri JF, Crowe JA, Hayes-Gill BR, Spencer CJ, Bhogal K, James DK. Compact long-term
recorder for the transabdominal foetal and maternal electrocardiogram.
Med.Biol.Eng.Comput. 2001 01;39(0140-0118; 1):118-125.
13. Visser G.H.A. Monitoring the growth-restricted fetus during the preterm period. In:
Petraglia F., Gabbe S.G., Weiss G., Strauss J.F., editors. Preterm Birth: Mechanisms,
Mediators, Prediction, Prevention and Interventions. first ed.: Informa Healthcare;
2007. p. 192.
Graatsma_PROEF (all).ps Front - 58 T1 - Black CyanMagentaYellow

116 Monitoring of fetal heart rate and uterine activity
14. Gagnon R, Hunse C, Bocking AD. Fetal heart rate patterns in the small-for-gestational-
age human fetus. Am.J.Obstet.Gynecol. 1989 Sep;161(3):779-784.
15. Baschat AA. Fetal responses to placental insufficiency: an update. BJOG 2004
Oct;111(10):1031-1041.
16. Baschat AA. Fetal growth restriction - from observation to intervention.
J.Perinat.Med. 2010 May;38(3):239-246.
17. Hecher K, Bilardo CM, Stigter RH, Ville Y, Hackeloer BJ, Kok HJ, et al. Monitoring of
fetuses with intrauterine growth restriction: a longitudinal study. Ultrasound
Obstet.Gynecol. 2001 12;18(0960-7692; 6):564-570.
18. Salvesen DR, Freeman J, Brudenell JM, Nicolaides KH. Prediction of fetal acidaemia in
pregnancies complicated by maternal diabetes mellitus by biophysical profile scoring
and fetal heart rate monitoring. Br.J.Obstet.Gynaecol. 1993 Mar;100(3):227-233.
19. Lauenborg J, Mathiesen E, Ovesen P, Westergaard JG, Ekbom P, Molsted-Pedersen L,
et al. Audit on stillbirths in women with pregestational type 1 diabetes. Diabetes Care
2003 May;26(5):1385-1389.
20. Kerssen A, de Valk HW, Visser GHA. Day-to-day glucose variability during pregnancy in
women with Type 1 diabetes mellitus: glucose profiles measured with the Continuous
Glucose Monitoring System. BJOG 2004 09;111(1470-0328; 9):919-924.
21. Salvesen DR, Higueras MT, Mansur CA, Freeman J, Brudenell JM, Nicolaides KH.
Placental and fetal Doppler velocimetry in pregnancies complicated by maternal
diabetes mellitus. Am.J.Obstet.Gynecol. 1993 Feb;168(2):645-652.
22. Gifford DS, Morton SC, Fiske M, Keesey J, Keeler E, Kahn KL. Lack of progress in labor
as a reason for cesarean. Obstet.Gynecol. 2000 Apr;95(4):589-595.
23. Menacker F. Trends in cesarean rates for first births and repeat cesarean rates for
low-risk women: United States, 1990-2003. Natl.Vital Stat.Rep. 2005 Sep 22;54(4):1-8.
24. Jacod BC, Graatsma EM, Van Hagen E, Visser GHA. A validation of
electrohysterography for uterine activity monitoring during labour.
J.Matern.Fetal.Neonatal Med. 2010 Jan;23(1):17-22.
25. Maul H, Maner WL, Olson G, Saade GR, Garfield RE. Non-invasive transabdominal
uterine electromyography correlates with the strength of intrauterine pressure and is
predictive of labor and delivery. J.Matern.Fetal.Neonatal Med. 2004 May;15(5):297-
301.
26. Euliano T, Skowronski M, Marossero D, Shuster J, Edwards R. Prediction of
intrauterine pressure waveform from transabdominal electrohysterography.
J.Matern.Fetal.Neonatal Med. 2006 Dec;19(12):811-816.
27. Rabotti C, Mischi M, van Laar JO, Oei GS, Bergmans JW. Estimation of internal uterine
pressure by joint amplitude and frequency analysis of electrohysterographic signals.
Physiol.Meas. 2008 Jul;29(7):829-841.
Graatsma_PROEF (all).ps Back - 58 T1 - Black CyanMagentaYellow

Chapter 9: Summary & general discussion 117
28. Euliano TY, Marossero D, Nguyen MT, Euliano NR, Principe J, Edwards RK.
Spatiotemporal electrohysterography patterns in normal and arrested labor.
Am.J.Obstet.Gynecol. 2009 Jan;200(1):54.e1-54.e7.
29. Rabotti C, Mischi M, Oei G, Bergmans J. Noninvasive estimation of the
electrohysterographic action-potential conduction velocity. IEEE Trans.Biomed.Eng.
2010 May 10.
30. Vinken MP, Rabotti C, Mischi M, van Laar JO, Oei SG. Nifedipine-induced changes in
the electrohysterogram of preterm contractions: feasibility in clinical practice.
Obstet.Gynecol.Int. 2010;2010:325635.
31. Quenby S, Pierce SJ, Brigham S, Wray S. Dysfunctional labor and myometrial lactic
acidosis. Obstet.Gynecol. 2004 Apr;103(4):718-723.
32. Tsoi E, Akmal S, Geerts L, Jeffery B, Nicolaides KH. Sonographic measurement of
cervical length and fetal fibronectin testing in threatened preterm labor. Ultrasound
Obstet.Gynecol. 2006 Apr;27(4):368-372.
Graatsma_PROEF (all).ps Front - 59 T1 - Black CyanMagentaYellow

118 Monitoring of fetal heart rate and uterine activity
Graatsma_PROEF (all).ps Back - 59 T1 - Black CyanMagentaYellow

Addendum: Nederlandse samenvatting 119
Addendum
Nederlandse samenvatting
Graatsma_PROEF (all).ps Front - 60 T1 - Black CyanMagentaYellow

120 Monitoring of fetal heart rate and uterine activity
Graatsma_PROEF (all).ps Back - 60 T1 - Black CyanMagentaYellow

Addendum: Nederlandse samenvatting 121
Nederlandse samenvatting
In dit proefschrift worden nieuwe methoden beschreven voor het meten van de
hartfrequentie van het ongeboren kind (de foetus) tijdens de zwangerschap (Deel I) en
voor het meten van baarmoedercontracties (weeën) tijdens de bevalling (Deel II).
Deel I
Foetale bewaking met het foetale elektrocardiogram
Voor een goede afloop van de zwangerschap en bevalling is het van belang om inzicht te
verkrijgen in de conditie van de foetus. Wanneer er sprake is van moederlijke ziekte
(bijvoorbeeld bij diabetes mellitus, hypertensie, medicatie gebruik, etc.) of achterblijven
van de groei van de foetus, dan is frequente bepaling van de foetale conditie noodzakelijk.
In het tweede deel van de zwangerschap kan de conditie van de foetus worden
beoordeeld met ultrageluidsmetingen van foetale hartfrequentie (cardiotocografie; CTG).
Deze methode heeft echter een aantal nadelen; een hoog signaalverlies bij bewegingen
van de foetus buiten het gebied van de ultrageluidstransducer, slechte signaalkwaliteit bij
vrouwen met veel abdominaal vetweefsel en het ‘invasieve’ karakter van
ultrageluidsbelasting bij langdurige en frequente hartfrequentie metingen1. Daarnaast
ervaren de zwangeren een meting vaak als niet prettig vanwege een beperkte
bewegingsvrijheid en omdat de elastische banden die de transducer op zijn plaats houden
vaak strak zijn aangetrokken1.
Een alternatieve methode is het meten van de foetale hartfrequentie met het foetale
elektrocardiogram (fECG). Het ECG is voornamelijk bekend vanuit de volwassen
geneeskunde. In de verloskunde wordt het fECG momenteel alleen gebruikt voor
hartfrequentiemetingen tijdens de bevalling. Na het breken van de vliezen kan via een
schedelelektrode het fECG signaal worden opvangen. Gedurende de zwangerschap kan
het foetale ECG ook worden geregistreerd op de moederlijke buikwand, hoewel tot nu toe
alleen in wetenschappelijke setting. Het foetaal ECG wordt opgevangen via (non-
invasieve) plakelektrodes op de zwangere buik (transabdominaal), om zo met het fECG
signaal een foetale hartfrequentie te berekenen (figuur 1). Voorheen werd deze
transabdominale registratie van het fECG bemoeilijkt door ‘elektrische ruis’ van onder
andere het moederlijke ECG, moederlijke en foetale beweging of spieractiviteit. Na
verbetering van de ‘filter-techniek’ van het foetale ECG lijkt dit probleem grotendeels
opgelost te zijn1,2
.
De beperkingen van hartfrequentiemetingen met ultrageluid, zoals hierboven vermeld
vormen geen probleem bij de fECG techniek; het fECG signaal kan ongeacht de foetale
ligging worden opgevangen, het non-invasieve karakter (er wordt geen signaal de buik
ingestuurd, slechts opgevangen) maakt langdurig meten ongevaarlijk. Tenslotte biedt deze
Graatsma_PROEF (all).ps Front - 61 T1 - Black CyanMagentaYellow

122 Monitoring of fetal heart rate and uterine activity
methode behoud van mobiliteit, wat door zwangere vrouwen als comfortabel wordt
beschouwd. Daarnaast bieden foetale hartfrequentiemetingen met fECG als voordeel dat
de precieze slag-tot-slag (‘beat-to-beat’) variabiliteit van de foetale hartfrequentie kan
worden berekend. Men veronderstelt dat het berekenen van ‘beat-to-beat’ variabiliteit
meer informatie oplevert over de conditie van de foetus dan foetale hartfrequentie
alleen3-6
.
Figuur 1: AN24 - foetale ECG (en weeën) monitor (Monica Healthcare Ltd., Nottingham, UK).
Validatie van de foetale ECG techniek
Voordat een (nieuwe) medische techniek in de patiëntenzorg gebruikt kan worden moet
deze gevalideerd worden ten opzichte van bestaande technieken. Daarom wordt in
hoofdstuk 2 de kwaliteit van langdurige fECG hartfrequentie metingen in het tweede deel
van de zwangerschap beschreven. Tevens wordt de nauwkeurigheid van de
transabdominale fECG methode gevalideerd ten opzichte van de gouden standaard die
bestaat uit foetale ECG metingen tijdens de bevalling, zoals gemeten met een
schedelelektrode. In totaal is bij 150 zwangeren (zwangerschapsduur tussen 20 en 41
weken) gedurende gemiddeld 15 uur een eenmalige fECG meting verricht. Daarnaast is bij
22 vrouwen tijdens de bevalling een gelijktijdige meting gedaan van abdominaal fECG met
plakelektroden en fECG zoals gemeten met de schedelelektrode. Uit de resultaten van het
onderzoek blijkt dat fECG metingen kwalitatief goed zijn, met name gedurende de nacht
wanneer de zwangere slaapt en het foetale ECG signaal niet wordt verstoord door
elektrische (spier)activiteit. Eerder onderzoek suggereerde dat het ontstaan van de vernix
(de ‘smeerlaag’ rondom de foetus) tussen 28 en 34 weken zwangerschap de fECG
signaalgeleiding bemoeilijkt en daardoor een verminderde fECG kwaliteit oplevert in deze
zwangerschapsperiode1,2,7
. Gezien de geringe (maar significante daling) in fECG
signaalkwaliteit in onze studie kunnen wij deze bevinding bevestigen. Verder wordt in
Graatsma_PROEF (all).ps Back - 61 T1 - Black CyanMagentaYellow

Addendum: Nederlandse samenvatting 123
hoofdstuk 3 beschreven dat de kwaliteit van fECG hartfrequentiemetingen (in
tegenstelling tot het CTG) niet wordt beïnvloed door de body mass index (BMI) van de
moeder. Bovenstaande bevindingen bevestigen dat de fECG techniek een nauwkeurige en
kwalitatief goede methode is voor het meten van de foetale hartfrequentie bij zwangere
vrouwen in het tweede deel van de zwangerschap.
Toepassingen van de foetale ECG techniek
Een aantal parameters van de foetale hartfrequentie zijn van belang wanneer
hartfrequentiemetingen worden verricht bij gecompliceerde zwangerschappen; de basis
hartfrequentie, de mate van hartfrequentie variabiliteit (korte termijn variabiliteit) en de
aan- of afwezigheid van acceleraties en deceleraties (d.w.z. kortdurende toename- en
afname van de hartfrequentie). Bij zwangerschappen gecompliceerd door intra uteriene
groeirestrictie (IUGR) wordt voornamelijk gekeken naar de mate van korte termijn
variabiliteit en de aanwezigheid van deceleraties: verminderde variabiliteit en de
aanwezigheid van deceleraties voorspellen een verminderde conditie van de foetus. Naast
beoordeling van de verschillende hartfrequentie parameters is bij IUGR foetussen ook de
doorstroming van de foetale bloedvaten van belang, zoals gemeten met Doppler-
ultrageluid.
Hoewel op basis van korte termijn variabiliteit in combinatie met Doppler-metingen geen
eenduidig (klinisch) beleid kan worden afgestemd, zijn dit momenteel de enige
beschikbare foetale parameters. Afhankelijk van de resultaten moet een keuze worden
gemaakt voor het voortzetten van de zwangerschap, met het risico van plotselinge
verslechtering van de foetale conditie, of voor het nastreven van de bevalling, waarbij de
risico’s van een vroeggeboorte aanwezig zijn. In hoofdstuk 4 wordt een nieuwe parameter
van de foetale hartfrequentie beschreven die mogelijk bijdraagt aan hetvroegtijdig
herkennen van een verminderde of een verslechterende conditie van de IUGR foetus.
Recent onderzoek heeft een nieuwe foetale hartfrequentie parameter opgeleverd die
mogelijk een betere voorspeller is voor de conditie van de IUGR foetus vergeleken met de
korte termijn variabiliteit4,5
. Deze nieuwe parameter maakt onderscheid tussen de
sympathische - en parasympathische invloed op de foetale hartfrequentie. Aangezien de
nieuwe sympathische - (AAC; average acceleration capacity) en parasympathische (ADC;
average deceleration capacity) parameters nog niet eerder zijn beschreven in gezonde
zwangerschappen zijn in hoofdstuk 4 allereerst de AAC en ADC waarden bestudeerd bij
ongecompliceerde zwangerenschappen in het verloop van de tweede helft van de
zwangerschap. Ter vergelijking worden ook de basis hartfrequentie en korte termijn
variabiliteit zoals gemeten met de fECG techniek vanaf 20 weken zwangerschapsduur
vermeld. Vervolgens is een voorlopige analyse verricht van 25 zwangerschappen
gecompliceerd door IUGR waarbij de waarden van de basis hartfrequentie, korte termijn
variatie, AAC en ADC zijn vergeleken met de normaalwaarden zoals verkregen vanuit
negentig ongecompliceerde zwangerschappen. In dit hoofdstuk wordt aangetoond dat
Graatsma_PROEF (all).ps Front - 62 T1 - Black CyanMagentaYellow

124 Monitoring of fetal heart rate and uterine activity
een significant groter percentage van de AAC en ADC waarden van zwangerschappen
gecompliceerd door foetale IUGR (36%; 9/25) onder de 2.5de percentiel van de
normaalwaarden wordt gemeten in vergelijking met de korte termijn variabiliteit (8%;
2/25). Daarnaast valt op dat abnormale waarden van foetale bloedvatdoorstroming
(Doppler) niet geassocieerd zijn met afwijkende AAC en ADC waarden.
Deze bevindingen suggereren dat AAC en ADC beter onderscheid kunnen maken tussen
normale en IUGR foetussen. Of AAC en ADC ook een betere voorspellende waarde hebben
voor het herkennen van het verslechteren van de foetale conditie van IUGR foetussen
moet worden bestudeerd in toekomstig onderzoek met longitudinale follow up van de
IUGR foetussen. Een dergelijk onderzoek is voornamelijk van belang bij groeirestrictie
rondom de a terme datum, aangezien Doppler ultrageluid metingen van de foetale
bloedvaten rondom de a terme datum niet tot nauwelijks voorspellend zijn voor het
herkennen van een verslechtering van de foetale conditie8.
Net als bij zwangerschappen gecompliceerd door IUGR, hebben foetussen van moeders
met diabetes mellitus eveneens een verhoogde kans op een verslechterde foetale
conditie26
. Helaas wordt de achtergrond van dit verhoogde risico maar deels begrepen.
Hoogstwaarschijnlijk is er een associatie met hoge bloedsuiker waarden van de zwangere
(maternale hyperglycaemie) en een (sub)acute ontwikkeling van foetale verzuring (lactaat
acidose), door een combinatie van hoge bloedglucosewaarden en relatief zuurstofgebrek
(hypoxie)9,10
. Tijdens poliklinische bezoeken van zwangeren met diabetes valt op dat
sommige vrouwen verminderde foetale bewegingen opmerken ten tijde van verhoogde
bloedglucose waarden. Deze bevinding gaf aanleiding om allereerst inzicht te krijgen in
het voorkomen van hyperglycaemieën in de drie trimesters van de zwangerschap bij
vrouwen met type 1 diabetes mellitus (hoofdstuk 5). Vervolgens wordt in hoofdstuk 6
beschreven of de foetus reageert op schommelingen van moederlijke bloedsuiker-
waarden.
In hoofdstuk 5 wordt onderzoek beschreven waarbij bij 26 vrouwen met type 1 diabetes in
elk trimester van de zwangerschap gedurende 48 uur een continue subcutane glucose
meting is verricht. Voor aanvang van het onderzoek werd de hypothese geformuleerd dat
met het vorderen van de zwangerschap een betere glucose regulatie zou optreden (met
minder hyperglycaemieën). Deze hypothese was gebaseerd op het feit dat
hypoglycaemieën (lage bloedsuikers), en daarbij frequent optredende reactieve
hyperglycaemieën, voornamelijk beschreven zijn in het eerste trimester van de
zwangerschap11
. Als uitkomstmaten van het onderzoek worden het voorkomen van hyper-
en hypoglycaemieën, de gemiddelde glucose waarde, de standaard deviatie en de
variabiliteit in glucosewaarden van de een op de andere dag (glucose dag-na-dag
variabiliteit) beschreven.
Uit de resultaten van hoofdstuk 5 blijkt dat de mate van glucose regulatie en het
voorkomen van hypo- en hyperglycaemieën relatief onveranderd blijven gedurende de
Graatsma_PROEF (all).ps Back - 62 T1 - Black CyanMagentaYellow
Addendum: Nederlandse samenvatting 125
zwangerschap. Echter, op individueel niveau zijn de verschillen voor de verschillende
maten van glucose regulatie erg groot en is het individuele verloop van glucose regulatie
volstrekt onvoorspelbaar. Hierdoor bestaat niet alleen een hoog risico voor de (slecht
gereguleerde) zwangere met diabetes, maar ook voor de foetus. De belangrijkste risico’s
voor de foetus zijn overgewicht (geboortegewicht ≥ 90ste percentiel) en plotseling intra-
uterien overlijden.
Bij zwangerschappen gecompliceerd door maternale diabetes mellitus kan het van
betekenis zijn om te weten hoe de foetus reageert op schommelingen van de moederlijke
glucose waarden. Immers, de aanwezigheid van hyperglycaemie bij een bovengemiddeld
gegroeide foetus in combinatie met een onrijp placentabed kan lactaat vorming (dan wel
lactaat stapeling) veroorzaken, met uiteindelijk intra-uterien overlijden als gevolg9,10
.
Helaas is in deze context het routinematig verrichten van foetale hartfrequentie metingen
weinig zinvol omdat de meeste vrouwen ten tijde van het polikliniek bezoek een normale
glucose waarde zullen hebben. Daarnaast is het induceren van hyperglycaemie ethisch
onverantwoord. Een alternatief voor het meten van de foetale reactie op hoge en lage
bloedglucose waarden is het observeren van de spontaan optredende schommelingen in
bloedglucose waarden. Dit is mogelijk door simultane metingen van de foetale
hartfrequentie (zoals gemeten met de fECG monitor) en maternale glucose waarden (zoals
gemeten met continue subcutane glucose metingen) te verrichten. In hoofdstuk 6 wordt
het onderzoek beschreven waarbij 28 simultane hartfrequentie en glucose metingen zijn
verricht bij vrouwen met (zwangerschaps-) diabetes. De resultaten tonen geen significant
effect van hypo- of hyperglycaemie op de foetale hartfrequentie en korte termijn
variabiliteit van de hartfrequentie. Echter, voorafgaand aan en ten tijde van
hyperglycaemie is de foetale hartfrequentie licht verhoogd. Uit de resultaten van deze
studie kan worden geconcludeerd dat het voorkomen van hoge bloedglucose waarden
door de meeste foetussen redelijk tot goed wordt verdragen. Dit geldt ook voor lage
bloedglucose waarden. Vervolgonderzoek moet aantonen of het simultaan verrichten van
foetale hartfrequentie metingen en continue glucose metingen een bijdrage levert in de
zorg voor zwangeren met diabetes mellitus met een hoog risico op complicaties.
Samenvattend, wordt in deel I van dit proefschrift beschreven dat (beat-to-beat) fECG
metingen gedurende de tweede helft van de zwangerschap kunnen worden verricht, ook
bij zwangeren met obesitas (BMI ≥ 30 kg/m2). Langdurige metingen zijn voornamelijk
zinvol gedurende de nacht wanneer de zwangere slaapt. Deze metingen zijn veilig voor de
foetus dankzij het niet-invasieve karakter van de techniek. Herpositioneren van de
plakelektroden is niet nodig (de laatste twee aspecten zijn in tegenstelling tot ultrageluid
CTG). Het feit dat langdurig meten mogelijk is maakt dat deze techniek ook geschikt voor
het bestuderen van effecten van medicatie op de foetus, zoals bij de behandeling van
foetale tachycardie. Ten slotte zijn de resultaten zoals beschreven bij zwangerschappen
Graatsma_PROEF (all).ps Front - 63 T1 - Black CyanMagentaYellow
126 Monitoring of fetal heart rate and uterine activity
gecompliceerd door IUGR veelbelovend en bevestigen dat verder onderzoek met deze
techniek goed mogelijk is.
Deel II
Weeënregistratie met behulp van elektrohysterografie
Men spreekt van ‘de bevalling’ wanneer regelmatige, pijnlijke weeën leiden tot
veranderingen van de baarmoedermond (verstrijken en ontsluiting). Om inzicht te krijgen
in het karakter van weeën worden de frequentie en duur van weeën gemeten. Hoewel
weeënregistratie op verschillende manieren kan worden verricht, zijn de meest
gebruikelijke methoden gebaseerd op het meten van drukverschillen. Dit kan zowel
uitwendig door middel van tocodynamometrie als ook inwendig met behulp van een (met
vocht gevulde) intra-uteriene druk katheter. Uitwendige tocodynamometrie is veilig
gezien het non-invasieve aspect en is gemakkelijk in het gebruik. Echter, de kwaliteit van
weeënregistratie is met deze methode niet alleen afhankelijk van de juiste plaatsing van
de sensor op de zwangere buik, maar wordt tevens negatief beïnvloed door (moederlijke
en foetale) bewegingen en een hoge BMI12
. Weeënregistratie met intra-uteriene druk
katheters (ook wel druklijnen genoemd) wordt sinds kort ontraden. Deze veranderde
instelling ten aanzien van het gebruik is niet alleen tot stand gekomen door de zeldzame
associatie met baarmoederperforatie of placenta losraking, maar ook omdat recent
onderzoek heeft aangetoond dat zowel het gebruik van druklijnen als ook het gebruik van
uitwendige tocodynamometrie in het algemeen geen gezondheidswinst opleveren13
. Deze
bevinding is niet geheel onverwacht aangezien beide methoden slechts de frequentie en
duur van weeën kunnen meten, en geen inzicht geven in de efficiëntie van weeën. Een
nieuwe methode van weeënregistratie kan wellicht meer inzicht geven in de efficiëntie
van weeën. Deze methode heet elektrohysterografie (hyster = baarmoeder) en is
gebaseerd op het meten van de elektrische activiteit van de baarmoeder tijdens een wee.
De elektrische activiteit wordt opgevangen door middel van plakelektrodes, die (net als bij
het foetale ECG) worden geplakt op de buik van de zwangere (zie Figuur 1).
Elektrohysterografie (EHG) is al 50 jaar bekend, maar is pas sinds kort in de belangstelling
komen te staan, mede door technische verbeteringen. Daarnaast geeft EHG de
mogelijkheid om de opbouw van weeën vanuit de contracties van baarmoedercellen
(myometrium cellen) in detail te bestuderen. Dit is mogelijk door het analyseren van de
elektrische activiteit die tijdens een wee gegenereerd wordt door de verschillende
myometrium cellen. Hoewel meerdere technieken beschikbaar zijn voor het analyseren
van elektrische (myometrium) activiteit, is tot nu toe de meeste ervaring opgedaan met
het ‘power density spectrum’ (PDS)14-19
. Deze techniek maakt het mogelijk om tussen de
ogenschijnlijke chaos van depolarisaties van de verschillende myometrium cellen de
frequentie te identificeren waarmee de meeste cellen contraheren. Deze frequentie wordt
de peak frequency genoemd. Met behulp van het power density spectrum hebben
Graatsma_PROEF (all).ps Back - 63 T1 - Black CyanMagentaYellow

Addendum: Nederlandse samenvatting 127
verschillende onderzoeksgroepen al aannemelijk gemaakt dat er wél onderscheid kan
worden gemaakt tussen efficiënte en inefficiënte weeën)20-22
.
Validatie van EHG weeënregistratie
Zoals eerder in deze samenvatting beschreven voor de ECG-techniek, geldt ook voor
weeënregistratie met behulp van EHG, dat alvorens gebruik in wetenschappelijke of
klinische setting gerechtvaardigd is, deze methode gevalideerd moet worden ten opzichte
van de gouden standaard. In hoofdstuk 7 wordt de validatie van de EHG techniek ten
opzichte van de intra-uteriene druklijn beschreven. Hierbij moet vermeld worden dat het
gebruik van intra-uteriene druklijnen ten tijde van de uitvoering van dit onderzoek nog als
gangbaar werd beschouwd. In het onderzoek beschreven in hoofdstuk 7 werden bij 32
vrouwen tijdens de bevalling gelijktijdige weeënregistraties verricht met zowel de intra-
uteriene druklijn als met de EHG methode. De technieken werden vergeleken op basis van
de frequentie, de duur en de amplitude van de weeën. Uit het onderzoek blijkt dat de EHG
methode het aantal weeën (de frequentie) adequaat kan meten, maar dat de duur en
amplitude van de weeën niet goed overeen komt met de duur en amplitude zoals
gemeten met de druklijn. Deze laatste bevinding is niet geheel onverwacht gezien de
verschillende aard van de registratiemethodes (druk versus elektrische activiteit).
Toepassingen van EHG weeënregistratie
Zoals eerder vermeld kan de EHG methode, na analyse van het power density spectrum,
méér dan alleen de frequentie van weeën meten. Weeënregistratie met behulp van EHG
wordt verondersteld onderscheid te kunnen maken tussen efficiënte weeën (leidend tot
ontsluiting) en inefficiënte weeën (niet vorderende ontsluiting)14
. Bij a terme
zwangerschappen kan het tijdig herkennen van inefficiënte weeën gezondheidswinst
opleveren gezien het relatief hoge aantal laag-risico nulliparae (vrouwen die voor het
eerst gaan bevallen) die een keizersnede krijgen in verband met de diagnose ‘niet
vorderende ontsluiting’. Als inefficiënte weeën in een eerder stadium worden herkend,
dan kan de weeënactiviteit bijvoorbeeld tijdig worden gestimuleerd met
weeënopwekkende medicatie (oxytocine).
In hoofdstuk 8 worden de voorlopige resultaten beschreven van een lopend onderzoek
naar EHG registraties tijdens de (a terme) bevalling om onderscheid te maken tussen
efficiënte en inefficiënte weeënactiviteit. Bij niet vorderen van de ontsluiting (NVO) en
een daarop volgende keizersnede , werd aangenomen dat inefficiënte weeën daar
(grotendeels) aan ten grondslag lagen . In deze studie onderzoeken wij of de
karakteristieken van weeën bij vrouwen die een keizersnede krijgen in verband met NVO
verschillen van die bij vrouwen met een normaal ontsluitingspatroon.
Zwangeren met een eenling in hoofdligging en een zwangerschapsduur van meer dan 37
weken werden gevraagd deel te nemen aan het onderzoek. Onderscheid wordt gemaakt
tussen zwangeren met een spontaan begin van de bevalling en vrouwen waarbij de
Graatsma_PROEF (all).ps Front - 64 T1 - Black CyanMagentaYellow

128 Monitoring of fetal heart rate and uterine activity
bevalling wordt ingeleid. Bij deelname worden de weeën tot aan de geboorte van het kind
met de EHG methode geregistreerd en de voortgang van de ontsluiting bepaald met
behulp van vaginale touchers (standaard elke 2 uur of wanneer anderzijds geïndiceerd).
De EHG karakteristieken (peak frequentie; PF) van weeën van zwangeren die een
keizersnede kregen in verband met NVO zijn vergeleken met die van vrouwen die een
spontane bevalling ondergingen (matched case-control analyse). In totaal kregen 9/45
zwangere vrouwen een keizersnede in verband met NVO nadat de bevalling was ingeleid
en 10/50 zwangere vrouwen kregen een keizersnede na een spontaan begin van de
bevalling. De voorlopige resultaten van dit lopende onderzoek tonen allereerst dat de
peak frequentie van weeën stijgt met vorderende baring. Daarnaast is de peak frequentie
hoger bij zwangeren die een keizersnede krijgen in verband met NVO, vergeleken met
zwangeren die volledige ontsluiting bereiken. Dit effect werd alleen gezien bij vrouwen
met een spontaan begin van de bevalling, en niet wanneer de bevalling wordt ingeleid.
Deze voorlopige resultaten suggereren dat een niet vorderende baring geassocieerd is
met abnormale elektrische (myometrium) activiteit van de baarmoeder.
In deel II van dit proefschrift is een nieuwe methode voor het registreren van
weeënactiviteit beschreven. Niet alleen de beperkte waarde van huidige beschikbare
methoden, maar ook het feit dat weeënregistratie met EHG mogelijk inzicht kan geven in
relevante klinische uitkomsten, zoals het vorderen van de baring, of het herkennen van
voortijdige weeënactiviteit, heeft aangezet tot de ontwikkeling dan wel verbetering van
EHG registraties.
De validatie studie in hoofdstuk 7 heeft aangetoond dat (a terme) weeënregistratie met
EHG nauwkeurig is. Ondanks het gebruik van verschillende apparatuur en analyse
technieken komen de resultaten zoals beschreven in hoofdstuk 7 overeen met
bevindingen van andere onderzoeken 15,17,23,24
. Het verdient aanbeveling om in de
toekomst te werken naar en meer eenduidige wijze van analyseren van de EHG data om
zo studieresultaten beter te kunnen vergelijken of interpreteren.
De voorlopige resultaten van hoofdstuk 8 ten aanzien van verschillen in peak frequentie
bij efficiënte en inefficiënte weeën, vormen samen met bevindingen van eerder
onderzoek naar het verloop van de richting van weeën een indicatie dat EHG méér
potentie heeft voor het herkennen van pathologie in het verloop van de ontsluiting dan de
huidige weeënregistratie methoden (IUD en externe tocodynamometrie)20-22,24
. Naast het
afronden van de lopende studie (hoofdstuk 8) zullen bij toekomstig onderzoek de EHG
resultaten moeten worden gekoppeld aan interventies (bijstimuleren van de bevalling,
keizersnede) om de klinische relevantie van deze techniek te kunnen evalueren. Naast het
huidige beschreven onderzoek zijn er nog meer indicaties waarbij het belang van EHG
registraties kan worden onderzocht, zoals bij het beoordelen van de wijze van inleiden van
de bevalling en ook bij zwangeren met een dreigende vroeggeboorte.
Graatsma_PROEF (all).ps Back - 64 T1 - Black CyanMagentaYellow
Addendum: Nederlandse samenvatting 129
Momenteel wordt de wijze van inleiden van de bevalling bepaald aan de hand van de
Bishop score, waarbij de mate van rijping van de baarmoedermond doorslaggevend is
voor enerzijds het toedienen van locale hormonale behandeling (primen met
prostagladines) of anderzijds intraveneuze toediening van weeën stimulerende middelen
(oxytocine). Helaas is het verloop van de bevalling, hetzij na priming van de
baarmoedermond, hetzij bij intraveneuze behandeling, erg onvoorspelbaar. Wellicht dat
hier een rol is weggelegd voor EHG weeënregistratie. Mogelijk kan met behulp van EHG
metingen inzicht worden verkregen in de mate van rijping van de baarmoeder (in
tegenstelling tot rijping van de baarmoedermond), zodat hiermee de dosering en timing
van behandeling beter kunnen worden afgesteld. Daarnaast kan bijstimulatie van de
baring met intraveneuze toediening van oxytocine meer in detail worden bestudeerd met
EHG metingen. Dit is met name interessant gezien de resultaten van recent onderzoek
waarbij is aangetoond dat bijstimulatie bij zwangeren met NVO niet effectief lijkt omdat
de baarmoeder mogelijk al dusdanig is uitgeput dat bijstimulatie geen effect meer kan
bewerkstelligen25
.
Eerdere onderzoeken hebben aangetoond dat slechts 30% van de zwangeren bij wie
dreigende vroeggeboorte wordt gediagnosticeerd daadwerkelijk voortijdig gaan bevallen.
Hieruit kan worden geconcludeerd dat met de huidige technieken ‘echte’ vroeggeboorte
moeilijk te herkennen is. Verschillende onderzoeken hebben gesuggereerd dat met EHG
dreigende vroeggeboorte mogelijk beter herkend kan worden16,21
. Daarnaast is recent een
artikel verschenen dat het karakter van premature weeën voor en na toediening van
weeënremmende medicatie (tocolyse) heeft bestudeerd. Hierbij is klinisch effectieve
weeenremming geassocieerd met een afname van de peak frequentie van weeën20
. Deze
bevinding komt overeen met eerdere bevindingen dat er bij een hogere peak frequentie
een hoger risico bestaat op vroeggeboorte14,16
.
Samenvattend is EHG een gevalideerde methode voor weeënregistratie, hoewel
eenduidige analyse van de signalen moet worden gerealiseerd. In toenemende mate zijn
er aanwijzingen dat EHG een rol kan spelen bij herkenning van zowel dreigende
vroeggeboorte, als ook bij het herkennen van het niet vorderen van de a terme baring.
Graatsma_PROEF (all).ps Front - 65 T1 - Black CyanMagentaYellow

130 Monitoring of fetal heart rate and uterine activity
Referenties
1. Peters M, Crowe J, Pieri JF, Quartero H, Hayes-Gill B, James D, et al. Monitoring the
fetal heart non-invasively: a review of methods. J.Perinat.Med. 2001;29(0300-5577;
5):408-416.
2. Pieri JF, Crowe JA, Hayes-Gill BR, Spencer CJ, Bhogal K, James DK. Compact long-term
recorder for the transabdominal foetal and maternal electrocardiogram.
Med.Biol.Eng.Comput. 2001 01;39(0140-0118; 1):118-125.
3. Graatsma EM, Jacod BC, van Egmond LA, Mulder EJ, Visser GH. Fetal
electrocardiography: feasibility of long-term fetal heart rate recordings. BJOG 2009
Jan;116(2):334-7; discussion 337-8.
4. Huhn EA, Phasengleichgerichtete Signalmittelung der Kardiotokographie bei
intrauteriner Wachstumsretardierung. Munchen, Germany: Frauenklinik der
Technischen Universität München Klinikum rechts der Isar; 2007.
5. Lobmaier SM, Pildner von Steinburg S, Müller A, Schuster T, Huhn EA, Ortiz JU,
Schneider KTM, Schmidt G. Phase rectified signal averaging as a new method for
surveillance of growth restricted fetuses, a prospective observational study.
Munchen, Germany: Frauenklinik, Abt. Perinatalmedizin, TU München.
6. Kariniemi V, Hukkinen K, Katila T, Laine H. Quantification of fetal heart rate variability
by abdominal electrocardiography. J.Perinat.Med. 1979;7(1):27-32.
7. Stinstra JG, Peters MJ. The influence of fetoabdominal tissues on fetal ECGs and
MCGs. Arch.Physiol.Biochem. 2002 07;110(1381-3455; 3):165-176.
8. Baschat AA. Fetal growth restriction - from observation to intervention.
J.Perinat.Med. 2010 May;38(3):239-246.
9. Salvesen DR, Freeman J, Brudenell JM, Nicolaides KH. Prediction of fetal acidaemia in
pregnancies complicated by maternal diabetes mellitus by biophysical profile scoring
and fetal heart rate monitoring. Br.J.Obstet.Gynaecol. 1993 Mar;100(3):227-233.
10. Lauenborg J, Mathiesen E, Ovesen P, Westergaard JG, Ekbom P, Molsted-Pedersen L,
et al. Audit on stillbirths in women with pregestational type 1 diabetes. Diabetes Care
2003 May;26(5):1385-1389.
11. Kerssen A, de Valk HW, Visser GH. Day-to-day glucose variability during pregnancy in
women with Type 1 diabetes mellitus: glucose profiles measured with the Continuous
Glucose Monitoring System. BJOG 2004 09;111(1470-0328; 9):919-924.
12. Bakker PC, Zikkenheimer M, van Geijn HP. The quality of intrapartum uterine activity
monitoring. J.Perinat.Med. 2008;36(3):197-201.
13. Bakker JJ, Verhoeven CJ, Janssen PF, van Lith JM, van Oudgaarden ED, Bloemenkamp
KW, et al. Outcomes after internal versus external tocodynamometry for monitoring
labor. N.Engl.J.Med. 2010 Jan 28;362(4):306-313.
14. Garfield RE, Maner WL, MacKay LB, Schlembach D, Saade GR. Comparing uterine
electromyography activity of antepartum patients versus term labor patients.
Am.J.Obstet.Gynecol. 2005 Jul;193(1):23-29.
Graatsma_PROEF (all).ps Back - 65 T1 - Black CyanMagentaYellow

Addendum: Nederlandse samenvatting 131
15. Maul H, Maner WL, Olson G, Saade GR, Garfield RE. Non-invasive transabdominal
uterine electromyography correlates with the strength of intrauterine pressure and is
predictive of labor and delivery. J.Matern.Fetal.Neonatal Med. 2004 May;15(5):297-
301.
16. Maner WL, Garfield RE, Maul H, Olson G, Saade G. Predicting term and preterm
delivery with transabdominal uterine electromyography. Obstet.Gynecol. 2003
Jun;101(6):1254-1260.
17. Euliano T, Skowronski M, Marossero D, Shuster J, Edwards R. Prediction of
intrauterine pressure waveform from transabdominal electrohysterography.
J.Matern.Fetal.Neonatal Med. 2006 Dec;19(12):811-816.
18. Marque CK, Terrien J, Rihana S, Germain G. Preterm labour detection by use of a
biophysical marker: the uterine electrical activity. BMC Pregnancy Childbirth 2007 Jun
1;7 Suppl 1:S5.
19. Rabotti C, Mischi M, Oei G, Bergmans J. Noninvasive estimation of the
electrohysterographic action-potential conduction velocity. IEEE Trans.Biomed.Eng.
2010 May 10.
20. Vinken MP, Rabotti C, Mischi M, van Laar JO, Oei SG. Nifedipine-induced changes in
the electrohysterogram of preterm contractions: feasibility in clinical practice.
Obstet.Gynecol.Int. 2010;2010:325635.
21. Schlembach D, Maner WL, Garfield RE, Maul H. Monitoring the progress of pregnancy
and labor using electromyography. Eur.J.Obstet.Gynecol.Reprod.Biol. 2009 May;144
Suppl 1:S33-9.
22. Euliano TY, Marossero D, Nguyen MT, Euliano NR, Principe J, Edwards RK.
Spatiotemporal electrohysterography patterns in normal and arrested labor.
Am.J.Obstet.Gynecol. 2009 Jan;200(1):54.e1-54.e7.
23. Rabotti C, Mischi M, van Laar JO, Oei GS, Bergmans JW. Estimation of internal uterine
pressure by joint amplitude and frequency analysis of electrohysterographic signals.
Physiol.Meas. 2008 Jul;29(7):829-841.
24. Rabotti C, Mischi M, van Laar J, Oei G, Bergmans J. Electrohysterographic analysis of
uterine contraction propagation with labor progression: a preliminary study.
Conf.Proc.IEEE Eng.Med.Biol.Soc. 2007;2007:4135-4138.
25. Quenby S, Pierce SJ, Brigham S, Wray S. Dysfunctional labor and myometrial lactic
acidosis. Obstet.Gynecol. 2004 Apr;103(4):718-723.
26. Evers IM, de Valk HW, Visser GH. Risk of complications of pregnancy in women with
type 1 diabetes: nationwide prospective study in the Netherlands. BMJ 2004
04/17;328(1468-5833; 7445):915.
Graatsma_PROEF (all).ps Front - 66 T1 - Black CyanMagentaYellow

132 Monitoring of fetal heart rate and uterine activity
Graatsma_PROEF (all).ps Back - 66 T1 - Black CyanMagentaYellow

Addendum: List of co-authors 133
Addendum
List of co-authors
Graatsma_PROEF (all).ps Front - 67 T1 - Black CyanMagentaYellow

134 Monitoring of fetal heart rate and uterine activity
Graatsma_PROEF (all).ps Back - 67 T1 - Black CyanMagentaYellow

Addendum: List of co-authors 135
List of co-authors
Prof. Dr. G. H. A. Visser Dept. of Gynaecology & Obstetrics, University Medical Center
Utrecht, The Netherlands
Dr. Ir. B. C. Jacod Dept. of Gynaecology & Obstetrics, University Medical Center
Utrecht, The Netherlands
Dr. E. J. H. Mulder Dept. of Gynaecology & Obstetrics, University Medical Center
Utrecht, The Netherlands
Dr. H. W. de Valk Dept. of Internal Medicine, University Medical Center Utrecht,
The Netherlands
Prof. Dr. A. A. Baschat Dept. of Obstetrics, Gynecology & Reproductive Medicine,
University of Maryland, Baltimore, United States
J. Miller Dept. of Obstetrics, Gynecology & Reproductive Medicine,
University of Maryland, Baltimore, United States
Prof. Dr. C. Harman Dept. of Obstetrics, Gynecology & Reproductive Medicine,
University of Maryland, Baltimore, United States
S. M. Lobmaier Frauenklinik und Poliklinik Technischen Universität München,
Munich, Germany
Dr. Med. S. Pildner von
Steinburg
Frauenklinik und Poliklinik Technischen Universität München,
Munich, Germany
Prof. Dr. Med. G. Schmidt I. Medizinische Klinik, Technische Universität München, Munich,
Germany
Prof. Dr. Med. K. T. M.
Schneider
Frauenklinik und Poliklinik Technischen Universität München,
Munich, Germany
Dr. A. Kerssen General practitioner, Leidschenveen, The Netherlands
R.K. Stellato Julius Center for Health Sciences and Primary Care, Biostatistics,
University Medical Center Utrecht, The Netherlands
B. Vasak Dept. of Gynaecology & Obstetrics, Antonius ziekenhuis,
Nieuwegein, The Netherlands
L. A. J. van Egmond General Practitioner, Utrecht, the Netherlands
E. van Hagen General Practitioner, Rotterdam, The Netherlands
Graatsma_PROEF (all).ps Front - 68 T1 - Black CyanMagentaYellow

136 Monitoring of fetal heart rate and uterine activity
Graatsma_PROEF (all).ps Back - 68 T1 - Black CyanMagentaYellow

Addendum: List of publications 137
Addendum
List of publications
Graatsma_PROEF (all).ps Front - 69 T1 - Black CyanMagentaYellow

138 Monitoring of fetal heart rate and uterine activity
Graatsma_PROEF (all).ps Back - 69 T1 - Black CyanMagentaYellow

Addendum: List of publications 139
List of publications
Fetal electrocardiography: feasibility of long-term fetal heart rate recordings.
Graatsma EM, Jacod BC, van Egmond LA, Mulder EJ, Visser GH.
BJOG. 2009 Jan;116(2):334-7; discussion 337-8.
Maternal body mass index does not affect performance of fetal electrocardiography.
Graatsma EM, Miller J, Mulder EJ, Harman C, Baschat AA, Visser GH.
Am J Perinatol. 2010 Aug;27(7):573-7. Epub 2010 Mar 1.
A validation of electrohysterography for uterine activity monitoring during labour.
Jacod BC, Graatsma EM, Van Hagen E, Visser GH.
J Matern Fetal Neonatal Med. 2010 Jan;23(1):17-22.
Average acceleration and deceleration capacity of fetal heart rate in normal pregnancy
and in pregnancies complicated by intrauterine growth restriction.
Graatsma EM, Mulder EJH, Lobmaier SM, Pildner von Steinburg S, Schneider KTM,
Schmidt G, Visser GHA
Submitted for publication
Glycaemic control throughout pregnancy in women with type 1 diabetes.
Graatsma EM, de Valk HW, Kerssen A, Visser GHA
Under review
Continuous simultaneous monitoring of maternal glucose and fetal heart rate in diabetic
pregnancy.
Graatsma EM, Mulder EJH, de Valk HW, Visser GHA
Submitted for publication
Left ventricular cardiac function in fetuses with congenital diaphragmatic hernia and the
effect of fetal endoscopic tracheal occlusion.
Van Mieghem T, Gucciardo L, Doné E, Van Schoubroeck D, Graatsma EM, Visser GH,
Verhaeghe J, Deprest J.
Ultrasound Obstet Gynecol. 2009 Oct;34(4):424-9.
Graatsma_PROEF (all).ps Front - 70 T1 - Black CyanMagentaYellow

140 Monitoring of fetal heart rate and uterine activity
Graatsma_PROEF (all).ps Back - 70 T1 - Black CyanMagentaYellow

Addendum: Dankwoord 141
Addendum
Dankwoord
Graatsma_PROEF (all).ps Front - 71 T1 - Black CyanMagentaYellow

142 Monitoring of fetal heart rate and uterine activity
Graatsma_PROEF (all).ps Back - 71 T1 - Black CyanMagentaYellow

Addendum: Dankwoord 143
Dankwoord
Allereerst een woord van dank aan alle vrouwen die hebben deelgenomen aan mijn
onderzoek. Daarnaast wil ik de volgende personen bedanken voor de bijdrage die ze
hebben geleverd aan mijn onderzoek en proefschrift:
Prof. Dr. G.H.A. Visser, beste Gerard, wat ben ik blij dat jij af en toe je nek durft uit te
steken: je hebt mij een promotietraject aangeboden zonder op voorhand te weten of de
techniek wel werkt! Het resultaat spreekt nu voor zich. Ik ben je niet alleen ontzettend
dankbaar, maar heb ook erg veel van je geleerd. Ik heb het als erg inspirerend ervaren dat
je ook mij, je 57de (!) promovenda, met zoveel bevlogenheid hebt begeleid. Veel dank
hiervoor.
Dr. E.J.H. Mulder, beste Edu, jij hebt vanaf het eerste contact met Monica Healthcare tot
en met de oplevering van dit boekje alle fasen van mijn promotie van dichtbij
meegemaakt. Jouw kritische en gedetailleerde blik heeft veel bijgedragen aan de kwaliteit
van mijn stukken. Hoopvol noemde ik de eerste versie van een manuscript vaak ‘final
version’ maar na jouw grondige review werd het vaak ‘final version v10’... Ontzettend veel
dank voor alles!
Dr. Ir. B.C. Jacod, beste Benoit, dank voor je begeleiding van deel II van dit proefschrift. In
de schrijffase van mijn promotie heb ik jouw innovativiteit en analytische vaardigheden
erg gewaardeerd. Vooral na onze brainstorm sessies had ik weer inspiratie om aan de slag
te gaan. Mijn promotie is een primeur voor jou als co-promotor en ik weet zeker dat er
nog veel zullen volgen. Ik kijk uit naar onze verdere samenwerking in de kliniek of
wetenschap!
Dr. H.W. de Valk, beste Harold, mijn derde co-promotor! Ik heb je leren kennen als zeer
energiek, met een grote passie voor je vak en wetenschappelijk erg behulpzaam en
betrokken. Onze trip naar Istanbul met het dream-team zal ik niet snel vergeten! Hartelijk
dank voor je bijdrage aan mijn onderzoek en promotie.
De leden van de leescommissie: Prof. Dr. F. van Bel, Prof. Dr. E. ter Braak, Dr. A. Franx,
Prof. Dr. G. Oei en Prof. Dr. F. Vandenbussche dank ik voor het kritisch beoordelen van dit
proefschrift.
Prof. W. Steyn, baie dankie vor die mooie tijd in Tygerberg, Stellenbosch, Suid Afrika.
Graatsma_PROEF (all).ps Front - 72 T1 - Black CyanMagentaYellow

144 Monitoring of fetal heart rate and uterine activity
Rebecca Stellato, dank voor je statistische bijdrage aan hoofdstuk 8.
Julia Velikopolskaia, fijn dat je steeds last-minute bereid was om te helpen bij het fine-
tunen van de Acces-database voor de MAPLE studie!
Anneloes Kerssen, dank voor het beschikbaar stellen van je data en je bijdrage aan mijn
diabeten onderzoek.
The “Baltimore” group; thanks for sharing your ‘big girls’ data with us.
The “Munchen” group; thank you so much for your warm welcome last March and your
enthusiastic cooperation regarding Chapter 4.
Monica Healthcare (Terry, Barrie, Carl and Jean Francois): Thank you for the technical
support during the AN24-studies. I always enjoyed working with Monica and wish you all
the best!
Verloskamerpersoneel, assistenten en verloskundigen van het WKZ, Antonius ziekenhuis
te Nieuwegein en Gelre ziekenhuis te Apeldoorn (met name Elske Hekman-Drost): dank
voor jullie hulp bij het includeren van patiënten voor de MAPLE studie (hoofdstuk 8).
Dames van het (staf)secretariaat Lot, Ineke, Erica, Demelza, Ans en in het bijzonder
Bertina: bedankt voor jullie gezelligheid en hulp de afgelopen 4 jaar.
(Voormalig) studenten: Leo van Egmond, Pieter van Hagen, Eline van Hagen en Nienke Lut,
dank voor jullie inzet en bijdrage aan dit proefschrift. Blanka, wat was ik blij met jouw
inzet voor de MAPLE studie. Ik kan mij geen betere ‘opvolgster’ bedenken: heel veel
succes!
Onderzoekers van het WKZ en ‘de overkant’! Ontelbare uitgebreide maandag-lunches,
Basket-borrels, Gutenberg-koffie-breaks, congressen en DJ-battles… zonder de nodige
afleiding en gezelligheid was mijn onderzoekstijd nooit zo leuk (of uit te houden?)
geweest!
Roel de Heus en Martijn Oudijk, ik vond het heel relaxed dat jullie altijd zin en tijd hadden
om mee te denken over mijn onderzoek!
Collega’s en stafleden van het Diakonessenhuis. Dank voor jullie begrip in de afgelopen
drukke weken. Vanaf nu weer genoeg tijd voor gezellige borrels of boottochtjes na het
werk!
Graatsma_PROEF (all).ps Back - 72 T1 - Black CyanMagentaYellow

Addendum: Dankwoord 145
Lieve vrienden en familie, dank voor jullie interesse en/of gezellige afleiding!
Stef en B-Maat: 1 down, 2 to go: zet ‘m op! Lot en Flop, nu kunnen we eindelijk weer
weekenden plannen! C-lot, nu al zin om met ‘destiny 7’ je te komen opzoeken!
Mijn paranimfen Annemieke en Esther: Als ‘drie musketiers’ zijn we ongeveer gelijk
begonnen aan ons promotietraject en hebben we meegeleefd met elkaars
(wetenschappelijke) ups & downs. Soms met een traan maar dan meestal van het lachen.
Niet alleen in Utrecht maar ook in Cowboy-Texas, op de scooter in Florence, aan de
hotelbar in Sorrento, óf in de sneeuw van Les Gets. Ik ben heel blij dat jullie mij bijstaan als
paranimf.
Lieve G-Brothers, dankzij jullie kan ik na een vakantie met de familie in een nóg hoger
tempo praten, grappen maken, lachen (en skiën??). Top dat we nu met z’n drieën (met de
Stef’s) in Amsterdam wonen.
Lieve Oma Boekje, niet meer hier, maar nog steeds een grote bron van inspiratie voor mij.
Wat zou je trots zijn op mijn ‘boekje’!
Lieve schoonfamilie, dank voor jullie oprechte interesse in mijn onderzoek en voor de vele
relaxte weekenden in Enschede waar ik zo graag kom (en steeds zo verwend wordt)!
Lieve pap en mam, na het succes van huiswerkinstituut LiHa (waarbij overigens alleen de
boyz ingeschreven stonden…) kunnen jullie straks ook promotie-begeleiding aanbieden in
jullie assortiment. Dank voor jullie kritische vragen, interesse, luisterend oor en
stimulerende pep-talks. Ik ben heel blij met jullie!
Lieve Stephan, wat maak jij mij gelukkig! De rust die je mij geeft enerzijds en jouw
aanstekelijke energie anderzijds. Dankzij jou blijf ik scherp en kritisch, ook ten aanzien van
mijn werk. Je hebt altijd veel interesse getoond (soms tot vermoeiens toe… ) en mij
gestimuleerd in mijn onderzoek. Wat fijn dat het nu klaar is zodat ik nóg meer kan
genieten van alle leuke dingen die we samen kunnen doen!
Graatsma_PROEF (all).ps Front - 73 T1 - Black CyanMagentaYellow

146 Monitoring of fetal heart rate and uterine activity
Graatsma_PROEF (all).ps Back - 73 T1 - Black CyanMagentaYellow

Addendum: Curriculum Vitae 147
Addendum
Curriculum Vitae
Graatsma_PROEF (all).ps Front - 74 T1 - Black CyanMagentaYellow

148 Monitoring of fetal heart rate and uterine activity
Graatsma_PROEF (all).ps Back - 74 T1 - Black CyanMagentaYellow

Addendum: Curriculum Vitae 149
Curriculum Vitae
Margo Graatsma werd op 16 april 1979 geboren te Gouda.
In 1997 behaalde zij haar VWO diploma aan het Rotterdams
Montessori Lyceum. De numerus fixus voor de studie
Geneeskunde zorgde door tweemaal uitloten voor enkele
omzwervingen. Zij werkte een jaar als au pair in Parijs en
behaalde tevens haar propedeuse Psychologie aan de
Universiteit Utrecht. Na een derde maal meeloten begon zij
in 1999 zeer gemotiveerd aan de opleiding Geneeskunde,
ook ditmaal aan de Universiteit Utrecht. De studie werd in
2002 een jaar onderbroken door haar functie als praeses
van het Bestuur van de Utrechtsche Vrouwelijke Studenten Vereeniging (UVSV/NVVSU).
Na de doctoraalfase van haar studie heeft zij haar wetenschappelijke stage uitgevoerd bij
Prof. Dr. G.H.A. Visser. Na het artsexamen in 2006 kreeg zij de gelegenheid het
wetenschappelijk onderzoek voort te zetten in een promotie-onderzoek, dat zij onder
leiding van Prof. Dr. G.H.A. Visser heeft afgerond.
In het kader van een uitwisselingstraject heeft zij in 2008 onder leiding van Prof. Dr. W.
Steyn in het Tygerberg ziekenhuis te Stellenbosch, Zuid Afrika, 3 maanden onderzoek
gedaan. Verder was zij in 2009 gedurende 7 maanden werkzaam als AGNIO op de afdeling
Verloskunde van het Universitair Medisch Centrum Utrecht.
In mei 2010 is zij begonnen met haar opleiding tot gynaecoloog in het Diakonessenhuis te
Utrecht (Opleider Dr. P.C. Scholten).
Margo woont in Amsterdam samen met Stephan Lutke Holzik met wie zij in januari 2010 is
getrouwd.
Graatsma_PROEF (all).ps Front - 75 T1 - Black CyanMagentaYellow

150 Monitoring of fetal heart rate and uterine activity
Graatsma_PROEF (all).ps Back - 75 T1 - Black CyanMagentaYellow