monitoring of horizontal movements of high-rise buildings ... · 3.1 monitoring horizontal...
TRANSCRIPT

Monitoring of horizontal movements of high-rise buildings and tower transmitters by means
of ground-based interferometric radar
M. Talich 1 *
1 The Czech Academy of Sciences, Institute of Information Theory and Automation, Prague, Czech Republic –
KEY WORDS: Ground-based radar interferometry, Horizontal movements, Deformations, High-rise buildings, Tower transmitters
ABSTRACT:
The paper describes possibilities of the relatively new technics – ground based radar interferometry for precise determining of
deformation of structures. Special focus on the horizontal movements of high-rise buildings and on the tower transmitters is
presented. The technology of ground based radar interferometry can be used in practice to the contactless determination of
deformations of such structures with accuracy up to 0.01 mm in real time. It is also possible to capture oscillations of the object with
a frequency up to 50 Hz in real time. Deformations can be determined simultaneously in multiple places of the object, for example in
the case of high-rise buildings it is possible to monitor the horizontal vibration of the whole object at its different height levels
intervals of one or more meters. It is possible to detect and determine the compound oscillations that occur in some types of such
buildings. This allows to obtain both overall and detailed information about the properties of the structure during its dynamic load
e.g. by wind. Then prevent any damage or even disasters in these objects. In addition to the necessary theory basic principles of
using radar interferometry for determining of deformation of structures are given. Practical examples of determining of horizontal
movements of high-rise building and tower transmitter are also given. The IBIS-S interferometric radar of the Italian IDS
manufacturer was used for the measurements.
* Corresponding author
1. INTRODUCTION
By looking for methods of some contactless observation and
measurements of horizontal movements of the high-rise
structures, we need to define other requirements for these
methods as well. One of these requirements might be the ability
to observe movements in real time for both, short and long time
span. For example, in the case of high-rise buildings they are
wind gusts. As well dynamically observe and measure
frequencies and amplitudes of observed object’s oscillation in
range for example of 50 Hz. Ability to determine the size of
movements with accuracy in 0.01 mm, because the size of the
movements is usually in range from 0.1 mm to 100 mm. Ability
to simultaneously determine movements on multiple points of
the observed object, so that is possible to get both, detail and
whole information about movements of the structure during
dynamic stress.
To all of these requirements fits the method of measurement
based on principles of ground-based radar interferometry. The
big capability of this method is the simultaneously measurement
of multiple movements on multiple points on one observed
object with range resolution at least of 0.75 m. For example, on
high-rise structure with high of 100 m, we can simultaneously
observe and measure roughly 100 points. To show the
possibilities of the radar interferometry technology, this article
will focus to determining of horizontal movements of two
different object types. It will be measurement of horizontal
movements of high-rise buildings and tower transmitters. The
measurements are done by interferometry radar IBIS-S (IBIS-
FS) of IDS – Ingegneria Dei Sistemi Company.
2. PRINCIPLES OF USING RADAR
INTERFEROMETRY
Basic principles of radar interferometry with IBIS-S are
described below. The IBIS-S products are based on two well-
known radar techniques:
1. Stepped Frequency Continuous Wave (SF-CW),
2. Differential interferometry.
2.1 Stepped Frequency Continuous Wave
The continuous stepped frequency wave serves to measure the
distance from radar to observed object. It resolves the scenario
in the range direction, detecting the position in range of
different targets placed along the radar’s line of sight.
Microwave radiation is sent out in short high-power pulses and
the distance to object is calculated from time correlation
between sent and received signal. Utilizing this technology IBIS
constructs a one-dimensional image called range profile. The
illuminated area is divided into circular segments (range bins =
resolution cells) of constant distance from radar. All targets in a
given segment contribute to the observed values (amplitude and
phase) of the segment. The segments' width is called range
resolution ΔR. The distance from radar to target is calculated
from formula:
0
2
ocTR = , (1)
where T0 is delay in response. The range resolution can be
calculated from
The International Archives of the Photogrammetry, Remote Sensing and Spatial Information Sciences, Volume XLII-3/W4, 2018 GeoInformation For Disaster Management (Gi4DM), 18–21 March 2018, Istanbul, Turkey
This contribution has been peer-reviewed. https://doi.org/10.5194/isprs-archives-XLII-3-W4-499-2018 | © Authors 2018. CC BY 4.0 License.
499
2
cτΔR= , (2)
where τ is pulse width. This means the radar is able to discern
two distinct targets only if Δt > τ and thus Δd > ΔR. Range
resolution is limited by pulse width.
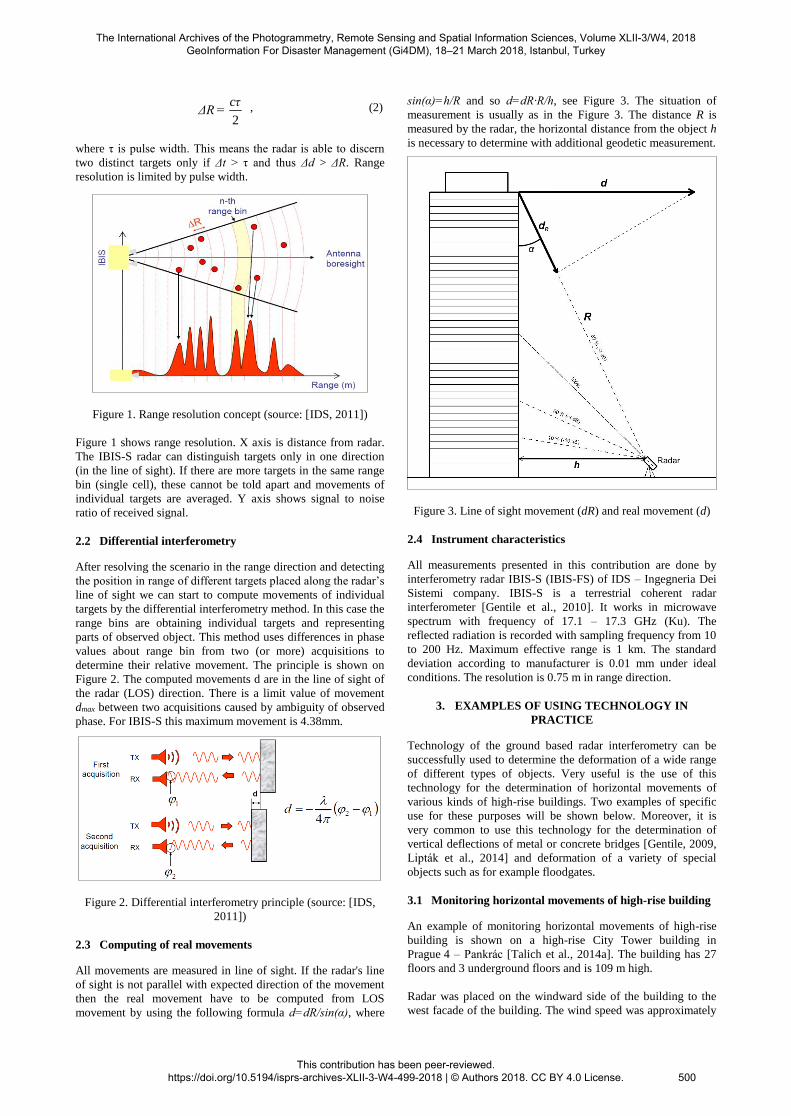
Figure 1. Range resolution concept (source: [IDS, 2011])
Figure 1 shows range resolution. X axis is distance from radar.
The IBIS-S radar can distinguish targets only in one direction
(in the line of sight). If there are more targets in the same range
bin (single cell), these cannot be told apart and movements of
individual targets are averaged. Y axis shows signal to noise
ratio of received signal.
2.2 Differential interferometry
After resolving the scenario in the range direction and detecting
the position in range of different targets placed along the radar’s
line of sight we can start to compute movements of individual
targets by the differential interferometry method. In this case the
range bins are obtaining individual targets and representing
parts of observed object. This method uses differences in phase
values about range bin from two (or more) acquisitions to
determine their relative movement. The principle is shown on
Figure 2. The computed movements d are in the line of sight of
the radar (LOS) direction. There is a limit value of movement
dmax between two acquisitions caused by ambiguity of observed
phase. For IBIS-S this maximum movement is 4.38mm.
Figure 2. Differential interferometry principle (source: [IDS,
2011])
2.3 Computing of real movements
All movements are measured in line of sight. If the radar's line
of sight is not parallel with expected direction of the movement
then the real movement have to be computed from LOS
movement by using the following formula d=dR/sin(α), where
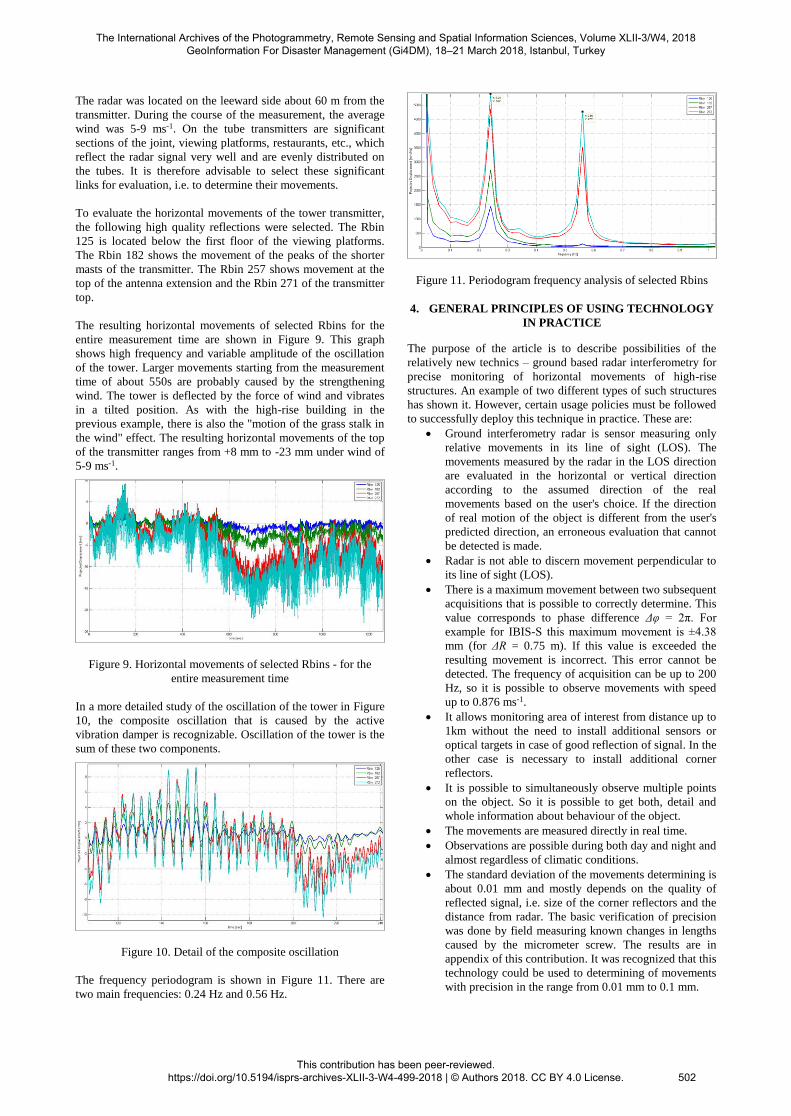
sin(α)=h/R and so d=dR∙R/h, see Figure 3. The situation of
measurement is usually as in the Figure 3. The distance R is
measured by the radar, the horizontal distance from the object h
is necessary to determine with additional geodetic measurement.
Figure 3. Line of sight movement (dR) and real movement (d)
2.4 Instrument characteristics
All measurements presented in this contribution are done by
interferometry radar IBIS-S (IBIS-FS) of IDS – Ingegneria Dei
Sistemi company. IBIS-S is a terrestrial coherent radar
interferometer [Gentile et al., 2010]. It works in microwave
spectrum with frequency of 17.1 – 17.3 GHz (Ku). The
reflected radiation is recorded with sampling frequency from 10
to 200 Hz. Maximum effective range is 1 km. The standard
deviation according to manufacturer is 0.01 mm under ideal
conditions. The resolution is 0.75 m in range direction.
3. EXAMPLES OF USING TECHNOLOGY IN
PRACTICE
Technology of the ground based radar interferometry can be
successfully used to determine the deformation of a wide range
of different types of objects. Very useful is the use of this
technology for the determination of horizontal movements of
various kinds of high-rise buildings. Two examples of specific
use for these purposes will be shown below. Moreover, it is
very common to use this technology for the determination of
vertical deflections of metal or concrete bridges [Gentile, 2009,
Lipták et al., 2014] and deformation of a variety of special
objects such as for example floodgates.
3.1 Monitoring horizontal movements of high-rise building
An example of monitoring horizontal movements of high-rise
building is shown on a high-rise City Tower building in
Prague 4 – Pankrác [Talich et al., 2014a]. The building has 27
floors and 3 underground floors and is 109 m high.
Radar was placed on the windward side of the building to the
west facade of the building. The wind speed was approximately
The International Archives of the Photogrammetry, Remote Sensing and Spatial Information Sciences, Volume XLII-3/W4, 2018 GeoInformation For Disaster Management (Gi4DM), 18–21 March 2018, Istanbul, Turkey
This contribution has been peer-reviewed. https://doi.org/10.5194/isprs-archives-XLII-3-W4-499-2018 | © Authors 2018. CC BY 4.0 License.
500

5-7 ms-1. The wind direction was steady west. The positioning
of standpoint is a compromise between the requirements for the
distance between the radar and the object. With the increasing
distance, the reflected signal strength and the maximum
measurable sampling rate decrease.
Figure 4. City Tower building in Prague 4 – Pankrác
Three strongest reflections were selected for the evaluation.
These are uniformly distributed on the facade of the building as
shown in Figure 4. Rbin 267 approximately in the middle of the
facade, Rbin 284 overhangs of the last two floors, and Rbin 293
Roof Edge. As can be seen from Figure 4, a number of high-
quality reflections can be found on the facade of this sample
object, and therefore there is no need to fit corner reflectors.
Figure 5. Horizontal movements of selected Rbins - for the
entire measurement time
Figure 6. Horizontal movements of selected Rbins - detail
In Figures 5 and 6 there is a graph of horizontal movements of
selected Rbins. There is a varying amplitude of oscillation,
depending on the varying wind force. This is the so-called
"motion of the grass stalk in the wind". The movement of the
top of the building ranges from +2.2 mm to -0.6 mm.
The measurement did not detect any interference with the
oscillation of the movements. It can be assumed that the
building is not equipped with a vibration damper or has not
been running due such small movements. Another option is that
the construction of the building is stiff and does not require
damping.
The oscillation frequency of a building can be determined by
frequency analysis or, from the frequency periodogram in
Figure 7. The strongest frequency is 0.48 Hz. Another
significant frequency is 0.6 Hz.
Figure 7. Periodogram frequency analysis of selected Rbins
3.2 Monitoring horizontal movements of tower transmitters
An example of monitoring horizontal movements of tower
transmitters is shown on a Žižkov transmitter in Prague [Talich
et al., 2014b], which is one of Prague's dominant and at the
same time the tallest building (216 m) in the city. Base
reinforced concrete plate with a diameter of 30 m and
a thickness of 4 m, is located at a depth of 15 m below the
original surface. The vertical construction consists of three
cylindrical steel tubes. The two adjacent tubes have a diameter
of 4.8 m and reach a height of 134 meters. The main tube has
a diameter of 6.4 m, and passes into the antenna extension
reaching to a height of 216 m. Tubes are made of concentric
steel pipes, with a 30cm thick space to be poured with concrete.
The project of the transmitter construction was calculated with
a maximum horizontal displacement of the top of the tower of
1.20 m. The vibration damper limits the displacement to
a maximum of 12 cm.
Figure 8. Tower transmitter Prague – Žižkov and selected Rbins
The International Archives of the Photogrammetry, Remote Sensing and Spatial Information Sciences, Volume XLII-3/W4, 2018 GeoInformation For Disaster Management (Gi4DM), 18–21 March 2018, Istanbul, Turkey
This contribution has been peer-reviewed. https://doi.org/10.5194/isprs-archives-XLII-3-W4-499-2018 | © Authors 2018. CC BY 4.0 License.
501
The radar was located on the leeward side about 60 m from the
transmitter. During the course of the measurement, the average
wind was 5-9 ms-1. On the tube transmitters are significant
sections of the joint, viewing platforms, restaurants, etc., which
reflect the radar signal very well and are evenly distributed on
the tubes. It is therefore advisable to select these significant
links for evaluation, i.e. to determine their movements.
To evaluate the horizontal movements of the tower transmitter,
the following high quality reflections were selected. The Rbin
125 is located below the first floor of the viewing platforms.
The Rbin 182 shows the movement of the peaks of the shorter
masts of the transmitter. The Rbin 257 shows movement at the
top of the antenna extension and the Rbin 271 of the transmitter
top.
The resulting horizontal movements of selected Rbins for the
entire measurement time are shown in Figure 9. This graph
shows high frequency and variable amplitude of the oscillation
of the tower. Larger movements starting from the measurement
time of about 550s are probably caused by the strengthening
wind. The tower is deflected by the force of wind and vibrates
in a tilted position. As with the high-rise building in the
previous example, there is also the "motion of the grass stalk in
the wind" effect. The resulting horizontal movements of the top
of the transmitter ranges from +8 mm to -23 mm under wind of
5-9 ms-1.
Figure 9. Horizontal movements of selected Rbins - for the
entire measurement time
In a more detailed study of the oscillation of the tower in Figure
10, the composite oscillation that is caused by the active
vibration damper is recognizable. Oscillation of the tower is the
sum of these two components.
Figure 10. Detail of the composite oscillation
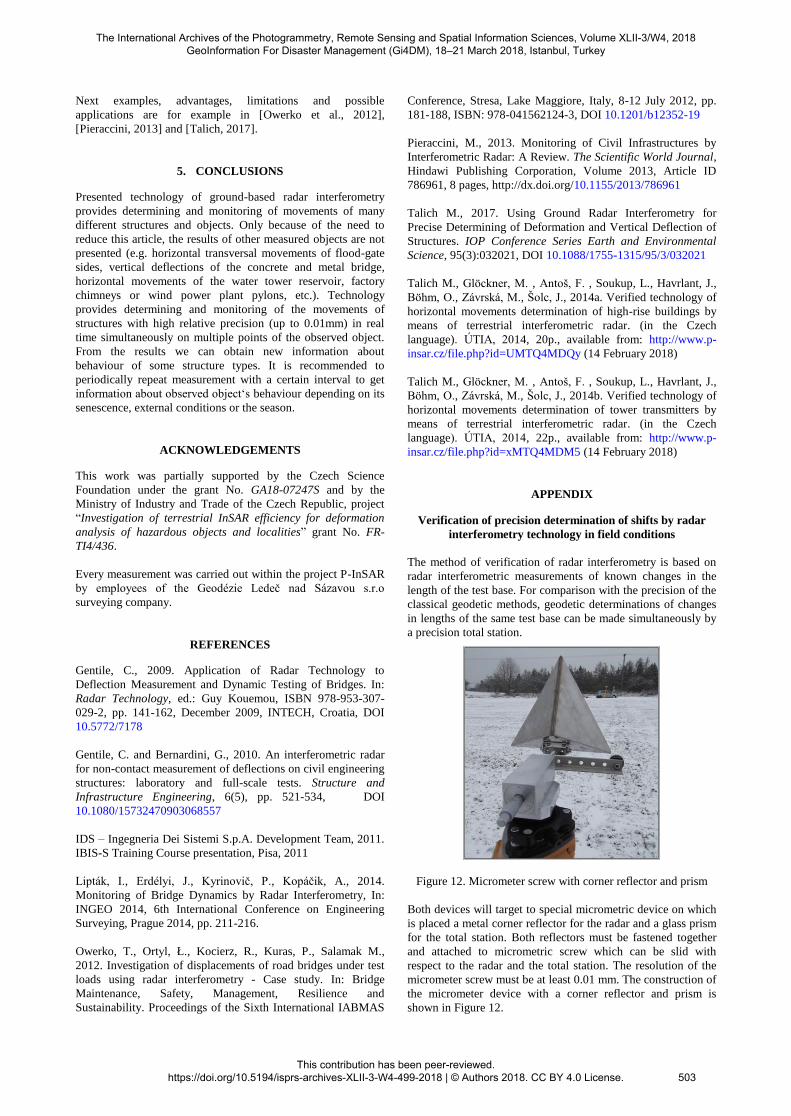
The frequency periodogram is shown in Figure 11. There are
two main frequencies: 0.24 Hz and 0.56 Hz.
Figure 11. Periodogram frequency analysis of selected Rbins
4. GENERAL PRINCIPLES OF USING TECHNOLOGY
IN PRACTICE
The purpose of the article is to describe possibilities of the
relatively new technics – ground based radar interferometry for
precise monitoring of horizontal movements of high-rise
structures. An example of two different types of such structures
has shown it. However, certain usage policies must be followed
to successfully deploy this technique in practice. These are:
Ground interferometry radar is sensor measuring only
relative movements in its line of sight (LOS). The
movements measured by the radar in the LOS direction
are evaluated in the horizontal or vertical direction
according to the assumed direction of the real
movements based on the user's choice. If the direction
of real motion of the object is different from the user's
predicted direction, an erroneous evaluation that cannot
be detected is made.
Radar is not able to discern movement perpendicular to
its line of sight (LOS).
There is a maximum movement between two subsequent
acquisitions that is possible to correctly determine. This
value corresponds to phase difference Δφ = 2π. For
example for IBIS-S this maximum movement is ±4.38
mm (for ΔR = 0.75 m). If this value is exceeded the
resulting movement is incorrect. This error cannot be
detected. The frequency of acquisition can be up to 200
Hz, so it is possible to observe movements with speed
up to 0.876 ms-1.
It allows monitoring area of interest from distance up to
1km without the need to install additional sensors or
optical targets in case of good reflection of signal. In the
other case is necessary to install additional corner
reflectors.
It is possible to simultaneously observe multiple points
on the object. So it is possible to get both, detail and
whole information about behaviour of the object.
The movements are measured directly in real time.
Observations are possible during both day and night and
almost regardless of climatic conditions.
The standard deviation of the movements determining is
about 0.01 mm and mostly depends on the quality of
reflected signal, i.e. size of the corner reflectors and the
distance from radar. The basic verification of precision
was done by field measuring known changes in lengths
caused by the micrometer screw. The results are in
appendix of this contribution. It was recognized that this
technology could be used to determining of movements
with precision in the range from 0.01 mm to 0.1 mm.
The International Archives of the Photogrammetry, Remote Sensing and Spatial Information Sciences, Volume XLII-3/W4, 2018 GeoInformation For Disaster Management (Gi4DM), 18–21 March 2018, Istanbul, Turkey
This contribution has been peer-reviewed. https://doi.org/10.5194/isprs-archives-XLII-3-W4-499-2018 | © Authors 2018. CC BY 4.0 License.
502
Next examples, advantages, limitations and possible
applications are for example in [Owerko et al., 2012],
[Pieraccini, 2013] and [Talich, 2017].
5. CONCLUSIONS
Presented technology of ground-based radar interferometry
provides determining and monitoring of movements of many
different structures and objects. Only because of the need to
reduce this article, the results of other measured objects are not
presented (e.g. horizontal transversal movements of flood-gate
sides, vertical deflections of the concrete and metal bridge,
horizontal movements of the water tower reservoir, factory
chimneys or wind power plant pylons, etc.). Technology
provides determining and monitoring of the movements of
structures with high relative precision (up to 0.01mm) in real
time simultaneously on multiple points of the observed object.
From the results we can obtain new information about
behaviour of some structure types. It is recommended to
periodically repeat measurement with a certain interval to get
information about observed object‘s behaviour depending on its
senescence, external conditions or the season.
ACKNOWLEDGEMENTS
This work was partially supported by the Czech Science
Foundation under the grant No. GA18-07247S and by the
Ministry of Industry and Trade of the Czech Republic, project
“Investigation of terrestrial InSAR efficiency for deformation
analysis of hazardous objects and localities” grant No. FR-
TI4/436.
Every measurement was carried out within the project P-InSAR
by employees of the Geodézie Ledeč nad Sázavou s.r.o
surveying company.
REFERENCES
Gentile, C., 2009. Application of Radar Technology to
Deflection Measurement and Dynamic Testing of Bridges. In:
Radar Technology, ed.: Guy Kouemou, ISBN 978-953-307-
029-2, pp. 141-162, December 2009, INTECH, Croatia, DOI
10.5772/7178
Gentile, C. and Bernardini, G., 2010. An interferometric radar
for non-contact measurement of deflections on civil engineering
structures: laboratory and full-scale tests. Structure and
Infrastructure Engineering, 6(5), pp. 521-534, DOI
10.1080/15732470903068557
IDS – Ingegneria Dei Sistemi S.p.A. Development Team, 2011.
IBIS-S Training Course presentation, Pisa, 2011
Lipták, I., Erdélyi, J., Kyrinovič, P., Kopáčik, A., 2014.
Monitoring of Bridge Dynamics by Radar Interferometry, In:
INGEO 2014, 6th International Conference on Engineering
Surveying, Prague 2014, pp. 211-216.
Owerko, T., Ortyl, Ł., Kocierz, R., Kuras, P., Salamak M.,
2012. Investigation of displacements of road bridges under test
loads using radar interferometry - Case study. In: Bridge
Maintenance, Safety, Management, Resilience and
Sustainability. Proceedings of the Sixth International IABMAS
Conference, Stresa, Lake Maggiore, Italy, 8-12 July 2012, pp.
181-188, ISBN: 978-041562124-3, DOI 10.1201/b12352-19
Pieraccini, M., 2013. Monitoring of Civil Infrastructures by
Interferometric Radar: A Review. The Scientific World Journal,
Hindawi Publishing Corporation, Volume 2013, Article ID
786961, 8 pages, http://dx.doi.org/10.1155/2013/786961
Talich M., 2017. Using Ground Radar Interferometry for
Precise Determining of Deformation and Vertical Deflection of
Structures. IOP Conference Series Earth and Environmental
Science, 95(3):032021, DOI 10.1088/1755-1315/95/3/032021
Talich M., Glöckner, M. , Antoš, F. , Soukup, L., Havrlant, J.,
Böhm, O., Závrská, M., Šolc, J., 2014a. Verified technology of
horizontal movements determination of high-rise buildings by
means of terrestrial interferometric radar. (in the Czech
language). ÚTIA, 2014, 20p., available from: http://www.p-
insar.cz/file.php?id=UMTQ4MDQy (14 February 2018)
Talich M., Glöckner, M. , Antoš, F. , Soukup, L., Havrlant, J.,
Böhm, O., Závrská, M., Šolc, J., 2014b. Verified technology of
horizontal movements determination of tower transmitters by
means of terrestrial interferometric radar. (in the Czech
language). ÚTIA, 2014, 22p., available from: http://www.p-
insar.cz/file.php?id=xMTQ4MDM5 (14 February 2018)
APPENDIX
Verification of precision determination of shifts by radar
interferometry technology in field conditions
The method of verification of radar interferometry is based on
radar interferometric measurements of known changes in the
length of the test base. For comparison with the precision of the
classical geodetic methods, geodetic determinations of changes
in lengths of the same test base can be made simultaneously by
a precision total station.
Figure 12. Micrometer screw with corner reflector and prism
Both devices will target to special micrometric device on which
is placed a metal corner reflector for the radar and a glass prism
for the total station. Both reflectors must be fastened together
and attached to micrometric screw which can be slid with
respect to the radar and the total station. The resolution of the
micrometer screw must be at least 0.01 mm. The construction of
the micrometer device with a corner reflector and prism is
shown in Figure 12.
The International Archives of the Photogrammetry, Remote Sensing and Spatial Information Sciences, Volume XLII-3/W4, 2018 GeoInformation For Disaster Management (Gi4DM), 18–21 March 2018, Istanbul, Turkey
This contribution has been peer-reviewed. https://doi.org/10.5194/isprs-archives-XLII-3-W4-499-2018 | © Authors 2018. CC BY 4.0 License.
503

Testing can also be carried out in field conditions as shown in
Figure 13. The aim is to verify the functionality of the
technology in the field. The length of the test base is not
significant because the precision of the shift measurements by
radar interferometry technologies does not depend significantly
on the distance to the monitored object but on the quality of the
reflected signal.
Figure 13. View of the test base in the LOS direction
In this particular case, a distance of 39 m was chosen. The IBIS-
S radar and the SOKKIA NET1AX total station (TS) were used.
During the test, two 0.5 mm shifts in the direction from the
radar and one 1 mm shift back to the radar were induced by
a micrometer screw. Next, 5 shifts of 0.1 mm were made in the
direction from the radar and one 0.5 mm shift back in the radar
direction.
Figure 14. 0.5mm shifts measured by TS (left) and radar (right)
The result of the first measurement is shown in Figure 14. On
the left is a graph of shifts measured by the total station, in the
right part there are shifts measured by radar interferometry
technology. It is clear that the precision achieved by terrestrial
radar interferometry technology surpasses the classical geodetic
method, which is very significant.
The result of the measuring of 0.1 mm shifts is shown in Figure
15. The classical method of measuring such small shifts by the
geodetic total station is completely failing, as is evident from
the penultimate shift. Radar interferometry technology reliably
measured shifts of 0.1 mm with a maximum scatter of 0.05 mm.
Figure 15. 0.1mm shifts measured by TS (left) and radar (right)
Significant changes in shifts at the time they were induced by
the micrometric screw are due to the touch of a hand on the
micrometer screw. Greater variation of shifts in the time outside
their realization by micrometer screw were caused by running
through cars on a nearby road. The functionality of the
technology has been verified in unfavourable field conditions.
Testing has achieved the required precision, and it is therefore
possible to state that this technology can be used for contactless
determining and monitoring of shifts with a precision within the
order of hundredths of mm with a maximum scatter of 0.05 mm.
The International Archives of the Photogrammetry, Remote Sensing and Spatial Information Sciences, Volume XLII-3/W4, 2018 GeoInformation For Disaster Management (Gi4DM), 18–21 March 2018, Istanbul, Turkey
This contribution has been peer-reviewed. https://doi.org/10.5194/isprs-archives-XLII-3-W4-499-2018 | © Authors 2018. CC BY 4.0 License.
504