monitoring of mycotoxins in animal feed
TRANSCRIPT

toxins
Article
Data Analyses and Modelling for Risk BasedMonitoring of Mycotoxins in Animal Feed
H.J. (Ine) van der Fels-Klerx *, Paulien Adamse, Ans Punt and Esther D. van Asselt
RIKILT Wageningen Research, Akkermaalsbos 2, 6708 WB Wageningen, The Netherlands;[email protected] (P.A.); [email protected] (A.P.); [email protected] (E.D.v.A.)* Correspondence: [email protected]; Tel.: +31-317-481-963
Received: 20 December 2017; Accepted: 22 January 2018; Published: 26 January 2018
Abstract: Following legislation, European Member States should have multi-annual control programsfor contaminants, such as for mycotoxins, in feed and food. These programs need to be risk basedimplying the checks are regular and proportional to the estimated risk for animal and humanhealth. This study aimed to prioritize feed products in the Netherlands for deoxynivalenol andaflatoxin B1 monitoring. Historical mycotoxin monitoring results from the period 2007–2016 werecombined with data from other sources. Based on occurrence, groundnuts had high priority foraflatoxin B1 monitoring; some feed materials (maize and maize products and several oil seedproducts) and complete/complementary feed excluding dairy cattle and young animals had mediumpriority; and all other animal feeds and feed materials had low priority. For deoxynivalenol, maizeby-products had a high priority, complete and complementary feed for pigs had a medium priorityand all other feed and feed materials a low priority. Also including health consequence estimationsshowed that feed materials that ranked highest for aflatoxin B1 included sunflower seed andpalmkernel expeller/extracts and maize. For deoxynivalenol, maize products were ranked highest,followed by various small grain cereals (products); all other feed materials were of lower concern.Results of this study have proven to be useful in setting up the annual risk based control program formycotoxins in animal feed and feed materials.
Keywords: contaminant; aflatoxin B1; deoxynivalenol; feed; trend analyses; risk; model
Key contribution: This study presents a methodology for prioritizing animal feeds and feed materialsfor risk-based monitoring of aflatoxin B1 and deoxynivalenol.
1. Introduction
According to Regulation (EC) No 882/2004, Member States in Europe should establish andimplement multi-annual control programs for contaminants in feed and food materials and derivedproducts, to ensure that checks are regular and proportional to the risk for animal and human health [1].In the Netherlands, descriptive (including trend) analyses of historical monitoring results and riskmodelling are performed with the aim to obtain insights into which combinations of contaminant-feedmaterials are of highest concern. Data analyses focuses on occurrence of contaminants, using historicalmonitoring data such as, for example, on heavy metals in feed products [2]. Risk modelling focuseson estimating the consequences on animal and human health due to the presence of the contaminantin feed and feed materials [3]. The combined results are used by the National Food and ConsumerProduct Safety Authority (NVWA) for setting priorities for the multi-annual control program forcontaminants in feed and feed materials each year.
This study aimed to prioritize feed and feed materials for risk based monitoring of deoxynivalenoland aflatoxin B1 in the Netherlands, by descriptive statistical analyses and risk modelling usinghistorical monitoring results combined with other data sources.
Toxins 2018, 10, 54; doi:10.3390/toxins10020054 www.mdpi.com/journal/toxins

Toxins 2018, 10, 54 2 of 15
2. Results and Discussion
2.1. Data: Overview of Numbers of Samples
The total dataset obtained for the aims of this study included 35,119 sample results over the studyperiod 2007–2016; these included 11,834 records for deoxynivalenol and 23,285 records for aflatoxin B1.The origin of the records over public and private was about 1:3. Table 1 presents the number of samplesper year for aflatoxin B1 and deoxynivalenol.
Table 1. Overview of numbers of monitoring results for deoxynivalenol (DON) and aflatoxin B1 (AFB1)per year, public and private data, in the period 2007–2016.
YearPublic Private Public Private
DON DON AFB1 AFB1
2007 351 1429 236 12792008 321 76 223 5312009 304 100 407 4112010 423 151 454 4172011 551 153 569 3142012 517 1255 517 6262013 504 1630 450 26752014 418 1415 393 35192015 303 914 294 50772016 411 608 375 4518total 4103 7731 3918 19,367
2.2. Descriptive Data Analyses
Results of the descriptive data analyses, including trend analyses over time, of concentrationsof aflatoxin B1 and deoxynivalenol in animal feed and feed materials were examined for each feedproduct and toxin, separately. Next, the results were summarized for the presence of aflatoxin B1 anddeoxynivalenol in feed and feed materials, using four different metrics and classified for their priority(low, medium, high), as described in the Material and Methods section.
2.3. Aflatoxin B1
For each animal feed and feed material, the average, median and 90th percentile concentration ofaflatoxin B1 in the period 2007–2016 were plotted. For illustration purposes, Figures 1 and 2 presentthe results for maize and maize products (Figure 1) and compound feed for dairy cattle (Figure 2).
As can be seen from Table 1 and the two figures, the number of samples collected from animalfeed and feed material in the last years (starting in 2013) was much higher than in the earlier yearsof the period considered. In fact, in the years 2008–2012, only a few samples were collected fromcompound feed for dairy cattle. The increase in the number of samples is the result of a new strategyof the feed industry, after the aflatoxin incident in March 2013 in the Netherlands, as described byDe Rijk et al. [4], to collect more maize samples for aflatoxin B1 analyses. In none of the samples,the average, median or 90th percentile concentration of aflatoxin B1 was higher than the EC MaximumLimit (ML) for the respective animal feed or feed material [5]. The 90th percentile aflatoxin B1
concentration in maize and maize products was much higher in 2016 than in the earlier year. In thisyear, 300 samples had a concentration of 6 or higher, of which six samples had a concentrationabove the ML. The maize and maize product samples originated from South and North America andEast Europe.

Toxins 2018, 10, 54 3 of 15Toxins 2018, 10, x FOR PEER REVIEW 3 of 15
Figure 1. Average, median and 90th percentile concentration of aflatoxin B1 in maize and maize products in the period 2007–2016, N = 9160; ML = 20 µg/kg.
Figure 2. Average, median and 90th percentile concentration of aflatoxin B1 in compound feed for dairy cattle in the period 2007–2016, N = 9268; ML = 5 µg/kg.
Figure 1. Average, median and 90th percentile concentration of aflatoxin B1 in maize and maizeproducts in the period 2007–2016, N = 9160; ML = 20 µg/kg.
Toxins 2018, 10, x FOR PEER REVIEW 3 of 15
Figure 1. Average, median and 90th percentile concentration of aflatoxin B1 in maize and maize products in the period 2007–2016, N = 9160; ML = 20 µg/kg.
Figure 2. Average, median and 90th percentile concentration of aflatoxin B1 in compound feed for dairy cattle in the period 2007–2016, N = 9268; ML = 5 µg/kg.
Figure 2. Average, median and 90th percentile concentration of aflatoxin B1 in compound feed fordairy cattle in the period 2007–2016, N = 9268; ML = 5 µg/kg.

Toxins 2018, 10, 54 4 of 15
The average aflatoxin B1 concentration decreased significantly during the study period insorghum, sunflower seed expeller/extracted, coconut/copra expeller/extracted, maize gluten feed,soya hulls, rumen-protected soya extracted, soya bean and manioc. In the remaining animal feeds andfeed materials, no significant increase or decrease of the average aflatoxin B1 concentration duringthe study period was observed.
After evaluation of the four summarizing metrics (Table 2), nearly all animal feeds and feedmaterials were ranked as low priority (III), except for groundnuts which had a high (I) priorityand for both feed materials (especially maize and maize products and several oil seed products)and complete/complementary feed excluding dairy cattle and young animals which were classifiedas medium (II) priority. For groundnuts 265 RASFF notifications were recorded. In addition, highconcentrations of aflatoxin B1 were found in this feed material, with 20% of the samples exceedingthe ML and, therefore, this feed material was classified as high priority. Groundnuts are often used forbird feed. Several oil seed products, including products of sunflower seeds, palmkernel, soya beanand coconuts, were classified medium priority given the relative high number of RASFF notificationsin the period 2007–2016 and the aflatoxin B1 concentration in the Dutch monitoring results (Table 2).Both maize and maize products and other feed materials were classified medium priority due tothe high number of RASFF notifications, particularly for the former group of products (57 RASFFnotifications, see Table 2). Note that the trend in aflatoxin B1 concentration in the remaining group offeed materials, thus excluding the ones mentioned separately in Table 2, over time decreased. RASFFnotifications, causing the medium priority, originate from any EU country. Apparently, aflatoxin B1
contamination of this group of feed materials used in feed production in the Netherlands is undercontrol; the medium priority implies that the contamination of this ingredient should have particularmanagement attention.
Table 2. Summary of evaluation of occurrence of aflatoxin B1 in animal feed and feed materials between2007 and 2016.
Products Intended for Animal Feed ML *(µg/kg)
N(2007–2016)
Average(% of ML *) % > ML * Trend
Average (R2)RASFF
(2007–2016) Priority
Feed materials with the exception of: 0.02 2562 0.8 0.1 neg (0.39) 6 II
—maize and maize products 0.02 9160 7 0.3 0 (0.18) 57 II
—groundnuts 0.02 20 261 20 0 (0.16) 265 I
—sunflower seed-, palmkernel-,soya bean- and coconut products 0.02 1333 1 0.1 0 (0.19) 29 II
Complete and complementary feedwith the exception of: 0.01 14 0 0 0 (0.00) 6 II
—compound feed for cattle(except dairy cattle and calves),sheep (except dairy sheep and lambs),goats (except dairy goats and kids),pigs (except piglets) andpoultry (except young animals)
0.02 794 0.3 0 0 (0.00) 0 III
—compound feed for dairy cattle andcalves, dairy sheep and lambs, dairygoats and kids, piglets and youngpoultry animals
0.005 9406 0.4 0 0 (0.10) 1 III
Other (premix, mineral mix, aminoacid, mono calcium phosphate, water) no ML 46 - - 0 (0.10) 0 III
* Maximum level (ML) as presented in [5].
Complete and complementary feed excluding dairy cattle and young animals also was classifiedas high priority because of RASFF notifications. Five of the six RASFF notifications in this animalfeed related to bird feed. The fifth notification concerned a compound feed not further specifiedin RASFF. In the current dataset of historical monitoring results, only 16 sample results referred togroundnut (or derived products); 11 of these had a reported aflatoxin B1 concentration below the LOQ.The five sample results with an aflatoxin B1 concentration above the LOQ were all from 2008; four ofthese had a concentration (24, 42, 67 and 905 µg/kg) above the ML of 20 µg/kg. Other complete andcomplementary feeds were classified as low priority.

Toxins 2018, 10, 54 5 of 15
2.4. Evaluation of Deoxynivalenol Occurrence
The concentration of deoxynivalenol in animal feeds and feed materials varied between the studyyears, as can be seen from Figures 3–5 (included here as example).
Toxins 2018, 10, x FOR PEER REVIEW 5 of 15
Complete and complementary feed excluding dairy cattle and young animals also was classified as high priority because of RASFF notifications. Five of the six RASFF notifications in this animal feed related to bird feed. The fifth notification concerned a compound feed not further specified in RASFF. In the current dataset of historical monitoring results, only 16 sample results referred to groundnut (or derived products); 11 of these had a reported aflatoxin B1 concentration below the LOQ. The five sample results with an aflatoxin B1 concentration above the LOQ were all from 2008; four of these had a concentration (24, 42, 67 and 905 µg/kg) above the ML of 20 µg/kg. Other complete and complementary feeds were classified as low priority.
2.4. Evaluation of Deoxynivalenol Occurrence
The concentration of deoxynivalenol in animal feeds and feed materials varied between the study years, as can be seen from Figures 3–5 (included here as example).
Figure 3. Average, median and 90th percentile concentration of deoxynivalenol in maize by-products; 2007–2016, N = 401; EC guidance value = 12 mg/kg.
A high deoxynivalenol concentration was present in 2014 in maize by-products (Figure 3) but this concentration dropped to lower levels in 2015. Though averages, medians and 90th percentile values did not exceed the respective EC guidance values [6], individual samples did, as can be seen from Table 3.
Figure 3. Average, median and 90th percentile concentration of deoxynivalenol in maize by-products;2007–2016, N = 401; EC guidance value = 12 mg/kg.
A high deoxynivalenol concentration was present in 2014 in maize by-products (Figure 3) butthis concentration dropped to lower levels in 2015. Though averages, medians and 90th percentilevalues did not exceed the respective EC guidance values [6], individual samples did, as can be seenfrom Table 3.

Toxins 2018, 10, 54 6 of 15Toxins 2018, 10, x FOR PEER REVIEW 6 of 15
Figure 4. Average, median and 90th percentile concentration of deoxynivalenol in complementary and complete feedingstuffs for pigs; 2007–2016, N = 931; EC guidance value = 0.9 mg/kg.
Figure 5. Average, median and 90th percentile concentration of deoxynivalenol in wheat and wheat products; 2007–2016, N = 2790; EC guidance value = 8 mg/kg.
Figure 4. Average, median and 90th percentile concentration of deoxynivalenol in complementary andcomplete feedingstuffs for pigs; 2007–2016, N = 931; EC guidance value = 0.9 mg/kg.
Toxins 2018, 10, x FOR PEER REVIEW 6 of 15
Figure 4. Average, median and 90th percentile concentration of deoxynivalenol in complementary and complete feedingstuffs for pigs; 2007–2016, N = 931; EC guidance value = 0.9 mg/kg.
Figure 5. Average, median and 90th percentile concentration of deoxynivalenol in wheat and wheat products; 2007–2016, N = 2790; EC guidance value = 8 mg/kg. Figure 5. Average, median and 90th percentile concentration of deoxynivalenol in wheat and wheatproducts; 2007–2016, N = 2790; EC guidance value = 8 mg/kg.

Toxins 2018, 10, 54 7 of 15
Table 3. Summary of evaluation of occurrence of deoxynivalenol in animal feed and feed materialsbetween 2007 and 2016.
Products Intendedfor Animal Feed
GV ***(mg/kg)
N(2007–2016)
Average(% of GV ***) % > GV *** Trend
Average (R2)RASFF
(2007–2016) Priority
Feed materials(excl. cereals and cereal products no GV 1982 - - 0 (0.19) 0 III
Cereals and cereal products * withthe exception of maize by-products 8 8357 7.2 0.3 0 (0.02) 0 III
Maize by-products 12 406 34 3.2 0 (0.13) 0 I
Complete and complementaryfeed with the exception of: 5 154 5.2 0 0 (0.12) 0 III
subset: poultry feed 5 102 2.7 0 0 (0.19) 0 III
—complementary and completefeedingstuffs for pigs 0.9 931 23 1.6 0 (0.26) 0 II
—complementary and completefeedingstuffs for calves(<4 months), lambs and kids **
2 0 0 0 n/a 0 n/a
Other (premix, mineral mix,amino acid, animal fat) no GV 4 - - 0 (0.00) 0 III
* The term ‘Cereals and cereal products’ includes not only the feed materials listed under heading 1 ‘Cereal grains,their products and by-products’ of the non-exclusive list of main feed materials referred to in part B of the Annex toCouncil Directive 96/25/EC of 29 April 1996 on the circulation and use of feed materials (OJ L 125, 23.5.1996, p. 35)but also other feed materials derived from cereals in particular cereal forages and roughages. ** Only 1 sample offeed for calves in the dataset (with deoxynivalenol level < LOQ). It could not be determined whether the calveswere <4 months. *** Guidance value (GV) as presented in [6].
After evaluation of the four metrics (Table 3), maize by-products were classified as high (I) priority.The average deoxynivalenol concentration was 34% of the EC guidance value (of 12 mg/kg) and in 3.2%of the more than 400 samples the deoxynivalenol concentration exceeded this guidance value. In noneof the feed and feed materials (including maize by-products, Figure 3, Table 3), the deoxynivalenolconcentration increased or decreased significantly during the period 2007 to 2016. Complementaryand complete feedingstuffs for pigs (Figure 4, Table 3) were classified as medium (II) priority becauseone metric was above its threshold, i.e., the average deoxynivalenol concentration was 23% of the ECguidance value (0.9 mg/kg). The other products were ranked as low priority (III).
2.5. Risk Model
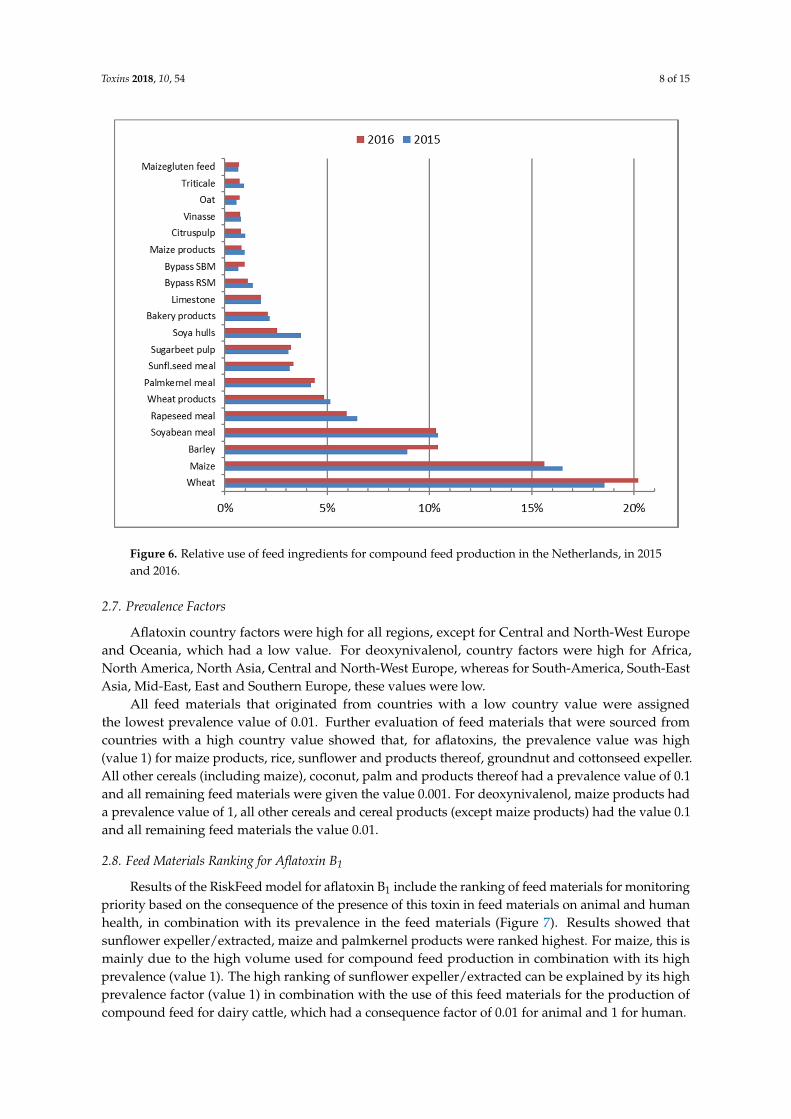
The total volume of feeds used in the Netherlands in 2016 was 16.5 Mt, which was about the sameas in 2015. However, slight differences in volumes of some individual feed materials were observed(Figure 6): in 2016, less corn was used and more wheat and barley, as compared to 2015.
2.6. Consequence Factors
Values of the consequence factor for aflatoxin B1 on animal health were 0.01 for all 14 animalspecies. For human health, the values were 1 for dairy cows and for sheep and goats (for consumptionof milk) and 0.001 for the remaining 11 animal species. The value of 0.001 was used because there is noML established for food products derived from these latter animal groups.
For deoxynivalenol, consequence factors for animal health were 1 for all four pig species (piglets,growing pigs, gilts and sows) and 0.1 for the remaining 10 animal species. Deoxynivalenol consequencefor human health factors were 0.001 for all animal species. Because there are no MLs established fordeoxynivalenol in products from animal origin they were presumed not to be a problem and hencegiven this lowest value.
Toxins 2018, 10, 54 8 of 15
Toxins 2018, 10, x FOR PEER REVIEW 8 of 15
Figure 6. Relative use of feed ingredients for compound feed production in the Netherlands, in 2015 and 2016.
2.7. Prevalence Factors
Aflatoxin country factors were high for all regions, except for Central and North-West Europe and Oceania, which had a low value. For deoxynivalenol, country factors were high for Africa, North America, North Asia, Central and North-West Europe, whereas for South-America, South-East Asia, Mid-East, East and Southern Europe, these values were low.
All feed materials that originated from countries with a low country value were assigned the lowest prevalence value of 0.01. Further evaluation of feed materials that were sourced from countries with a high country value showed that, for aflatoxins, the prevalence value was high (value 1) for maize products, rice, sunflower and products thereof, groundnut and cottonseed expeller. All other cereals (including maize), coconut, palm and products thereof had a prevalence value of 0.1 and all remaining feed materials were given the value 0.001. For deoxynivalenol, maize products had a prevalence value of 1, all other cereals and cereal products (except maize products) had the value 0.1 and all remaining feed materials the value 0.01.
2.8. Feed Materials Ranking for Aflatoxin B1
Results of the RiskFeed model for aflatoxin B1 include the ranking of feed materials for monitoring priority based on the consequence of the presence of this toxin in feed materials on animal and human health, in combination with its prevalence in the feed materials (Figure 7). Results showed that sunflower expeller/extracted, maize and palmkernel products were ranked highest. For maize, this is mainly due to the high volume used for compound feed production in combination with its high prevalence (value 1). The high ranking of sunflower expeller/extracted can be explained by its high prevalence factor (value 1) in combination with the use of this feed materials for the production of compound feed for dairy cattle, which had a consequence factor of 0.01 for animal and 1 for human.
Figure 6. Relative use of feed ingredients for compound feed production in the Netherlands, in 2015and 2016.
2.7. Prevalence Factors
Aflatoxin country factors were high for all regions, except for Central and North-West Europeand Oceania, which had a low value. For deoxynivalenol, country factors were high for Africa,North America, North Asia, Central and North-West Europe, whereas for South-America, South-EastAsia, Mid-East, East and Southern Europe, these values were low.
All feed materials that originated from countries with a low country value were assignedthe lowest prevalence value of 0.01. Further evaluation of feed materials that were sourced fromcountries with a high country value showed that, for aflatoxins, the prevalence value was high(value 1) for maize products, rice, sunflower and products thereof, groundnut and cottonseed expeller.All other cereals (including maize), coconut, palm and products thereof had a prevalence value of 0.1and all remaining feed materials were given the value 0.001. For deoxynivalenol, maize products hada prevalence value of 1, all other cereals and cereal products (except maize products) had the value 0.1and all remaining feed materials the value 0.01.
2.8. Feed Materials Ranking for Aflatoxin B1
Results of the RiskFeed model for aflatoxin B1 include the ranking of feed materials for monitoringpriority based on the consequence of the presence of this toxin in feed materials on animal and humanhealth, in combination with its prevalence in the feed materials (Figure 7). Results showed thatsunflower expeller/extracted, maize and palmkernel products were ranked highest. For maize, this ismainly due to the high volume used for compound feed production in combination with its highprevalence (value 1). The high ranking of sunflower expeller/extracted can be explained by its highprevalence factor (value 1) in combination with the use of this feed materials for the production ofcompound feed for dairy cattle, which had a consequence factor of 0.01 for animal and 1 for human.

Toxins 2018, 10, 54 9 of 15
Toxins 2018, 10, x FOR PEER REVIEW 9 of 15
(a)
(b)
Figure 7. Results (top 10) for ranking feed materials for aflatoxin B1 (a) and deoxynivalenol (b), based on the RiskFeed model using feed material data for 2016.
2.9. Feed Materials Ranking for Deoxynivalenol
The priority ranking of feed materials for deoxynivalenol, as based on the RiskFeed model (Figure 7), showed that the top 10 ingredients with the highest ranking all were cereal grains or related products. This is mainly due to the prevalence factors of these ingredients together with their high volumes used in animal feed production. Maize (including corn cob mix), barley and wheat (products) were ranked highest, which is due to the high prevalence factor value for maize products (value of 1) and the medium prevalence factor value for the other cereals and derived products combined with the high consumption of these feed materials by pigs which are sensitive to this mycotoxin (high animal health consequence value). For instance, the medium prevalence value for wheat was 0.1, as based on evaluation of the occurrence in the period 2012–2016 (presented in Figure 5). All remaining feed materials were not considered a problem in this period and had a prevalence value for deoxynivalenol of 0.01.
In this study, national monitoring data and RASFF notifications were used to observe the occurrence of aflatoxin B1 and deoxynivalenol in both feed materials and animal feeds. The monitoring data included the combined results from mycotoxin analyses done by both the government and feed companies. From the three steps of sample collection, sample preparation and sample analyses for mycotoxins, in particular for aflatoxins (which are heterogeneously distributed) variability in the sample collection step is contributing most to the total variability, followed by the sample analyses step [6]. For both sample collection and sample analyses, approved guidelines have been followed and accredited analytical methods used, by both the government and industry. However, there are slight differences between the procedures followed by government and industry. Also, some samples were collected on a risk-based approach. These factors may have introduced some bias in the data used.
Figure 7. Results (top 10) for ranking feed materials for aflatoxin B1 (a) and deoxynivalenol (b), basedon the RiskFeed model using feed material data for 2016.
2.9. Feed Materials Ranking for Deoxynivalenol
The priority ranking of feed materials for deoxynivalenol, as based on the RiskFeed model(Figure 7), showed that the top 10 ingredients with the highest ranking all were cereal grains or relatedproducts. This is mainly due to the prevalence factors of these ingredients together with their highvolumes used in animal feed production. Maize (including corn cob mix), barley and wheat (products)were ranked highest, which is due to the high prevalence factor value for maize products (value of 1)and the medium prevalence factor value for the other cereals and derived products combined withthe high consumption of these feed materials by pigs which are sensitive to this mycotoxin (high animalhealth consequence value). For instance, the medium prevalence value for wheat was 0.1, as basedon evaluation of the occurrence in the period 2012–2016 (presented in Figure 5). All remaining feedmaterials were not considered a problem in this period and had a prevalence value for deoxynivalenolof 0.01.
In this study, national monitoring data and RASFF notifications were used to observethe occurrence of aflatoxin B1 and deoxynivalenol in both feed materials and animal feeds.The monitoring data included the combined results from mycotoxin analyses done by boththe government and feed companies. From the three steps of sample collection, sample preparation andsample analyses for mycotoxins, in particular for aflatoxins (which are heterogeneously distributed)variability in the sample collection step is contributing most to the total variability, followed bythe sample analyses step [6]. For both sample collection and sample analyses, approved guidelineshave been followed and accredited analytical methods used, by both the government and industry.However, there are slight differences between the procedures followed by government and industry.

Toxins 2018, 10, 54 10 of 15
Also, some samples were collected on a risk-based approach. These factors may have introduced somebias in the data used.
Based on evaluating the results, a prioritization for monitoring was made. This does notnecessarily mean these feed products are of a concern, rather they could be a concern and thereforeshould have inspection attention. Secondly feed ingredients were further prioritized not onlyconsidering mycotoxin occurrence but also risk for animal and human health by their use in animalfeed production. Results of both descriptive analyses for feed materials and the RiskFeed model werequite comparable but some differences in the prioritization of ingredients were seen. These differencescan be explained, amongst others, by the extent to which they are used in feed production for specificanimal species, their volumes and countries of origin. For instance, groundnuts were ranked highpriority, based on the descriptive analyses. However, the RiskFeed model did not result into a top-10ranking of this feed material. The reason is that ground nuts are mainly used for bird feed and thistype of feed has no effect on human health (was not considered in the RiskFeed model).
Results of this study, both from the descriptive data analyses and the RiskFeed model, werepresented and discussed with the National Food and Consumer Product Authority (NVWA) inthe Netherlands, in November 2017. These results were considered an important source of informationfor setting up the annual risk based control program for mycotoxins in feed and feed materials for 2018.The next step is to determine the number of samples that should be collected from each ingredient.This step is not part of the RiskFeed model but is currently done by the competent authority and feedcompanies themselves. Future research could focus on adding sample size calculations as a next stepto the RiskModel.
The model has been made flexible and user-friendly so that input data can be updated or changedeasily. This is considered useful for scenario (what-if) analyses, annual updating and/or usingdedicated datasets.
3. Conclusions
Results of this study relate to prioritizing animal feeds and feed materials for deoxynivalenoland aflatoxin B1 monitoring on the basis of (1) the occurrence of the two toxins in thesefeed products using descriptive statistical analyses of historical monitoring results and RASFFnotifications; and (2) estimating consequences for animal and human health due to the presenceof mycotoxins in feed materials used for feed production. Based on evaluation of occurrencedata and RASFF notifications, groundnuts had a high priority for aflatoxin B1 monitoring.Other feed materials, particularly maize and maize products and several oil seed products andcomplete/complementary feed excluding dairy cattle and young animals were considered mediumpriority for aflatoxin B1 monitoring. When also considering health consequences, feed materials thatwere of highest priority included sunflower seed expeller/extracts, palmkernel expeller/extractsand maize. For monitoring deoxynivalenol, maize by-products were considered high priority andcomplete and complementary feed for pigs were of medium priority, using the occurrence and RASFFdata. Also considering health effects showed that feed materials of highest concern were maizeproducts, small grain cereals and products thereof. These results have shown to be useful as oneof the information source for underpinning the risk based control plan for mycotoxins in feed inthe Netherlands.
4. Material and Methods
Statistical (descriptive) analyses of historical monitoring results was performed to obtain insightsinto the occurrence of aflatoxin B1 and deoxynivalenol in feed and feed materials. Based on the results,the feed (materials) are classified as low, medium or high priority for monitoring. In order to obtaininsights into monitoring priority of the feed materials also considering consequences of the presenceof the toxin in feed and feed materials on animal and human health, a risk model (named RiskFeed

Toxins 2018, 10, 54 11 of 15
model) was used. This model integrates occurrence data with other data sources to provide a rankingof feed materials as output. Data used, descriptive data analyses and risk modelling are outlined below.
4.1. Monitoring and Other Data
For both the descriptive data analyses and the risk modelling, government data as well asdata from feed industries and open data were used. Government data included the results ofthe multi-annual monitoring program from the period 2007–2016. These data referred to the sampleresults from the official control of the two mycotoxins feed and feed materials. The methods forcollection of samples, the preparation of samples and sample analyses followed the requirementsthat were prescribed by the European Commission, as laid down in Commission Regulation (EC)No 152/2009 [7] and the general requirement laid down in Regulation (EC) No 882/2004 [1] andRegulation (EU) 2017/625 [8]. In practice LC-MS/MS, accredit method was used for sample analyses.Through a cooperation with SecureFeed—a Dutch organization in which approximately 400 companiesthat supply animal feed (feed materials, compound feed, forage and roughage, moist feed materials,mineral feed etc.) directly to livestock farmers in the Netherlands participate to invest in the assuranceof safe feed—the provision of private data for the aims of the current study was ensured. Data providedincluded the results from monitoring mycotoxins in feed and feed materials by private companies(SecureFeed members) in the period 2007–2016. Sample collection through the SecureFeed programfollowed the GMP+ procedures, as laid down in GMP BA 13 “Minimal requirements for sampling”.Samples were analysed in SecureFeed approved laboratories, using accredited methods (by the DutchAccreditation Council, see www.rva.nl). In practice, HPLC with fluorescence or LS-MS/MS were used.Furthermore, data from the Rapid Alert System for Feed and Food (RASFF) related to the occurrenceof mycotoxins in feed and feed materials in the same period were extracted from the RASFF portal(https://webgate.ec.europa.eu/rasff-window/portal).
4.2. Descriptive Analyses
4.2.1. Statistical Data Analysis
Product names were harmonized to enable combining data from the different sources into onedataset. The products were grouped according to the groups used for defining the EC maximum limit(ML) for aflatoxin B1 in animal feed and feed materials [2] according to Directive 2002/32/EC [5](last amended by Regulation (EU) 2015/186) or the EC guidance values for deoxynivalenol in animalfeed and feed materials according to Recommendation 2006/576/EC (EC, 2006) [9]. This enabledgrouping products with the same ML or guidance value. Where applicable, subgroups were used tohighlight specific feed and feed materials that differed from the rest of the group.
Because the data originated from multiple years and suppliers the limits of quantification(LOQ) of the analytical method used varied. However, in general the LOQs for aflatoxin B1 anddeoxynivalenol were 1 µg/kg and 0.1 mg/kg, respectively. Values reported as to be below the LOQwere replaced by zero for the statistical analysis. Apparent outliers, i.e., samples with an exceptionallyhigh concentration, were examined individually; they were excluded from the dataset when theyappeared to be the result of targeted (i.e., follow up) sampling [10].
For aflatoxin B1 and deoxynivalenol, four different statistical metrics were calculated usingdescriptive analysis of the monitoring results. These included: the average (avg), median (P50),90th (P90) percentile and the percentage of samples exceeding the ML (% > ML), per feed or feedmaterial group or sub-group. The Pearson Correlation Coefficient (MS Excel®) was used to evaluatethe significance of potential trends in the presence of the mycotoxin in the feed product over the timeperiod considered. This was done for each of the average, median and 90th percentile of the presenceof the mycotoxin. Trends with R2 values exceeding 0.30 were considered significant. In some trendanalyses, 20 observations per year were considered minimum [11] but in the current analysis every

Toxins 2018, 10, 54 12 of 15
amount of measurements per year is taken into account. However, sometimes the number of sampleswas too low to consider any trend to be significant.
Results of the statistical analyses and the RASFF notifications were studied in detail,per combination of mycotoxin—feed/feed material product group or sub-group, for each of the fourcriteria. Results were evaluated and summarized in separate tables per mycotoxin, with coloursindicating the level of priority the feed or feed material should have in the national monitoringplan, based on the presence of the toxin in that feed material. The priority was considered high (I)when 10% or more of the samples exceeded the ML. The priority was also considered high (I) whentwo or more of the following criteria were fulfilled: average concentration higher than 20% of the ML(or recommendation in case of deoxynivalenol), more than 3% of the samples exceeding the ML,a significant increase of the average concentration between 2012 and 2016, and/or more than fiveRASFF notifications. The priority was considered medium (II) when only one of the criteria wasfulfilled. With low priority (III) none of the criteria were fulfilled.
4.2.2. RiskFeed Model
The RiskFeed model aims to rank, per mycotoxin, the various feed materials used for compoundfeed production, based on the potential consequence of the mycotoxin on animal and/or humanhealth due to the presence of the particular mycotoxin in the ingredient considered, combinedwith the occurrence of the toxin in that feed material. The basic model is detailed in Van derFels-Klerx et al. [3]; a summary is given below together with some recent model additions.
The RiskFeed model estimates the potential consequence of the presence of the mycotoxin incompound feed on animal and human health. To this end, the presence of the mycotoxin in compoundfeed for 14 different animal species is calculated, based on the presence of the toxin in the feed materialsused in the specific compound feed and inclusion rates of feed materials in each of the compoundfeeds. Volumes of feed materials used, countries of origins and prevalence of the mycotoxin inthe ingredient in the country of origin is accounted for. The 14 animal species considered include:piglets, growing-finishing pigs, rearing gilts, sows, broiler chickens, laying hens, broiler breeders,dairy cows, dairy calves-heifers, veal calves, veal cattle, sheep, goats and horses.
As input the RiskFeed model uses: yearly volumes of all feed materials used for the productionof compound feeds (a); per country of origin (b); used portions of feed materials for compoundfeed production per animal type (c); presence of the toxin in each feed material (prevalence factor d);and the consequence of the presence of the mycotoxin in the compound feed on animal and humanhealth (consequence factor e). The volume of each compound feed material (in kton) is considereda continuous variable from which the 10log value is taken. The other model factors (b–d) can havevalues between 0–1. Factors b and c can be assigned any value between 0–1, whereas factors d and e canbe assigned one of four values of 0.001, 0.01, 0.1 and 1. The model then multiplies all factors with eachother to arrive at the overall risk value per feed material; this risk value can be used to rank the feedmaterials for priority in the multi-annual control program. In contrast to the descriptive data analyses,the RiskFeed model only ranks feed materials (not animal feeds). Relative to the model presentedin Van der Fels-Klerx et al. [3] the procedure to estimate the prevalence factor and the consequencefactor for the two mycotoxins aflatoxin B1 and deoxynivalenol was modified. The modifications arepresented below.
4.3. Prevalence Factor
As the fungi that produce aflatoxin B1 and deoxynivalenol do not occur in all countries,the likelihood for the presence of aflatoxin B1 and deoxynivalenol in feed materials was first assessedper country/region and second per feed material, using data and information from the last five years.The region likelihood for each of aflatoxin B1 and deoxynivalenol was assessed using literaturedata [12,13], legislation specifying countries for monitoring on aflatoxins, including Regulations (EC)

Toxins 2018, 10, 54 13 of 15
No. 669/2009 [14] and (EC) No. 884/2014 [15] and expert opinion. Regions could be assessed as lowor high likelihood for each of aflatoxin B1 and deoxynivalenol.
All ingredients sourced from countries with a low likelihood for the toxin were assigneda 0.01 value for the prevalence factor. Ingredients from countries that had a high likelihood forthe occurrence of the toxin, were examined in more detail to arrive at the prevalence factor value.For those ingredients, prevalence factors values were based on total scores for five different criteria ofwhich four were based on monitoring data, analogous to Adamse et al. (2017) and one was basedon literature and expert information. A subset of the monitoring data of descriptive analyses wasused related to the years 2012–2016, as well as RASFF data from the same years. Feed materials wereassigned a score 1 for each of the following four criteria: (1) more than 3% of the samples exceededthe ML; (2) the average concentration was more than 20% of the ML; (3) a positive trend (R2 ≥ 0.3)and; (4) more than four RASFF notifications. For the 5th criteria, literature and experts were consulted.If these information sources indicated that there was evidence of high concentrations of mycotoxinsin the ingredient, a score of 2 was assigned, if there were no indications of mycotoxin presence inthe ingredient, a score of 0 was obtained and a score of 1 was obtained if there were some indicationsthat mycotoxins can be present in the ingredient. All scores were added: each ingredient could obtaina maximum of 6 points and a minimum of 0 points for the presence of the toxin. In case the total scorewas 3 or higher, the prevalence factor of the ingredient was assigned the value 1; in case the total scorewas 1 or 2, the prevalence factor was assigned the value 0.1; in case the total was zero, the prevalencefactor was assigned the value 0.01.
4.3.1. Consequence Factor
The consequence factor (d) is distinguished into a factor for animal and for human health.The consequence for human health incorporates the presence of the mycotoxin in animal derivedfood products (e.g., milk, eggs) and the potential health concern for humans after consumption ofthe particular animal derived food product. The consequence factor for animal health indicatesthe health concern of the mycotoxin for the particular animal type. Differences between animal typesare allowed for. For example, pigs are more sensitive to deoxynivalenol as compared to dairy cows,so the consequence factor for animal health will be higher for pigs than for dairy cows. The consequencefactor for aflatoxin B1 on human health, on the other hand, will be higher for dairy cows as comparedto pigs, since aflatoxin B1 is transferred to dairy cows’ milk and is toxic to human health uponconsumption of this milk.
Within the original RiskFeed model [3], the values of the consequence factors were based on expertjudgment, considering available data and scientific literature on residue transfer and accumulationand toxic effects of the contaminant on animal and human. To make the estimation of the consequencefactor more transparent and objective, rather than using expert judgement only, a data driven methodwas established. To this end, the impact of each contaminant on animal or human health is estimatedbased on the ratio between exposure via feed/food intake and the dose levels that induces adversehealth effects in animals or humans. Based on this ratio, the consequence factor is assigned a value0.01, 0.1 or 1. The consequence factor is (only) assigned the value 0.001 in case a ML or guidancelimit is not established for the particular mycotoxin. Comparable to general toxicological safetyevaluations, exposure from food or feed that are close to the dose levels that induce adverse healtheffects (i.e., low ratio between adverse effect levels and exposure levels) were considered of highconcern. In that case, the consequence factor was assigned the value 1. In a similar way, a median(consequence factor of 0.1) and low (consequence factor of 0.01) concern for health risk were defined.Both the derivation of information on the general exposure levels of animal and human to each ofaflatoxin B1 and deoxynivalenol and the safe dose levels were based on evaluations performed byEFSA [16–18] and JECFA [19]. These include the reported no observed adverse effect levels (NOAELs)for animal health and the TDI (tolerable daily intake) or VSD (virtual safe dose) for human health.

Toxins 2018, 10, 54 14 of 15
Some assumption had to make to fill in data gaps. For example, the dose levels that are linkedto adverse health effects are not always available for all animal species considered and—in thatcase —were based on related species (e.g., extrapolation of cattle data to goats or sheep) or set atthe lowest available level within the range of species. For animal exposure, EFSA reported medianconcentrations in feed were considered, when available, which were then compared with the doselevels that induce adverse health effects in the animals (expressed a ng/kg feed). A ratio between TDIand exposure higher than 75 was considered to be of low concern (consequence factor 0.01); 25–75 ofmedian concern (consequence factor 0.1); and <25 of high concern (consequence factor 1). For humans,EFSA reported median concentrations in animal derived products (i.e., milk, eggs, or meat) wereconsidered. These were in turn converted to a human exposure estimate (mg/kg bw/day), based on(i) a worst-case estimation of the consumption of these products (derived from the EFSA consumptiondatabase) and (ii) a bodyweight of 70 kg. An estimated human intake that is close to the TDI or VSD(i.e., within 2-fold) was considered to be of high concern (consequence factor 1), a ratio between 2 and5 of median concern (consequence factor 0.1) and a ratio higher than 5 of low concern (consequencefactor 0.01).
4.3.2. Ingredient Data
Data on the volumes of ingredients used in the year 2016 were obtained from SecureFeed.These data concern all feed materials used for compound feed production (over 95% of nationalproduction) in the Netherlands. Eurostat data of the year 2016 were used to obtain the information(ratios) on countries of origins for each of the feed materials. Portions of ingredients used inthe production of compound feeds for the various animal types were obtained using the linearoptimization module for compound feed production [3], using market prices of feed ingredients in2016. Based on the excel version of the RiskFeed model, developed earlier, a user-friendly PC-basedapplication of the model was constructed in the course of this study.
4.3.3. Calculations
All input data were entered into the online model. Model output include the rankings ofthe feed ingredients with the highest expected consequences for animal health, human health and theircombination for each of aflatoxin B1 and deoxynivalenol.
Acknowledgments: This study was financed by the Ministry of Economic Affairs, through the project No.WOT-02-004-012. Data provision by SecureFeed is highly appreciated. The authors thank Jacob de Jong (RIKILTWageningen Research) and Paul Bikker (Wageningen Livestock Research) for their contribution to an earlierversion of the model and for the latest information on compound feed composition.
Author Contributions: P.A. processed the monitoring data and performed the trend analyses; P.A., A.P. andE.D.v.A. calculated input values for the RiskFeed model; I.F., E.D.v.A., and P.A. developed the latest version ofthe RiskFeed model; P.A. run the model; all authors discussed results; I.F. wrote the main parts of the paper;authors provided input to the paper and checked the latest version.
Conflicts of Interest: The authors declare to have no conflict of interest.
References
1. European Commission (EC). Regulation (EC) No 882/2004 on official controls performed to ensurethe verification of compliance with feed and food law, animal health and animal welfare rules. Off. J. 2004,L165, 1–141.
2. Adamse, P.; Van der Fels-Klerx, H.J.; De Jong, J. Cadmium, lead, mercury and arsenic in animal feed andfeed materials—Trend analysis of monitoring results. Food Addit. Contam. A 2017, 34, 1298–1311. [CrossRef][PubMed]
3. Van der Fels-Klerx, H.J.; Adamse, P.; De Jong, J.; Hoogenboom, R.; De Nijs, M.; Bikker, P. A model forrisk-based monitoring of contaminants in feed ingredients. Food Control 2017, 72, 211–218. [CrossRef]

Toxins 2018, 10, 54 15 of 15
4. De Rijk, T.C.; Van Egmond, H.P.; Van der Fels-Klerx, H.J.; Herbes, R.; De Nijs, M.; Samson, R.A.; Slate, A.B.;Van der Spiegel, M. A study of the 2013 Western European issue of aflatoxin contamination of maize fromthe Balkan area. World Mycotoxin J. 2015, 8, 641–651. [CrossRef]
5. European Commission (EC). Directive 2002/32/EC of the European Parliament and of the Council of7 May 2002 on undesirable substances in animal feed. Off. J. 2002, L140, 10–22.
6. Ozay, G.; Seyhan, F.; Yilmaz, A.; Whitaker, T.B.; Slate, A.B. Sampling hazelnuts for aflatoxin: Uncertaintyassociated with sampling, sample preparation, and analysis. J. AOAC Int. 2006, 89, 1004–1011. [PubMed]
7. European Commission. Commission Regulation (EC) No 152/2009 of 27 January 2009 laying downthe methods of sampling and analysis for the official control of feed. Off. J. 2009, L54, 1–128.
8. European Commission (EC). Regulation (EU) 2017/625 of the European Parliament and of the Councilof 15 March 2017 on official controls and other official activities performed to ensure the applicationof food and feed law, rules on animal health and welfare, plant health and plant protection products,amending Regulations (EC) No 999/2001, (EC) No 396/2005, (EC) No 1069/2009, (EC) No 1107/2009,(EU) No 1151/2012, (EU) No 652/2014, (EU) 2016/429 and (EU) 2016/2031 of the European Parliamentand of the Council, Council Regulations (EC) No 1/2005 and (EC) No 1099/2009 and Council Directives98/58/EC, 1999/74/EC, 2007/43/EC, 2008/119/EC and 2008/120/EC, and repealing Regulations (EC)No 854/2004 and (EC) No 882/2004 of the European Parliament and of the Council, Council Directives89/608/EEC, 89/662/EEC, 90/425/EEC, 91/496/EEC, 96/23/EC, 96/93/EC and 97/78/EC and CouncilDecision 92/438/EEC (Official Controls Regulation). Off. J. 2017, L95, 1–142.
9. European Commission (EC). Commission Recommendation 2006/576/EC of 17 August 2006 on the presenceof deoxynivalenol, zearalenone, ochratoxin A, T-2 and HT-2 and fumonisins in products intended for animalfeeding. Off. J. 2006, L229, 7–9.
10. Adamse, P. Trendanalyse van Historische Gegevens. Handleiding Voor Het Gebruik van Monitoringsgegevens;RIKILT Wageningen Research: Wageningen, The Netherlands, 2014. (In Dutch)
11. Van Der Fels-Klerx, H.J.; Klemsdal, S.; Hietaniemi, V.; Lindblad, M.; Ioannou-Kakouri, E.; Van Asselt, E.D.Mycotoxin contamination of cereal grain commodities in relation to climate in North West Europe. Food Addit.Contam. A 2012, 29, 1581–1592. [CrossRef] [PubMed]
12. Schatzmayr, G.; Streit, E. Global occurrence of mycotoxin in the food and feed chain: facts and figures.World Mycotoxin J. 2013, 6, 213–222. [CrossRef]
13. Pinotti, L.; Ottoboni, M.; Giromini, C.; Deel’Orto, V.; Cheli, F. Mycotoxin contamination in the EU feedsupply chain: a focus on cereal byproducts. Toxins 2016, 8, 45. [CrossRef] [PubMed]
14. European Commission (EC). Commission Regulation (EC) No 669/2009 of 24 July 2009 implementingRegulation (EC) No 882/2004 of the European Parliament and of the Council as regards the increasedlevel of official controls on imports of certain feed and food of non-animal origin and amending Decision2006/504/EC. Off. J. 2009, L194, 11–33.
15. European Commission (EC). Regulation (EC) No 884/2014 of the European Parliament and of the Council of29 April 2004 on official controls performed to ensure the verification of compliance with feed and food law,animal health and animal welfare rules. Off. J. 2014, L191, 1–64.
16. European Food Safety Authority (EFSA). Opinion of the Scientific Panel on Contaminants in the Food Chainon a request from the Commission related to Aflatoxin B1 as undesirable substance in animal feed. EFSA J.2014, 39, 1–27.
17. European Food Safety Authority (EFSA). Opinion of the Scientific Panel on Contaminants in the FoodChain [CONTAM] related to Deoxynivalenol (DON) as undesirable substance in animal feed. EFSA J. 2014,73, 1–42.
18. European Food Safety Authority (EFSA). Deoxynivalenol in food and feed: occurrence and exposure. EFSA J.2013, 11, 3379.
19. Joint FAO/WHO Expert Committee on Food Additives (JECFA). Evaluation of certain mycotoxins in foo.Fifty-sixth report of the Joint FAO/WHO Expert Committee on Food Additives. WHO Tech. Rep. Ser. 2002,906, 1–62.
© 2018 by the authors. Licensee MDPI, Basel, Switzerland. This article is an open accessarticle distributed under the terms and conditions of the Creative Commons Attribution(CC BY) license (http://creativecommons.org/licenses/by/4.0/).