monitoring of native fish communities in
TRANSCRIPT
Monitoring of Native Fish Communities in the Broken Creek and Broken River
2008
Arthur Rylah Institute for Environmental Research


Arthur Rylah Institute for Environmental Research
Monitoring of Native Fish Communities in the Broken Creek and Broken River
Justin O’Connor and Frank Amtstaetter
Arthur Rylah Institute for Environmental Research 123 Brown Street, Heidelberg, Victoria 3084
July 2008
Arthur Rylah Institute for Environmental Research Department of Sustainability and Environment
Heidelberg, Victoria

ii
Report produced by: Arthur Rylah Institute for Environmental Research
Department of Sustainability and Environment
PO Box 137
Heidelberg, Victoria 3084
Phone (03) 9450 8600
Website: www.dse.vic.gov.au/ari
© State of Victoria, Department of Sustainability and Environment 2008
This publication is copyright. Apart from fair dealing for the purposes of private study, research, criticism or review as
permitted under the Copyright Act 1968, no part may be reproduced, copied, transmitted in any form or by any means
(electronic, mechanical or graphic) without the prior written permission of the State of Victoria, Department of
Sustainability and Environment. All requests and enquires should be directed to the Customer Service Centre, 136 186
or email [email protected]
Citation: O’Connor, J. and Amtstaetter, F. (2008) Monitoring Native Fish Communities in the Broken Creek and
Broken River. Client Report fot the Goulburn Broken CMA. Arthur Rylah Institute for Environmental Research.
Department of Sustainability and Environment, Heidelberg, Victoria
ISBN ISBN 978-1-74208-703-0 (print)
Disclaimer: This publication may be of assistance to you but the State of Victoria and its employees do not guarantee
that the publication is without flaw of any kind or is wholly appropriate for your particular purposes and therefore
disclaims all liability for any error, loss or other consequence which may arise from you relying on any information in
this publication.
Front cover photo: (clockwise from top left), Numurkah Weirpool, Broken River upstream of Gowangardie Weir,
Broken River Murray cod sampled from upstream of Caseys Weir, Broken Creek upstream of Nathalia Town Weir.
Photos: Justin O’Connor.
Authorised by: Victorian Government, Melbourne

iii
Contents
List of tables and figures................................................................................................................. iv
Summary............................................................................................................................................1
1 Introduction.............................................................................................................................4
2 Methods....................................................................................................................................5
2.1 Study site...................................................................................................................................5
2.1.1 Broken Creek.............................................................................................................6
2.1.2 Broken River .............................................................................................................7
2.2 Water Quality............................................................................................................................8
2.3 Electrofishing............................................................................................................................8
2.3.1 Broken Creek.............................................................................................................9
2.3.2 Broken River .............................................................................................................9
2.4 Data analysis ...........................................................................................................................10
2.4.1 Broken Creek...........................................................................................................10
2.4.2 Broken River ...........................................................................................................10
3 Results ....................................................................................................................................10
3.1 Broken Creek ..........................................................................................................................10
3.1.1 Water Quality ..........................................................................................................10
3.1.2 Habitat .....................................................................................................................10
3.1.3 Electrofishing surveys .............................................................................................11
3.2 Broken River...........................................................................................................................13
3.2.1 Water Quality ..........................................................................................................13
3.2.2 Electrofishing surveys .............................................................................................13
3.2.3 Catch Per Unit Effort...............................................................................................14
4 Discussion ..............................................................................................................................18
4.1 Broken Creek ..........................................................................................................................18
4.2 Broken River...........................................................................................................................19
5 Recommendations.................................................................................................................21
References ........................................................................................................................................22
Appendix 1 .......................................................................................................................................24
Water quality from Broken Creek and Broken River .............................................................24

iv
List of tables and figures
List of tables
Table 1: Site locations on the Broken Creek ...................................................................................... 7
Table 2: Site locations on the Broken River....................................................................................... 8
Table 3: Number of native and introduced fish sampled, by species and site, from the Broken
Creek in May 2008 using boat and backpack mounted electrofishing units.......................... 11
Table 4: Total abundance of species collected by bank mounted (BM EF) and boat mounted
electrofishing (BOAT EF) at survey sites on the Broken River. Abundances include counts
of species observed but not collected..................................................................................... 14
List of figures
Figure 1. Map of the Broken River system in north-eastern Victoria indicating study sites on the
Broken Creek (BC) and Broken River (BR). ........................................................................... 6
Figure 4: Comparison of percent native and percent native biomass in the Broken Creek between
Nathalia and Numurkah in 2008 and a previous study conducted in the Broken Creek
(O’Connor 2006). Error bars indicate ±1 SE. ....................................................................... 12
Figure 5: Number of large native fish (Murray cod and golden perch > 200 mm) observed in the
Broken Creek between Nathalia and Numurkah in 2008 for three habitat classifications..... 13
Figure 6: Percentage species composition of CPUE of fish sampled using boat electrofishing in the
Broken River fish survey ....................................................................................................... 15
Figure 7: Percentage species composition of CPUE of fish sampled using bank mounted
electrofishing in the Broken River fish survey....................................................................... 17

v
Acknowledgements
Wayne Tennant from the Goulburn Broken CMA reviewed the project plan and report. John
Mahoney (ARI) assisted in field work. Wayne Tennant and Mark Turner (GB CMA) and Wayne
Koster and Tim O’Brien (ARI) provided helpful comments on the final manuscript. This study
was conducted under the following permits:
• DSE Animal Care and Ethics approval permit No. AEC 07/09
• Vic DSE Flora and Fauna Guarantee Act Permit No. 10003509
• Victorian Fisheries Permit Number RP 827

vi
Summary
Connectivity of river habitats, which is recognised as important for maintaining and restoring
native fish populations, is compromised by river regulation. The Murray Darling Basin is the most
regulated river system in Australia and the Broken River system, in north eastern Victoria, is
among the most regulated systems within the Murray Darling Basin. Some of the greatest threats
to native fish populations in the Broken River system result from the presence of weirs which act
as barriers to fish movement.
Knowledge of the status of native and introduced fish communities is important in managing
natural resources. Our understanding of the fish community in the Broken Creek below the
township of Nathalia is continuing to improve, however, a recent study indicated that native fish
diversity and abundance upstream of the township of Nathalia is depressed relative to areas
downstream. The reasons for these differences are not clear, particularly given that both areas
have had fish passage improvement works since 2002. Similar to the Broken Creek, fish passage
on the Broken River has also recently been improved with a vertical slot fishway commissioned at
Casey Weir in November 2005. A study undertaken prior to the opening of this structure indicated
that the weir inhibited fish movement with large congregations of fish accumulating below the
weir at times.
In the Broken Creek a study was undertaken between Nathalia and Numurkah to:
• collect baseline fish data;
• assess upstream fish movement as a continuation of the lower Broken Creek fishway
program; and
• identify areas with the potential for habitat rehabilitation.
While, in the Broken River a study was undertaken upstream of Shepparton to:
• provide information on the distribution, diversity and abundance of fish and;
• establish whether instream barriers continue to restrict fish movement.
In the Broken Creek a total of 342 individual fish representing three native and five introduced
species were collected. Native fish species comprised only 20% of the total catch. There was a
significant difference between the percent of native fish at these sites compared to sites previously
sampled downstream of Nathalia. The condition of habitat varied through the study area.
Generally, depth and width variation, and the amount of in-stream cover decreased from
downstream to upstream sites. Catch per unit effort (CPUE) of large native fish was higher in the
most downstream sites, which had better habitat than upstream sites.
The status of the fish community in the Broken Creek between Nathalia and Numurkah is poor
compared to areas downstream of Nathalia. Given the presence of good habitat in lower sections
of this reach and the low numbers of native fish, it appears that there may be little movement of
fish into the area, possibly due to restricted fish movement below the Nathalia Weir as a result of
low flows (drought); fishways not operating properly (e.g., closed); or fish still colonising

Monitoring Native Fish Communities
2 Arthur Rylah Institute for Environmental Research
downstream of this area and as a result, there has been little population pressure (e.g., high
density) to move upstream.
It would appear from the results of this study that some areas of the Broken Creek between
Nathalia and Numurkah do not contain sufficient habitat to support fish populations. In these
areas habitat rehabilitation may help improve the fish community in the immediate vicinity and
also upstream populations.
In the Broken River a total of 945 fish representing six native and four exotic species were
collected. CPUE was higher at sites immediately downstream of instream barriers than in mid-
reach sections. A comparison of CPUE between 2005 and 2008 indicated that CPUE was higher at
sites sampled in 2008 than those sampled in 2005.
CPUE was greater at sites located immediately below barriers when compared with mid-reach
sites on each river system. CPUE data indicated that the weirs on the Broken River are acting as
partial barriers to fish movement even though fish ladders have been installed. Fish ladders are not
always completely efficient in the transport of fish upstream over a barrier and congregations of
fish can sometimes still be found below these structures.
A comparison of CPUE data from the current study with a study from 2005 indicates that more
fish were sampled in 2008 than in 2005. This includes a greater number of fish captured below
Caseys Weir in 2008 when fish abundance would have been expected to decrease as a result of the
installation of the fish ladder. Reasons for these differences in fish abundance are not clear,
however, seasonal differences in fish distribution may account for these discrepancies.
This survey was the first to monitor sites upstream of Benalla Weir and indicates that the fish
community upstream of this structure appears to be very different to that below it. In order to gain
a better understanding of the status of the fish community in this section of the system future
studies on the Broken River need to include a more comprehensive survey of Benalla Weir and
areas immediately upstream of it.
Recommendations:
Broken Creek
1. Investigate habitat rehabilitation works in the mid reaches of the creek between
Nathalia and Numurkah that have been channelised.
2. Continue monitoring sites for improved fish community particularly in response to
any sustained increased flow events or habitat rehabilitation.
3. Review operation regimes of all fishways to optimise migration during key migration
periods.
4. Review operation of Numurkah and Nathalia fishways.
5. Installation of PIT tag readers at the Numurkah and Nathalia Fishways.

Monitoring Native Fish Communities
Arthur Rylah Institute for Environmental Research 3
Broken River
1. Continued monitoring of Broken River with future monitoring to include a seasonal
component.
2. Comprehensive fish assessment of Benalla Weir using a wide range of sampling types.
3. Installation of PIT tag readers on the Benalla and Caseys weir fishways.
4. Production of an operation and maintenance schedule for the Benalla and Caseys
weirs fishways.

Monitoring Native Fish Communities
4 Arthur Rylah Institute for Environmental Research
1 Introduction
Knowledge of the status of native and introduced fish communities is important in managing
natural resources. This knowledge is required to make decisions about whether management
actions (e.g., habitat rehabilitation or increased fish passage) are required and what needs to be
implemented to provide desired outcomes. The existence of baseline and continued monitoring is
also vital to investigate the effects of management actions.
The fragmentation of rivers by dams and weirs is a global problem (Jungwirth 1998; Lucas and
Baras 2001). Unimpeded passage for fish throughout streams is crucial for spawning migrations,
recolonisation, general movement and habitat selection (Koehn and O’Connor 1990) and as such,
connectivity of river habitats is recognised as important for maintaining and restoring native fish
populations. In Victoria fish movement is protected by legislation through a number of Acts
(Water Act 1999, Fisheries Act 1995, Flora and Fauna Guarantee Act 1988, Conservation, Forests
and Lands 1987) and “…the prevention of passage of aquatic biota as a result of instream
structures…” is identified as a potentially threatening process (Flora and Fauna Guarantee Act
1988).
The Murray Darling Basin is the most regulated river system in Australia. The Broken River
system, in north eastern Victoria, is among the most regulated systems within the Murray Darling
Basin. Although the Broken River system, which includes both the Broken Creek and Broken
River, is a highly modified system, it supports a diverse native fish community. Some of the
native fish species present in this system include the nationally threatened Murray cod
(Maccullochella peelii peelii) and Macquarie perch (Macquaria australasica) while golden perch
(Macquaria ambigua), silver perch (Bidyanus bidyanus) and Murray Darling rainbowfish
(Melanotaenia fluviatilis) are listed as threatened in Victoria.
Some of the greatest threats to native fish populations in the Broken River system include the
presence of barriers to fish movement. In the lower Broken Creek there are seven barriers to fish
movement over a distance of about 60 km between Nathalia and the Murray River. Likewise, in
the Broken River there are a number of barriers to fish movement between Shepparton and Benalla
including Gowangardie, Caseys and Benalla weirs. Given that unimpeded fish passage is essential
for the maintenance of healthy native fish populations, a number of fish passage facilities have
been constructed on the weirs of the Broken River system. These include the construction of
vertical slot fishways on the seven weirs in the lower Broken Creek, while Casey’s and Benalla
weirs have also had fish ladders installed.
Recent studies investigating the success of the lower Broken Creek fishways have indicated that
these fish passage facilities are allowing fish to move upstream. Assessment of fish populations in
reaches of the creek around Nathalia indicates that there have been significant increases in the
diversity and abundance of native fish species. Furthermore, PIT tag readers have recently been
installed on some of the fishways in the lower Broken Creek. These installations are expected to
track the movements of both native and introduced fish within the lower Broken Creek and
provide a greater understanding of the dynamics of fish movements both within the creek and
between the lower Broken Creek and the Murray River. However, while our understanding of the
fish community in the Broken Creek below the township of Nathalia is continuing to improve, a

Monitoring Native Fish Communities
Arthur Rylah Institute for Environmental Research 5
recent study (O’Connor 2006) indicated that native fish diversity and abundance upstream of the
township of Nathalia is depressed relative to areas lower downstream. The reasons for these
differences are not clear, particularly given that this area has also been opened up to unimpeded
fish passage since 2002.
Similarly to the Broken Creek, fish passage on the Broken River has also recently been restored at
Caseys Weir where a vertical slot fishway was opened in November 2005. A study undertaken
prior to the opening of this structure indicated that the weir was acting as a barrier to fish
movement with large congregations of fish accumulating below the weir at certain times
(O’Connor 2006). However, following its opening fish were collected moving upstream through
the fishway indicating that it was successfully moving fish upstream.
In the Broken Creek a study was undertaken between Nathalia and Numurkah to:
• collect baseline fish data;
• assess upstream fish movement as a continuation of the lower Broken Creek fishway
program; and
• identify areas with the potential for habitat rehabilitation.
In the Broken River a study was undertaken upstream of Shepparton to:
• provide information on the distribution, diversity and abundance of fish and;
• establish whether instream barriers continue to restrict fish movement.
2 Methods
2.1 Study site
The Broken River system is located in north-eastern Victoria and includes both the Broken Creek
and Broken River (Figure 1). The Broken Creek diverges from the Broken River west of Lake
Mokoan and flows approximately 200 km in a north-westerly direction to its junction with the
Murray River near Barmah, while the Broken River flows in a westerly direction until it converges
with the Goulburn River near Shepparton.

Monitoring Native Fish Communities
6 Arthur Rylah Institute for Environmental Research
Figure 1. Map of the Broken River system in north-eastern Victoria indicating study sites on the
Broken Creek (BC) and Broken River (BR).
2.1.1 Broken Creek
On the Broken Creek seven study sites were selected throughout the reach (approximately 50 km)
between Nathalia and Numurkah (Figure 1, Table 1). Within this section of stream there were no
weirs, however, weirs were present immediately upstream and downstream of this section of
stream at the Numurkah and Nathalia town weirs. All habitat types present within this reach were
targeted.
BC 7
BC 6
BC 5
BC 4
BC 3
KatamatiteNumurkah
NathaliaBarmah
Boosey
CreekCreek
Creek
BrokenMajor
MurrayRiver
Goulburn
River
N
weir
township
0 10 20
Broken River
BC 1 BC 2
Kilometres
Broken
Creek
Lake
Mokoan
BenallaCaseysWeir
Gowangardie
Weir
Benalla Weir
BR 1
BR2
BR 3
BR 6
BR 8BR 5
BR 7
BR 11
Study Area
VICTORIAVICTORIA
Shepparton
BR 4
BR 10
BR 9

Monitoring Native Fish Communities
Arthur Rylah Institute for Environmental Research 7
Table 1: Site locations on the Broken Creek
Site No. Locality Grid Ref.
BC 1 Nathalia Waaia Road 7925-3410-60085
BC 2 Baxters Drive 7925-3439-60070
BC 3 Walshes Bridge Road 7925-3455-60035
BC 4 Walshes Bridge 7925-3498-60038
BC 5 d/s junction Nine Mile Creek 7925-3515-60015
BC 6 Unnamed track off Central
Mundoona Road
7925-3554-60022
BC 7 Sloleys Bridge 7925-3573-60037
2.1.2 Broken River
Study sites on the Broken River were identified based on location of instream barriers. Sites were
usually located directly downstream of an instream barrier or in the middle reaches between two
barriers. At least three major instream barriers to fish movement are located on the Broken River,
namely, Benalla Weir, Casey’s Weir (Figure 2) and Gowangardie Weir (McGuckin and Bennett
1999). An addition smaller barrier is located on private property at Rupertsdale. Six survey sites
were located on the Broken River downstream of the Benalla Weir while a further two sites were
located upstream (Table 2). One site was located in Lake Benalla while the other was at Karn
Road approximately 12 km upstream of Benalla Weir.
Figure 2. Caseys Weir

Monitoring Native Fish Communities
8 Arthur Rylah Institute for Environmental Research
Table 2: Site locations on the Broken River
Site No. Locality Grid Ref.
BR 1 Karn Road 8024-4088-59447
BR 2 Lake Benalla 8024-4083-59546
BR 3 Downstream Benalla Weir 8024-4083-59546
BR 4 Glencara property 8024-4057-59595
BR 5 Upstream Caseys Weir 8025-4050-59628
BR 6 Downstream Caseys Weir 8025-4050-59628
BR 7 Upstream weir on Rupertdale
property
8025-4003-59640
BR 8 Downstream weir on
Rupersdale property
8025-4003-59640
BR 9 Ballantine Lane 8025-3932-59646
BR 10 Gownangardie Weirpool 8025-4030-59637
2.2 Water Quality
Water temperature (ºC), electrical conductivity (µS/cm), dissolved oxygen (mg/L), turbidity
(NTU) and pH were measured in situ using a TPS FL90 water quality meter at most sites during
each sampling event. These parameters were measured to ensure that water quality fell into
tolerable ranges for fish.
2.3 Electrofishing
All sites were sampled by electrofishing, where fish were stunned by a controlled electric current
using a boat mounted (Smith-Root® model 5.0 GPP) (Figure 3), bank mounted (Smith-Root®
model 7.5 GPP) or back pack (Smith-Root® model 12B) electrofishing unit. Operating settings
were generally 1000 Volts, 120 pulses per second and 50% duty cycle.
Boat mounted electrofishing within a site consisted of 12 90-second (actual electrofishing time)
replicates. Bank mounted and back pack electrofishing within a site included eight 150-second
(actual electrofishing time) replicates. In both cases, electrofishing was conducted in an upstream
direction and was discontinuous with actual fishing taking place in all habitat types. Various site
characteristics for each replicate were recorded including: mean depth, stream width, and length.
The maximum depth of each site was also recorded.
All fish captured and observed (if positively identified) were recorded by species. Captured fish
were measured for length (mm) (caudal fork or total length) and weight (g). Weight was measured
on either of two electronic field balances (depending of fish size) accurate to 1 or 0.1 g. All fish
captured greater than 200 mm in fork length were externally tagged with a dart tag and implanted
with a PIT (passive integrated transponder) tag.

Monitoring Native Fish Communities
Arthur Rylah Institute for Environmental Research 9
Figure 3. Boat electrofishing
2.3.1 Broken Creek
Boat mounted electrofishing was used to sample the five most downstream sites while the
backpack unit was used at the two sites further upstream (sites 6 and 7) where water depth was too
shallow for the boat to navigate.
The relative state of fish habitat at each site was also determined based on stream morphology
(depth, depth variation, and width variation) and the amount of in-stream cover. Each of these
categories was assigned a relative rating of high, medium or poor. Based on habitat observations
sites were assigned to one of three classifications which were:
Habitat Class 1. High variation in stream depth and width with a high amount of instream structure
(mainly in the form of large woody debris) (sites 1 – 3);
Habitat Class 2. Medium amount of variation in stream depth, low variation in stream width, and
poor instream structure (sites 4 and 5); and
Habitat Class 3. Low variation in stream depth, medium variation in stream width and poor
instream structure (sites 6 and 7).
2.3.2 Broken River
Most sites were sampled using either bank mounted and boat electrofishing units, but, two sites,
located immediately downstream of Benalla and Caseys weirs were sampled using both bank
mounted and/or boat electrofishing. This was to allow a comparison to bank mounted
electrofishing surveys that were undertaken at these sites in 2005.

Monitoring Native Fish Communities
10 Arthur Rylah Institute for Environmental Research
2.4 Data analysis
2.4.1 Broken Creek
The biomass of each species per site in this study was estimated by multiplying the mean weight
(from fish of the species that were measured) by the number of fish of the species that were
observed. The mean values of the percent of native individuals and percent of native biomass
from this study were compared to results from farther downstream using a t-test. The number of
large natives (i.e., Murray cod and golden perch > 200 mm) captured per metre of stream sampled
was compared between habitat classifications using the Kruskal-Wallis test because the data did
not meet the assumption of normality required for ANOVA.
2.4.2 Broken River
Sampling effort was standardised to Catch Per Unit Effort (CPUE) and was calculated as fish
collected per 1000 seconds of electrofishing time. Fish abundance data collected using boat-
mounted electrofishing was separated from data collected using bank-mounted electrofishing, as it
was not possible to standardise the data collected using these two quite different sampling
methods.
For both the boat and bank mounted electrofishing data sets, comparisons of CPUE were made for
all fish, native fish, and exotic fish between sites directly below weirs with fishways and sites in
mid-reach areas using the Mann-Whitney U test. Data from the Rupertsdale property site were not
included in these analyses because no fishway had been installed on this structure. The Lake
Benalla site was also omitted from these analyses because its habitat is unique to the study area
(i.e. lake, not river).
A comparison was made of pooled CPUE for the boat electrofishing sites for all fish, native fish,
and exotic fish between sites sampled in 2005 and 2008 using the Mann-Whitney U test. A
further comparison using only Caseys Weir was done separately because of the expected effect of
the installation of a fishway in the weir after the 2005 sampling event. Sites that were not sampled
in both years using the same gear type were omitted from these analyses. Comparisons for the site
immediately below the Benalla Weir could not be completed because it only included one replicate
in each year.
3 Results
3.1 Broken Creek
3.1.1 Water Quality
All water quality measurements fell within expected ranges for this system compared to previous
studies (O’Connor, unpublished data). The following ranges were observed: 13.4 – 17.4 °C
temperature, 97 – 110% dissolved oxygen, 6.45 – 7.03 pH, 59 – 81 NTU turbidity, and 46.7 – 52.0
µS/cm electrical conductivity. For all water quality data see Appendix 1.
3.1.2 Habitat
The condition of habitat varied through the study area. Generally, depth, depth variation, and the
amount of in-stream cover (in the form of large woody debris) decreased from downstream to
upstream sites. Width variation was high at the downstream sites, low at the mid-reach sites, and
very high at the upstream sites being strongly affected by whether or not the area had been

Monitoring Native Fish Communities
Arthur Rylah Institute for Environmental Research 11
channelised. Sites were assigned to a habitat class based upon these observations with Sites 1-3
assigned to Habitat Class 1, Sites 4-5 assigned to Habitat Class 2 and Sites 6-7 assigned to Habitat
Class 3. Sites 4 and 5 (Habitat Class 2) differed in depth variation with Site 4 having a high
amount and Site 5 having a low amount of variation in stream depth.
3.1.3 Electrofishing surveys
A total of 342 fish representing three native and five introduced species were collected (Table 3).
Native fish species comprised 20% of the total catch. Two threatened species, Murray cod and
golden perch (EPBC 1999; Department of Sustainability and Environment 2005) were captured.
The most abundant native fish species sampled was the Australian smelt (Retropinna semoni)
which comprised 74% of the total catch of native fish. Goldfish (Carrasius auratus) (55%) and
common carp (Cyprinus carpio) (34%) made up most of the catch of introduced species. Only two
oriental weatherloach (Misgurnus anguillicaudatus) were captured. Forty eight fish were
implanted with PIT tags (26 common carp, 14 golden perch, 7 redfin perch, and 1 Murray cod).
Table 3: Number of native and introduced fish sampled, by species and site, from the Broken
Creek in May 2008 using boat mounted and backpack electrofishing units.
Native species Introduced species
Sit
e N
o.
Murr
ay c
od
gold
en p
erch
Aust
rali
an s
mel
t
Tota
l
com
mon c
arp
gold
fish
gam
busi
a
redfi
n p
erch
ori
enta
l
wea
ther
loac
h
Tota
l
BC 1 0 4 6 10 22 6 0 0 0 28
BC 2 1 5 11 17 18 23 0 0 0 41
BC 3 0 0 3 3 20 20 0 5 0 45
BC 4 0 6 10 16 18 21 0 8 0 47
BC 5 0 1 11 12 5 62 0 10 0 77
BC 6* 0 0 8 8 3 11 0 0 1 15
BC 7* 0 1 2 3 8 7 3 1 1 20
Total 1 17 51 69 94 150 3 24 2 273
* backpack electrofishing unit used
The proportion of native fish and biomass of native fish appears lower in the section of creek
between Nathalia and Numurkah than farther downstream below Nathalia (Figure 4). There was a
significant difference between the percent of native fish for these sites than sites previously
sampled downstream of Nathalia (O’Connor 2006) (t = 3.966; df = 11; p = 0.002).

Monitoring Native Fish Communities
12 Arthur Rylah Institute for Environmental Research
Figure 4: Comparison of percent native and percent native biomass in the Broken Creek
between Nathalia and Numurkah in 2008 and a previous study conducted in the Broken Creek
(O’Connor 2006). Error bars indicate ±1 SE.
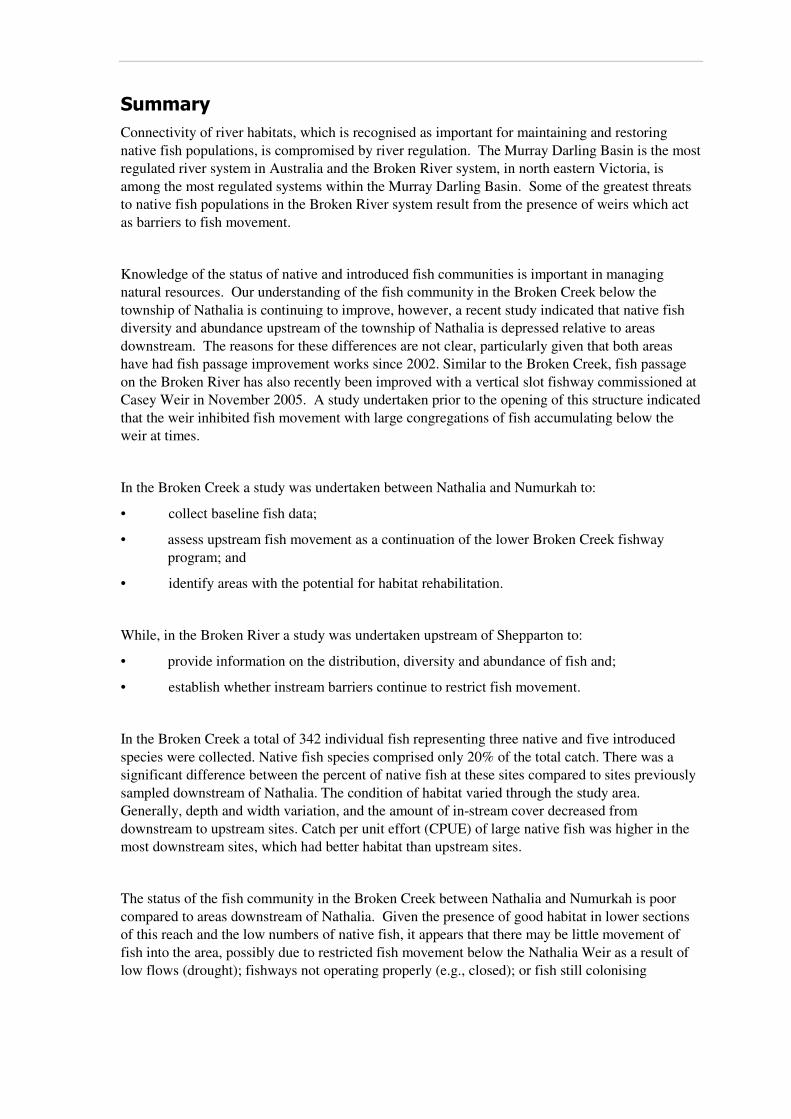
The number of large native fish observed per metre of stream sampled appeared to be higher in
Habitat Classes 1 and 2 compared to 3 (Figure 5). However, a significant difference could not be
detected (H(2, N = 76) = 4.169; p = 0.1245). The relatively high value for habitat class two was
the result of golden perch captured at site 4 (one of two sites in this class) with most of them being
captured in replicates with the highest mean depth. The mean number of Murray cod and golden
perch captured at sites using the boat mounted electrofishing unit in this study was 3.4 fish per 90-
second replicate.
Monitoring Native Fish Communities
Arthur Rylah Institute for Environmental Research 13
Figure 5: Number of large native fish (Murray cod and golden perch > 200 mm) observed in the
Broken Creek between Nathalia and Numurkah in 2008 for three habitat classifications.
3.2 Broken River
3.2.1 Water Quality
Physio-chemical water quality parameters were similar at all sites and fell within the parameters
considered normal for north eastern Victoria. Water temperature ranged from 11.6–13.6°C.
Electrical conductivity varied only slightly between sites and ranged from 123–180 µS.cm-1
.
Dissolved oxygen concentrations ranged from 94–112 mg.l -1
. Turbidity was generally low and
ranged from 15–54 NTU while pH ranged from 7.2–8.0. For all water quality data see Appendix 1.
3.2.2 Electrofishing surveys
A total of 945 fish representing six native and four exotic species were collected. The number of
fish species collected at each site ranged from three species (one native and two exotic) at the
uppermost site at Karn Road while at the site immediately downstream of Caseys Weir seven fish
species were collected (five native and two exotic) (Table 4).
Murray Darling rainbowfish and golden perch were the most widespread native species while river
blackfish was the least widespread native species being captured at only a single site. Australian
smelt and Murray Darling rainbowfish were the most abundant native fish species collected in the
survey. Carp was the most abundant introduced fish species and it was also the most widespread
having been collected at all sites.
1 2 3
Habitat class
0.000
0.001
0.002
0.003
0.004
0.005
0.006
0.007
0.008
Nu
mb
er
of la
rge
na
tive
fis
h p
er
m

Monitoring Native Fish Communities
14 Arthur Rylah Institute for Environmental Research
Table 4: Total abundance of species collected by bank mounted (BM EF) and boat mounted
electrofishing (Boat EF) at survey sites on the Broken River. Abundances include counts of
species observed but not collected.
Site met
ho
d
Mu
rray
co
d
Go
lden
per
ch
Mu
rray
Dar
lin
g
rain
bow
fish
Au
stra
lian
sm
elt
Car
p g
udg
eon
Riv
er b
lack
fish
Co
mm
on
ca
rp
Go
ldfi
sh
Gam
bu
sia
Red
fin p
erch
BR 1 BM EF 8 13 6
BR 2 Boat EF 1 11 87 10 2
BR 3 Boat EF 6 27 83 20 2 6
BR 3 BMEF 1 24 58 16 1 12
BR 4 BMEF 2 129 3 4
BR 5 Boat EF 1 9 16 5 1 3
BR 6 BMEF 17 4 3 24 3 4 5
BR 6 Boat EF 7 3 12 15 15 3
BR 7 Boat EF 9 13 41 4 16
BR 8 Boat EF 3 11 3 2 10 1
BR 9 Boat EF 13 16 91 9
BR 10 Boat EF 5 3 8 5
Total 55 69 365 273 22 8 112 12 3 26
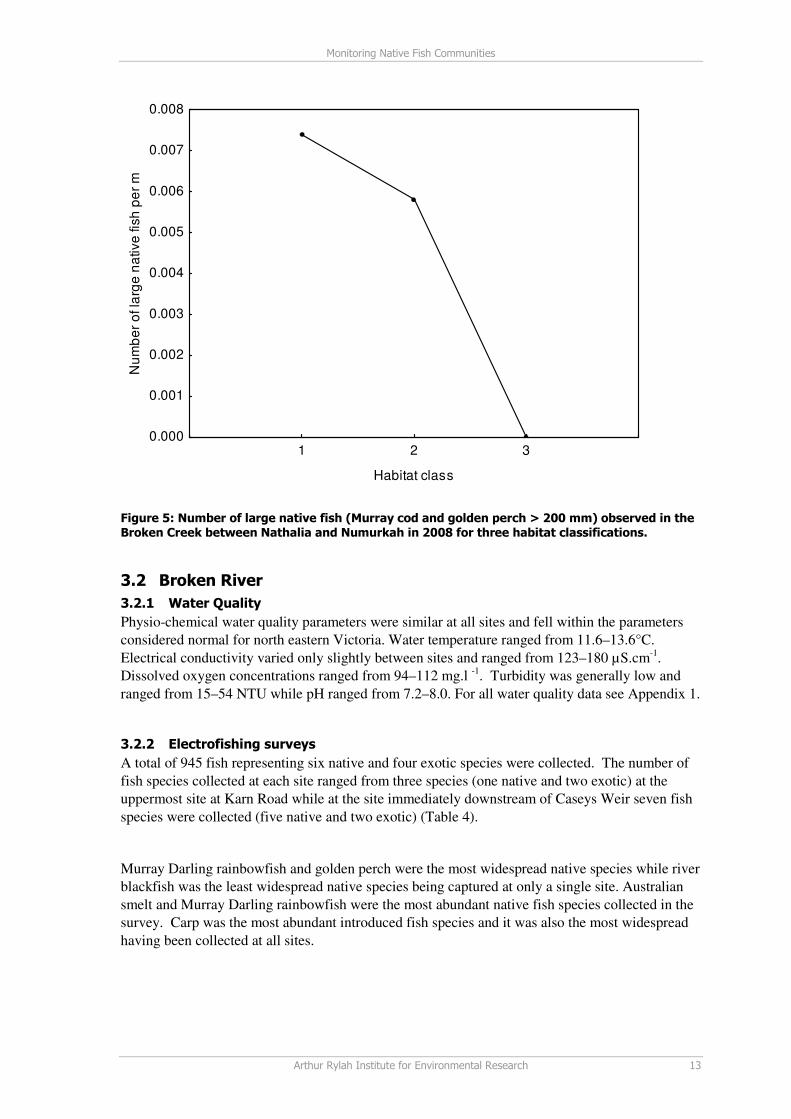
3.2.3 Catch Per Unit Effort 3.2.3.1 Boat mounted electrofishing sites
In general sites fished with the boat mounted electrofisher were dominated by small bodied native
fish species including Australian smelt and Murray Darling rainbowfish (Figure 6).
Catch per unit effort (CPUE) was higher at sites located immediately downstream of instream
barriers with fishways than in mid-reach sections. CPUE for mid-reach sites was lower for all fish
(Z = -3.32; N = 46; p = 0.0008), native fish (Z = -2.30; N = 46; p = 0.02), and exotic fish (Z = -
2.99; N = 46; p = 0.003). Overall, CPUE was four times higher below these barriers than in mid-
reach sections.
Monitoring Native Fish Communities
Arthur Rylah Institute for Environmental Research 15
Figure 6: Percentage species composition of CPUE of fish sampled using boat electrofishing in
the Broken River fish survey
Lake Benalla Downstream Lake Benalla
Caseys Weirpool Downstream Caseys Weirpool
Upstream of ford on
Rupersdale Property
Gowangardie Weirpool
Ballantine Road
Murray cod
Golden perch
Carp
Goldfish
Murray Darlingrainbowfish
Redfin
Australian smelt
Gambusia

Monitoring Native Fish Communities
16 Arthur Rylah Institute for Environmental Research
A comparison of pooled CPUE for the boat electrofishing sites between 2005 and 2008 indicated
that CPUE was higher in 2008 than in 2005. CPUE was 215 fish 1000 sec.-1
below Caseys Weir
and 78 fish 1000 sec.-1
at other sites in 2008. CPUE was lower in 2005 for all fish (Z = 4.81; N =
69; p < 0.001), native fish (Z = 4.31; N = 69; p < 0.001), and exotic fish (Z = 2.93; N = 69; p =
0.003).
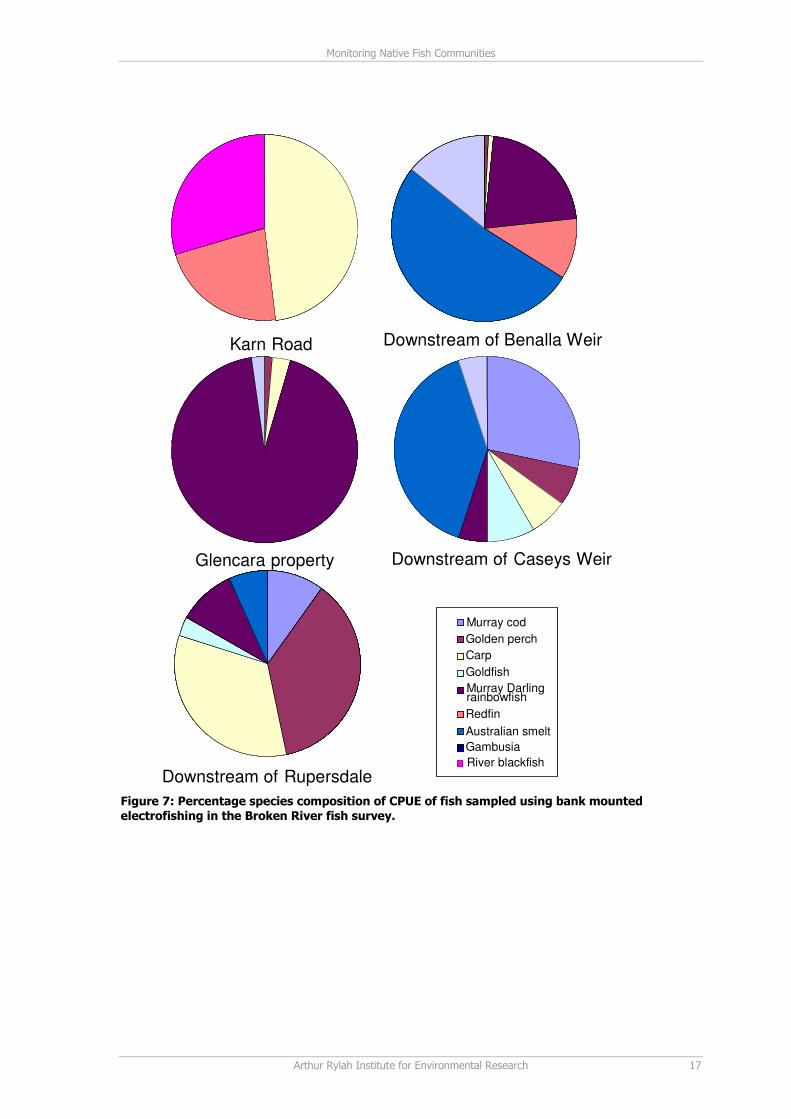
3.2.3.2 Bank mounted electrofishing sites
Bank mounted electrofishing sites were also dominated by small bodied native species (Figure 7).
Catch per unit effort (CPUE) was higher at sites located immediately downstream of instream
barriers with fishways than in mid-reach sections. CPUE for mid-reach sites was lower for all fish
(Z = 2.28; N = 25; p = 0.02) and native fish (Z = 2.37; N = 25; p = 0.02), but no difference was
detected for exotic fish (Z = 1.08; N = 25; p = 0.28).
Monitoring Native Fish Communities
Arthur Rylah Institute for Environmental Research 17
Figure 7: Percentage species composition of CPUE of fish sampled using bank mounted
electrofishing in the Broken River fish survey.
Downstream of Caseys Weir
Karn Road Downstream of Benalla Weir
Glencara property
Murray cod
Golden perch
Carp
Goldfish
Murray Darlingrainbowfish
Redfin
Australian smelt
Gambusia
Downstream of RupersdaleRiver blackfish
Monitoring Native Fish Communities
18 Arthur Rylah Institute for Environmental Research
4 Discussion
4.1 Broken Creek
The status of the fish community in the Broken Creek between Nathalia and Numurkah is
relatively poor compared to areas downstream of Nathalia. Species composition is dominated by
introduced species with the proportion of native fish lower than in the reach below Nathalia. The
relative abundance of large native species is also low. O’Connor (2006) reported a mean of 20.7
Murray cod and golden perch captured per 90-second replicate downstream of Nathalia, six times
higher than that observed between Nathalia and Numurkah at sites where the boat mounted
electrofishing unit was used. O’Connor (2006) also reported that the abundance of native fish
species had increased in the lower Broken Creek by 2005/06 following the installation of fishways.
Most of this reach was opened to unimpeded fish passage by 2002. Similarly, the Broken Creek
between Nathalia and Numurkah was also opened up to unimpeded fish passage with the
completion of the Magnusson’s/Ball’s Weir in June of 2002. Furthermore, comparisons with
previous studies indicate that the status of the fish community in this reach of creek has not
improved since 2005. A comparison of the Walshes Bridge site in this study with the results of the
2005 study indicate that fish diversity has changed slightly with the presence of gambusia in 2005
but not in 2008. However, a comparison of abundance indicates that the fish population has
remained similiar between these two periods and remains poor. Given that parts of the creek
downstream of this area have been colonised during this same period it appears that there are other
factors limiting the colonisation of this part of the creek.
A number of factors could be influencing the colonisation of the Broken Creek between Nathalia
and Numurkah by native fish species from downstream. Habitat does not appear to be a limiting
factor for large native fish in some areas of this reach of creek. Habitat at Sites 1 to 3 in this study,
rated as Habitat Class 1, appeared similar to the habitat available in the Broken Creek below
Nathalia where the abundance and diversity of the native fish community is better. However,
while no statistical difference in the number of large native fish could be detected between the
three habitat classifications in the study reach, the quality of habitat does appear to decline further
upstream. Decreases in depth, depth variation and stream width variation further upstream appear
to limit the presence of large native fish species. For example, most of the large native fish
captured in Habitat Class 2 were captured in the deepest areas of Site 4, indicating that depth is
probably an important variable with respect to the presence of large native fish species. Following
from this, no large native fish were captured in Habitat Class 3 (sites 6 and 7), and given that
stream depth at these sites was very shallow this is not unexpected.
The reasons for differences in the status of the fish community between the area below Nathalia
and Sites 1 to 3 in this study are unknown. However, given the presence of good native fish
habitat in Sites 1 to 3, low native fish abundance appears to be as a result of limited movement of
fish into the area. Possible explanations for this limited movement may include: restricted fish
movement from below the Nathalia into these areas as a result of low flows (drought) over the last
few years; fish are still colonising downstream of this area and as a result, there has been little
population pressure (e.g., high density) to move upstream; or inefficient fishway operation. While
low flow and low population density factors will hopefully be overcome with time and increased
rainfall, inefficient fishway operation can be improved immediately by undertaking a number of
actions including:
• Efficient gate operation so that fishway gates should be fully open.

Monitoring Native Fish Communities
Arthur Rylah Institute for Environmental Research 19
• Regular fishway maintenance. Woody debris lodged in the fishway (entrances, slots and
pools) can result in increased water velocity preventing smaller fish from passing, as well
as creating smaller widths in slots, preventing larger fish from physically being able to
pass.
• Installation of trash booms is useful in reducing maintenance by keeping floating debris
from clogging the trash rack.
• Fishway attracting flows should be favourable for fish entering the fishway. During low
flows all water should be passed down the fishway.
• Flow variation enhances fish migration so flow should be manipulated to improve fish
migration and to create a more natural healthy stream. For example, the pre-set amount of
water could be released down the creek over a set period of time (one or two weeks), but
the daily volume of water can be varied to create an artificial rise and fall for that period
(Mallen-Cooper et al. 1995). Flow variation of as little as 0.15 m can be a strong stimulus
for fish migration.
It would appear from the results of this study that some areas of the Broken Creek between
Nathalia and Numurkah do not contain sufficient habitat to support permanent or temporary
(migrating) fish populations. In these areas improvements to the habitat may help improve both
the fish community in the immediate vicinity and also upstream populations as currently even
upstream migrating fish may be reluctant to travel through these poor habitat areas. Habitat in
some areas of this study site can be improved in an attempt to improve the status of the fish
community. The addition of large woody debris in the middle reaches of the study site would
improve habitat for large native species particularly given that all Murray cod and golden perch
captured during this study were captured around woody debris. Through stream rehabilitation
works variability in stream depth and maximum depth could be increased in areas like Site 5,
which appear to have been channelised, would also be expected to improve habitat for large native
fish species.
4.2 Broken River
All native fish species previously recorded by ARI (2005) were collected in the current survey.
However, unlike the 2006 surveys the introduced gambusia was also captured in the current
surveys. Overall species composition of assemblages within broad river reaches was similar,
however, catch per unit effort was greater at sites located immediately below barriers when
compared with mid-reach sites.
CPUE data indicated that the weirs on the Broken River are still acting as partial barriers to fish
movement even though fish ladders have been installed. Fish ladders are not always completely
efficient in moving fish upstream over a barrier and congregations of fish can still be expected
below these structures. However, while there are still congregations of fish below these weirs,
previous work undertaken on Caseys Weir indicates that this fish ladder is passing fish upstream
and while the current study indicates that it is still acting as a partial barrier to fish movement
Caseys Weir is no longer a complete barrier to fish movement as it was previously.
A comparison of CPUE data from the current study with a study from 2005 (ARI 2005) indicates
that more fish were sampled in 2008 than in 2005. Reasons for these differences are not clear,
however, seasonal factors in fish distribution may account for these discrepancies. Future sampling

Monitoring Native Fish Communities
20 Arthur Rylah Institute for Environmental Research
of the Broken River should include a seasonal sampling component to possibly account for the
current discrepancy between this study and the one conducted in 2005.
This survey was the first to monitor sites upstream of Benalla Weir and indicates that the fish
community upstream of this structure appears to be very different to that below it. Only a single
large native fish (golden perch) was sampled from within Lake Benalla. However, angler reports
indicate that Murray cod are also captured in Lake Benalla, suggesting that the fishway may be
moving fish upstream. No large native fish were sampled at the Karn Road site but given the lack
of deep habitat in this area this is not surprising. Future studies on the Broken River need to
include a comprehensive survey of Lake Benalla and areas immediately upstream of it. These
surveys should include the use of multiple sampling techniques including electrofishing, mesh
netting, drum netting, fyke netting and bait traps. The use of this wide range of sampling
techniques would enable a comprehensive assessment of this complex habitat type which includes
deep, slow flowing, dirty water which is difficult to assess for fish populations using electrofishing
alone.

Monitoring Native Fish Communities
Arthur Rylah Institute for Environmental Research 21
5 Recommendations
Broken Creek
1. Investigate habitat rehabilitation works in the mid reaches of the section of creek
between Nathalia and Numurkah that have been channelised. Possible restoration
works could include riparian restoration, instream habitat improvement including
resnagging and creating channel variability in depth and width.
2. Continue monitoring sites for improvements in the fish community, particularly in
response to any sustained increased flow events or habitat rehabilitation.
3. Review operation regimes of all fishways to optimise migration during
migrational periods.
4. Review operation of Numurkah and Nathalia fishways.
5. Installation of PIT tag readers on Numurkah Town Weir fishway.
Broken River
1. Continued monitoring of Broken River with future monitoring to include a
seasonal sampling component.
2. Comprehensive fish assessment of Benalla Weir and areas immediately upstream
of it using a wide range of gear types.
3. Installation of PIT tag readers on Benalla and Caseys weir fishways.
4. Production of an operation and maintenance schedule for Benalla and Caseys
weirs fishway.

Monitoring Native Fish Communities
22 Arthur Rylah Institute for Environmental Research
References
ARI (2005). Assessment of Caseys Weir fishway on the Broken River. Report to Goulburn-
Broken Catchment Management Authority. Arthur Rylah Institute for Environmental Research,
Department of Sustainability and Environment, Heidelberg, Victoria.
Brown, P., McKinnon, L. Gasior, R. and Douglas, J. 1997a. Broken Creek pre-fishway assessment
March-April 1997. Marine and Freshwater Resources Institute.
Brown, P., McKinnon, L. & Strongman, R. 1997b. A preliminary assessment of fish passage at
Rice’s Weir fishway, November 1997. Marine and Freshwater Resources Institute.
Close, P. and Aland, G. (2001). The Impact of Instream Barriers on Fish Assemblages in Lower
Reaches of the Broken River and Seven Creeks, and Preliminary Assessment of fish passage
through the Euroa Town and Lake Benalla Fishways. Technical Report prepared by Freshwater
Ecology for Goulburn Broken Catchment Management Authority.
Clunie, P. and Koehn, J.D. Freshwater Catfish: A Resource Document. Report for the Natural
Resources Management Strategy to the Murray-Darling Basin Commission. Arthur Rylah Institute
for Environmental Research, Department of Natural Resources and Environment.
DNRE (2000a) Threatened vertebrate Fauna in Victoria. Department of Natural Resources and
Environment.
DNRE (2001) Victorian Aquatic Fauna Database. Historical fish survey data for the Broken River
and Seven Creeks Catchments.
Jungwirth, M. 1998. River continuum and fish migration-going beyond the longitudinal river
corridor in understanding ecological integrity. In Fish migration and bypasses. Eds. Jungwirth, M.,
Schmutz, S. and Weiss, S. University Press, Cambridge.
Koehn, J.D. and O’Connor, W.G. (1990) Biological information for the management of native
freshwater fish in Victoria. Department of Conservation and Environment. Victoria 165 pp.
Llewellyn, L.C. (1983) The distribution of fish in New South Wales. Australian Society for
Limnology Special Publication, no. 7, 23pp.
Lucas, M. C. & Baras, E. 2001. Migration of freshwater fishes. Blackwell Science.
Monitoring Native Fish Communities
Arthur Rylah Institute for Environmental Research 23
Mallen-Cooper, M., Stuart, I.G., Hides-Pearson, F. and Harris, J.(1995) Fish migration in the
Murray River and assessment of the Torrumbarry fishway. Final report for Natural Resources
Management Strategy Project N002. New South Wales Fisheries Research Institute and the
Cooperative Research Centre for Freshwater Ecology.
McGuckin, J. and Bennett, P. (1999). An inventory of fishways and potential barriers to fish
movement and migration in Victoria. Department of Natural Resources and Environment.
Merrick, J.R. (1980) Family Teraponidae. Freshwater Grunters and Perches. In, McDowall, R.M.
(Ed.) Freshwater Fishes of South-Eastern Australia. Reed, Sydney. pp. 150-152.
O’Connor, J. (2006). Assessment of the Broken Creek fishways installation program. Report to
Goulburn Catchment Management Authority. Arthur Rylah Institute for Environmental Research,
Department of Sustainability and Environment, Heidelberg, Victoria.

Monitoring Native Fish Communities
24 Arthur Rylah Institute for Environmental Research
Appendix 1
Water quality from Broken Creek and Broken River
Site No. pH Electrical
cond.
(µS/cm)
Turbidity
(NTU)
Dissolved
oxygen
(%)
Temp.
(ºC)
BC 1 6.9 50.1 74 99 15.5
BC 2 7.0 52.0 64 99 13.4
BC 3 6.5 51.6 66 101 15.1
BC 4 6.6 48.4 66 108 14.6
BC 5 6.8 49.5 81 97 15.0
BC 6 7.0 46.6 59 110 17.4
BC 7 6.5 51.1 44 106 14.0
BR 1 8.0 146 36 100 12.2
BR 3 7.8 124 15 101 13.6
BR 4 7.8 148 22 94 12.7
BR 5 7.2 207 37 112 13.5
BR 6 7.7 162 54 98 12.4
BR 7 8.0 181 41 101 13.6
BR 8 8.0 181 41 101 13.6
BR 9 8.0 177 45 105 11.6
Note that water quality is not available for some sites

Monitoring Native Fish Communities
Arthur Rylah Institute for Environmental Research 25

Monitoring Native Fish Communities
26 Arthur Rylah Institute for Environmental Research
ISBN ISBN 978-1-74208-703-0 (print)