monitoring of the australian petroleum industry monitoring... · december 2014 monitoring of the...
TRANSCRIPT

Monitoring of the Australian petroleum industry
Report of the ACCC into the prices, costs and profits of unleaded petrol in Australia
DECEMBER 2014
Mo
nito
ring
of th
e A
ustra
lian
pe
trole
um
ind
ustry: R
ep
ort o
f the A
CC
C in
to th
e p
rices, c
osts a
nd
pro
fits of u
nle
ad
ed
petro
l in A
ustra
lia D
ec
em
be
r 20
14

Monitoring of the Australian petroleum industry
Report of the ACCC into the prices, costs and profits of unleaded petrol in Australia
DECEMBER 2014

ISBN 978 1 922145 39 0
Australian Competition and Consumer Commission 23 Marcus Clarke Street, Canberra, Australian Capital Territory, 2601
© Commonwealth of Australia 2014
This work is copyright. In addition to any use permitted under the Copyright Act 1968, all material contained within this work is provided under a Creative Commons Attribution 3.0 Australia licence, with the exception of:• the Commonwealth Coat of Arms• the ACCC and AER logos• any illustration, diagram, photograph or graphic over which the Australian Competition and Consumer
Commission does not hold copyright, but which may be part of or contained within this publication.
The details of the relevant licence conditions are available on the Creative Commons website, as is the full legal code for the CC BY 3.0 AU licence.
Requests and inquiries concerning reproduction and rights should be addressed to the Director, Corporate Communications, ACCC, GPO Box 3131, Canberra ACT 2601, or [email protected].
Important notice
The information in this publication is for general guidance only. It does not constitute legal or other professional advice, and should not be relied on as a statement of the law in any jurisdiction. Because it is intended only as a general guide, it may contain generalisations. You should obtain professional advice if you have any specific concern.
The ACCC has made every reasonable effort to provide current and accurate information, but it does not make any guarantees regarding the accuracy, currency or completeness of that information.
Parties who wish to re-publish or otherwise use the information in this publication must check this information for currency and accuracy prior to publication. This should be done prior to each publication edition, as ACCC guidance and relevant transitional legislation frequently change. Any queries parties have should be addressed to the Director, Corporate Communications, ACCC, GPO Box 3131, Canberra ACT 2601, or [email protected].
ACCC 12/14_897
www.accc.gov.au

Contents
Key messages vii
Shortened terms xv
Glossary xvi
Summary xviiiACCC and the petrol industry in 2013−14 xviii
Petrol prices in 2013−14 xxiii
Costs in 2013−14 xxxiv
Profits in 2013−14 xxxix
Developments in the fuel industry in 2013−14 xliv
1 Background and objectives 11.1 Background to ACCC involvement in the industry 1
1.2 Petrol monitoring reports 1
2 ACCC activities in the petroleum industry 32.1 Introduction 3
2.2 Enforcement and compliance under the Act 3
2.3 Monitoring activities 8
2.4 Informing consumers 8
2.5 Engagement with key stakeholders 10
3 Developments in industry structure 113.1 Introduction 11
3.2 Crude oil production 12
3.3 Australian refining 14
3.4 Imports and exports of refined fuel 17
3.5 Major terminal infrastructure 19
3.6 Wholesaling 23
3.7 Retailing 24
4 International context 294.1 Introduction 29
4.2 Crude oil prices 29
4.3 Demand for crude oil 33
4.4 Supply of crude oil 34
4.5 Refining capacity 37
5 Wholesale prices 395.1 Introduction 39
5.2 Wholesale sector 39
5.3 Wholesale price benchmarks 41
5.4 Relationship between actual wholesale prices and wholesale benchmarks 45
Monitoring of the Australian petroleum industry December 2014 iii

6 Retail prices 496.1 Introduction 49
6.2 Retail petrol price movements 50
6.3 Determinants of petrol prices 52
6.4 Components of retail petrol prices 58
6.5 Gross indicative retail differences for petrol 61
6.6 Other grades of petrol 63
6.7 Diesel and LPG prices 64
6.8 Australian prices compared with other countries 68
7 Retail prices in regional locations 737.1 Introduction 73
7.2 Influences on prices in regional locations 74
7.3 Petrol prices in regional locations 75
8 Petrol price cycles 838.1 Introduction 83
8.2 Price cycles 83
8.3 Data on price cycles 85
8.4 Number of troughs and peaks by day of the week 86
8.5 Duration of price cycles 88
8.6 Consumer buying patterns over the week 90
8.7 Price cycle increases and public holidays 93
9 Premium unleaded petrol 959.1 Introduction 95
9.2 Features of PULP 95
9.3 Retail PULP prices 96
9.4 Determinants of PULP prices 98
9.5 Supply of PULP 103
9.6 Demand for PULP 104
10 Ethanol blended petrol 10710.1 Introduction 107
10.2 EBP and government policy 108
10.3 Sales of EBP 109
10.4 Retail sites selling E10 petrol 111
10.5 Price differentials 113
10.6 Ethanol supply and demand 114
11 Financial performance of the Australian downstream petroleum industry 11711.1 Introduction 117
11.2 Overview of the financial performance of the downstream petroleum industry 118
11.3 Revenue, costs and profits in the downstream petroleum industry— all products and services 119
11.4 Revenue, costs and profits in the downstream petroleum industry— petrol products 123
11.5 Net profits by sector 124
iv Monitoring of the Australian petroleum industry December 2014

12 Financial performance by sector 12712.1 Introduction 127
12.2 Overview of financial performance in the refinery, total supply, wholesale and retail sectors 128
12.3 Refinery sector 130
12.4 Refinery sector: revenue, costs and profits—all products 130
12.5 Refinery sector: revenue, costs and profits—petrol products 134
12.6 Total supply sector 136
12.7 Total supply sector: revenue, costs and profits—all products 136
12.8 Total supply sector: revenue, costs and profits—petrol products 139
12.9 Total supply sector: foreign exchange gains and losses 140
12.10 Wholesale sector 142
12.11 Wholesale sector: revenue, costs and profits—all products 142
12.12 Wholesale sector: revenue, costs and profits—petrol products 145
12.13 Retail sector 147
12.14 Retail sector: revenue, costs and profits 147
12.15 Retail sector: revenue, costs and profits—petrol products 152
12.16 Retail sector: convenience store sales 154
Appendix A: Minister’s letter and Direction 157
Appendix B: Data collection and methodological issues 159
Appendix C: Major infrastructure schematics 164
Appendix D: Major Australian terminals 168
Appendix E: Annual retail fuel prices in all monitored locations 172
Appendix F: E10 price monitoring 178
Monitoring of the Australian petroleum industry December 2014 v

vi Monitoring of the Australian petroleum industry December 2014

Key messages
Australian retail petrol prices were historically high in 2013−14 Annual average retail petrol prices in 2013−14 were the third highest on record in real terms.
The annual average retail price of regular unleaded petrol (RULP) in the five largest cities (i.e. Sydney, Melbourne, Brisbane, Adelaide and Perth) was 150.6 cents per litre (cpl) in 2013−14.
• In real terms, annual average prices were the highest after 2007−08 (157.3 cpl) and 2005−06 (151.1 cpl).
• In nominal terms prices were 9.3 cpl higher than in 2012–13, and were the highest nominal prices on record.
The degree of price volatility in 2013−14 was lower than in previous years—the range between the highest and lowest seven-day rolling average prices in 2013−14 was 19 cpl, compared with 23 cpl in 2012–13 and 22 cpl in 2011−12.
• The volatility was generally within a narrow band—on around 82 per cent of days in 2013–14 prices were within a 10 cpl range between 145 cpl and 155 cpl.
International market prices and domestic fuel taxes largely determine Australian petrol prices in the medium termOf the annual average price in the five largest cities in 2013−14 of 150.6 cpl:
• the international market price of refined petrol contributed 81.5 cpl (54 per cent)
• taxes—which consist of excise (at 38.14 cpl) and GST (one-eleventh of the final retail price)—contributed 51.8 cpl (34 per cent).
In total around 88 per cent of the annual average retail price of petrol in 2013−14 (i.e. 133.3 cpl) was directly attributable to the price of international refined petrol and taxes.
As international refined petrol prices are expressed in USD, changes in the AUD–USD exchange rate also affect domestic retail prices.
In 2013−14 Australian motorists were less protected than in recent years from higher international petrol prices because the annual average value of the Australian dollar fell to its lowest level since 2009–10.
As the international market price of refined petrol in USD was relatively similar in 2012−13 and 2013−14, the main driver of higher petrol prices in Australia in 2013−14 was the lower AUD–USD exchange rate.
In 2013–14 petrol prices were the third highest on record in real terms
Australian retail petrol prices largely reflect international factors and domestic taxes
Monitoring of the Australian petroleum industry December 2014 vii

If the average AUD–USD exchange rate in 2013–14 (USD 0.92) had been at the same level as in 2012–13 (USD 1.03) retail petrol prices in 2013–14 would have been around 10 cpl lower.
Australian retail prices are low by international standardsAs a result of rates of fuel taxation that are less than in many other countries, Australia’s petrol prices are among the lowest in the developed world. In the June quarter 2014 Australia had the fourth lowest retail petrol prices in the Organisation for Economic Co-operation and Development (OECD).
The main determinant of the lower retail petrol prices in Australia is Australia’s relatively low rate of taxation on fuel. In the June quarter 2014 tax represented around 34 per cent of the retail price of petrol in Australia, compared with the OECD average of around 50 per cent.
The rate of taxation of petrol in Australia has been steadily diminishing over the last 15 years. The percentage of the final retail price of petrol represented by taxes decreased from around 56 per cent in 1999–2000 to around 34 per cent in 2013–14.
Short run price volatility reflects retail petrol price cyclesPetrol price cycles, which occur in the five largest cities and a small number of regional locations, have a significant effect on price levels in the short run. Petrol price cycles are not caused by changes in international benchmark prices or other costs. Rather, price cycles are an outcome of the profit-maximising pricing policies of petrol retailers.
Price cycles are of concern to some consumers due to the large price increases that occur in a single day, and across most retail sites, on a regular basis. On the other hand, some consumers try to take advantage of the bottom of the price cycle to buy petrol at relatively low prices.
Since 2009 the duration of price cycles in the eastern capital cities (i.e. Sydney, Melbourne, Brisbane and Adelaide) has increased significantly—from around a week in 2009 to around two and a half weeks in the first half of 2014. As a result, this has made it more difficult for motorists to take advantage of low points in the price cycle.
International refined petrol pricesThe price of refined petrol in Australia is set with reference to international benchmark prices. The relevant international benchmark price for petrol in Australia is the price of refined petrol in the Asia-Pacific region, which is the price of Singapore Mogas 95 Unleaded (Mogas 95). Weekly average Mogas 95 prices were relatively stable in 2013–14, largely being in a USD 10 band between USD 115 per barrel and USD 125 per barrel. Prices were significantly more volatile in the two previous years.
Australian petrol prices are among the lowest in the OECD due to lower fuel taxes in Australia relative to other countries
Price cycles significantly affect prices in Australia’s largest cities
International refined petrol prices were relatively high but stable in 2013–14
viii Monitoring of the Australian petroleum industry December 2014

The annual average price of Mogas 95 in 2013−14 was around USD 119 per barrel. This was USD 2 per barrel below the annual average price in 2012–13 (USD 121 per barrel) and USD 4 per barrel below the highest ever level of USD 123 per barrel (in nominal terms) in 2011–12.
Over 2013–14 Mogas 95 prices were influenced by a range of factors, including: changes in demand in the Asia-Pacific region; North Sea oil supply issues; stock levels in the United States; and geo-political concerns over Syria and Ukraine.
Over time Australian retail petrol prices have tracked the price of Mogas 95 closely. Between 2003–04 and 2013–14 the annual average retail price of RULP (excluding taxes) in Australia’s five largest cities increased by 125 per cent, while the annual average price of Mogas 95 in Australian cents per litre increased by 130 per cent (both in nominal terms).
Crude oil pricesThe price of Mogas 95 is linked to the price of crude oil as it is the major input into the production of refined petrol. Crude oil is an internationally traded commodity and its price is determined by global demand and supply factors.
Through the effect crude oil has on international benchmark prices of refined petrol, it is also a key driver of the retail price of petrol in the long run.
Australian refineries generally pay a price for crude oil that is based on the price of Brent crude oil (a light sweet crude oil from the North Sea, which is probably the most widely used benchmark on global markets) or Tapis crude oil (a Malaysian light sweet crude oil, which is used in the Asia−Pacific region).
On an historical basis, crude oil prices remained high in 2013–14, with the annual average price of Brent crude oil being around USD 110 per barrel. This was slightly up on 2012–13 (around USD 109 per barrel) and was the second highest nominal annual average price of Brent crude oil on record, behind 2011–12 (around USD 113 per barrel).
Domestic refiningThe Australian refinery sector is facing a challenging future due to competitive pressure from large, low-cost Asian refineries. In 2013–14 this was reflected by the announcement by BP in April 2014 that it planned to halt refining operations at its Bulwer Island refinery in Brisbane by mid-2015.
In April 2013 Shell had stated its intention to sell its refinery in Geelong. In February 2014 Shell announced that it had reached a binding agreement to sell its Australian downstream business (which included the refinery and its 870 retail site business in Australia) to Vitol.
Crude oil prices remained high in 2013–14
Another domestic refinery announced its closure in 2013–14
Monitoring of the Australian petroleum industry December 2014 ix

In early 2012 there were seven refineries operating in Australia. By mid-2015 Australia will have only four: Geelong and Altona in Victoria, Lytton in Queensland and Kwinana in Western Australia.
Profits
Total downstream industry profitsIn 2013–14 total downstream petroleum industry net profits were higher than in 2012–13.
Net profits for all products and services in the downstream petroleum industry were around $1.16 billion (or, in terms of cents per litre sold, 1.30 cpl), compared with net profits in real terms of $796 million (or 0.88 cpl) in 2012−13. All products and services include any oil based products that are derived from crude oil processed in oil refineries, and other services such as retail convenience store sales.
The increase in 2013–14 (46 per cent in real terms) was due to improvements in the financial performance of the total supply sector (i.e. refining and importing). The refinery sector was profitable in 2013–14 for the first time since 2010–11, while net losses in the other parts of the supply sector decreased substantially.
The refinery sector reported net profits of $27 million in 2013–14, an increase in real terms of $137 million from losses of $110 million in 2012–13.
In 2013–14 the wholesale sector reported total net profits of $836 million across all products, a decrease of 6 per cent in real terms from 2012–13.
Retail sector profitsThe retail sector reported net profits of $495 million across all products and services in 2013–14, a decrease of 10 per cent in real terms from 2012–13. This decrease was partly due to reduced volumes, which decreased by 1.7 per cent in 2013–14. Total profits in the retail sector had been on an upward trend since 2005–06.
Retail net profits on petrol products—i.e. RULP, premium unleaded petrol (PULP) and ethanol blended petrol (EBP)—were $271 million in 2013–14, a decrease of 11 per cent in real terms compared with 2012–13.
In terms of cents per litre of fuel sold, real unit net profit on petrol products in the retail sector over the last six years have increased almost four-fold—from 0.59 cpl in 2008–09 to 2.22 cpl in 2013–14.
Retail sector net profits in 2013–14 were lower in both absolute and cents per litre terms compared with 2012–13. These lower profits in 2013−14 may have been influenced by ACCC undertakings relating to shopper docket discount schemes by the supermarkets.
Profits in the downstream petroleum industry were higher in 2013–14
x Monitoring of the Australian petroleum industry December 2014

Regular and premium unleaded petrol in the retail sectorUnit net profit on both RULP and PULP in the retail sector has increased markedly in the last seven years (although there was a slight decrease in 2013–14). In 2013–14 PULP was a significant contributor to retail profits, earning broadly similar total profits as RULP on considerably smaller volumes. In 2013–14 unit net profit on PULP in the retail sector was 3.33 cpl compared with 1.75 cpl for RULP. Since 2007–08, real unit net profit on PULP in the retail sector has increased nine-fold compared with a three-fold increase in RULP unit net profit.
The New South Wales (NSW) Government mandate on ethanol is likely to be a strong factor promoting greater demand for, and higher profits on, PULP. The mandate, which requires a minimum of 6 per cent of total petrol sale volumes to be ethanol, seems to have contributed to an increase in demand for PULP by significantly reducing supply of RULP in that state.
Convenience store sales in the retail sectorPetrol retailers earned net profits of $201 million from convenience store sales in 2013–14, a decrease of 5 per cent from $211 million in 2012–13. This was the first time convenience store profits decreased during the time of ACCC monitoring. In the last seven years, convenience store sales have contributed on average around 39 per cent of total retail profits.
Regional locationsRetail petrol prices in regional locations in Australia are typically higher than those in the capital cities, although they generally tend to follow the same overall price movements. In 2013–14, 94 per cent of the regional locations monitored by the ACCC had higher annual average petrol prices than their respective capital city.
Petrol prices in regional locations are generally higher than in the five largest cities for a number of reasons, including:
• a lower level of local competition, often reflecting the lower number of retail sites
• lower volumes of fuel sold
• distance/location factors
• lower convenience store sales.
These factors also explain differences in petrol prices between regional locations.
The ACCC actively monitors petrol prices in 180 regional locations throughout Australia and analyses competition issues in those locations. The ACCC investigates allegations of anti-competitive conduct in regional locations on an on-going basis.
Retail petrol prices in regional locations in Australia are typically higher than those in the capital cities
Monitoring of the Australian petroleum industry December 2014 xi

Ethanol blended petrolEthanol is added to petrol to produce various grades of EBP, the most common type of which is E10—i.e. RULP containing up to 10 per cent ethanol.
In 2013−14 total sales of EBP in Australia decreased by around 8 per cent from 2012–13. Sales were down in NSW and Queensland, and increased in Victoria (albeit from a very low base). EBP sales represented 13 per cent of total petrol sales in Australia (a decrease of 1 percentage point from 2012−13).
The largest volume of EBP is sold in NSW, which accounted for 82 per cent of the Australian EBP market in 2013−14. This is primarily a result of the NSW ethanol mandate.
Since its introduction in October 2007 the ethanol mandate in NSW has had a significant impact on competition and consumers:
• it has affected the competitive dynamic among retailers by removing RULP from many retail sites
• it has reduced consumer choice—some motorists who cannot use, or choose not to use, E10 in their vehicles have, because of the reduced availability of RULP, decided to use PULP
• since PULP retails at a higher price than RULP, it has meant that these motorists have been paying significantly higher prices than if they had continued to purchase RULP.
Premium unleaded petrolIn Australia the two main grades of PULP are PULP 95 and PULP 98. Other grades of PULP are also available in the Australian market, but they are sold in much lower volumes.
Sales of the PULP grades have grown steadily over recent years. Between 2006−07 and 2013−14 PULP as a proportion of total petrol sales increased from 16 per cent to 28 per cent.
ACCC and the petrol industryThe main role of the ACCC is to enforce the Competition and Consumer Act 2010 (the Act) across the Australian economy, which includes the fuel industry. The ACCC’s activities under the Act in 2013–14 included enforcement and compliance, mergers and acquisitions assessments, authorisations and notifications, and administration of the Oilcode.
The ACCC does not set wholesale or retail petrol prices in Australia. They are determined by the market. Put another way, it is not against the law simply to price well above cost.
Sales of ethanol blended petrol decreased in 2013−14
The ethanol mandate in New South Wales has had a significant impact on competition and consumers
In 2013–14 sales of PULP represented 28 per cent of total petrol sales in Australia. Use of PULP has increased steadily over recent years
The ACCC enforces the Competition and Consumer Act 2010. It does not set wholesale or retail fuel prices in Australia
xii Monitoring of the Australian petroleum industry December 2014

ACCC instituted proceedings about price information sharingOn 19 August 2014 the ACCC instituted proceedings against Informed Sources and five petrol retailers alleging that the information sharing arrangements between Informed Sources and the petrol retailers, through the service provided by Informed Sources, contravened s. 45 of the Act. Subscribers to the Informed Sources service provide pricing data to Informed Sources at frequent, regular intervals and in return receive from it collated data from the other subscribers, and various reports containing pricing information across particular regions. The ACCC alleges that the arrangements had the effect or likely effect of substantially lessening competition in markets for the sale of petrol in Melbourne. Given the importance of price competition in petrol pricing, the ACCC is concerned that this may result in consumers paying more for petrol.
ACCC investigation into shopper docket discounting schemesThe ACCC’s investigation into the competition implications of shopper docket fuel discount offers by the major supermarkets was completed in December 2013. This investigation, which had been on-going since early 2012, raised competition concerns in relation to shopper docket fuel discount schemes, given the extended frequency, duration and size of shopper docket fuel discounts offered by the major supermarket chains. The investigation resulted in undertakings being given to the ACCC that prevent Coles and Woolworths offering fuel discounts that are subsidised by their supermarket operations and from bundling supermarket fuel offers greater than 4.0 cpl.
Peregrine acquisition of BP retail sites in South AustraliaOn 15 May 2013 the ACCC commenced a review of Peregrine Corporation’s (which operates under the trading name of On The Run) proposed acquisition of 25 BP Australia petrol retail sites in South Australia. The ACCC announced in May 2014 its decision to not oppose the proposed acquisition, after accepting a court-enforceable undertaking. The undertaking required Peregrine to divest itself of three sites that it would otherwise have acquired from BP and one of its existing sites. The ACCC was concerned that Peregrine’s acquisition of these sites could have resulted in higher fuel prices in some local areas.
The ACCC completed its investigation into price information sharing arrangements and instituted proceedings against Informed Sources and five petrol retailers
The ACCC completed its investigation into the shopper docket discount fuel offers of the major supermarkets
The ACCC did not oppose the proposed acquisition by Peregrine after accepting a court-enforceable undertaking
Monitoring of the Australian petroleum industry December 2014 xiii

Caltex acquisition of Scotts Transport fuel divisionOn 27 February 2014 the ACCC commenced a review of Caltex’s proposed acquisition of the fuel division of the Scotts Group of Companies. This included 27 retail service stations, eight depots with depot fronts/unmanned card facilities, 12 depots, one unmanned card facility and one kerbside pump in NSW, South Australia and Victoria. On 21 May 2014 the ACCC decided to not oppose the proposed acquisition, subject to a court-enforceable undertaking, which required Caltex to divest certain retail sites in Mt Gambier and Nhill.
Viva Energy acquisition of an interest in Liberty OilOn 2 September 2014 the ACCC commenced a review of Viva Energy Australia Ltd’s proposed acquisition of an interest in Liberty Oil Holdings Pty Ltd, which in certain circumstances could amount to a controlling interest. Liberty is a major wholesale supplier to independent fuel retailers in Australia. On 28 October 2014 the ACCC announced its decision to not oppose the proposed acquisition by Viva.
The ACCC did not oppose the proposed acquisition by Caltex after accepting a court-enforceable undertaking
The ACCC did not oppose the proposed acquisition by Viva Energy
xiv Monitoring of the Australian petroleum industry December 2014

Shortened terms
AUD Australian dollars
AIP Australian Institute of Petroleum
bl barrel (equals 158.987 litres)
BREE Bureau of Resources and Energy Economics
Btu British thermal units
cpl Australian cents per litre
EBIT earnings before interest and tax
EBP ethanol blended petrol
FuelCC Fuel Consultative Committee
GFC global financial crisis
GIRDs gross indicative retail differences
IEA International Energy Agency
IPP import parity price/pricing
LPG automotive liquefied petroleum gas
mbpd million barrels per day
ML megalitres (million litres)
Mogas 95 Singapore Mogas 95 Unleaded petrol
OECD Organisation for Economic Co-operation and Development
OPEC Organisation of Petroleum Exporting Countries
PULP premium unleaded petrol
RET Department of Resources, Energy and Tourism (now Department of Industry)
RON research octane number
RULP regular unleaded petrol
Saudi CP Saudi contract price
TGP terminal gate price
the Act Competition and Consumer Act 2010
USD United States dollars
US EIA United States Energy Information Administration
WTI West Texas Intermediate crude oil
Monitoring of the Australian petroleum industry December 2014 xv

Glossary
automotive fuel includes petrol, diesel and automotive LPG.
barrel a traditional measure used by the oil industry: one barrel is equivalent to 158.987 litres.
benchmark pricing the practice of pricing to an identified crude or product price; for instance, the Tapis crude oil price benchmark.
buy–sell arrangements arrangements between domestic refinery owners for the purchase and sale of petroleum products.
city–country differential the difference between the average country retail price of petrol and the average city retail price of petrol.
commission agent an arrangement whereby an agent receives a commission for selling a product owned by another; in the downstream petroleum sector a commission agent often operates a retail site owned by a petrol refiner or wholesaler.
distributor a transport company that picks up petroleum products from refineries, terminals and depots for delivery to retailers and end users.
downstream the refining, importing, distribution and retailing of petroleum products.
exclusive dealing a type of conduct prohibited in certain circumstances by s. 47 of the Competition and Consumer Act 2010 which, broadly speaking, involves one trader imposing restrictions on another’s freedom to choose with whom, or in what or where it deals.
five largest cities Sydney, Melbourne, Brisbane, Adelaide and Perth.
Fuel Consultative Committee (FuelCC) established in 2010 by the ACCC to provide a forum for the ACCC, the fuel industry and motoring organisations to discuss fuel related issues, and to assist the ACCC in undertaking its role under the Act on issues related to competition and consumer protection in the fuel industry.
import parity pricing (IPP) the setting of wholesale prices of petrol at a price comparable with the cost of importing fuel into a given location in Australia.
independent retailers retailers (owning single or multiple sites) other than supermarket retailers and refiner-wholesalers. Independent retailers can sell petrol under the brand name of one of the refiner-wholesalers or under their own brand name.
large independent chains companies—other than refiner-wholesalers and supermarket chains—that import, wholesale and/or retail fuel in Australia; these include Puma Energy, United, 7-Eleven and On The Run.
xvi Monitoring of the Australian petroleum industry December 2014

Oilcode a prescribed mandatory industry code of conduct under s. 51AE of the Competition and Consumer Act 2010. It regulates the conduct of suppliers, distributors and retailers in the downstream petroleum industry.
Platts a provider of energy market information including price benchmarks for the oil, petrol and other energy markets.
price support a rebate provided to a petrol retailer to compensate for periods of price discounting.
quality premium the difference between the international benchmark price and the price of fuel refined to Australian standards.
refiner-wholesaler a company that refines, imports and wholesales fuel; in Australia these are BP, Caltex, Mobil and Shell.
shopper docket an offer to consumers to supply petrol or diesel at a reduced price if the consumer has spent a certain amount in one purchase on grocery goods or has acquired certain identified goods from a nominated supermarket or retailer.
Singapore Mogas 95 Unleaded a benchmark specification for refined petrol reported by Platts. It is used in oil markets as the benchmark for regular unleaded petrol in the Asia-Pacific region, including Australia.
three smaller capital cities Darwin, Hobart and Canberra.
terminal a storage facility from which fuel is received via ship and/or refinery and distributed to retailers, distributors and end users.
terminal gate price the price for a spot purchase of petrol from a terminal. It is the price a purchaser pays, usually in cash, when they arrive at a wholesaler’s terminal wanting to purchase a tanker load of 30 000 litres of petrol.
terminal throughput the annual volume received and then distributed by a refinery or terminal.
terminal turnover the number of times a terminal is effectively filled and emptied during a year (i.e. annual throughput divided by physical capacity).
total supply sector the fuel industry sector that refines, imports and exports petroleum products, and purchases petroleum products from Australian refineries. This sector also imports crude oil for use by refineries.
wholesale the sale and movement of petroleum products from importers, domestic refiners, and/or other wholesalers, to retailers or to end users such as transport, agricultural and mining companies.
Monitoring of the Australian petroleum industry December 2014 xvii

Summary
In December 2007 the ACCC was asked by the Australian Government to monitor prices, costs and profits of unleaded petroleum products in the Australian petroleum industry. The ACCC has provided the Minister with an annual monitoring report ever since. This is the seventh such report.
This summary focuses on the major findings and issues that arose from the ACCC’s monitoring role and other activities undertaken by the ACCC in the petrol industry in 2013−14. Key developments after June 2014 are also mentioned.
More comprehensive analysis of the issues covered in this summary can be found in the relevant chapters of the report.
ACCC and the petrol industry in 2013−14
The ACCC does not set wholesale or retail petrol prices in Australia. These are determined by the market.
The ACCC does not set wholesale or retail petrol prices in Australia. They are determined by the market. Put another way, it is not against the law simply to price well above cost.
The main role of the ACCC is to enforce the Competition and Consumer Act 2010 (the Act) across the Australian economy, which includes the fuel industry. The ACCC’s activities under the Act in 2013−14 included enforcement and compliance, mergers and acquisitions assessments, authorisations and notifications, and administration of the Oilcode.
The level of competition in local and national fuel markets is an issue of ongoing concern among many in the community. Through its monitoring reports, the ACCC enhances transparency of the petroleum industry and aims to increase public awareness of the factors that determine retail petrol prices in Australia.
ACCC action in the retail petrol sectorDuring 2013−14 the ACCC continued its focus on examining allegations of anti-competitive conduct in the retail petrol sector. There were two significant investigations during this period.
Price information sharing—fuel companies
The ACCC completed its investigation into price information sharing arrangements in the retail petrol sector, and in August 2014 instituted proceedings in the Federal Court against Informed Sources and five petrol retailers alleging that they contravened s. 45 of the Act.
In 2014 the ACCC completed its investigation into price information sharing arrangements in the retail petrol sector.
On 19 August 2014 the ACCC instituted proceedings in the Federal Court against Informed Sources and five petrol retailers alleging that they contravened s. 45 of the Act. The ACCC alleges that the information sharing arrangements between Informed Sources and the petrol retailers, through a service provided by Informed Sources, allows those retailers to communicate with each other about their prices, and that these arrangements had the effect or likely effect of substantially lessening competition in markets for the sale of petrol in Melbourne. The ACCC alleges that the arrangements increased or were likely to increase retail petrol price coordination and cooperation, and decreased or were likely to decrease competitive rivalry. The ACCC is concerned that this may have resulted in consumers paying more for petrol.
xviii Monitoring of the Australian petroleum industry December 2014

Subscribers to the Informed Sources service provide pricing data to Informed Sources at frequent, regular intervals and in return receive from it collated data from the other subscribers, and various reports containing pricing information across particular regions.
The matter is ongoing.
Investigation into shopper docket discount schemes
The ACCC’s investigation into the competition implications of the shopper docket fuel discount offers of the major supermarkets was completed in December 2013. Court-enforceable undertakings now prevent Coles and Woolworths offering fuel discounts that are subsidised by their supermarket operations and from bundling supermarket fuel offers greater than 4.0 cents per litre.
Coles and Woolworths have operated shopper docket discounting schemes involving petrol for a number of years. Coles and Woolworths offer 4.0 cents per litre (cpl) discounts on petrol purchases when a minimum amount is spent on purchases at their supermarkets, typically $30. At various times over the years, the supermarkets have offered discounts significantly greater than 4.0 cpl—these have been up to 45.0 cpl at times.
The ACCC commenced an investigation into the shopper docket fuel discount offers of the major supermarket chains in mid-2012. The investigation considered whether competition issues arose in relation to shopper docket fuel discount schemes, given the extended frequency, duration and size of the discounts. The ACCC was concerned that those offers could have longer-term effects on the structure of the retail fuel markets and also short-term effects of increasing general pump prices in those markets.
It completed this investigation in December 2013.
On 6 December 2013 the ACCC accepted voluntary court-enforceable undertakings from Coles and Woolworths to cease making fuel discount offers which are wholly or partially funded by any part of their business other than their fuel retailing business. From 1 January 2014 both Coles and Woolworths undertook to limit fuel discounts linked to supermarket purchases to a maximum of 4.0 cpl. The ACCC accepted the undertakings because they addressed the principal competition concerns and allowed the matter to be resolved quickly and efficiently.
From January 2014 Woolworths continued to offer bundled fuel discounts of 8.0 cpl, and in early February 2014 Coles began to offer bundled fuel savings of 14.0 cpl. On 25 February 2014 the ACCC instituted proceedings against Coles and Woolworths alleging that these offers were in breach of the undertakings.
In April 2014 the Federal Court found that Woolworths’ earlier bundled discount of 8.0 cpl was a breach of its undertaking because the discount was only available to a customer who had made a qualifying supermarket purchase. The Court dismissed two other allegations against Coles and Woolworths.
Monitoring of the Australian petroleum industry December 2014 xix

Other enforcement and compliance activity
Fuel price boards
The ACCC is currently considering consumer protection issues arising from the prominence of discounted prices on fuel price boards and the potential to mislead consumers about the price they would pay for fuel.
In July 2013 Consumer Affairs Ministers discussed the value of having a national information standard for fuel price boards to assist consumers to make better fuel purchasing decisions through the provision of clearer, more standardised information. However, in June 2014 Ministers noted the desire not to duplicate regulations in place in New South Wales (NSW), South Australia and parts of Western Australia, or to introduce further regulation where the Australian Consumer Law may address issues of concern.
Ministers further noted that the ACCC would engage with industry participants with a focus on the prominence of discounted prices and the potential to mislead consumers about the price they would pay for fuel. Ministers agreed to revisit the issue of an information standard in light of any developments following this process.
Prior to possible approaches to industry, the ACCC is currently considering the nature and variation of price boards used by fuel retailers. It will assess the potential for consumers to be induced to drive into a service station on the belief that the prominently displayed price was the price available to all customers, not just those eligible for the discount under discount offers. This would have the potential not only to harm consumers but also the competitive process and competing retailers.
Misleading conduct and false representations
Conduct is in breach of the Act where it misleads, deceives or is likely to mislead or deceive consumers.
In 2013−14 the ACCC received 110 complaints (representing around 10 per cent of all fuel-related contacts) alleging misleading and deceptive conduct and false or misleading representations. The main issues raised by consumers in 2013−14 included: concerns about pricing practices; labelling on fuel pumps; advertising promotions by supermarkets (such as fuel discount schemes); fuel price boards; fuel quality claims; and concerns about inaccurate fuel measurements.
The ACCC and regional engagement on fuel prices
As part of its monitoring activities, the ACCC obtained fuel prices in around 180 regional locations throughout Australia. It also engaged with industry groups and members of the public to collect additional information about regional fuel pricing issues. The ACCC used this information to monitor regional fuel prices against relevant benchmarks.
Where the ACCC is aware of evidence of anti-competitive conduct in regional locations it will investigate the issue. If a breach of the Act is likely to have occurred, the ACCC can take action to enforce the Act.
In addition, the ACCC pays particular attention to any potential changes in the ownership of retail sites in regional locations. Given many regional locations have a limited number of retail sites, the ACCC monitors such changes to ensure that the sale will not substantially lessen competition in that particular market.
xx Monitoring of the Australian petroleum industry December 2014

Mergers and acquisitionsSection 50 of the Act prohibits acquisitions that would have the effect, or likely effect, of substantially lessening competition in a market. The ACCC administers and enforces the merger provisions under Part IV of the Act.
During 2013−14 the ACCC completed public reviews of two fuel-related acquisitions. In October 2014 it finalised its decision on a third.
Peregrine acquisition of BP retail sites in South Australia
In May 2014 the ACCC announced its decision to not oppose the proposed acquisition by Peregrine of a number of BP sites in South Australia, after accepting a court-enforceable undertaking.
On 15 May 2013 the ACCC commenced a review of Peregrine Corporation’s (which operates under the trading name of On The Run) proposed acquisition of 25 BP Australia petrol retail sites in South Australia, 16 of which were located in metropolitan Adelaide with the remainder in regional South Australia.
On 8 May 2014 the ACCC announced its decision to not oppose the proposed acquisition by Peregrine, after accepting a court-enforceable undertaking. The undertaking required Peregrine to divest itself of three sites that it would otherwise have acquired from BP (BP Elizabeth Vale, BP Mile End, BP Westbourne Park) and one of its existing sites (On The Run South Plympton). The ACCC was concerned that Peregrine’s acquisition of these sites could have resulted in higher fuel prices.
In addition to considering the impact of the acquisition in particular local areas, the ACCC also considered the impact of the acquisition on rivalry between Peregrine and other petrol retail chains that occurs on an Adelaide-wide basis. The ACCC noted that the acquisition would significantly increase Peregrine’s presence in Adelaide but concluded that this particular acquisition would not substantially lessen Adelaide-wide competition.
On 8 May 2014 the ACCC also announced that it would oppose the proposed acquisition by Peregrine of Caltex Australia’s retail petrol station site in the Adelaide suburb of Fullarton. Peregrine had proposed to acquire this site from Caltex as part of the arrangements to address the competition concerns with its acquisition of sites from BP. The ACCC opposed the proposed acquisition of Caltex Fullarton because Caltex Fullarton appeared to compete closely with BP Glenunga (which Peregrine was also acquiring from BP) and other nearby Peregrine petrol stations. The proposed acquisition of Caltex Fullarton would have eliminated this close competition.
Caltex acquisition of Scotts Transport fuel division
In May 2014 the ACCC decided not to oppose the proposed acquisition by Caltex of Scotts Transport fuel division, subject to a court-enforceable undertaking.
On 27 February 2014 the ACCC commenced a review of Caltex’s proposed acquisition of the fuel division of the Scotts Group of Companies. This included 27 retail service stations, eight depots with depot fronts/unmanned card facilities, 12 depots, one unmanned card facility and one kerbside pump in NSW, South Australia and Victoria. On 21 May 2014 the ACCC decided to not oppose the proposed acquisition, subject to a court-enforceable undertaking which required Caltex to divest certain retail sites in Mt Gambier and Nhill.
The ACCC considered that, absent the undertaking, the proposed acquisition would have resulted in competition concerns in the local Mt Gambier and Nhill retail markets. Without the divestitures, Caltex would have controlled the majority of the retail fuel sites in Mt Gambier. In Nhill Caltex would have controlled two of the three retail sites. In both towns the ACCC concluded that absent the undertaking the remaining independent retail sites would not have provided a strong competitive constraint on Caltex.
Monitoring of the Australian petroleum industry December 2014 xxi

In relation to wholesale markets, the ACCC concluded that in each of the relevant areas (Mt Gambier, Griffith, Warrnambool and Horsham) post-acquisition, Caltex would face effective constraint from rival distributors operating from depots located in the relevant area. The ACCC also considered that barriers to entry and expansion in the relevant markets were relatively low and, in particular, that a rival depot operator could install an above ground storage tank at a low cost and in a timeframe sufficient to provide a constraint on Caltex.
Viva Energy acquisition of an interest in Liberty Oil
In October 2014 the ACCC announced its decision to not oppose the proposed acquisition by Viva Energy of an interest in Liberty Oil.
On 2 September 2014 the ACCC commenced a review of Viva Energy Australia Ltd’s proposed acquisition of an interest in Liberty Oil Holdings Pty Ltd. Since August 2014 Viva has owned the majority of the assets of the former Shell Australia downstream fuel business. Because the interest in Liberty could, in certain circumstances, amount to a controlling interest, the ACCC analysed the proposed acquisition as if Viva proposed to acquire a controlling interest in Liberty. On 28 October 2014 the ACCC announced its decision to not oppose the proposed acquisition by Viva.
The ACCC considered the likely effects of the proposed acquisition on competition at both the wholesale and retail levels of the industry. The ACCC considered whether the proposed acquisition would reduce competition in fuel retail markets, due to Liberty being a major wholesale supplier to independent retailers. However, the ACCC did not consider that the proposed acquisition would significantly reduce the wholesale supply choices available to independent retailers, as Viva’s presence in wholesale supply to independents was small, and there were other large independent wholesalers including United and Puma Energy. The ACCC noted that Liberty, unlike United and Puma Energy, did not own any fuel import terminals.
While neither Viva nor Liberty conducted its own fuel retailing operations (apart from some limited specialty operations), the ACCC considered whether Viva’s incentives in supplying Liberty-branded retailers would be different from Liberty’s incentives. The ACCC noted that a key incentive for Viva was likely to be to sell sufficient volumes of fuel to ensure that its Geelong refinery remains viable.
The ACCC also considered the likely effect of the proposed acquisition on competition in the supply and distribution of fuels to commercial customers (e.g. transport companies, mining companies and farmers), but did not identify significant competition concerns. The ACCC noted that Liberty was active in supplying farmers and other rural customers but Viva was not. Viva’s business concentrated on supply to larger industrial customers including mining companies.
Administration of the OilcodeThe Oilcode came into effect on 1 March 2007 as a prescribed industry code of conduct under the Act. It aims to regulate the conduct of suppliers, distributors and retailers in the downstream petroleum retail industry. The Oilcode encourages greater transparency of terminal gate pricing and fuel re-selling agreements, while providing greater certainty for industry participants regarding the supply of petroleum products and tenure under fuel reselling agreements. It also provides an effective and relatively inexpensive method to resolve disputes between suppliers, distributors or retailers.
The ACCC’s role is to ensure compliance with the Oilcode and the Act by informing downstream petroleum industry participants of their rights and obligations under the law and by enforcing the law where necessary.
xxii Monitoring of the Australian petroleum industry December 2014

Informing consumers
In 2013−14 the petrol price cycle page on the ACCC website—which provides information about the current state of the price cycle in the five largest cities—was the most visited page.
The ACCC aims to inform consumers on what influences domestic retail fuel prices by providing a range of consumer and industry stakeholder information on the ACCC website, and responding to media enquiries and calls to the ACCC Infocentre. Throughout 2013−14 the ACCC expanded and reviewed its public information activities to provide a broad range of information to consumers.
The petrol price cycle page on the ACCC’s website provides information about the current state of the price cycle in the five largest cities (i.e. Sydney, Melbourne, Brisbane, Adelaide and Perth). It was the most-visited page on the ACCC website in 2013−14, receiving around 270 000 hits.
Prior to 30 June 2014 the ACCC obtained retail fuel price data from Informed Sources. However, the contract with Informed Sources ceased on that day. The ACCC has since obtained its retail fuel price data from FUELtrac. There was a period between July and November 2014 when the ACCC did not provide petrol price cycle data on its website, while arrangements with FUELtrac were being finalised. During this time the ACCC continued to get information from the petrol companies for the purposes of its monitoring program.
Stakeholder engagementIn addition to on-going liaison with key stakeholders as a part of its broader role, the ACCC formally consulted with fuel industry and consumer groups through its Fuel Consultative Committee (FuelCC).
The FuelCC met on two occasions in 2013−14 and discussed a number of issues including: ACCC enforcement activities; industry consolidation and the sale of significant refining assets; availability of pricing information to consumers; state government mandates on biofuels; and consumer concern about capital city price cycles.
In addition to meetings of the FuelCC and efforts to increase consumer understanding about fuel prices, the ACCC engaged with consumer groups and motoring organisations to address concerns raised about the conduct of petrol retailers which affect consumers.
In particular, in 2013−14 the ACCC engaged with the Australian Automobile Association and most of its constituent members, the Australasian Convenience and Petroleum Marketers Association, the Australian Institute of Petroleum, the Service Stations Association, and the Biofuels Association of Australia.
Petrol prices in 2013−14
Retail price movements
Annual average retail RULP prices in 2013–14 were historically high.
The annual average retail price of regular unleaded petrol (RULP) in the five largest cities in 2013–14 was 150.6 cpl.1 This was the third highest on record in real terms.
In nominal terms, annual average retail petrol prices were 9.3 cpl higher than in 2012–13 and were the highest nominal prices on record.
1 This report focuses on regular unleaded petrol (RULP) because it represents around 59 per cent of petrol sold in Australia (the remainder being premium unleaded petrol (PULP, around 28 per cent) and ethanol blended petrol (EBP, i.e. petrol containing ethanol— the most common of which is E10—around 13 per cent). See charts 18 and 19. Unless otherwise specified, petrol refers to RULP.
Monitoring of the Australian petroleum industry December 2014 xxiii

This can be seen in chart 1, which shows annual average retail petrol prices in the five largest cities, in both nominal and real terms, over the past 15 years.
Chart 1 Annual average retail petrol prices in the five largest cities—nominal and real terms: 1999−2000 to 2013−14
0
20
40
60
80
100
120
140
160
180
2013
–14
2012
–13
2011
–12
2010
–11
2009
–10
2008
–09
2007
–08
2006
–07
2005
–06
2004
–05
2003
–04
2002
–03
2001
–02
2000
–01
1999
–00
cpl
Five largest cities—real Five largest cities—nominal
Source: ACCC calculations based on Informed Sources data and Australian Bureau of Statistics (ABS), 6401.0 Consumer Price Index, Australia, June 2014, TABLES 1 and 2. CPI: All Groups, Index Numbers and Percentage Changes, 23 July 2014.
Note: Real values in 2013−14 dollars.
The chart shows that:
• in nominal terms, annual average petrol prices have been trending upwards and have almost doubled since 1999–00 when they were 77.5 cpl—they have been over one dollar per litre since 2004−05
• in real terms, annual average prices in 2013−14 were the third highest on record, after 2007−08 (157.3 cpl) and 2005−06 (151.1 cpl).
In 2013–14 volatility in daily petrol prices was lower than in previous years.
The degree of petrol price volatility in 2013−14 was lower than in previous years. The range between the highest and lowest seven-day rolling average retail petrol prices in 2013−14 was 19 cpl, compared with a range of 23 cpl in 2012−13 and 22 cpl in 2011−12.2
This is shown in chart 2, which shows seven-day rolling average retail petrol prices in the five largest cities over the period 1 July 2011 to 30 June 2014.
2 A seven-day rolling average price is the average of the current day’s price and the prices on the six previous days. Traditionally, the ACCC has used a seven-day rolling average to smooth out the influence of the regular petrol price cycles in the five largest cities on price movements. This has been less effective in recent years because the duration of price cycles in most of these cities has become greater than seven days.
xxiv Monitoring of the Australian petroleum industry December 2014

Chart 2 Seven-day rolling average retail petrol prices, five largest cities: 1 July 2011 to 30 June 2014
Jul-
11
Sep
-11
Nov
-11
Jan-
12
Mar
-12
May
-12
Jul-
12
Sep
-12
Nov
-12
Jan-
13
Mar
-13
May
-13
Jul-
13
Sep
-13
Nov
-13
Jan-
14
Mar
-14
May
-14
cpl
Jun-
14 120
130
140
150
160
170
Source: ACCC calculations based on Informed Sources data.
The chart shows that in 2013−14:
• price volatility was generally within a narrow band—on around 82 per cent of days in the year retail petrol prices were within a 10.0 cpl range, between 145.0 cpl and 155.0 cpl
• prices reached a peak of 159.0 cpl in January 2014 – while this was the highest price over the three year period, it was 3.5 cpl below the record
high nominal levels reached in July 2008 of 162.5 cpl.
Determinants of retail petrol price movements
Movements in retail petrol prices are primarily due to changes in the international price of refined petrol and the AUD–USD exchange rate.
Movements in retail petrol prices in Australia are primarily influenced by two factors. These are:
• movements in the international price of refined petrol (which itself is driven by the price of crude oil), and
• the AUD–USD exchange rate (as the international prices of crude oil and refined petrol are expressed in US dollars).
In the short-run, in the larger capital cities and in a small number of regional locations, retail prices are also influenced by the regular price cycles that occur in those locations.
Fundamentally, retail petrol prices in Australia were high in 2013−14 because the international prices of refined petrol were at historically high levels, combined with a lower AUS–USD exchange rate.
Chart 3 shows how closely retail petrol prices have tracked movements in international refined petrol prices (in Australian cents per litre) over the last 15 years. The chart shows annual average retail petrol prices in the five largest cities and the annual average price of the relevant international refined petrol benchmark (Singapore Mogas 95 Unleaded (Mogas 95)) in real terms. It also shows annual average retail petrol prices excluding excise and the goods and services tax (GST).
Monitoring of the Australian petroleum industry December 2014 xxv

Chart 3 Annual average retail petrol prices in the five largest cities and annual average Mogas 95 prices: real terms: 1999−2000 to 2013−14
0
20
40
60
80
100
120
140
160
180
2013
–14
2012
–13
2011
–12
2010
–11
2009
–10
2008
–09
2007
–08
2006
–07
2005
–06
2004
–05
2003
–04
2002
–03
2001
–02
2000
–01
1999
–00
cpl
Five largest cities Mogas 95Five largest cities less GST and taxes
Source: ACCC calculations based on data from Informed Sources, Platts and ABS, 6401.0 Consumer Price Index, Australia, June 2014, TABLES 1 and 2. CPI: All Groups, Index Numbers and Percentage Changes, 23 July 2014.
Note: Real values in 2013−14 dollars.
The chart shows that:
• retail petrol prices are strongly influenced by the level of, and changes in, international refined petrol prices over time
• excise and the GST represent a significant proportion of the final retail price.
The price of Mogas 95 is the relevant international benchmark used for domestic pricing of petrol in Australia. Singapore benchmark prices are used for pricing petrol in Australia due to Singapore being one of the world’s most important trading and refining centres and its proximity to Australia.
Movements in the price of Mogas 95 and in the AUD–USD exchange rate in 2013−14 are discussed in more detail further on.
International comparisons
By international standards Australia’s petrol prices are comparatively low, due to relatively low fuel taxes.
Compared with other developed countries Australia’s retail petrol prices are relatively low.
Chart 4 shows the retail price of petrol—both including and excluding taxes—among countries in the Organisation for Economic Co-operation and Development (OECD) in the June quarter 2014. It shows that Australia had the fourth lowest retail petrol prices in the OECD.
The main determinant of lower retail petrol prices in Australia is Australia’s relatively low rate of taxation on fuel. In the June 2014 quarter taxes represented around 34 per cent of the retail price of petrol in Australia, compared with an OECD average of around 50 per cent. Taxes as a percentage of the retail petrol price in OECD countries ranged from a high of around 62 per cent in the Netherlands, Finland and the UK to a low of around 14 per cent in the US and Mexico. When
xxvi Monitoring of the Australian petroleum industry December 2014

retail prices are compared without the tax component, Australia ranks close to the average of OECD countries (the red line in the chart).
Chart 4 Petrol prices and taxes in OECD countries: Australian cents per litre, June quarter 2014
0 25 50 75 100 125 150 175 200 225 250 275 300
United States
Mexico
Canada
Australia
Japan
Poland
Korea
Luxembourg
New Zealand
Austria
Czech Republic
Hungary
Spain
Slovak Republic
France
Ireland
United Kingdom
Portugal
Germany
Belgium
Sweden
Finland
Greece
Denmark
Netherlands
Italy
Turkey
Norway
cplPrice less tax Tax component Average price less tax
156.8
154.4
150.0
152.9
134.4
141.3
142.8
134.3
128.4
129.8
125.5
135.9
125.5
125.5
109.6
102.4
100.8
103.5
103.8
81.7
90.9
91.1
91.4
67.8
51.8
40.5
14.0
15.0
108.5
103.1
98.1
90.9
103.4
95.2
89.4
97.1
102.4
96.6
96.6
86.0
95.2
93.7
99.5
102.4
95.4
92.1
90.9
105.6
96.6
95.9
91.1
101.0
99.0
90.0
87.6
85.8
Source: Bureau of Resources and Energy Economics (BREE), Australian Petroleum Statistics, Issue 215, June 2014.
Notes: The average petrol price less tax in OECD countries was 96.0 cpl in the June quarter 2014.
Care must be taken when making international comparisons as fuel quality standards (e.g. octane rating and the content of MTBE and sulphur) for the most commonly used form of petrol in each market differ between countries.
Monitoring of the Australian petroleum industry December 2014 xxvii

Petrol price cycles
Retail petrol prices in the five largest cities in Australia move in cycles. Price cycles do not generally occur in Canberra, Hobart and Darwin, or in most regional locations.
Retail petrol prices in the five largest cities in Australia move in cycles.3 These price cycles do not generally occur in Canberra, Hobart and Darwin, or in most regional locations.
Price cycles occur as a result of the pricing policies of fuel retailers and only occur at the retail level. Wholesale prices do not exhibit similar cyclical movements.
They are of concern to many consumers due to the large price increases that occur in a single day, and across most retail sites, on a broadly regular basis. Many consumers try to take advantage of the bottom of the price cycle to buy petrol at relatively low prices.
Price cycles are illustrated in chart 5 which shows daily average retail petrol prices in the five largest cities from 1 May to 31 May 2014.
Chart 5 Daily average retail petrol prices in the five largest cities: 1 May to 31 May 2014
cpl
135
140
145
150
155
160
165
29 May22 May15 May8 May1 May
BrisbaneMelbourne PerthAdelaideSydney
Source: ACCC analysis based on FUELtrac data.
The duration of petrol price cycles in most cities is now longer than two weeks. However, in Perth they occur on a regular weekly basis.
3 A petrol price cycle is a movement in price from a trough to a peak to a subsequent trough. See chart 8.1 in chapter 8 which illustrates the elements of a price cycle. The ACCC defines a price cycle as having occurred when the increase in price from the trough to the peak is 3 per cent or more of the trough price, and the decrease in price to the subsequent trough is also 3 per cent or more of the initial trough price. A price cycle increase is the increase in price from the initial trough to the peak. Petrol price cycles are discussed in more detail in chapter 8.
xxviii Monitoring of the Australian petroleum industry December 2014

A feature of petrol price cycles in recent years has been the increase in, and variability of, the duration of price cycles in most cities.4 In contrast, price cycle durations in Perth have become increasingly stable over this time.
In each of the eastern capital cities (i.e. Sydney, Melbourne, Brisbane and Adelaide) the average duration of price cycles in 2009 was seven days. By the first half of 2014 it had increased significantly—the average price cycle lasted over 18 days in Sydney, Melbourne and Brisbane, and over 15 days in Adelaide. In contrast, in Perth the average price cycle duration decreased from around nine days in 2009 to seven days in 2011, and has remained at seven days since then.
Longer petrol price cycles in the eastern capital cities may have an adverse impact on price-sensitive consumers.
Longer price cycles may have an adverse impact on price-sensitive consumers. A significant proportion of Australian motorists purchase petrol on a weekly basis. Therefore, when price cycles are roughly a week in duration, motorists can try to take advantage of them by timing their weekly purchase at or near the trough price. However, when price cycles become significantly longer—as they currently are in the eastern capital cities—motorists cannot do this and may have to fill up when prices are relatively higher.
It is often claimed that retail petrol prices always increase before public holidays, and in particular long weekends. ACCC analysis indicates that, over the last five years, the size of price cycle increases before public holidays was on average no larger than the size of price increases at any other time of the year.
Other grades of petrol
Retail prices of RULP, PULP 95 and 98, and E10 generally move in a similar manner.
The retail prices of the different grades of unleaded petrol—RULP, premium unleaded petrol (PULP) 95 and 98, and E10 (i.e. RULP containing up to 10 per cent ethanol)—tend to move in a similar manner.
Chart 6 shows monthly average retail prices for these four grades of petrol in the five largest cities in 2013−14.
4 The duration of a price cycle is the number of days from trough to subsequent trough.
Monitoring of the Australian petroleum industry December 2014 xxix

Chart 6 Monthly average retail prices of RULP, PULP 95, PULP 98 and E10 in the five largest cities: July 2013 to June 2014
cpl
PULP 95 PULP 98E10 RULP
Jun-
14
May
-14
Ap
r-14
Mar
-14
Feb
-14
Jan-
14
Dec
-13
Nov
-13
Oct
-13
Sep
-13
Aug
-13
Jul-
13
130
135
140
145
150
155
160
165
170
175
Source: ACCC calculations based on Informed Sources data.
Retail prices of the different grades of petrol move in a similar manner. Retailers generally set the price of the two grades of PULP and E10 at a fixed margin to RULP. They will adjust this margin from time to time reflecting changes in international benchmark differentials, local supply and demand, and other factors.
In 2013−14, in the five largest cities, the annual average price differential between:
• RULP and PULP 95 was 10.6 cpl (an increase of 0.2 cpl from 2012−13)
• RULP and PULP 98 was 16.3 cpl (an increase of 0.9 cpl)
• E10 and RULP was 3.1 cpl (an increase of 0.4 cpl).
International price movementsAs noted earlier, movements in retail petrol prices in Australia are primarily influenced by two factors. These are:
• movements in the international price of refined petrol (which itself is driven by the price of crude oil) and
• the AUD–USD exchange rate.
International price of refined petrol
The relevant international benchmark price for petrol in Australia is the price of refined petrol in the Asia-Pacific region, the price of Singapore Mogas 95 Unleaded.
The price of refined petrol in Australia is set with reference to international benchmark prices. The relevant international benchmark price for petrol in Australia is the price of refined petrol in the Asia-Pacific region, the price of Singapore Mogas 95 Unleaded (Mogas 95).
Chart 7 shows movements in weekly average Mogas 95 prices in USD per barrel over the period July 2011 to June 2014.
xxx Monitoring of the Australian petroleum industry December 2014

Chart 7 Weekly average Mogas 95 prices: July 2011 to June 2014
USD
per bl
80
90
100
110
120
130
140
150
160
Jul-
11
Aug
-11
Sep
-11
Oct
-11
Nov
-11
Dec
-11
Jan-
12
Feb
-12
Mar
-12
Ap
r-12
May
-12
Jun-
12
Jul-
12
Aug
-12
Sep
-12
Oct
-12
Nov
-12
Dec
-12
Jan-
13
Feb
-13
Mar
-13
Ap
r-13
May
-13
Jun-
13
Jul-
13
Aug
-13
Sep
-13
Oct
-13
Nov
-13
Dec
-13
Jan-
14
Feb
-14
Mar
-14
Ap
r-14
May
-13
Jun-
14
Source: ACCC calculations based on Platts data.
The chart shows that weekly average Mogas 95 prices were relatively stable in 2013−14, largely being in a USD 10 band between USD 115 per barrel and USD 125 per barrel. Prices were significantly more volatile in the two previous years.
Over 2013−14 weekly average Mogas 95 prices were influenced by a range of factors:
• In the first half of July 2013 Mogas 95 prices increased by around USD 7 per barrel influenced by increases in regional demand, tightening of regional supply and increases in crude oil prices due to geopolitical concerns over Syria. Subsequently, they decreased by around USD 11 per barrel as regional demand fell amid an increase in gasoline stock levels.
• From mid-August to early-September 2013 Mogas 95 prices recovered by around USD 6 per barrel to a peak of around USD 121 per barrel as crude prices increased due to increased tensions in Syria. From then until early-November 2013 Mogas 95 prices decreased by around USD 10 per barrel to a trough of around USD 112 per barrel. This mirrored falls in crude oil prices due to an easing of tensions in Syria, high oil inventories in the US and a resolution to North Sea oil supply issues.
• From early-November 2013 to the end of June 2014 Mogas 95 prices trended upwards due to strong demand for refined petrol in the Asia-Pacific region and higher crude prices influenced by conflicts in the Middle East and Ukraine.
The annual average Mogas 95 price in 2013−14 was around USD 119 per barrel. This was USD 2 per barrel below the annual average price in 2012−13 (USD 121 per barrel) and USD 4 per barrel below the highest ever level of USD 123 per barrel (in nominal terms) in 2011−12.
Crude oil
Crude oil prices remained high in 2013−14. The annual average price of Brent crude oil was around USD 110 per barrel. This was slightly higher than in 2012−13 and was the second highest nominal annual average price of Brent crude oil on record.
Crude oil is the major input into the production of refined petrol and accounts for a significant proportion of total refinery costs. As such, world crude oil prices are a major influence on international benchmark prices of refined petrol and in turn on domestic retail petrol prices.
Monitoring of the Australian petroleum industry December 2014 xxxi

There are a number of international benchmark prices of crude oil. The two benchmarks generally used in Australia are:
• Tapis crude oil—a Malaysian light sweet crude oil, which is used in the Asia-Pacific region
• Brent crude oil—a light sweet crude oil from the North Sea. It is probably the most widely used benchmark on global markets.
Another crude oil benchmark used internationally is West Texas Intermediate (WTI) crude oil, which is a light sweet crude oil priced out of Cushing, Oklahoma. Due to the unique supply situation at Cushing (which is land-locked and has limited infrastructure to transport supplies to major refining centres), the ACCC has previously stated that the price of WTI was not representative of broader global demand and supply conditions and, as a result, could not be considered a relevant crude oil benchmark for countries in the Asia-Pacific region. In addition, WTI is not exported from the United States.
As is the case with refined petrol, crude oil is an internationally traded commodity with its own supply and demand characteristics. As such, it is possible that from time to time movements in crude oil and refined petrol prices may not precisely mirror each other. Factors that impact on crude oil markets include the levels of (and sudden changes in) economic growth, regional conflicts, levels of inventories, extreme climatic conditions and general confidence levels.
On an historical basis, crude oil prices remained high in 2013−14, with the annual average price of Brent crude oil being around USD 110 per barrel. This was slightly higher than in 2012−13 (around USD 109 per barrel) and was the second highest nominal annual average price of Brent crude oil on record, behind 2011−12 (around USD 113 per barrel).
The strong upwards long-term trend in real prices since the late 1990s can be seen in chart 8 which shows monthly average Brent crude oil prices since July 1994.
Chart 8 Monthly average Brent crude oil prices in nominal and real terms: July 1994 to June 2014
USD
per bl
0
20
40
60
80
100
120
140
160
20142013201220112010200920082007200620052004200320022000199919981997199619951994 2001
Brent (real)Brent (nominal)
Source: ACCC calculations based on Platts data and U.S. Department of Labor, Bureau of Labor Statistics, Consumer Price Index for all urban consumers, www.dlt.ri.gov/lmi/pdf/cpi.pdf, accessed on 24 September 2014.
Note: Real values in 2013−14 dollars.
xxxii Monitoring of the Australian petroleum industry December 2014

AUD–USD exchange rate
The average AUD–USD exchange rate in 2013−14 was USD 0.92. This was USD 0.11 lower than in 2012−13. If the exchange rate in 2013−14 had remained at 2012−13 levels, retail petrol prices in Australia would have been around 10 cpl lower.
The AUD–USD exchange rate is an important influence on domestic retail petrol prices because the international benchmark prices of refined petrol are expressed in US dollars.
In 2013−14 the daily AUD–USD exchange rate ranged from a high of USD 0.97 in October 2013 to a low of USD 0.87 in January 2014.
The average AUD–USD exchange rate in 2013−14 was USD 0.92. This was USD 0.11 lower than in 2012−13 (USD 1.03) and was the lowest annual exchange rate since 2009−10 (USD 0.88).
If the AUD–USD exchange rate in 2013−14 had been at the same level as it was in 2012−13, retail petrol prices in 2013−14 would have been on average around 10 cpl lower.
Retail petrol prices in regional locations
Retail petrol prices in regional locations in Australia are typically higher than those in the capital cities. In 2013–14, 94 per cent of the regional locations monitored by the ACCC had higher annual average petrol prices than their respective capital city.
Retail petrol prices in regional locations in Australia are typically higher than those in the capital cities, although they generally tend to follow the same overall price movements.
In 2013–14, of the 173 regional locations for which petrol price data was reliably available, 162 regional locations (94 per cent) had higher annual average petrol prices than their respective capital city.
Furthermore, in many regional locations there is a lag between movements in capital city prices and local prices. This lag arises because the turnover of petrol stocks is generally lower in the country than in the capital cities due to lower volume of sales in regional areas. As a result, price changes in the five largest cities often take longer to be passed on to regional locations. This lag occurs both when prices are increasing and when they are decreasing.
Petrol prices in regional locations are generally higher than in the five largest cities for a number of reasons, including:
• a lower level of local competition, often reflecting the lower number of retail sites
• lower volumes of fuel sold
• distance/location factors
• lower convenience store sales.
These factors also explain differences in petrol prices between regional locations.
Chart 9 shows seven-day rolling average retail prices in all the monitored regional locations in Australia in aggregate and daily average retail prices in the five largest cities from 1 July 2013 to 30 June 2014.
Monitoring of the Australian petroleum industry December 2014 xxxiii

Chart 9 Seven–day rolling average petrol prices in the five largest cities and the regional locations in aggregate: 1 July 2013 to 30 June 2014
cpl
130
135
140
145
150
155
160
165
170
175
180
Jun-14May-14Apr-14Mar-14Feb-14Jan-14Dec-13Nov-13Oct-13Sep-13Aug-13Jul-13
Regional locationsFive largest cities
Source: ACCC calculations based on Informed Sources data.
It can be seen that:
• prices in the regional locations in aggregate broadly follow prices in the five largest cities
• regional locations in aggregate do not have the regular retail price cycles that are evident in the five largest cities
• prices in the regional locations in aggregate were generally higher than those in the five largest cities.
Costs in 2013−14
In 2013−14 the international benchmark price of refined petrol and taxes accounted for around 88 per cent of the annual average retail price of petrol.
As Australian petrol prices are not regulated, local petrol companies have discretion in determining their retail prices. However, the two largest components of the pump price of petrol—the international benchmark price and taxes (excise and GST)—are outside the control of local petrol companies.
The same applies for diesel and automotive liquefied petroleum gas (LPG) prices—although in the case of LPG the level of excise (10.0 cpl in 2013−14 and 12.5 cpl from 1 July 2014) is much lower than for petrol and diesel (38.143 cpl in 2013−14).
In 2013−14 the international benchmark price of refined petrol and taxes accounted for around 88 per cent of the annual average retail price of petrol in the five largest cities. That is, out of an annual average retail price of 150.6 cpl, 133.2 cpl is directly attributable to the cost of refined petrol and taxes (see chart 10).
For diesel, these two components accounted for 87 per cent of the annual average bowser price (see chart 11).
xxxiv Monitoring of the Australian petroleum industry December 2014

For LPG, the international benchmark price and taxes account for 82 per cent, in part reflecting the lower level of excise on LPG and higher transport and storage costs relative to petrol and diesel (see chart 12).
Other costs and margins therefore account for around 17 cpl of the retail price of petrol, 20 cpl for diesel and 15 cpl for LPG. This amount covers a number of costs including transport and freight, salaries, repair and maintenance, storage and terminal costs.
Chart 10 Nominal components of Australian retail petrol prices in the five largest cities: 2013−14
Other costs and marginsTaxesMogas 95
PETROL150.6 cpl
cpl %
17.3 12
51.8 34
81.5 54
Source: ACCC calculations based on Informed Sources, Platts and RBA data.
Monitoring of the Australian petroleum industry December 2014 xxxv

Chart 11 Nominal components of Australian retail diesel prices in the five largest cities: 2013−14
Other costs and marginsTaxesGasoil 10 ppm
DIESEL157.8 cpl
cpl %
20.0 13
52.4 33
85.4 54
Source: ACCC calculations based on Informed Sources, Platts and RBA data.
Chart 12 Nominal components of Australian retail LPG prices in the five largest cities: 2013−14
Other costs and marginsTaxesSaudi CP
LPG83.0 cpl
cpl %
15.0 18
15.0 18
53.0 64
Source: ACCC calculations based on Informed Sources, Gas Energy Australia and RBA data.
xxxvi Monitoring of the Australian petroleum industry December 2014

Taxes as a proportion of the retail petrol price
Over the last 15 years the proportion of the average retail price of petrol that is made up of taxes has been steadily decreasing—from around 56 per cent in 1999−2000 to around 34 per cent in 2013−14.
Chart 13 shows the proportion of the annual average retail petrol price in the five largest cities accounted for by taxes in each of the 15 years between 1999−2000 and 2013−14.
Chart 13 Taxes as a percentage of the annual average retail petrol price in the five largest cities: 1999−2000 to 2013−14
per cen
t
20
30
40
50
60
70
1999
–00
2000
–01
2001
–02
2002
–03
2003
–04
2004
–05
2005
–06
2006
–07
2007
–08
2008
–09
2009
–10
2010
–11
2011
–12
2012
–13
2013
–14
Source: ACCC calculations based on Informed Sources and Parliamentary Library Research Brief, 13 April 2006, no.15, 2005−06, Excise Taxation: developments since the mid-1990s.
The chart shows that over the 15 year period, the percentage of the final retail price that is made up of taxes has been steadily decreasing—from around 56 per cent in 1999−2000 to around 34 per cent in 2013−14.
Excise currently accounts for around 25 per cent of the final retail price of petrol and the GST accounts for around 9 per cent.
ExciseThere are two main reasons for levying excise on petrol: to raise revenue and to recover from road users the costs they impose on society.5 Excise was first imposed on petrol in 1929. Up until 1959 the revenue from petrol excise was hypothecated for Commonwealth road grants to the states. More recently, excise has tended to be regarded as a source of general revenue.6
In general, except for road tolls, drivers of cars do not pay directly for their use of roads. Heavy vehicles pay for road use through a fixed annual registration fee and fuel-based road user charges.7 The rebate heavy vehicle users receive for excise excludes an amount of 26.14 cpl, which is an
5 Webb Richard, ‘Petrol and Diesel Excises’, Research paper No.6 2000−01, Department of the Parliamentary Library, p. i.
6 Ibid, pp. 6–7.
7 See http://www.ntc.gov.au/heavy-vehicles/charges.
Monitoring of the Australian petroleum industry December 2014 xxxvii

explicit road user charge. For off-road fuel use, there is a full rebate of the excise. Apart from these instances, excise can be regarded as a proxy for the cost of road use because the amount of excise paid by a motorist through fuel consumption is related to road use. However, it is an inefficient mechanism for cost recovery because the amount of excise paid is not related to the social costs of road use.8 To the extent that more efficient road user charges can be imposed by alternative mechanisms, it would be possible to reduce the level of excise.
In the 2014−15 Budget the Australian Government announced that it would reintroduce biannual indexation by the Consumer Price Index (CPI) of excise and excise-equivalent customs duty for all fuels except aviation fuels.9 It was the Australian Government’s intention that the biannual indexation would commence from 1 August 2014.
Automatic twice-yearly indexation of excise on petrol began in 1983−84. It occurred each year on 1 February and 1 August. The indexation was based on the movements in the CPI over the previous six months. The automatic indexation of excise stopped in March 2001 and the excise rate remained at 38.143 cpl.
On 28 October 2014 the government announced that it had decided to give practical effect to the fuel excise indexation Budget measure by way of tariff proposals to be validated by Parliament within 12 months.10 These tariff proposals took effect from 10 November 2014. From that date, the rate of fuel excise increased from 38.143 cpl to 38.6 cpl—an increase of 0.457 cpl. This is the rate which would have applied if relevant legislation had been passed by Parliament prior to 1 August 2014. Indexation of fuel excise will return to biannual CPI indexation from 1 February 2015.
Build-up of retail petrol prices
The build-up of retail petrol prices in 2013−14 indicates that the price is fundamentally driven by movements in the international price of crude oil.
Chart 14 shows the build-up of the annual average retail petrol price in the five largest cities in 2013−14 according to the relevant sector of the industry.
The chart highlights that the starting point in the retail petrol price is the price of crude oil. It also indicates that, since the other largest component of the retail price of petrol is excise (which was fixed at 38.143 cpl), movements in the price of petrol are fundamentally driven by the movements in the international price of crude oil.
8 Webb, ibid, p. 5 and p. i.
9 Australian Government (2014), Budget measures: budget paper no. 2: 2014–15, p. 17.
10 Media Release, Senator the Hon. Mathias Cormann, Minister for Finance MC 107/14, 28 October 2014, Implementation Arrangements for Fuel Excise Indexation Over Next 12 Months.
xxxviii Monitoring of the Australian petroleum industry December 2014

Chart 14 Build-up of Australian retail petrol prices—five largest cities: 2013−14
Crude oil+
Refining costsand margins
(= refined petrol)+
Other costs, such as wharfage,shipping,
insurance (=IPP)+
Excise+
Wholesale GST(=TGP)
+
Retail GST+
Retail costsand margins
(= final bowser price)
cpl
Wholesale costs and
margins+
0
20
40
60
80
100
120
140
160
78.2 78.2 78.2 78.2 78.2 78.2 78.2 78.2
3.3 3.3
5.0 5.0 5.0 5.0 5.0 5.04.9 4.9 4.9 4.9 4.9
38.1 38.1 38.1 38.1
13.0 13.0 13.00.7 0.7
7.4
3.3 3.3 3.3 3.3 3.3
International component Wholesale component Retail component
Source: ACCC calculations based on Informed Sources, Platts, RBA, WA Fuelwatch and information provided by the monitored companies.
Profits in 2013−14As part of its monitoring and analysis of the downstream petroleum industry, the ACCC collects extensive financial information from the four refiner-wholesalers and major independent wholesalers and retailers. Information collected for the period from 2002–03 to 2013−14 was analysed to estimate the profitability of each sector of the downstream petroleum industry—refinery, total supply (which includes refining, along with imports and buy-sell transactions), wholesale and retail.
The downstream petroleum industry derives its income from a variety of sources. These include: the refining of crude oil into a suite of automotive fuels and other products; revenue from the on-selling of these refined products to the commercial sector; revenue from the on-selling of fuel to the public; and revenue from selling products at convenience stores attached to retail sites.
The ACCC produces estimates of revenues, costs and profits for a number of categories of products and services in the Australian downstream petroleum industry. The ACCC does this on a consolidated basis for the entire downstream petroleum industry, as well as for each sector of the industry.
The main categories are:
• all products and services—this includes any oil based products that are derived from crude oil processed in oil refineries, and other services such as convenience store sales
• petrol products—this includes RULP, PULP and EBP.
As a result of adjustments made for inter-sector transactions by integrated companies, the combined financial results of each of the sectors may not be comparable with estimates for the consolidated performance of the entire downstream industry.
Monitoring of the Australian petroleum industry December 2014 xxxix

Since the ACCC’s monitoring program does not extend to the entire Australian retail petrol sector, it excludes data on the operations of smaller independent retailers. It is therefore not possible to make observations about profits earned by these businesses or the extent to which monitored firms may have taken market share away from firms outside the ACCC’s monitoring program.
Consolidated downstream profits
In 2013−14 net profits on all products and services across all sectors of the downstream petroleum industry were $1.16 billion—an increase of 46 per cent on 2012−13 in real terms.
As in past years, the financial results for the broader downstream petroleum industry in 2013−14 showed that profits in the industry are highly variable.
The financial performance of the downstream petroleum industry is affected by the exposure in certain sectors— mainly refinery and total supply—to international factors. These sectors arrange the importation of crude oil and refined product, and also hold and store product as they coordinate the purchase, sale and distribution of products. As monitored firms report financial data on a historical cost basis, volatile international prices and exchange rates can impact significantly on the financial results for these sectors and the industry.
All products and services
In 2013−14 net profits on all products and services across all sectors of the downstream industry were $1.16 billion.
This was an increase of 46 per cent on 2012−13 ($796 million in real terms) and represented the largest profit reported since 2010−11. However, it was still below the annual average net profit across all sectors and products over the last 12 years of $1.62 billion in real terms.
The increase in net profits from last year was largely due to improvements in the performance of the total supply sector. The refinery sector was profitable in 2013–14 for the first time since 2010–11, while net losses in the other parts of the supply sector decreased.
The total supply sector faces the greatest exposure to international factors—such as price fluctuations and exchange rate movements—because it oversees the importation of crude oil and refined product for the refinery and other downstream sectors. The smaller loss in the total supply sector was partly due to foreign exchange gains of $63 million in 2013−14 compared with real losses of around $225 million in 2012−13.
The wholesale and retail sectors both reported decreasing profits in 2013−14 compared with 2012−13. Wholesale profits in 2013−14 dropped by 6 per cent in real terms to $836 million, and retail profits declined—for the first time since 2008−09—by 10 per cent in real terms to $495 million.
Chart 15 shows downstream petroleum industry real unit net profit for all products and services between 2002–03 and 2013–14. Unit net profit is expressed in cents per litre and is derived by dividing total net profit by total volume. In 2013−14 unit net profit was 1.30 cpl, an increase of 47 per cent on 2012−13 (0.88 cpl).
xl Monitoring of the Australian petroleum industry December 2014

Chart 15 Downstream petroleum industry real unit net profit, all products and services: 2002−03 to 2013–14
–2
–1
0
1
2
3
4
5
2013–142012–132011–122010–112009–102008–092007–082006–072005–062004–052003–042002–03
cpl
Average: 2002–03 to 2013–14
Source: ACCC calculations based on data obtained from firms monitored through the ACCC’s monitoring process; and ABS, 6401.0 Consumer Price Index, Australia, June 2014, TABLES 1 and 2. CPI: All Groups, Index Numbers and Percentage Changes, 23 July 2014.
Note: Real values in 2013–14 dollars.
The chart illustrates that, while downstream real unit net profit has increased in the past two years, it was significantly lower than the annual average real unit net profit over the 12 year period (1.98 cpl).
Petrol products
Total profits on petrol products (RULP, PULP and EBP) across all sectors of the downstream industry were $728 million in 2013−14, compared with $699 million in 2012−13 (an increase of 4 per cent).
Unit net profit on petrol products in 2013−14 was 2.01 cpl, compared with 1.88 cpl in 2012−13.
The volume of petrol products was around 2 per cent lower than in 2012−13 but, as a result of higher retail petrol prices in 2013−14, revenue was higher.
Retail sector profits
In 2013−14 retail sector profits decreased by 10 per cent in real terms to $495 million. This was the first decrease in retail sector profits since 2008−09.
The financial performance of the retail sector since 2005−06 has showed substantial growth with profits increasing by nearly 150 per cent in real terms to 2013−14. These profits were earned on both fuel (i.e. petrol products and other transport fuels, such as diesel and automotive LPG) and convenience store sales. However, in 2013−14 retail profits decreased by 10 per cent in real terms to $495 million, from $549 million in 2012−13. This was the first decrease in retail sector profits since 2008−09.
Profits from the sale of fuel only in the retail sector decreased in 2013−14 by 13 per cent in real terms to $294 million (the first drop in fuel profits since 2008−09). Convenience store profits decreased by over 4 per cent in real terms to $201 million in 2013−14, down from $211 million in 2012−13. This was the first time convenience store profits decreased in the past five years.
Monitoring of the Australian petroleum industry December 2014 xli

Petrol profits (i.e. RULP, PULP and EBP) declined by 11 per cent in real terms in 2013−14 to $271 million. Unit net petrol profit decreased from 2.42 cpl in 2012−13 to 2.22 cpl in 2013−14 (8 per cent in real terms). Chart 16 shows retail sector real unit net profit for petrol products over the period 2005−06 to 2013−14.
Chart 16 Retail sector real unit net profit, petrol products: 2005–06 to 2013–14
0.0
0.5
1.0
1.5
2.0
2.5
3.0
2013–142012–132011–122010–112009–102008–092007–082006–072005–06
cpl
Average: 2005–06 to 2013–14
Source: ACCC calculations based on data obtained from firms monitored through the ACCC’s monitoring process; and ABS, 6401.0 Consumer Price Index, Australia, June 2014, TABLES 1 and 2. CPI: All Groups, Index Numbers and Percentage Changes, 23 July 2014.
Notes: Profits in 2013−14 are not fully comparable with those in previous years because the fuel retailing businesses of the supermarkets were required to fully fund shopper docket discounts from January 2014.
Real values in 2013–14 dollars.
Lower retail sector profits may have been influenced by ACCC undertakings by the supermarkets.
A key feature of retail sector unit net profit for petrol products shown in chart 16 is the decrease in unit net profit in 2013–14. This follows a period of increasing unit net profit since 2008−09.
An important contributor to the decrease in 2013–14 is the change in the way the supermarkets fund their shopper docket fuel discounts. Prior to 1 January 2014 Coles and Woolworths funded a substantial portion of these discounts from their supermarket businesses. Since then, Coles and Woolworths have fully funded their shopper docket fuel discount offers from their fuel retailing businesses. The change in these funding arrangements was the result of undertakings made by Coles and Woolworths to the ACCC.
As noted earlier, the ACCC’s investigation into the shopper docket fuel discount offers of the major supermarkets was completed in December 2013. The ACCC accepted court-enforceable undertakings from Coles and Woolworths that they would voluntarily cease making fuel discount offers which are wholly or partially funded by any part of their business other than their fuel retailing business, and would in addition limit fuel discount offers which are linked to supermarket purchases to a maximum of 4.0 cpl.
xlii Monitoring of the Australian petroleum industry December 2014

The influence of this factor was acknowledged by Wesfarmers in their full year results when they noted that:
…reduced fuel volumes driven largely by the capping of fuel docket discounts, and increased funding of fuel docket discounts, contributed to the reduction in Convenience [i.e. Coles Express] earnings.11
It may also have been the case that expanded shopper docket discounts, by impacting on the incentives and ability of retailers to compete, led to margins being higher than they otherwise would have been, and that that effect has now ended.
Refinery sector profits
In 2013−14 the refinery sector reported net profits of $27 million, an increase of $137 million from losses of $110 million in real terms in 2012−13.
In 2013−14 the refinery sector reported net profits of $27 million, an increase of $137 million from losses of $110 million in real terms in 2012−13. This rebound was partly due to improved performance at some refineries and non-recurring closure costs that only occurred in 2012−13. The last year in which the refinery sector recorded a profit was in 2010–11 ($374 million in real terms).
Chart 17 shows refinery sector real net profits for all petrol products over the period 2002–03 to 2013−14.
Chart 17 Refinery sector net profits in real terms, all products: 2002–03 to 2013−14
–1000
–500
0
500
1000
1500
2000
2500
2013–142012–132011–122010–112009–102008–092007–082006–072005–062004–052003–042002–03
$ million
Average: 2002–03 to 2007–08
Average: 2008–09 to 2013–14
Source: ACCC calculations based on data obtained from firms monitored through the ACCC’s monitoring process; and ABS, 6401.0 Consumer Price Index, Australia, June 2014, TABLES 1 and 2. CPI: All Groups, Index Numbers and Percentage Changes, 23 July 2014.
Note: Real values in 2013–14 dollars.
Two distinct phases of financial performance of the refinery sector can be seen in chart 17. In the six years to 2007–08 the refinery sector recorded annual average net profits of $1.38 billion in real terms. In the subsequent six years, the refinery sector incurred annual average losses of $127 million in real terms.
11 Wesfarmers (2014), 2014 Full-Year Results, 20 August 2014, p. 2. http://www.wesfarmers.com.au/investors/reports-results-presentations.html#results-presentations, accessed on 16 October 2014.
Monitoring of the Australian petroleum industry December 2014 xliii

The refinery sector was generally profitable in the six years leading up to the Global Financial Crisis (GFC) in 2007–08, due to favourable trading conditions, including high refining margins as a result of tight supplies and rising international crude oil and refined petrol prices. In contrast, the period since the GFC has been characterised by a comparatively strong Australian exchange rate relative to the US dollar for most of the period, losses in the values of inventory holdings, and falling refinery margins due to ample availability of refined fuel in the Asia-Pacific region. Furthermore, the smaller and higher-cost refineries in Australia have been finding it increasingly difficult to compete with larger more complex and low cost refineries located overseas.
Developments in the fuel industry in 2013−14As in previous years, the downstream petroleum industry in Australia experienced significant changes in 2013−14. The major changes since July 2013 are outlined below.
Refining and importingIn April 2013 Shell stated its intention to sell its refinery in Geelong before the end of 2014 or convert it into an import terminal.
In February 2014 Shell announced that it had reached a binding agreement to sell its Australian downstream business (which included Shell’s Geelong refinery and 870-site retail business in Australia) to Vitol.12 It also included a brand licence arrangement and an exclusive distributor arrangement in Australia for Shell Lubricants. It did not include the aviation business, or the lube oil blending and grease plants in Brisbane. Vitol completed its acquisition on 13 August 2014 and launched Viva Energy Australia (the trading name of Vitol’s Australian business).13
In April 2014 BP announced its plans to halt refining operations at its Bulwer Island refinery in Brisbane by mid-2015.14 BP commented that the growth of very large refineries in the Asia-Pacific region was driving structural change within the fuels supply chain in Australia and putting huge commercial pressure on smaller scale plants. Against this background BP concluded that the best option for strengthening its long-term supply position in the east coast retail and commercial fuels markets was to purchase product from other refineries.
In August 2014 Caltex Australia announced that it was in the process of converting its Kurnell refinery in Sydney to an import terminal and the refinery closure would commence in October 2014.15 On 14 October 2014 Caltex Australia announced that the Kurnell Terminal had commenced operations, reaching a significant milestone in the $270 million project to convert the historic refinery site to Australia’s largest fuel import terminal.16
In early 2012 there were seven refineries operating in Australia. By mid-2015 Australia will have only four: Geelong and Altona in Victoria, Lytton in Queensland and Kwinana in Western Australia.
12 Shell Australia (2014), Shell agrees sale of downstream businesses in Australia to Vitol, media release, 21 February 2014: http://www.shell.com.au/aboutshell/media-centre/news-and-media-releases/2014/shell-agrees-sale-of-downstream-businesses-in-australia-to-vitol.html, accessed on 11 September 2014.
13 Viva Energy (2014), Vitol completes acquisition of Shell’s Australian Downstream business; Launches Viva Energy Australia, Media release, 13 August 2014: http://www.vivaenergy.com.au/media-centre/news/2014/launch-viva-energy-australia, accessed on 11 September 2014.
14 BP (2014), BP Bulwer Island Refinery: processing to halt, media release, 2 April 2014: http://www.bp.com/en_au/australia/media/media-releases/bulwer-island-refinery-processing-halt.html, accessed on 11 September 2014.
15 Caltex Australia (2014), Marketing & Distribution growth continues; Kurnell refinery to commence shut down in October, ASX/Media release, 25 August 2014: http://www.caltex.com.au/Media%20Items/25%20August%202014%20-%20Marketing%20and%20Distribution%20growth%20continues,%20Kurnell%20refinery%20to%20commence%20shut%20down%20in%20October.pdf, accessed on 11 September 2014.
16 Caltex Australia (2014), Australia’s largest fuel terminal begins service to customers, media release, 14 October 2014 http://www.caltex.com.au/LatestNews/Pages/NewsItem.aspx?ID=13485, accessed on 15 October 2014.
xliv Monitoring of the Australian petroleum industry December 2014

With the closure of domestic refineries more fuel needs to be imported into Australia. Developments relating to terminals in 2013−14 included:
• In April 2014 a new fuel storage terminal (with 85 megalitre (ML) storage capacity) at Outer Harbour, South Australia was launched. The facility is the largest in South Australia, and was a result of about $100 million of combined investment from Terminals Pty Ltd, Caltex and Flinders Ports. Caltex has a 25-year lease with the facility’s owner, Terminals Pty Ltd.17
• In May 2014 Puma Energy launched its newly constructed $70 million fuel import terminal (with 56 ML storage capacity) in Mackay. It commented that the terminal would boost fuel import capabilities in regional Queensland and increase fuel storage capacity in Australia.18
WholesaleIn June 2014 Caltex Australia announced that it had completed its acquisition of the Scott’s Fuel Divisions, which comprised 18 depots and 27 retail sites in NSW, South Australia and Victoria.19 This followed a decision by the ACCC on 21 May 2014 to not oppose the proposed acquisition, subject to a court-enforcable undertaking which required Caltex to divest certain retail sites in Mt Gambier and Nhill.
In August 2014 Viva Energy Australia announced that it has entered into an agreement to purchase a non-controlling stake in Liberty Oil (a large independent fuel wholesaler and distributor).20 On 28 October 2014 the ACCC announced its decision to not oppose the acquisition.
RetailAs noted earlier, in February 2014 Vitol purchased Shell’s 870-site retail business in Australia, and Caltex purchased 27 retail sites from Scotts (four of which the ACCC required Caltex to sell in order for the acquisition to be approved).
Peregrine advised the ACCC in May 2013 that it intended to acquire 16 BP company owned and operated retail petrol sites in Adelaide and nine sites in regional South Australia. On 8 May 2014 the ACCC announced its decision to not oppose the proposed acquisition by Peregrine, after accepting a court-enforceable undertaking, which required Peregrine to divest itself of three sites that it would otherwise have acquired from BP and one of its existing sites.
In January 2014 ExxonMobil Australia announced that it had signed a long-term agreement with 7-Eleven Australia which would see the Mobil brand return to 7-Eleven’s petrol stations for the first time since the sale of ExxonMobil’s retail assets to 7-Eleven in 2010.21
In April 2014 7-Eleven announced its plan to expand into Western Australia, with more than 10 stores opening in the coming year, including standalone convenience stores and fuel stores, and as many as 75 stores opening over the next five years.22
17 Caltex Australia (2014), New terminal underpins reliable fuel supply for SA, Media release, 30 April 2014, http://www.caltex.com.au/LatestNews/Pages/NewsItem.aspx?ID=13451, accessed on 11 September 2014.
18 Puma Energy (2014), Independent fuel operator moves in on major mine suppliers, 27 May 2014: http://www.pumaenergy.com/2014/05/27/independent-fuel-operator-moves-in-on-major-mine-suppliers, accessed on 11 September 2014
19 Caltex Australia (2014), Caltex completes acquisition of the Scott’s Fuel Divisions, Media release, 4 June 2014: http://www.caltex.com.au/LatestNews/Pages/NewsItem.aspx?ID=13462, accessed on 11 September 2014
20 Viva Energy (2014), Viva Energy Australia to acquire stake in Liberty Oil, Media release, 25 August 2014: http://www.vivaenergy.com.au/media-centre/news/2014/viva-energy-australia-acquire-stake-in-liberty-oil-25-aug-2014, accessed on 11 September 2014.
21 Exxon Mobil Australia (2014), ExxonMobil and 7-Eleven sign agreement to return Mobil brand to 7-Eleven network in Australia, Media release, 9 January 2014: http://www.exxonmobil.com.au/Australia-English/PA/news_releases_20140109_mobil.aspx, accessed on 11 September 2014.
22 7-Eleven Australia (2014), 7-Eleven to expand into Western Australia in 2014, Media release, 8 April 2014: http://www.7eleven.com.au/media-centre/article/7-eleven-to-expand-into-western-australia-in-2014, accessed on 11 September 2014.
Monitoring of the Australian petroleum industry December 2014 xlv

Share of monitored retail petrol sales
Table 1 shows the current share of retail sale volumes by brand among the refiner-wholesalers, supermarkets and large independent retail chains.
It is important to note that the category ‘large independent retail chains’ in the table includes only the sites of 7-Eleven and On The Run, and the retail operations of Puma and United. A number of non-major branded independent sites are not included in this table, as the ACCC only collects data from the major players in the industry. Therefore, this category should not be considered to represent the total number of independent sites in Australia.
Table 1 Share of volume of monitored retail petrol sales by brand: 2002–03 to 2013−14
BP Caltex Mobil Shell Coles Express/Shell (co-branded)
Woolworths/ Caltex
(co-branded)
Large independent retail chains
% % % % % % %
2002–03 20 24 19 20 – 10 6
2003–04 20 22 17 3 16 14 7
2004–05 18 18 12 3 25 18 6
2005–06 19 16 11 3 25 20 6
2006–07 19 16 11 3 22 22 7
2007–08 20 17 11 2 20 22 8
2008–09 19 16 11 2 22 23 9
2009–10 17 16 10 2 22 23 10
2010–11 19 18 – 2 22 23 17
2011–12 16 18 – 2 23 24 17
2012−13 15 18 – 2 24 24 18
2013−14 13 18 - 2 24 24 19
Source: ACCC analysis and estimates based on data obtained from firms monitored through the ACCC’s monitoring process.
Notes: Data is only for monitored companies. Therefore, it does not include the total volume of retail sales in Australia.
Large independent retail chains are: 7-Eleven, On The Run, and the retail operations of Puma and United.
In 2002–03 Woolworths was not co-branded with Caltex.
Totals may not add up to 100 per cent due to rounding.
In 2013−14 the combined share of the refiner-wholesalers of branded retail sales of the monitored firms was 33 per cent. This share has steadily declined over the years. In 2002–03 their combined share was 83 per cent.
On the other hand, large independent retail chains and the supermarkets experienced significant increases in the share of retail petrol sales monitored by the ACCC over the last 12 years. Between 2002–03 and 2013−14 the share of the supermarkets increased from 10 per cent to 48 per cent, and the share held by the large independent retail chains increased from 6 per cent to 19 per cent. Much of the increase in the share of the large independent retail chains resulted from sales of sites by the refiner-wholesalers (such as the sale of Mobil sites to 7-Eleven in 2010 and the sale of BP sites to On The Run in 2014).
xlvi Monitoring of the Australian petroleum industry December 2014

Ethanol blended petrol
In 2013−14 sales of ethanol blended petrol represented 13 per cent of total petrol sales in Australia (a decrease of 1 percentage point from 2012−13).
Ethanol is added to petrol to produce various grades of ethanol blended petrol (EBP). The most common type of EBP is E10, which is RULP containing up to 10 per cent ethanol.
In 2013−14 total sales of EBP in Australia decreased by around 8 per cent from 2012–13. Sales were down in NSW and Queensland, and increased in Victoria (albeit from a very low base). EBP sales represented 13 per cent of total petrol sales in Australia (a decrease of 1 percentage point from 2012−13).
Chart 18 shows annual sales of EBP in Australia since 2006−07 and the proportion of total petrol sales represented by EBP.
Chart 18 Total ethanol blended petrol sales by volume and as a proportion of total petrol sales: 2006−07 to 2013−14
0
500
1000
1500
2000
2500
3000
3500
2013-142012-132011-122010-112009-102008-092007-082006-07
meg
alitres
1%
4%
9%
12%
16%
14%14%
13%
Source: ACCC calculations based on RET and BREE, Australian Petroleum Statistics, various issues.
The chart shows that:
• there was steady growth in sales of EBP between 2006−07 and 2010−11, peaking at 16 per cent of total petrol sales
• since then sales of EBP steadily declined—in 2011−12 and 2012−13 they represented 14 per cent of total petrol sales
• in 2013–14 this proportion decreased to 13 per cent of total petrol sales.
In 2013−14 across all retail sites selling both RULP and E10 which are monitored by the ACCC, RULP prices were on average higher than E10 prices by around 2.1 cpl. This was almost the same differential as in 2012−13 (2.0 cpl).
Monitoring of the Australian petroleum industry December 2014 xlvii

In 2013−14 there was sufficient supply to meet demand: ethanol production capacity in Australia was estimated to be 450 ML and ethanol demand was estimated to be around 236 ML.
In the 2014−15 Budget the Australian Government announced that it would cease the Ethanol Production Grants Program (EPGP) on 30 June 2015.23 The EPGP, which commenced in September 2002, provides full excise reimbursement to ethanol producers for ethanol produced and supplied for transport use in Australia from locally derived feedstocks. It effectively makes the ethanol component of Australian produced EBP excise free.
The Australian Government also announced that the fuel excise on domestically produced ethanol would be reduced to zero from 1 July 2015 and then increased by 2.5 cpl per year for five years from 1 July 2016 until it reaches 12.5 cpl (which represents 50 per cent of the energy content equivalent rate). The excise equivalent customs duty for ethanol would be retained.
New South Wales ethanol mandate
The ethanol mandate in NSW has had a significant impact on competition and consumers in that state.
The largest volume of EBP is sold in NSW, which accounted for 82 per cent of total EBP sales in Australia in 2013−14. This is primarily a result of the NSW ethanol mandate.
From October 2011 the mandate has required that 6 per cent of the total volume of petrol sold in NSW should be ethanol. However, in 2013−14 only around 3.3 per cent of the volume of petrol sold in NSW was ethanol.
Since its introduction in October 2007 the NSW mandate has had a significant impact on competition and consumers:
• It has affected the competitive dynamic among retailers by removing RULP from many retail sites.
• It has reduced consumer choice—some motorists who cannot use, or choose not to use, E10 in their vehicles have decided to use PULP because of the reduced availability of RULP. – This is reflected in the fact that between 2007−08 and 2013−14 sales of PULP in NSW
increased by 124 per cent, whereas in the rest of Australia the increase over the same period was only 26 per cent.
• Since PULP retails at a higher price than RULP, it has meant that these motorists have been paying significantly higher prices than if they had continued to purchase RULP. – In 2013−14 average PULP 95 prices in Sydney were 11.6 cpl higher than RULP prices.
Premium unleaded petrol
In 2013−14 sales of PULP represented 28 per cent of total petrol sales in Australia. Use of PULP has increased steadily over recent years.
In Australia the two main grades of PULP are PULP 95 and PULP 98. Other grades of PULP are also available, but they are sold in much lower volumes.
Sales of the PULP grades have grown steadily over recent years. Chart 19 shows total PULP sales by volume and as a percentage of total petrol sales from 2006−07 to 2013−14. For comparison purposes it also shows RULP sales.
23 Australian Government, Budget measures: budget paper no. 2: 2014–15, p. 165.
xlviii Monitoring of the Australian petroleum industry December 2014

Chart 19 Total RULP and PULP sales by volume and as a percentage of total petrol sales: 2006−07 to 2013−14
0
2 000
4 000
6 000
8 000
10 000
12 000
14 000
16 000
18 000
2013-142012-132011-122010-112009-102008-092007-082006-07
PULPRULP
meg
alitres
16% 17% 17%19% 23%
25% 27% 28%
79%83%
74%
69%
61% 60% 59% 59%
Source: ACCC calculations based on RET and BREE, Australian Petroleum Statistics, various issues.
The chart shows that between 2006−07 and 2013−14:
• there was steady growth in sales of PULP—from 16 per cent of total petrol sales in 2006−07 to 28 per cent in 2013−14
• there was a significant decline in sales of RULP between 2006−07 and 2010−11—from 83 per cent of total petrol sales to 61 per cent in 2010−11 – since then the decline in RULP sales as a proportion of total petrol sales has slowed.
In 2013–14 around 5 billion litres of PULP was sold in Australia. Almost half of all PULP sales were in NSW. The large demand for PULP in NSW has been influenced by the ethanol mandate in that state, which commenced in October 2007.
In 2013−14 average PULP 95 retail prices were 10.6 cpl higher than average RULP retail prices (an increase of 0.2 cpl on 2012−13), and average PULP 98 retail prices were 16.3 cpl higher than average RULP retail prices (an increase of 0.9 cpl).
Monitoring of the Australian petroleum industry December 2014 xlix

l Monitoring of the Australian petroleum industry December 2014

1 Background and objectives
1.1 Background to ACCC involvement in the industryThe Australian Competition and Consumer Commission (ACCC) and its predecessors, the Trade Practices Commission and the Prices Surveillance Authority (PSA), have had extensive involvement in the petrol industry. Activities undertaken have included enforcement of the Competition and Consumer Act 2010 (the Act) concerning fuel related issues, as well as prices surveillance, public inquiries, informal price monitoring, public awareness initiatives and education activities.
From 1984 the petrol industry was subject to a price surveillance regime administered by the PSA (and subsequently the ACCC) under which maximum wholesale prices for petrol were determined. These arrangements were abolished by the Australian Government in August 1998. However, the ACCC continued to informally monitor the petrol industry. Through this watching brief the ACCC was able to provide information to consumers through various ACCC publications and the ACCC website. Information collected from informal monitoring also assisted with administering the provisions of the Act and helped the ACCC prepare analyses and reports for the Australian Government and Parliament.
In 2007 the ACCC conducted an inquiry into the petrol industry covering the industry structure, an assessment of competition, the determination of prices and possible methods to address impediments to efficient petrol pricing. The inquiry was triggered by concerns about a discrepancy between movements in domestic petrol prices and international petrol prices.
1.2 Petrol monitoring reports
1.2.1 Minister’s DirectionFollowing the public release of the ACCC’s inquiry report, on 17 December 2007 the then Minister for Competition and Consumer Affairs, the Hon. Chris Bowen MP, directed the ACCC, under ss. 95ZE(1) of the Trade Practices Act 1974 (since renamed the Competition and Consumer Act 2010), to monitor prices, costs and profits relating to the supply of unleaded petroleum products, and to provide him with an annual report. The Minister directed the ACCC to undertake monitoring for three years.
Subsequently, the Direction was extended annually. On 15 July 2013 the then Assistant Treasurer, the Hon. David Bradbury MP, issued a new Direction for the ACCC to continue monitoring until 17 December 2014.24
This is the seventh annual monitoring report.
1.2.2 Objectives of the monitoring programThe objectives of the monitoring program derive from the Minister’s direction and accompanying letter, and the ACCC’s responsibilities under the Act. The program therefore has three key objectives:
• improving consumer awareness by increasing the amount of information available about the petrol industry
• complying with the Minister’s direction by describing and analysing prices, costs and profits
• focusing on areas of the industry where competition may be less than fully effective, and on industry conduct that may warrant further consideration by the ACCC.
24 A copy of the Minister’s direction and accompanying letter is at appendix A.
Monitoring of the Australian petroleum industry December 2014 1

1.2.3 Scope of the monitoring reportThis report covers the three major sectors of the downstream petroleum industry: total supply (refining and importing), wholesaling and retailing. These are shown in figure 1.1.
Figure 1.1 Scope of the 2014 petrol monitoring report
Upstream:Oil explorationand extraction
Domesticrefining
Buy-sell arrangements
Importingpetrol
Supply
Internationalrefining
Major wholesalers Major retailers
Minor wholesalers Minor retailers
Source: ACCC.
For each sector, the report presents detailed cost, revenue and profitability data. The report analyses data on wholesale and retail prices and volumes of petrol products, especially regular unleaded petrol (RULP) and premium unleaded petrol (PULP), as well as related petroleum products.
As in previous years, the report also considers structural changes and trends in the various sectors of the industry, changes in international factors over the year, and developments in particular markets.
Data for the report was provided by the following companies:
• refiner-marketers: BP and Caltex25
• refiner-wholesalers: BP, Caltex, Mobil and Shell26
• supermarket petrol retailers: Coles Express and Woolworths Petrol
• independent wholesalers: Liberty, United, Puma Energy
• independent retail chains: United, Puma Energy, 7-Eleven and On The Run
• independent terminal owners: Vopak, Stolthaven, Terminals Pty Ltd and Coogee Chemicals.
The ACCC wishes to thank the companies for the information provided for this report.
More information about the process of data collection and some of the issues involved in processing it are outlined in appendix B.
25 ‘Refiner-marketers’ is the traditional term referring to the four companies (BP, Shell, Caltex and Mobil) which used to refine, wholesale and retail fuel in Australia. Mobil and Shell, while still marketing proprietary fuels, have effectively withdrawn from direct retailing. ‘Refiner-marketer’ is still used to refer to BP and Caltex as they are still integrated from refining to retailing. Mobil and Shell remain in refining and wholesaling. As these four companies accounted for all of refining output and the vast majority of wholesale sales, this report refers to them as ‘refiner-wholesalers’.
26 In February 2014 Shell announced that it had reached a binding agreement to sell its Australian downstream business to Vitol. It also included a brand license arrangement and an exclusive distributor arrangement in Australia for Shell Lubricants. Vitol completed its acquisition on 13 August 2014 and launched Viva Energy Australia (the trading name of Vitol’s Australian business). For more details, see chapter 3.
2 Monitoring of the Australian petroleum industry December 2014

2 ACCC activities in the petroleum industry
Key pointsThe ACCC:
• finalised an investigation into the competition implications of shopper docket fuel discount offers by the major supermarkets, and took court proceedings in relation to alleged breaches of the court-enforceable undertakings
• completed its investigation into price information sharing arrangements in the retail petrol sector and instituted proceedings against Informed Sources and five petrol retailers
• worked with state government regulators and industry stakeholders to discuss a consistent national approach to fuel price boards
• continued fuel monitoring activities in Australia, including in all capital cities and around 180 regional locations
• continued to provide consumer information about fuel issues on the ACCC website and in other publications – the ACCC’s petrol price cycle webpage was the most-visited page on the ACCC website in
2013−14, receiving around 270 000 hits
• considered around 1000 complaints and enquiries about fuel related issues
• engaged with stakeholders to identify opportunities to improve compliance with the Competition and Consumer Act 2010 and held two Fuel Consultative Committee meetings.
2.1 IntroductionThe ACCC does not set wholesale or retail petrol prices in Australia. Retailers and wholesalers are free to set their prices according to market conditions.
The main role of the ACCC is to enforce the Competition and Consumer Act 2010 (the Act) across the Australian economy, including the fuel industry. The ACCC’s activities under the Act included enforcement and compliance, mergers and acquisitions assessments, authorisations and notifications, and administration of the Oilcode. This chapter outlines the ACCC’s activities relating to the downstream petroleum industry in 2013−14.
2.2 Enforcement and compliance under the Act
2.2.1 Anti-competitive conductDuring 2013−14 the ACCC continued its focus on examining allegations of anti-competitive conduct in the retail fuel industry. There were two significant investigations during this period.
Shopper docket fuel discount schemes
The ACCC’s investigation into the competition implications in relation to shopper docket discount fuel offers by the major supermarkets was completed in December 2013.
This investigation, which had been on-going since mid-2012, considered whether competition issues arise in relation to shopper docket fuel discount schemes, given the extended frequency, duration and quantum of shopper docket fuel discounts offered by the major supermarket chains.
Monitoring of the Australian petroleum industry December 2014 3

On 6 December 2013, the ACCC accepted voluntary court-enforceable undertakings from Coles and Woolworths to voluntarily cease making fuel discounts which are wholly or partially funded by any part of their business other than their fuel retailing business. From 1 January 2014, both Coles and Woolworths undertook to limit fuel discounts linked to supermarket purchases to a maximum of 4.0 cents per litre (cpl).
The ACCC accepted the undertakings because they addressed the principal competition concerns and allowed the matter to be resolved quickly and efficiently. The ACCC welcomed the voluntary cooperation of Coles and Woolworths in addressing the ACCC’s concerns. From January 2014, Woolworths continued to offer bundled fuel discounts of 8.0 cpl and in early February 2014, Coles began to offer bundled fuel savings of 14.0 cpl. On 25 February 2014, the ACCC instituted proceedings against Coles and Woolworths alleging that further offers were in breach of the undertakings.
In April 2014, the Federal Court found that Woolworth’s earlier bundled discount of 8.0 cpl was a breach of its undertaking because the discount is only available to a customer who has made a qualifying supermarket purchase. The Court dismissed two other allegations against Coles and Woolworths.
The undertakings continue to prevent Coles and Woolworths offering fuel discounts that are subsidised by their supermarket operations and continue to prevent Coles and Woolworths from bundling supermarket fuel offers greater than 4.0 cpl.
Price information sharing—fuel companies
In 2014 the ACCC completed its investigation into price information sharing arrangements in the retail petrol sector.
On 19 August 2014, the ACCC instituted proceedings in the Federal Court against Informed Sources (Australia) Pty Ltd (Informed Sources) and several petrol retailers alleging that they contravened s. 45 of the Act. The petrol retailers who are joined in the ACCC’s proceedings are: BP Australia Pty Ltd, Caltex Australia Petroleum Pty Ltd, Eureka Operations Pty Ltd (trading as Coles Express), Woolworths Ltd, and 7-Eleven Stores Pty Ltd.
The ACCC alleges that the information sharing arrangements between Informed Sources and the petrol retailers, through a service provided by Informed Sources, allows those retailers to communicate with each other about their prices, and that these arrangements had the effect or likely effect of substantially lessening competition in markets for the sale of petrol in Melbourne. The ACCC alleges that the arrangements increased or were likely to increase retail petrol price coordination and cooperation, and decreased or were likely to decrease competitive rivalry.
Subscribers to the Informed Sources service provide pricing data to Informed Sources at frequent, regular intervals and in return receive from it collated data from the other subscribers, and various reports containing pricing information across particular regions.
The matter is ongoing.
2.2.2 Mergers and acquisitionsSection 50 of the Act prohibits acquisitions that would have the effect, or likely effect, of substantially lessening competition in a market. The ACCC enforces the merger provisions under Part IV of the Act.
The ACCC completed two reviews of fuel-related acquisitions in 2013–14 and a further review in October 2014.
4 Monitoring of the Australian petroleum industry December 2014

Peregrine acquisition of BP retail sites in South Australia
On 15 May 2013 the ACCC commenced a public review of Peregrine Corporation’s (which operates under the trading name of On The Run) proposed acquisition of 25 BP Australia petrol retail sites in South Australia, 16 of which were located in metropolitan Adelaide with the remainder in regional South Australia.
On 8 May 2014 the ACCC announced its decision to not oppose the proposed acquisition by Peregrine, after accepting a court-enforceable undertaking. The undertaking required Peregrine to divest itself of three sites that it would otherwise have acquired from BP (BP Elizabeth Vale, BP Mile End, BP Westbourne Park) and one of its existing sites (On The Run South Plympton). The ACCC was concerned that Peregrine’s acquisition of these sites could have resulted in higher fuel prices at these sites or at other nearby Peregrine sites.
In addition to considering the impact of the acquisition in particular local areas, the ACCC also considered the impact of the acquisition on rivalry between Peregrine and other retailers (such as Woolworths and Coles Express) that occurs on an Adelaide-wide basis. The ACCC noted that the acquisition would significantly increase Peregrine’s presence in Adelaide but concluded that this particular acquisition would not substantially lessen Adelaide-wide competition.
On 8 May 2014 the ACCC also announced that it would oppose the proposed acquisition by Peregrine of Caltex’s retail petrol station site in the Adelaide suburb of Fullarton. Peregrine had proposed to acquire this site from Caltex as part of the arrangements to address the competition concerns with its acquisition of sites from BP. The ACCC opposed the proposed acquisition of this site because it appeared to compete closely with BP Glenunga (which Peregrine was also acquiring from BP) and other nearby Peregrine petrol stations. The proposed acquisition of Caltex Fullarton would have eliminated this close competition.
Caltex acquisition of Scotts Transport fuel division
On 27 February 2014, the ACCC commenced a public review of Caltex’s proposed acquisition of the Scotts Group of Companies. On 21 May 2014 the ACCC decided not to oppose the proposed acquisition, subject to a s. 87B undertaking, which required Caltex to divest certain retail sites in Mt Gambier (South Australia) and Nhill (Victoria).
The ACCC considered that, absent the undertaking, the proposed acquisition would have resulted in competition concerns in the local Mt Gambier and Nhill retail markets. Without the divestitures, Caltex would have controlled the majority of the retail fuel sites in Mt Gambier. In Nhill, Caltex would have controlled two of the three retail sites. In both towns the ACCC concluded that absent the undertaking the remaining independent retail sites would not have provided a strong competitive constraint on Caltex.
The ACCC concluded that the proposed acquisition was unlikely to result in a substantial lessening of competition in the other relevant markets, including
• local retail markets, other than Mt Gambier and Nhill, for the supply of fuel
• regional wholesale markets for the supply and distribution of fuel to small commercial customers.
In relation to the relevant retail markets, with the exception of Mt Gambier and Nhill, the ACCC concluded that post-acquisition, Caltex would be constrained by the presence of alternative fuel retailers, including Woolworths and Coles controlled sites located in prominent positions on roads with high traffic volumes
In relation to wholesale markets, the ACCC concluded that in each of the relevant areas (Mt Gambier, Griffith, Warrnambool and Horsham) post-acquisition Caltex would face effective constraint from rival distributors operating from depots located in the relevant area.
The ACCC also concluded that barriers to entry and expansion in the relevant wholesale markets were relatively low. The ACCC considered that a rival depot operator could install an above ground storage tank at a low cost and in a timeframe sufficient to provide a constraint on Caltex.
Monitoring of the Australian petroleum industry December 2014 5

In particular, the ACCC considered that should Caltex no longer supply fuel to Caltex appointed distributors on competitive terms, Caltex appointed distributors could switch away from Caltex, through establishing their own storage capacity and obtaining supply from an alternative wholesaler.
Viva Energy acquisition of an interest in Liberty Oil
On 2 September 2014 the ACCC commenced a review of Viva Energy Australia Ltd’s proposed acquisition of an interest in Liberty Oil Holdings Pty Ltd. Since August 2014 Viva has owned the majority of the assets of the former Shell Australia downstream fuel business. Because the interest in Liberty could, in certain circumstances, amount to a controlling interest, the ACCC analysed the proposed acquisition as if Viva proposed to acquire a controlling interest in Liberty. On 28 October 2014 the ACCC announced its decision to not oppose the proposed acquisition by Viva.
The ACCC considered the likely effects of the proposed acquisition on competition at both the wholesale and retail levels of the industry. The ACCC considered whether the proposed acquisition would reduce competition in fuel retail markets, due to Liberty being a major wholesale supplier to independent retailers. However, the ACCC did not consider that the proposed acquisition would significantly reduce the wholesale supply choices available to independent retailers, as Viva’s presence in wholesale supply to independents was small, and there were other large independent wholesalers including United and Puma Energy. The ACCC noted that Liberty, unlike United and Puma Energy, did not own any fuel import terminals.
While neither Viva nor Liberty conducted its own fuel retailing operations (apart from some limited specialty operations), the ACCC considered whether Viva’s incentives in supplying Liberty-branded retailers would be different from Liberty’s incentives. The ACCC noted that a key incentive for Viva was likely to be to sell sufficient volumes of fuel to ensure that its Geelong refinery remains viable.
The ACCC also considered the likely effect of the proposed acquisition on competition in the supply and distribution of fuels to commercial customers (e.g. transport companies, mining companies and farmers), but did not identify significant competition concerns. The ACCC noted that Liberty was active in supplying farmers and other rural customers but Viva was not. Viva’s business concentrated on supply to larger industrial customers including mining companies.
2.2.3 Authorisations and notifications In certain circumstances, the ACCC can grant protection from legal action for certain anti-competitive conduct where that conduct delivers an offsetting public benefit. Businesses may obtain protection from legal action by applying for an authorisation or lodging a notification with the ACCC. Authorisation applications and notifications are available on a public register on the ACCC’s website.
Authorisation is a process under which legal protection can be provided for potential breaches of the competition provisions of the Act, except for misuse of market power, if the ACCC is satisfied the conduct delivers a net public benefit. There were no fuel-related authorisation applications lodged with the ACCC in 2013−14.
For certain types of conduct, including exclusive dealing, protection from legal action under the Act can also be obtained by lodging a notification with the ACCC. Exclusive dealing involves placing restrictions on the supply of goods or services such as requiring a person to purchase goods from a third-party supplier (known as ‘third line forcing’).
In 2013−14 the ACCC considered 14 fuel-related third line forcing exclusive dealing notifications, all of which were allowed. The third line forcing conduct under the notifications predominantly related to shopper docket arrangements involving supermarkets.
6 Monitoring of the Australian petroleum industry December 2014

2.2.4 Misleading conduct and false representations Conduct is in breach of the Act where it misleads, deceives or is likely to mislead or deceive consumers.
In 2013−14 the ACCC received around 110 complaints (around 10 per cent of all fuel related contacts) alleging misleading and deceptive conduct and false or misleading representations.
Similar to 2012−13, the main issues raised by consumers in 2013−14 included concerns about pricing practices, labelling on fuel pumps, advertising promotions by supermarkets (such as fuel discount schemes), fuel price boards, fuel quality claims and concerns about inaccurate fuel measurements.
2.2.5 Fuel price boardsIn July 2013 Consumer Affairs Ministers discussed the value of having a national information standard for fuel price boards to assist consumers to make better fuel purchasing decisions through the provision of clearer, more standardised information.
However, in June 2014 Ministers noted the desire not to duplicate regulations in place in NSW, SA and parts of WA, or to introduce further regulation where the Australian Consumer Law may address issues of concern.
Ministers further noted that the ACCC would engage with industry participants with a focus on the prominence of discounted prices and the potential to mislead consumers about the price they would pay for fuel. Ministers agreed to revisit the issue of an information standard in light of any developments following this process.
2.2.6 Administration of the OilcodeThe Oilcode came into effect on 1 March 2007 as a prescribed industry code of conduct under the Act.
It aims to regulate the conduct of suppliers, distributors and retailers in the downstream petroleum retail industry. The Oilcode encourages greater transparency of terminal gate pricing and fuel re-selling agreements, while providing greater certainty for industry participants regarding the supply of petroleum products and tenure under fuel reselling agreements. It also provides an effective and relatively inexpensive method to resolve disputes between suppliers, distributors or retailers.
The ACCC’s role is to ensure compliance with the Oilcode and the Act by informing downstream petroleum industry participants of their rights and obligations under the law and by enforcing the law where necessary. In 2013−14 the ACCC received three enquiries about the Oilcode.
A review of the Oilcode in 2008−09 resulted in a number of amendments to the Oilcode that came into effect in July 2012. As part of this review, the Government committed to a further review of the Oilcode in 2013.
In December 2013 the Department of Industry announced that it had commenced preparations for a further review of the Oilcode. The terms of reference for the review will be informed by the Harper review of the competition framework. The Harper Review Panel’s draft report was released on 22 September 2014. The review of the Oilcode will also consider whether it should be re-made ahead of its scheduled ‘sunsetting’ in 2017.
Monitoring of the Australian petroleum industry December 2014 7

2.3 Monitoring activities In 2013−14 the ACCC monitored petrol, diesel and automotive liquified petroleum gas (LPG) prices across Australia on a daily basis. Monitoring supports the ACCC’s primary role of preventing anti-competitive conduct and protecting and informing consumers. Formal monitoring activities included the production of this report, in response to the direction by the Minister responsible for competition policy matters.
The extensive fuel price information collected by the ACCC included:
• retail prices of petrol (including regular unleaded, premium unleaded and E10, i.e. RULP containing up to 10 per cent ethanol), diesel and automotive LPG in the capital cities and around 180 regional locations
• international crude oil and relevant international refined fuel prices
• data on wholesale transactions related to petrol
• published terminal gate prices of the oil companies and some independent wholesalers
• certain financial information from firms monitored under the formal monitoring program.
2.3.1 The ACCC and regional engagement on fuel pricesAs part of its monitoring activities, the ACCC obtained fuel prices for around 180 regional locations throughout Australia. It also engaged with industry groups and members of the public to collect additional information about regional fuel pricing issues.
The ACCC used this information to monitor regional fuel prices against relevant benchmarks. Where there is an allegation of anti-competitive conduct, it will make targeted inquiries to investigate the issue. After making inquiries, if there is information available to the ACCC that a breach of the Act is likely to have occurred, it can take action to enforce the Act.
In addition, the ACCC pays particular attention to any potential changes in the ownership of retail sites in regional locations. Given many regional locations have a limited number of retail sites, the ACCC monitors such changes to ensure that the sale will not substantially lessen competition in that particular market.
2.4 Informing consumers The ACCC aims to educate consumers on the influences on domestic retail prices by providing a range of consumer and industry stakeholder information on the ACCC website, and responding to media enquiries and calls to our Infocentre. Throughout 2013−14 the ACCC expanded and reviewed public information activities to provide a broad range of information to consumers.
2.4.1 ACCC website In 2013−14 the ACCC reviewed and updated fuel-related content as part of the ACCC’s release of its new website. Information was also reviewed to improve accessibility standards of the information. The website is located at www.accc.gov.au/consumers/petrol-diesel-and-lpg.
In 2013−14 the ACCC’s petrol price cycle webpage (which provides information about the highest and lowest weekly petrol prices in each of the five largest cities) was the most-visited page on the ACCC website, receiving around 270 000 hits. In total the ACCC’s fuel-related web pages received more than 340 000 page views in 2013−14.
Prior to 30 June 2014 the ACCC obtained retail fuel price data from Informed Sources. However, the contract with Informed Sources ceased on that day. The ACCC has since obtained its retail fuel price data from FUELtrac. There was a period between July and November 2014 when the ACCC did not provide petrol price cycle data on its website, while arrangements with FUELtrac were being finalised. During this time the ACCC continued to obtain information from the petrol companies for the purposes of its monitoring program.
8 Monitoring of the Australian petroleum industry December 2014

2.4.2 ACCC InfocentreDuring 2013−14 the ACCC Infocentre answered more than 106 000 phone calls, and provided over 26 000 responses by email or letter. Of these, around 1000 contacts raised fuel-related issues, an 11 per cent increase on the total number received in 2012−13 (around 900).
The topics of most concern included: high prices for RULP in various locations; fuel discount shopper dockets; collusion and other anti-competitive behaviour by fuel retailers; price cycle volatility in larger capital cities; price differences between locations in the same region; and price differences between regional areas and capital cities.
A particular concern that led to a significant increase in complaints occurred in December 2013 and January 2014 was a sharp increase in the retail price of automotive LPG fuel following an increase in the relevant international benchmark price.
In 2013−14 around 15 per cent of complaints and enquiries received about the fuel industry related to potential compliance issues under the Act. The ACCC considered these contacts and made further assessments where there was credible information to suggest that a potential breach of the Act may have occurred.
If warranted by the information provided in support of the allegation, the ACCC undertakes further analysis of fuel prices in the metropolitan and regional areas in the context of allegations. Where there is information to suggest a breach of the Act may have occurred, the ACCC investigates and gathers further information by making targeted inquiries. After making inquiries, if the information available to the ACCC indicates that a breach of the Act may have occurred, the ACCC may take legal action.
2.4.3 Ministerial correspondence In 2013−14 the ACCC addressed around 20 items of correspondence from Commonwealth and State parliamentarians on fuel issues. The most common topics were: high automotive fuel prices in regional locations, fuel price differentials between regional locations and larger cities, and between regional locations, and high prices for automotive LPG.
2.4.4 Enhancing consumer understanding The ACCC regularly engages with newspapers, television, radio and internet media outlets with the objective of making information about its analysis and developments in the petroleum industry more accessible to consumers. In 2013−14 the ACCC provided informed media comment on issues including:
• petrol price cycles in larger capital cities
• petrol prices in regional locations and smaller cities, including differentials with capital cities
• fuel price boards
• shopper docket discount schemes
• diesel and automotive LPG prices
• the impact of exchange rate movements on petrol prices.
The ACCC also distributed published copies of its 2013 petrol monitoring report to key stakeholders.
Monitoring of the Australian petroleum industry December 2014 9

2.5 Engagement with key stakeholdersIn 2013−14 the ACCC continued to engage with key stakeholders including consumers, industry and government organisations on a range of fuel issues.
2.5.1 Fuel Consultative Committee The ACCC formed the Fuel Consultative Committee (FuelCC) in 2010 to provide:
• an opportunity for meaningful dialogue between the ACCC, the fuel industry and motoring organisations
• information to increase the ACCC’s understanding of fuel industry issues and to assist the ACCC in undertaking its role under the Act on issues related to competition and consumer protection in the fuel industry.
FuelCC participants include Australia’s major fuel retailers, refiner-wholesalers, peak industry associations and motoring organisations.
In 2013−14 the FuelCC met twice and discussed issues including finalised ACCC enforcement activities, industry consolidation and the sale of significant refining assets, availability of pricing information to consumers, state government mandates on biofuels, consumer concern about price cycles in the larger capital cities, regional motorist concerns about pricing differentials, fuel supply concerns, broader industry regulation, and profitability of the downstream Australian fuel industry.
2.5.2 Other government bodiesAs a part of its broader role, the ACCC liaises and shares information in accordance with its Information Sharing Policy with the following government bodies to fulfil its functions under the Act:
• the Commonwealth Treasury, concerning fuel pricing issues and the fuel industry broadly
• the Commonwealth Department of Industry, about the fuel industry broadly, including issues such as petroleum data reporting and fuel supply issues
• the Commonwealth Department of the Environment, relating to the quality of fuel, including allegations of contamination
• the National Measurement Institute, for concerns about trade measurement practices
• State and territory government agencies regarding consumer protection and other fuel related issues such as state offices of fair trading.
2.5.3 Consumer and industry stakeholder engagementIn addition to meetings of the FuelCC and efforts to increase consumer understanding about fuel prices, the ACCC engages with consumer groups and motoring organisations to address concerns raised about the conduct of petrol retailers which affect consumers. In particular, in 2013−14 the ACCC engaged with the Australasian Convenience and Petroleum Marketers Association, the Australian Institute of Petroleum, the Australian Automobile Association, the Service Stations Association, and the Biofuels Association of Australia.
10 Monitoring of the Australian petroleum industry December 2014

3 Developments in industry structure
Key points• As in previous years, there were significant changes in the structure of the downstream
petroleum industry in 2013−14.
• The decline in crude oil production over the past decade continued in 2013−14, with Australia producing around 19 500 megalitres (ML) of crude oil, a decrease of 8 per cent from 2012−13. In April 2014 BP announced plans to halt refining operations at its Bulwer Island refinery in Brisbane by mid-2015. – Once that occurs there will be only four operating refineries in Australia—down from eight
refineries in 2002.
• In 2013−14 Malaysia continued to be Australia’s leading source of crude oil imports, and Singapore and South Korea continued to be Australia’s leading sources of petrol imports.
• Over the past decade, the volume of diesel imports has increased to be almost four times the size of petrol imports. – This is the result of increasing domestic demand for diesel and most Australian refineries
being configured with a focus on petrol.
• In 2013–14, there was further merger and acquisition activity in the wholesale and retail sectors, with large transactions undertaken by local and overseas companies.
3.1 IntroductionAustralia’s petroleum industry consists of two broad areas of operation: upstream and downstream. Downstream operations are divided into three sectors—total supply (including refining and importing), wholesale and retail. Upstream operations consist of the exploration, production and export of crude oil, and are generally outside the scope of this report, though they are covered where they impact on Australia’s downstream petroleum industry.
Change continued to occur in Australia’s downstream petroleum industry in 2013–14. The developments were consistent with the recent trends of rationalisation of refining operations and growth in import infrastructure. In addition, there was continued merger and acquisition activity in the wholesale and retail sectors in 2013–14.
Figure 3.1 shows the volumes of crude oil and petrol flows within and between sectors of the upstream and downstream sectors of the petroleum industry.
While figure 3.1 depicts flows between industry sectors on a national scale, the operations and infrastructure of the industry are focused on a series of predominantly state-based markets. Appendix C provides state-by-state schematics of infrastructure within the Australian petroleum industry.
Monitoring of the Australian petroleum industry December 2014 11

Figure 3.1 Crude oil and petrol flows through the Australian petroleum industry: 2013–14
19 500 ML Australian crude oil
Upstream
100 MLExportedpetrol
15 000 MLCrude oilexports
Domestic refining
14 500 ML Petrol refined
15 400 ML Petrol sold by retailers
Consumers
2800 MLPetrol sold directly to distributors and end users
3600 MLImportedpetrol
200 MLEthanol added at wholesale stage (for EBP)
18 200 ML Petrol sold by wholesalers
Imports & exports
4500 MLAustralian crude oil
Wholesale Retail
32 500 MLCrude oil refined
28 000 ML Importedcrude oil
Total supply
18 000 MLPetrol sold to wholesalers
Source: Bureau of Resources and Energy Economics (BREE), Australian Petroleum Statistics, Issue 215 (June 2014); ACCC estimates based on data obtained from firms monitored through the ACCC’s monitoring process and APAC biofuel consultants, Australian Biofuels 2013−14 (October 2014).
This chapter outlines the main features of the Australian downstream petroleum industry and highlights developments in the structure of the industry in 2013–14. In particular, this chapter details recent developments in Australian refining and importing operations and the latest trends in the wholesale and retail sectors.
3.2 Crude oil productionIn 2013–14 Australia continued to export the majority of its crude oil production and rely on imports for domestic refining.
The majority of domestic crude oil is light and sweet and is mainly sourced from two areas in Australia: the North West Shelf in Western Australia and the South East Gippsland Basin in Victoria. Although Australian refineries are able to process these crude oils, companies generally prefer to export a large proportion of Australian light and sweet crude oil, as these crude oil grades have traditionally generated premium prices in international markets. Australian refineries are also capable of processing cheaper, heavier varieties of crude oil, which are imported.
The decline in crude oil production in Australia over the past decade continued in 2013−14, with Australia producing around 19 500 megalitres (ML) of crude oil, a decrease from around 21 300 ML in 2012−13 (8 per cent).
12 Monitoring of the Australian petroleum industry December 2014

Chart 3.1 shows the volume and percentage of Australian crude oil and condensate production used for domestic use or exported between 2002–03 and 2013–14.27
Chart 3.1 Volumes and percentage of Australian crude oil and condensate production used for domestic use or exported: 2002–03 to 2013–14
0
5 000
10 000
15 000
20 000
25 000
30 000
35 000
2013-142012–132011–122010–112009–102008–092007–082006–072005–062004–052003–042002–03
meg
alitres
ExportedRefined in Australia
76%
24%
Source: Department of Resources, Energy and Tourism (RET) and BREE, Australian Petroleum Statistics, various issues.
Note: Due to data revisions by BREE, the chart may not be comparable with equivalent charts in previous monitoring reports.
Since 2004–05 Australia has generally exported increasing proportions of its locally produced crude oil. This trend continued in 2013–14, with 76 per cent of Australia’s crude oil production being exported, while 24 per cent was used in local refineries.
3.2.1 Origin of crude oil importsThe major sources of crude oil imports to Australia between 2010−11 and 2013–14 are shown in chart 3.2. Malaysia continued to be the largest source of crude oil, increasing from around 5400 ML in 2012−2013 to around 6600 ML in 2013−14. United Arab Emirates and Indonesia also remained large sources of crude oil imports, while there was a marked increase in the amount of crude oil sourced from Russia, Congo and Papua New Guinea in 2013–14 compared with 2012–13.
27 Condensate is defined in the Excise Act 1901 as either (a) liquid petroleum, that is, a mixture of hydrocarbons that is produced from gas wells and that is liquid at standard temperature and pressure after recovery in surface preparation facilities, or (b) another substance that is derived from gas associated with oil production and that is liquid at standard temperature and pressure.
Monitoring of the Australian petroleum industry December 2014 13

Chart 3.2 Major sources of crude oil imports to Australia: 2010–11 to 2013–14
Malaysia
United ArabEmirates
Indonesia
Nigeria
Vietnam
New Zealand
Congo
Russia
Gabon
PapuaNew Guinea
Brunei
Libya
0 1000 2000 3000 4000 5000 6000 7000 8000
2010–11 2012–13 2013–142011–12
megalitres
Source: BREE, Australian Petroleum Statistics, various issues.
3.3 Australian refiningThere are five refineries currently operating in Australia:
• Bulwer Island, Brisbane (BP)
• Kwinana, Perth (BP)
• Lytton, Brisbane (Caltex)
• Altona, Melbourne (Mobil)
• Corio, Geelong (Shell).
Australia’s refineries are small by international standards and face increasing competitive pressures from large and complex international refineries. In 2013−14 there were a number of significant events that occurred within Australia’s refining sector.
14 Monitoring of the Australian petroleum industry December 2014

Shell announced in April 2013 its intention to sell its refinery in Geelong, and in February 2014 Shell announced that it had reached a binding agreement to sell its Australian downstream business (which included the Geelong refinery and its retail business) to Vitol.28 Vitol completed the acquisition on 13 August 2014 and launched Viva Energy Australia (the trading name of Vitol’s Australian business).29
In April 2014 BP announced plans to halt refining operations at its Bulwer Island refinery in Brisbane by mid-2015.30 BP commented that the growth of very large refineries in the Asia-Pacific region was driving structural change within the fuel supply chain in Australia and putting huge commercial pressure on smaller scale plants. Against this background BP concluded that the best option for strengthening its long-term supply position in the east coast retail and commercial fuels markets was to purchase product from other refineries.
In August 2014 Caltex Australia announced that it was in the process of converting its Kurnell refinery in Sydney to an import terminal and the refinery closure would commence in October 2014.31 On 14 October 2014 Caltex Australia announced that the Kurnell Terminal had commenced operations, reaching a significant milestone in the $270 million project to convert the historic refinery site to Australia’s largest fuel import terminal.32
One of the key factors contributing to these structural changes in the refining sector is the increasing competitive pressure that Australian refineries face from Asia’s large low-cost refineries. Chapter 4 provides further discussion on the significance of Asian refining capacity in a global context.
3.3.1 Refinery capacityThe most recent estimate of Australia’s refining capacity from the Australian Institute of Petroleum (AIP) indicates a total capacity for the five current refineries of 33 100 ML per annum.33
Australia’s total refining capacity has fallen in recent years, due to the closure of Shell’s Clyde refinery and Caltex’s Kurnell refinery, both in Sydney. AIP estimates indicate that when the closure of BP’s Bulwer Island refinery takes effect in mid-2015, total capacity will drop by a further 5910 ML per annum.34
28 Shell Australia (2014), Shell agrees sale of downstream businesses in Australia to Vitol, media release, 21 February 2014: http://www.shell.com.au/aboutshell/media-centre/news-and-media-releases/2014/shell-agrees-sale-of-downstream-businesses-in-australia-to-vitol.html, accessed on 11 September 2014.
29 Viva Energy (2014), Vitol completes acquisition of Shell’s Australian Downstream business; Launches Viva Energy Australia, Media release, 13 August 2014: http://www.vivaenergy.com.au/media-centre/news/2014/launch-viva-energy-australia, accessed on 11 September 2014.
30 BP (2014), BP Bulwer Island Refinery: processing to halt, media release, 2 April 2014: http://www.bp.com/en_au/australia/media/media-releases/bulwer-island-refinery-processing-halt.html, accessed on 1 September 2014.
31 Caltex Australia (2014), Marketing & Distribution growth continues; Kurnell refinery to commence shut down in October, ASX/Media release, 25 August 2014: http://www.caltex.com.au/Media%20Items/25%20August%2020–14%20-%20Marketing%20and%20Distribution%20growth%20continues,%20Kurnell%20refinery%20to%20commence%20shut%20down%20in%20October.pdf, accessed on 11 September 2014.
32 Caltex Australia (2014), Australia’s largest fuel terminal begins service to customers, media release, 14 October 2014 http://www.caltex.com.au/LatestNews/Pages/NewsItem.aspx?ID=13485, accessed on 15 October 2014.
33 Australian Institute of Petroleum, Downstream Petroleum 2013, p. 10.
34 Ibid.
Monitoring of the Australian petroleum industry December 2014 15

3.3.2 Refinery productionChart 3.3 shows annual production and sales of petrol and diesel in Australia between 2002–03 and 2013–14.
Chart 3.3 Production and sales of petrol and diesel in Australia: 2002–03 to 2013–14
meg
alitres
0
5 000
10 000
15 000
20 000
25 000
30 000
2013–142012–132011–122010–112009–102008–092007–082006–072005–062004–052003–042002–03
Petrol production Petrol sales Diesel production Diesel sales
Source: ACCC analysis based on data obtained from firms monitored through ACCC’s monitoring process.
It shows that petrol production by Australian refineries in 2013−14 was at its lowest level over the past 12 years, at just over 14 000 ML. Petrol sales were also the lowest for this period, decreasing from 18 302 ML in 2012–13 to 17 578 ML in 2013–14 (a 4 per cent decrease).
Diesel production continued to remain steady in 2013−14 at just under 12 000 ML, while diesel sales increased to be at the highest level for the past 12 years, at just under 24 000 ML.
16 Monitoring of the Australian petroleum industry December 2014

3.3.3 Petrol refining sharesChart 3.4 shows the shares for petrol production of the four refiners in Australia in 2002–03 and 2013–14.
Chart 3.4 Share of petrol production in Australia: 2002–03 and 2013–14
2002–03
Mobil18%
BP25%
Caltex29%
Shell28%
2013–14Mobil16%
Shell19%
BP30%
Caltex35%
Source: ACCC analysis based on data obtained from firms monitored through ACCC’s monitoring process.
Following the closure of its Clyde refinery, Shell’s share of petrol production was 19 per cent in 2013−14 (down from 28 per cent in 2002−03 and from 25 per cent as recently as 2011−12). While both Caltex and BP’s shares have increased since 2002−03, these are expected to fall following the closure of Caltex’s Kurnell refinery in October 2014 and BP’s Bulwer Island refinery in mid-2015.
3.3.4 Future of the Australian refining sectorWhile Australia’s refining capacity has decreased over the past decade and will continue to fall in the short to medium term, there has been a significant increase in Asian refining capacity in recent years. This issue is discussed further chapter 4.
As Australia increases its reliance on imported petrol, access to terminals and other associated infrastructure will be a critical factor in supporting the expected growth in imports. Recent and planned expansion of both independently-owned and refiner-wholesaler-owned import capacity suggests that capacity may be available to cater for greater volumes. Developments in major terminal infrastructure are outlined in section 3.5.4.
3.4 Imports and exports of refined fuelAs a result of reduced refining capacity, Australia has become more reliant on imports of refined petroleum products in recent years. It is expected that imports will continue to provide a larger proportion of petroleum sales in Australia as refining capacity further decreases over the next few years.
In 2013–14 imports contributed 20 per cent of petrol sales in Australia. As recently as 2002–03, imports of refined petrol were relatively small because Australian refineries generally had the capacity to meet domestic demand.
Exports of refined fuels form a very small proportion of the Australian petroleum industry. Exports are likely to continue to decline as domestic refining capacity is reduced in coming years.
Monitoring of the Australian petroleum industry December 2014 17

3.4.1 Volumes of petrol and diesel importsChart 3.5 shows the volumes of petrol and diesel imported into Australia between 2002–03 and 2013–14. It indicates that:
• The total volume of petrol imports in 2013−14 decreased slightly by 0.6 per cent from 2012−13, to 3634 ML.
• Diesel import volumes increased by around 9 per cent to 13 628 ML in 2013−14. Since 2006–07 diesel imports have more than doubled.
Chart 3.5 Volumes of petrol and diesel imported into Australia: 2002–03 to 2013–14
0
2 000
4 000
6 000
8 000
10 000
12 000
14 000
16 000
18 000
2013–142012–132011–122010–112009–102008–092007–082006–072005–062004–052003–042002–03
meg
alitres
DieselPetrol
Source: RET and BREE, Australian Petroleum Statistics, various issues.
Over the past decade, the volume of diesel imports has increased to be almost four times that of petrol imports. This is the result of increasing domestic demand for diesel and most Australian refineries being configured with a focus on petrol.
3.4.2 Source of petrol importsTable 3.1 shows the source of petrol imports into Australia between 2009–10 and 2013−14.
Table 3.1 Sources of petrol imports into Australia: 2009–10 to 2013−14
2009−10 2010−11 2011−12 2012−13 2013−14
ML % ML % ML % ML % ML %
Singapore 3330 86 2101 79 2709 74 2601 71 2241 62
South Korea 278 7 407 15 677 18 934 26 1096 30
Taiwan 91 2 90 3 0 0 0 0 119 3
India 0 0 0 0 148 4 0 0 103 3
Malaysia 0 0 0 0 11 0 0 0 74 2
Other 190 5 54 2 134 4 120 3 0 0
Total 3888 100 2651 100 3679 100 3655 100 3634 100
Source: RET and BREE, Australian Petroleum Statistics, various issues.
Note: Totals do not always add up due to rounding.
18 Monitoring of the Australian petroleum industry December 2014

The majority of refined petrol imports in 2013−14 (62 per cent) came from Singapore. South Korea has increasingly become an important source of imports into Australia, accounting for 30 per cent in 2013–14, increasing from 7 per cent in 2009–10. Conversely, Singapore has become a somewhat less important source of imports, decreasing from 86 per cent to 62 per cent in the same period. These two nations combined provided 92 per cent of the refined petrol imports into Australia in 2013–14.
3.5 Major terminal infrastructureAs part of its monitoring activities, the ACCC collects detailed data on the use of and plans for major terminal infrastructure from the users, owners and operators of this infrastructure.35 Major terminal infrastructure in Australia is operated by refiner-wholesalers, major independent wholesalers/importers and other independent companies specialising in terminal ownership and operation.36
The majority of major terminals are owned and operated by refiner-wholesalers, though in recent years there has been a trend of increasing independent ownership and operation of terminals. This trend is expected to continue. In addition, with the recent and planned reduction in refining capacity, refiner-wholesalers are expected to also increase their ownership and operation of terminals. For example, Caltex’s Kurnell refinery ceased operations and re-opened as an import terminal in October 2014.
3.5.1 Capacity and throughputChart 3.6 shows petrol capacity and throughput by type of terminal owner between 2009–10 and 2013–14.
After a large decrease in 2012–13, the petrol capacity of independently-owned terminals increased by 18 per cent in 2013−14, while petrol throughput at independently-owned terminals remained steady.
Capacity at refiner-wholesaler-owned terminals was also steady in 2013–14, following a decrease in capacity in 2012−13. Despite this, petrol throughput at refiner-wholesaler-owned terminals decreased by 7 per cent in 2013–14, continuing a downward trend that began in 2011−12.
35 Major terminals are defined as terminals which have a pipeline connection to a port and/or refinery. They are the point at which fuel which has been refined in Australia or imported is stored, distributed or sold by refiner-wholesalers and importers.
36 The term ‘refiner-wholesalers’ is used to refer to the four major petrol companies that are involved in refining as well as wholesaling activities. While only BP and Caltex are integrated from refining to retailing, Mobil and Shell are involved in wholesaling and through their wholesale activities have branding arrangements with certain retailers.
Monitoring of the Australian petroleum industry December 2014 19

Chart 3.6 Petrol capacity and throughput by type of terminal owner: 2009–10 to 2013–14
0
80
160
240
320
400
480
560
640
720
800
Refiner-wholesaler owned terminals
Independently owned terminals
2013-142012-132011-122010–112009–10
meg
alitres
Capacity
0
2 000
4 000
6 000
8 000
10 000
12 000
14 000
16 000
18 000
20 000
2013–142012–132011–122010–112009–10meg
alitres
Throughput
Refiner-wholesaler owned terminalsIndependently owned terminals
Source: ACCC analysis based on data obtained from firms monitored through ACCC’s monitoring process.
Note: This chart consists of throughput from both import terminals and refinery-pipeline terminals.
3.5.2 Import terminals with spare capacityMajor terminals are the point at which petrol that has been refined in Australia or imported into Australia is stored, distributed or sold by refiner-wholesalers and importers. Having access to this key infrastructure provides companies that wish to supply petrol into the Australian market with a strong basis for competing in the downstream petrol industry.
There are two types of major terminals:
• Import terminals—these are connected to a port by a direct pipeline and generally receive all of their petrol from ships. Most independently-owned terminals are import terminals.
• Refinery-pipeline terminals—these are connected to a refinery by a direct or indirect pipeline. These terminals may also be connected to a port, though are likely to receive most of their petrol from the refinery. Some independently-owned terminals are in this category.
Import terminals generally have significantly lower turnover than refinery-pipeline terminals, as refinery-pipeline terminals have a direct link to what is usually an on-going source of supply.37 The lower turnover at import terminals is also partially due to the fact that these terminals are typically larger than refinery-pipeline terminals.
Table 3.2 shows petrol turnover by type of terminal in 2012−13 and 2013−14.
37 Turnover refers to the number of times a terminal is effectively emptied and filled in the year.
20 Monitoring of the Australian petroleum industry December 2014

Table 3.2 Petrol turnover by type of terminal: 2012–13 and 2013–14
Import terminals Refinery-pipeline terminals
Capacity Throughput Turnover Capacity Throughput TurnoverML ML times ML ML times
2012−13 556.5 5010.9 9.0 471.5 13 591.2 28.8
2013−14 616.9 4410.5 7.1 479.0 13 069.9 27.3
Source: ACCC analysis based on data obtained from firms monitored through ACCC’s monitoring process.
Notes: Excludes import terminals that exist primarily to service local mines.
The import terminal throughput figures are not directly comparable with the figures In table 3.1, as import terminal throughput will include some domestically produced petrol as well as imported petrol redirected from other terminals.
Some data may not be comparable with data in the 2013 ACCC petrol monitoring report due to data revision by some of the monitored companies.
In 2013–14 Australia’s import terminals had an average petrol turnover of 7.1 times, down from 9.0 in 2012−13. Refinery-pipeline terminals had an average turnover of 27.3 times in 2013−14, also down from 28.8 in 2012−13. The decrease in turnover at import terminals partly reflects the slight increase in petrol capacity at import terminals in 2013–14.
Gaining access to terminals is an important aspect of independent importers’ ability to compete in the petrol industry. Table 3.3 shows import terminal petrol turnover by type of ownership in 2013−14. There are relatively low levels of turnover at independently-owned import terminals, which suggests that there may be available spare capacity for independent importers.38
Table 3.3 Import terminal petrol turnover by type of ownership: 2013–14
CapacityML
ThroughputML
Turnovertimes
Independently-owned 337.1 1964.9 5.8
Refiner-wholesaler-owned 279.8 2445.6 8.7
Australia 616.9 4410.5 7.1
Source: ACCC analysis based on data obtained from firms monitored through ACCC’s monitoring process.
Notes: Excludes throughput for terminals that exist primarily to service local mines.
Totals do not always add up due to rounding.
3.5.3 Growth in independent importsThe volume of petrol imported by independent wholesalers monitored by the ACCC continued to grow in 2013–14, with independent import volumes increasing by 6.7 per cent. This follows an increase of 5.4 per cent in 2012–13. Independents accounted for 27 per cent of total imports by monitored firms in 2013–14—a slight increase from 2012–13 (26 per cent). While independent imports remain relatively small in terms of the total wholesale market, these independents provide a competitive discipline on the larger refiner-wholesalers.
The share of independent imports as a percentage of total petrol imports has been volatile since 2002–03. For example, independent imports accounted for 52 per cent of total imports in 2002–03, but then decreased to around 14 per cent in 2003–04. This was mainly due to Mobil’s imports increasing substantially following the closure of the Port Stanvac refinery. Since 2007–08, independent imports as a percentage of total petrol imports by monitored firms have ranged from around 5 per cent to around 36 per cent. However, in absolute terms petrol imports by independent importers have been increasing over time and have increased almost six-fold since 2007–08.
38 Some independently-owned terminals may be the subject of exclusive leasing arrangements.
Monitoring of the Australian petroleum industry December 2014 21

The recent growth in independent imports has been partly driven by the increased availability of Australian-standard petrol in overseas refineries, greater access to import terminals and the scaling back of the Australian refining sector.
3.5.4 Major developments in terminal infrastructureIn 2013–14 there were a number of key developments in the use, expansion and ownership of terminal infrastructure. The following is a list of the most significant developments, categorised by state.39
New South Wales• Stolthaven Australia Pty Ltd is planning to build two 18 ML diesel tanks at its Mayfield
(Newcastle) terminal, to add to the three 18 ML diesel tanks currently operating there.
• In October 2014 Caltex Australia announced that its Kurnell Terminal in Sydney has commenced operations, reaching a significant milestone in the project to convert the refinery site to Australia’s largest fuel import terminal.40
Queensland• In December 2013 Neumann Petroleum completed a 15 ML increase in diesel capacity at its
Eagle Farm terminal.
• In May 2014 Puma Energy opened its Mackay terminal, consisting of six storage tanks with 56 ML of capacity. Puma also stated that new import terminals were in the planning stage In Newcastle and Perth, while acquired terminals in Townsville and Brisbane would be expanded and upgraded.41
South Australia• In April 2014 Terminals Pty Ltd completed the construction of an 85 ML petrol, diesel and
biodiesel import terminal at Outer Harbour. Caltex will use the terminal to replace the Birkenhead terminal under a 25-year lease.42
Victoria• United Petroleum is in the planning stage of developing two new petrol storage tanks at its
Hastings terminal with a total capacity of 50 ML, as well as two additional loading bays.
• Mobil is in the preliminary design phase of three 20 ML tanks for its Yarraville terminal, with capacity for jet fuel, unleaded petrol and diesel. Mobil estimates that this construction will be completed in 2017.
Western Australia• Caltex are currently reviewing adding 30 ML of additional diesel capacity at its Port
Hedland terminal.
39 Appendix C of this report lists all major terminals on a state-by-state basis.
40 Caltex Australia (2014), Australia’s largest fuel terminal begins service to customers, media release, 14 October 2014 http://www.caltex.com.au/LatestNews/Pages/NewsItem.aspx?ID=13485, accessed on 15 October 2014
41 Bloomberg Businessweek, Puma Energy mulls acquisitions, 27 May 2014, http://investing.businessweek.com/research/stocks/private/snapshot.asp?privcapId=1365–1468, accessed on 14 October 2014
42 Caltex Australia (2014) New terminal underpins reliable fuel supply for SA, Media release, 30 April 2014 http://www.caltex.com.au/LatestNews/Pages/NewsItem.aspx?ID=13451, accessed on 14 October 2014.
22 Monitoring of the Australian petroleum industry December 2014

3.6 WholesalingThe wholesale sector of the Australian petrol industry mainly consists of the four refiner-wholesalers and large independent wholesalers, such as Ausfuel, Liberty, Neumann Petroleum and United.43 There are also a number of other small wholesale companies that operate in Australia’s petrol industry, however these companies fall outside the scope of the ACCC’s monitoring activities.
3.6.1 Wholesale shareRefiner-wholesalers comprise the majority of the wholesale sector, accounting for over 90 per cent of the market monitored by the ACCC. This can be seen in table 3.4 which shows the monitored companies’ share of wholesale petrol sales volumes between 2006–07 and 2013–14.
Shares for all companies were relatively steady between 2012−13 and 2013−14. Mobil’s share decreased from 13 per cent to 12 per cent, and Shell’s share decreased from 28 per cent to 27 per cent. The share of independent wholesalers increased from 7 per cent to 8 per cent.
Table 3.4 Monitored companies’ share of wholesale petrol sales volumes: 2006–07 to 2013−1444
2006−07%
2007−08%
2008−09%
2009−10%
2010−11%
2011−12%
2012−13%
2013−14%
BP 17 17 17 17 18 18 18 18
Caltex 36 36 36 36 36 36 35 35
Mobil 15 15 13 13 9 10 13 12
Shell 27 27 28 29 30 29 28 27
Independent wholesalers
4 5 6 6 6 7 7 8
Source: ACCC analysis and estimates based on data obtained from firms monitored through ACCC’s monitoring process.
Note: Totals may not sum to 100 due to rounding.
3.6.2 Types of wholesale salesRefiner-wholesalers sell petrol to a range of wholesale customers. This can be seen in table 3.5, which shows wholesale petrol sales of the refiner-wholesalers by type of customer between 2009−10 and 2013–14.
The composition of the refiner-wholesalers’ wholesale customer base has changed over time, particularly in terms of volumes sold to specialist retailers.
The specialist retailer category includes independents and supermarkets and has consistently accounted for the largest percentage of wholesale sales since the commencement of monitoring in 2007–08. However, after several years of increases, the proportion of specialist retailers fell in 2013−14, from 63.3 per cent to 61.7 per cent.
43 Ausfuel and Neumann Petroleum are both owned by Puma Energy.
44 Some volumes are not reported to the ACCC as wholesale transactions and therefore understate the share of independent wholesalers. Accordingly, the ACCC has made adjustments to the data to reflect this.
Monitoring of the Australian petroleum industry December 2014 23

Table 3.5 Refiner-wholesalers’ wholesale petrol sales by type of customer: 2009–10 to 2013–14
2009−10%
2010−11%
2011−12%
2012−13%
2013−14%
Resellers and distributors 7.2 8.3 8.7 7.4 7.7
Specialist retailers (incl supermarkets) 53.0 55.3 60.1 63.3 61.7
Refiner-wholesaler branded retailers 35.8 32.6 27.7 25.9 26.3
Other retailers 3.9 3.8 3.5 3.4 4.3
Source: ACCC analysis and estimates based on data obtained from firms monitored through ACCC’s monitoring process.
Note: Totals may not sum to 100 per cent due to rounding.
3.6.3 Developments in the wholesale sectorThere were two significant developments in the structure of the wholesale sector:
• In June 2014 Caltex Australia announced that it had completed its acquisition of the Scott’s Fuel Divisions, which comprised 18 depots and 27 retail sites in New South Wales, South Australia and Victoria.45 This followed a decision by the ACCC on 21 May 2014 to not oppose the proposed acquisition, subject to a court-enforceable undertaking which required Caltex to divest certain retail sites in Mt Gambier and Nhill.
• In August 2014 Viva Energy Australia announced that it has entered into an agreement to purchase a non-controlling stake in Liberty Oil (a large independent fuel wholesaler and distributor).46 On 28 October 2014 the ACCC announced its decision to not oppose the acquisition.
3.7 RetailingThe Australian petrol retail sector has undergone significant changes over the last 10 years or so. In particular, while the four refiner-wholesalers previously sold the majority of petrol to motorists, supermarkets and the large independent retail chains currently account for the majority of retail petrol sales.
3.7.1 Retail shareTable 3.6 shows the current share of retail sale volumes among the refiner-wholesalers, supermarkets and large independent retail chains between 2002−03 and 2013−14.
It is important to note that the category ‘large independent retail chains’ in the table includes only 7-Eleven and On The Run, and the retail operations of Puma and United. A number of non-major branded independent sites are not included in this table, as the ACCC only collects data from the major players in the industry. Therefore, this category should not be considered to represent the total number of independent sites in Australia.
45 Caltex Australia (2014), Caltex completes acquisition of the Scott’s Fuel Divisions, Media release, 4 June 2014: http://www.caltex.com.au/LatestNews/Pages/NewsItem.aspx?ID=13462, accessed on 11 September 2014
46 Viva Energy (2014), Viva Energy Australia to acquire stake in Liberty Oil, Media release, 25 August 2014: http://www.vivaenergy.com.au/media-centre/news/2014/viva-energy-australia-acquire-stake-in-liberty-oil-25-aug-2014, accessed on 11 September 2014.
24 Monitoring of the Australian petroleum industry December 2014

Table 3.6 Share of volume of monitored retail petrol sales by brand: 2002–03 to 2013–14
BP Caltex Mobil Shell Woolworths/Caltex
(co-branded)
Coles Express/Shell (co-branded)
Large independent retail chains
% % % % % % %
2002−03 20 24 19 20 10 - 6
2003−04 20 22 17 3 14 16 7
2004−05 18 18 12 3 18 25 6
2005−06 19 16 11 3 20 25 6
2006−07 19 16 11 3 22 22 7
2007−08 20 17 11 2 22 20 8
2008−09 19 16 11 2 23 22 9
2009−10 17 16 10 2 23 22 10
2010−11 19 18 – 2 23 22 17
2011−12 16 18 – 2 24 23 17
2012−13 15 18 – 2 24 24 18
2013−14 13 18 – 2 24 24 19
Source: ACCC analysis and estimates based on data obtained from firms monitored through ACCC’s monitoring process.
Notes: Data is only for monitored companies, so does not include the total volume of retail sales in Australia.
In 2011–12 Puma Energy purchased the retail operations of Neumann and Ausfuel. In 2010–11 Mobil sold its retail sites to 7-Eleven.
Large independent retail chains are: 7-Eleven, On The Run, and the retail operations of United and Puma Energy. In 2002–03 Woolworths was not co-branded with Caltex.
Totals may not add up to 100 per cent due to rounding.
In 2013−14 shares of retail petrol sales by brand were similar to 2012–13. The only changes were that:
• BP’s share continued to decrease, falling from 15 per cent to 13 per cent
• the share of large independent retail chains increased slightly, from 18 per cent to 19 per cent.
In 2013−14 the combined share of the refiner-wholesalers of branded retail sales of the monitored firms was 33 per cent. This share has steadily declined over the years. In 2002–03 their combined share was 83 per cent.
On the other hand, large independent retail chains and the supermarkets experienced significant increases in the share of retail petrol sales monitored by the ACCC over the last 12 years. Between 2002−03 and 2013–14 the share of the supermarkets increased from 10 per cent to 48 per cent, and the share held by the large independent retail chains increased from 6 per cent to 19 per cent. Part of the increase in the share of the large independent retail chains has resulted from sales of sites by the refiner-wholesalers, such as the sale of Mobil sites to 7-Eleven in 2010 and the sale of BP sites to On The Run in 2014.
Monitoring of the Australian petroleum industry December 2014 25

3.7.2 Retail business typesThe brand name displayed at a petrol retail site does not always indicate the owner or the type of ownership structure of the site. Table 3.7 shows the percentage of monitored retail sites by brand and business operator in 2013−14.
Table 3.7 Percentage of monitored retail sites by brand and business operator: 2013−14a
Brand Business operated by:b
Directly Owned and
Operated
Distributor Owned
Operations
Independent Retailer
Franchiseed Commission agentd
Total
% % % % % %
BP 6.5 10.7 9.2 0.3 0.0 26.6
Caltex 1.9 7.3 2.1 1.8 7.3 20.4
Mobil 0.0 0.8 0.0 0.0 0.0 0.8
Shell 0.5 0.0 4.1 0.0 0.0 4.6
Woolworths/Caltex(co-branded)
12.2 0.0 0.0 0.0 0.0 12.2
Coles Express/Shell(co-branded)
12.4 0.0 0.0 0.0 0.0 12.4
Specialist retailersc 0.0 0.0 1.9 7.9 0.1 9.9
Independent wholesalers
0.0 0.9 3.2 1.8 7.2 13.1
Total 33.5 19.7 20.5 11.8 14.5 100.0
Source: ACCC analysis and estimates based on data obtained from firms monitored through ACCC’s monitoring process.
Notes: (a) Data is only for monitored companies. Therefore, it does not include the total number of retail sites in Australia. Data is not comparable with data in previous monitoring reports due to site reclassifications by some monitored companies. Due to rounding some rows and columns may not equal the total.
(b) Sites are categorised by the operator of the business on the site, regardless of branding.
(c) Specialist retailers include those businesses operated by distributors, independent retail chains and other independents.
(d) Excludes supermarkets. Commission agents generally manage a business owned by a refiner-wholesaler or independent chain, and are generally compensated in the form of a commission based on the quantity of product sold. Franchisees rent a site or a number of sites and source fuel from the franchisor and brand it accordingly. They may also receive price support from the franchisor (wholesaler), providing some influence over the retail prices set by the franchisee.
It indicates that in 2013–14 only 8.9 per cent of petrol retail sites were directly owned and operated by the refiner-wholesaler with the brand on the site. The majority of petrol sites are actually owned and/or operated by distributors, franchisees, independent retailers or commission agents. Coles Express and Woolworths were the only companies that operated all of the business on the sites displaying their brands (24.6 per cent of petrol retail sites).
3.7.3 Retail site numbersOver the long term, one of the most significant trends in the retail sector has been the decline in the number of retail sites. Past monitoring reports have highlighted the gradual decline in retail sites since the 1970s.47 This trend has appeared to have plateaued in recent years, as the number of retail sites has remained approximately in the range between 6000 and 6500 since the mid-2000s.
47 See chapter 4 of the 2011 ACCC petrol monitoring report for more analysis on the decline in retail site numbers since the 1970s.
26 Monitoring of the Australian petroleum industry December 2014
3.7.4 Developments in the retail sectorThe Australian retail sector also experienced change in 2013–14, with a number of major changes throughout the year.
In February 2014 Vitol purchased Shell’s 870-site retail business in Australia, and Caltex purchased 27 retail sites from Scotts (four of which the ACCC required Caltex to sell in order for the acquisition to be approved).
Peregrine advised the ACCC in May 2013 that it intended to acquire 16 BP company owned and operated retail petrol sites in Adelaide and nine sites in regional South Australia. On 8 May 2014 the ACCC announced its decision to not oppose the proposed acquisition by Peregrine, after accepting a court-enforceable undertaking, which required Peregrine to divest itself of three sites that it would otherwise have acquired from BP and one of its existing sites.
In January 2014 ExxonMobil Australia announced that it had signed a long-term agreement with 7-Eleven Australia which would see the Mobil brand return to 7-Eleven’s petrol stations for the first time since the sale of ExxonMobil’s retail assets to 7-Eleven in 2010.48
In April 2014 7-Eleven announced its plan to expand into Western Australia, with more than 10 stores opening in the coming year, including standalone convenience stores and fuel stores, and as many as 75 stores opening over the next five years.49
48 Exxon Mobil Australia (2014), ExxonMobil and 7-Eleven sign agreement to return Mobil brand to 7-Eleven network in Australia, Media release, 9 January 2014: http://www.exxonmobil.com.au/Australia-English/PA/news_releases_20140109_mobil.aspx, accessed on 11 September 2014.
49 7-Eleven Australia (2014), 7-Eleven to expand into Western Australia in 2014, Media release, 8 April 2014: http://www.7eleven.com.au/media-centre/article/7-eleven-to-expand-into-western-australia-in-2014, accessed on 11 September 2014.
Monitoring of the Australian petroleum industry December 2014 27

28 Monitoring of the Australian petroleum industry December 2014

4 International context
Key points• Crude oil prices have demonstrated significant volatility over the last decade and have
consolidated at historically high levels in recent years. – The annual average price of Brent crude oil in 2013−14 was USD 109.52 per barrel,
marginally higher than last year (USD 109.13 per barrel).
• In 2013−14 crude oil price movements were influenced by factors such as instability in the Middle East, conflict in Ukraine, US stock levels and global economic conditions.
• Strong economic activity and growing demand for crude oil in developing nations, particularly in Asia, have supported high crude oil prices in recent years.
• Australia’s refining capacity has decreased significantly since 2002, in contrast to the strong growth in capacity in the Asia-Pacific region.
4.1 IntroductionCrude oil prices are the most important influence on movements in retail petrol prices in Australia and around the world.50
As the base product used in the production of petrol, the price of crude oil significantly influences international prices of refined petrol, which in turn determine changes in the retail price of petrol paid by Australian consumers.
This chapter assesses crude oil pricing in greater detail and analyses key demand and supply factors affecting the international price of crude oil. It also considers future crude oil prices and, consequently, the outlook for the price of petrol.
4.2 Crude oil pricesCrude oil is one of the most commonly traded commodities in the world and is the base product in the production of a range of fuels including petrol, diesel and aviation fuel as well as other goods such as heating oil, lubricants and asphalt.
While the price of crude oil is influenced by a variety of factors, over time large swings in the price of crude oil also reflect changes in perceptions of the state of the world economy. In the long-term, economic growth is often accompanied by greater demand for fuel. However, in the short-term, crude oil prices often exhibit significant volatility on the basis of market sentiment.
4.2.1 Crude oil prices in 2013−14Crude oil prices have demonstrated significant volatility in recent years, and in 2013−14 prices continued to fluctuate (albeit at relatively high levels).
Chart 4.1 shows weekly average Brent crude oil prices between July 2013 and June 2014.
50 All prices in this chapter are nominal prices unless otherwise specified.
Monitoring of the Australian petroleum industry December 2014 29

Chart 4.1 Weekly average Brent crude oil prices: July 2013 to June 2014USD
per bl
85
90
95
100
105
110
115
120
125
Jun-14May-14Apr-14Mar-14Feb-14Jan-14Dec-13Nov-13Oct-13Sep-13Aug-13Jul-13
Source: ACCC calculations based on Platts data.
The chart shows that Brent crude oil prices increased in July and August 2013 due to concern about US involvement in Syria and increased tensions in Egypt, as well as strong economic data from the US and China. This was followed by a decrease between September and November 2013, influenced by an easing of tensions in Syria and an increase in US inventories. Prices were broadly stable until June 2014, when they increased due to supply concerns following unrest in Iraq and anxiety over the situation in Ukraine. Over the course of 2013−14 Brent crude oil prices increased by around USD 8 per barrel.
On an historical basis, Brent crude oil prices remained high in 2013−14. The annual average price was USD 109.52 per barrel. This was slightly higher than in 2012−13 (USD 109.13 per barrel), and was the second highest nominal annual average price on record, behind 2011−12 (USD 112.56 per barrel).
4.2.2 Crude oil prices over the longer termAs noted earlier, higher crude oil prices have also been accompanied by a heightened level of volatility in crude oil pricing.
Chart 4.2 shows monthly average Brent crude oil prices over the last 20 years in both nominal and real terms.
30 Monitoring of the Australian petroleum industry December 2014

Chart 4.2 Monthly average Brent crude oil prices in nominal and real terms: July 1994 to June 2014
USD
per bl
0
20
40
60
80
100
120
140
160
20142013201220112010200920082007200620052004200320022000199919981997199619951994 2001
Brent (real)Brent (nominal)
Source: ACCC calculations based on Platts data and U.S. Department of Labor, Bureau of Labor Statistics, Consumer Price Index for all urban consumers, www.dlt.ri.gov/lmi/pdf/cpi.pdf, accessed on 24 September 2014.
Note: Real values in 2013−14 dollars.
Brent crude oil prices steadily increased from around 1999 until 2006. There was a slight decline in prices in 2006, which was followed by steep increases in 2007. Monthly average nominal Brent crude oil prices increased from around USD 54 per barrel in January 2007 to around USD 133 per barrel in June 2008. The Global Financial Crisis (GFC) occurred soon after and this saw prices fall dramatically to around USD 41 per barrel in December 2008. By April 2011 prices had recovered most of their pre-GFC highs, reaching around USD 123 per barrel. Since then, while Brent crude oil prices have remained volatile, they have consolidated at relatively high levels compared with historical averages.
4.2.3 Different grades of crude oilCrude oils are differentiated on the basis of their chemical properties and consistency and are generally described in terms of their sulphur content and density:
• Crude oils with relatively low sulphur content (less than 0.5 per cent) are considered to be ‘sweet’, while crude oils containing a higher proportion of sulphur are considered to be ‘sour’.
• A crude oil is ‘heavy’ or ‘light’ based on its relative density according to the American Petroleum Industry gravity index.
Crude oils that are light and sweet are generally sold at a premium to those which are sour and heavy, as they are easier to refine and can produce larger volumes of higher value end-products such as petrol and diesel.
The prominent grades of crude oil that serve as key benchmarks for crude oil prices around the world are:
• Brent—a light, sweet North Sea crude oil that is commonly used as a pricing benchmark across many regions of the world.
• Dubai—a heavier, more sour crude oil produced in the United Arab Emirates. Dubai is commonly used as a benchmark for pricing exports of sour Middle East crude oils to Asia.51
51 Reuters, at http://glossary.reuters.com/index.php/Dubai_Crude, accessed on 24 September 2014.
Monitoring of the Australian petroleum industry December 2014 31

• West Texas Intermediate (WTI)—a light sweet crude oil from fields in west Texas deliverable into Cushing, Oklahoma. WTI is the major benchmark for US crude oil prices and is a deliverable grade for New York Mercantile Exchange crude oil futures contracts.52
• Tapis—a light sweet crude oil used as a benchmark in the South-East Asia region (although in recent years Tapis is being replaced by Brent as the key crude oil benchmark in the region).
Historically, the prices of these four grades of crude oil have traded at broadly similar levels. Chart 4.3 shows weekly average prices of Brent, Dubai, WTI and Tapis crude oils over the last three years.
Chart 4.3 Weekly average Brent, Dubai, WTI and Tapis crude oil prices: July 2011 to June 2014
USD
per bl
50
70
90
110
130
150
170
Jun-14Apr-14Jan-14Oct-13Jul-13Apr-13Jan-13Oct-12Jul-12Apr-12Jan-12Oct-11Jul-11
DubaiBrent TapisWTI
Source: ACCC calculations based on Platts data.
In 2011 and 2012 WTI traded at significantly lower prices than the other grades of crude oil. The reasons behind this divergence have been covered in past ACCC petrol monitoring reports and included a build-up of stocks at the major trading hub in Cushing, Oklahoma and a lack of adequate infrastructure to move supplies form the land locked Cushing hub to major refining hubs.53
In 2013−14 the spread between the prices of these four benchmarks narrowed. While WTI remained the cheapest of the four, in the second half of 2013−14 the prices of the four crude oils stayed within a relatively narrow band compared with previous years.
52 Reuters, at http://glossary.reuters.com/index.php/WTI, accessed on 24 September 2014.
53 See: ACCC, Monitoring of the Australian petroleum industry, December 2011, pp. 41−42; ACCC, Monitoring of the Australian petroleum industry, December 2012, p. 42; and ACCC, Monitoring of the Australian petroleum industry, December 2013, pp. 38−39.
32 Monitoring of the Australian petroleum industry December 2014

4.3 Demand for crude oilEconomic growth is a key long-term driver of demand for crude oil. As emerging economies continue to grow, world demand for energy, including crude oil, is also expected to increase in the medium to long-term. The International Energy Agency (IEA) forecasts that emerging economies will account for more than 90 per cent of net energy demand growth to 2035.54
4.3.1 Crude oil consumptionCrude oil has traditionally been the largest source of world energy. Chart 4.4 shows forecast world energy consumption to 2040 by the United States Energy Information Agency (US EIA) for the major sources of energy: liquid fuels (including crude oil), natural gas, coal, nuclear and renewables.
Chart 4.4 Annual world energy consumption by fuel type: 1990 to 2040 (projected)
qua
drillion
Btu
0
100
200
300
400
500
600
700
800
900
20402035203020252020201520102005200019951990
NuclearRenewablesNatural gasCoalLiquids
Projections
5%11%
22%
28%
34%
7%
15%
23%
27%
28%
Source: US EIA, International Energy Outlook 2013, at: http://www.eia.gov/forecasts/archive/ieo13/more_highlights.cfm, accessed on 31 October 2014.
In 2010 crude oil and other liquids met around 34 per cent of the world’s energy needs. The US EIA predicts that demand for crude oil will continue to grow in the future. However, crude oil’s share of the energy mix will decrease over time, as growth in renewables, nuclear and natural gas outpaces growth in crude oil. By 2040 crude oil is forecast to comprise only 28 per cent of world energy consumption. This reflects the expectation that rising crude oil prices will cause consumers to switch to other energy sources.
54 IEA, World Energy Outlook 2013 Factsheet, p. 1.
Monitoring of the Australian petroleum industry December 2014 33

4.3.2 Oil demand growthFor some time growth in oil consumption has been most prevalent in developing economies. Chart 4.5 shows the projected change in consumption of crude oil and other liquid fuels by region between 2010 and 2040.
Chart 4.5 Change in consumption of crude oil and other liquid fuels by region: 2010−2040 (million barrels per day)
–5 0 5 10 15 20 25 30 35 40
Total OECD
OECD Europe
OECD Asia
OECD Americas
Non-OECD Europe and Eurasia
Central and South America
Africa
Middle East
Non-OECD Asia
Total non-OECD
million bl per day
Source: US EIA, International Energy Outlook 2014, p. 26.
There is a clear contrast between forecast rates of growth for OECD and non-OECD regions, with consumption in total non-OECD regions increasing by around 34 million barrels per day (mbpd) over the 30-year period, and non-OECD Asia increasing by around 23 million barrels per day. By contrast, total OECD consumption is projected to fall by around 1.4 million barrels per day, while OECD Asia is forecast to decline by around 500 000 barrels per day.
Overall, on the demand side, the US EIA expects that consumption of crude oil and other liquids will continue to increase, with virtually all the growth coming from non-OECD countries. Strong economic growth in these countries will increase consumption in the transportation and industrial sectors. However, rising prices for crude oil and other liquid fuels will lead many users outside these sectors to switch to other energy sources where possible.55
4.4 Supply of crude oilThe main factors that determine the long-term supply of crude oil can be grouped into three categories:
• investment and production decisions of the Organisation of Petroleum Exporting Countries (OPEC)
• the economics of non-OPEC supply
• the economic viability of other (i.e. non-petroleum liquids) supply.56
OPEC is an inter-governmental cartel consisting of 12 oil producing and exporting nations: Algeria, Angola, Ecuador, Iran, Iraq, Kuwait, Libya, Nigeria, Qatar, Saudi Arabia, the United Arab Emirates and Venezuela. OPEC’s stated objective is ‘to coordinate and unify the petroleum policies of its Member Countries and ensure the stabilisation of oil markets in order to secure an efficient,
55 US EIA, International Energy Outlook 2014, p. 4.
56 US EIA, Annual Energy Outlook 2013, p. 58.
34 Monitoring of the Australian petroleum industry December 2014

economic and regular supply of petroleum to consumers, a steady income to producers and a fair return on capital for those investing in the petroleum industry’.57
4.4.1 Oil reservesFigure 4.1 shows the major proven crude oil reserves around the world.
Figure 4.1 Major proven crude oil reserves, billions of barrels: 2014
98
Libya
Nigeria
Algeria
Canada
United States
Mexico
Rest of the w
orld
Saudi Arabia Iran
Iraq
Kuwait
UAE
Qatar
Venezuela
Brazil
Russia
Kazakhstan
China
12
31
13
24
25
10 268
157
140
104
98
298
173
48 37
80 30
Source: US EIA, International Energy Statistics, at http://www.eia.gov/cfapps/ipdbproject/iedindex3.cfm?tid=5&pid=57&aid=6&cid=all,&syid=2010&eyid=2014&unit=BB, accessed on 30 September 2014.
Note: US data is for 2013.
Around half of the world’s proven reserves of crude oil are located in the Middle East, with Saudi Arabia holding the most reserves in that region. More than 80 per cent of the world’s oil reserves are held by just eight countries. Of those countries, only Canada and Russia are non-OPEC members. In total, OPEC member countries hold around 75 per cent of the world’s proven crude oil reserves.
Since 2000 most of the increase in proven oil reserves came from revisions to existing reserves rather than discoveries of new reserves. In 2013−14 Venezuela was the world’s largest holder of oil reserves, with 18 per cent of the world total, followed by Saudi Arabia with 16 per cent.58
4.4.2 Major producersIn 2013 the US was the largest producer of crude oil with an output of 12.3 mbpd, overtaking Saudi Arabia (11.6 mbpd), which was the largest producer in 2012. Chart 4.6 shows the top 30 crude oil producing countries in 2013. Australia fell out of the top 30 (it ranked 29 in 2012) and is currently ranked 31, with an output of 0.45 mbpd (down from 0.52 mbpd in 2012).
57 OPEC Mission Statement, at: http://www.opec.org/opec_web/en/about_us/23.htm, accessed on 24 September 2014.
58 US EIA, International Energy Outlook 2013, p. 37.
Monitoring of the Australian petroleum industry December 2014 35

Chart 4.6 Top 30 crude oil producing countries: 2013
0
2
4
6
8
10
12
14
million bl p
er day
Uni
ted
Sta
tes
Sau
di A
rab
ia
Rus
sia
Chi
na
Can
ada
Uni
ted
Ara
b E
mira
tes
Iran
Iraq
Mex
ico
Kuw
ait
Bra
zil
Ven
ezue
la
Nig
eria
Qat
ar
Ang
ola
No
rway
Alg
eria
Kaz
akhs
tan
Co
lom
bia
Lib
ya
Ind
ia
Om
an
Ind
one
sia
Aze
rbai
jan
Uni
ted
Kin
gd
om
Arg
entin
a
Eg
ypt
Mal
aysi
a
Ecu
ado
r
Thai
land
Non-OPECOPEC
Source: US EIA, International Energy Statistics, at http://www.eia.gov/cfapps/ipdbproject/IEDIndex3.cfm?tid=5&pid=53&aid=1, accessed on 30 September 2014.
In 2013 OPEC member countries accounted for only 40 per cent of global crude oil production, considerably less than the proportion of reserves they hold. Since 1980 OPEC member countries have accounted for around 37 per cent of global oil production, ranging from a low of 28 per cent in 1985 to a high of 42 per cent in 2008.59
The US EIA’s reference case predicts that OPEC production will grow from 37 million barrels per day in 2012 to 52 million barrels per day in 2040, with OPEC members expected to maintain a market share of between 40 and 45 per cent for the projected period.60 This forecast is based on the assumption that OPEC will continue to restrict production to maintain this relatively stable market share.
4.4.3 Unconventional sources of supplyUnconventional supplies of oil are becoming an increasingly important part of the global energy mix. As crude oil prices continue to rise, unconventional supplies will become a more economically viable source of supply. This is especially the case as increasing geopolitical concerns prevent access to prospective conventional sources.
Conventional sources of liquid fuels include crude oil and lease condensate, natural gas plant liquids, and refinery gain, while unconventional sources include oil sands, extra-heavy oil, biofuels, coal-to-liquids, gas-to-liquids, and shale oil.61
59 US EIA, International Energy Statistics, at http://www.eia.gov/cfapps/ipdbproject/IEDIndex3.cfm?tid=5&pid=53&aid=1, accessed on 30 September 2014.
60 US EIA, Annual Energy Outlook 2014, p. A-39.
61 US EIA, International Energy Outlook 2013, p. 2.
36 Monitoring of the Australian petroleum industry December 2014

The US EIA predicts that global production of unconventional liquid fuels will increase from 3.9 mbpd (or around 5 per cent of total production) in 2008 to 13.1 mbpd (or around 12 per cent of total production) in 2035.62
Production of shale oil has grown dramatically in the US and is expected to make up 25 per cent of US supply in 2020.63 The major sources of future unconventional oil supply are predicted to be Canadian oil sands, US and Brazilian biofuels, and Venezuelan extra-heavy oil.64
4.5 Refining capacityThe ability to refine crude oil to produce end-products is another crucial factor contributing to the supply and price of petrol. Australia’s refining industry is relatively small and, as discussed in chapter 3, domestic refining capacity has decreased in recent years.
Competitive pressures from newer, more complex and lower-cost Asian refineries mean that by mid-2015 Australia will have only four refineries in operation. In April 2014 BP announced that it planned to halt refinery operations at its Bulwer Island refinery in Queensland by mid-2015. In February 2014 Swiss-based energy company Vitol announced that it would purchase Shell’s Geelong refinery.
Australia currently accounts for less than 1 per cent of global refining capacity, despite being part of the fast growing Asia-Pacific region (which is now the world’s most significant region in terms of refining capacity).
The latest BP Statistical Review of World Energy shows world refining capacity by region for the three years 2003, 2008 and 2013. This is shown in table 4.1.
Table 4.1 World refining capacity by region: 2003, 2008 and 2013 (thousand barrels per day)
2003 2008 2013 Change 2003 to 2013 (%)
Asia-Pacific 22 541 26 110 31 284 39 á
Middle East 7 058 7 672 8 822 25 á
North America 20 316 21 086 21 389 5 á
Africa 3 141 3 148 3 517 12 á
Europe and Eurasia 24 780 24 592 23 887 4 â
South and Central America 6 347 6 655 6 029 5 â
World 84 183 89 263 94 928 13 á
Source: BP, BP Statistical Review of World Energy, June 2014, p. 16.
It can be seen that over the 10 years to 2013:
• the Asia-Pacific region expanded capacity by around 39 per cent to have around 33 per cent of world refining capacity
• the Middle East region also experienced strong growth in capacity, expanding by 25 per cent
• smaller gains occurred in Africa and North America
• South and Central America, and Europe and Eurasia experienced a fall in capacity.
62 US EIA, International Energy Outlook 2011, p. 25.
63 US EIA, AEO 2014 Early Release Overview, at http://www.eia.gov/forecasts/aeo/er/executive_summary.cfm, accessed on 6 November 2014.
64 US EIA, International Energy Outlook 2011, p. 2.
Monitoring of the Australian petroleum industry December 2014 37

Chart 4.7 shows the change in refining capacity between 2003 and 2013 for countries in the Asia-Pacific region.
Chart 4.7 Refining capacity in the Asia-Pacific region by country: 2003 and 2013
0
2 000
4 000
6 000
8 000
10 000
12 000
14 000
OtherAsia-Pacific
IndonesiaTaiwanThailandSingaporeSouthKorea
JapanIndiaChinaAustralia
thou
sand
bl p
er day
20132003
Source: BP, BP Statistical Review of World Energy, June 2014, p. 16.
The rapid expansion in the Chinese and Indian economies over the past decade has coincided with a surge in refining capacity in the Asia-Pacific region, with China’s capacity increasing by around 100 per cent and India’s by 88 per cent between 2003 and 2013. South Korea, Singapore, Thailand and Taiwan have also increased their refining capacity in the last 10 years, albeit by a much smaller degree. Only established economies, such as Australia and Japan, have seen a decrease in refining capacity during this period.
38 Monitoring of the Australian petroleum industry December 2014

5 Wholesale prices
Key points• Wholesale petrol prices in Australia are set on the basis of the import parity price (IPP). This is
because Australia is a net importer of refined petrol; therefore prices must reflect international prices to attract sufficient fuel into the Australian market.
• The IPP is based on the international price of refined petrol plus other import costs and is an indicator of the notional average cost of importing refined petrol into Australia. – In 2013–14 the international price of refined petrol accounted for over 95 per cent of
the IPP.
• The IPP has closely reflected actual import costs over the years.
• The IPP and taxes (excise and the GST) are the major elements of wholesale prices in Australia—accounting for around 97 per cent of wholesale prices in 2013–14.
• In 2013–14 movements in average actual wholesale prices closely tracked movements in published terminal gate prices.
5.1 IntroductionThis chapter analyses the wholesale sector in the Australian petroleum industry. Petrol prices are examined at the point where petrol enters the wholesale sector as well as the point where petrol moves from the wholesale sector into the retail sector.
5.2 Wholesale sectorPetrol in the wholesale sector comes from two sources: production from domestic refineries operated by the refiner-wholesalers; and refined petrol imported to port terminals.
The three broad categories of companies operating in the wholesale sector are:
• Refiner-wholesalers: BP, Caltex, Mobil and Shell. These companies supply petrol which has been produced in domestic refineries, bought from other refiner-wholesalers through ‘buy-sell’ transactions, and imported.65
• Independent wholesalers: including Puma Energy, United and Liberty. These companies source petrol from Australian refiner-wholesalers and/or overseas refineries.
• Independent importers: a small number of companies import low volumes of petrol and sell directly to independent wholesalers.
In 2013−14 the refiner-wholesalers supplied the majority of Australia’s petrol:
• about 80 per cent of wholesale volumes were refined domestically, with the balance sourced from imports66
• refiner-wholesalers imported around 73 per cent of total petrol imports with independent importers accounting for the balance.67
In total the four refiner-wholesalers supplied about 95 per cent of total supplies of petrol.
65 Buy–sell transactions allow refiner-wholesalers to purchase large volumes of petrol in some cities and regional centres where they do not operate a refinery or import terminal (see section 5.3).
66 Bureau of Resources and Energy Economics (BREE), Australian Petroleum Statistics, Issue 215 (June 2014).
67 ACCC estimates based on data obtained from firms monitored through ACCC’s monitoring process. Refer to section 3.5.3 for more information.
Monitoring of the Australian petroleum industry December 2014 39

There has been a significant increase in the share of petrol imported by independent wholesalers/ importers over recent years—from around 6 per cent of imports in 2008–09 to around 27 per cent in 2013−14. As noted in chapter 3, this has resulted from increased availability of Australian-standard petrol in overseas refineries and greater access to import terminals.
Refiner-wholesalers and independent wholesalers are the main distributors of petrol in the wholesale sector to a number of other companies including:
• their company owned and operated retail sites, franchisees and commission agents
• independent retailers, both branded and unbranded
• independent wholesalers
• independent distributors and/or end-users such as miners, farmers and large commercial entities.
The role of the wholesale sector in the context of the flow of petrol through the industry is illustrated in figure 5.1.
Figure 5.1 Flow of petrol through sectors of the Australian petroleum industry: 2013−14
Refiner-wholesalers Independent wholesalers
Productionand import
Retail
Wholesale supply and distribution
Mining andcommercial
users
Mining andcommercial
users
Company owned
distributors
Independentbranded
distributors
Company owned
distributors
Direct delivery tocompany and
franchisee retail sites
Direct delivery tocompany and
franchisee retail sites
Terminal storage Terminal storage
Company operatedand franchisee sites
Company operatedand franchisee sites
Independent branded sites
Independent sites
Retail customers
Importedcargoes
Importedcargoes
Refineryproduction
Buy-sell transactions
Source: ACCC.
40 Monitoring of the Australian petroleum industry December 2014

5.3 Wholesale price benchmarksThere are two key price benchmarks in determining wholesale prices: the import parity price (IPP) and the terminal gate price (TGP).
5.3.1 Import parity priceThe notional cost of importing refined petrol to Australia is the IPP. As Australia is a net importer of refined petrol, the cost of marginal supplies is the cost of imports. Refiner-wholesalers utilise the IPP benchmark as the basis for setting wholesale prices. There is no specific value for the IPP routinely published in Australia but it is based on the price of petrol refined to Australian fuel standards as well as the transport costs of shipping the fuel to the relevant locations around Australia.
The IPP has three main components:
• the benchmark price of petrol at the main source of imports
• any quality premium required to account for the difference between the price of petrol refined to Australian fuel standards and petrol meeting the benchmark specifications
• costs that would be incurred in importing petrol, such as freight, wharfage and other incidental costs.
Singapore is the main source of petrol imported into Australia. The benchmark price used by the refiner-wholesalers to determine the price of RULP in Australia is the Platts price for Singapore Mogas 95 Unleaded (Mogas 95).
Mogas 95 is an international benchmark price subject to supply and demand factors in the global market for refined petrol. The Australian fuel quality standards for RULP are higher than the Mogas 95 specifications. The IPP includes a quality premium to reflect this difference.
The formula used to determine the IPP for RULP varies from company to company, but can generally be expressed as:
IPP (RULP) = Benchmark RULP price (Mogas 95) + quality premium
+ freight + insurance and loss + wharfage + other costs
The components of the IPP in the five largest cities over the last three years are shown in table 5.1 and the components of the IPP in 2013−14 as a proportion of the total IPP are shown in chart 5.1.
Table 5.1 Components of annual average IPP for RULP in the five largest cities: 2011−12 to 2013−14
Exchange rate1 AUD = USD
Mogas 95cpl
Quality premium
cpl
Total freight
cpl
Insurance and loss
cpl
Wharfagecpl
Othercpl
IPPcpl
2011−12 1.02 75.7 1.2 2.0 0.3 0.3 0.3 79.8
2012−13 1.02 74.7 1.2 2.4 0.3 0.3 0.2 79.1
2013−14 0.91 82.4 0.8 2.4 0.3 0.3 0.2 86.5
Source: ACCC analysis based on data obtained from firms monitored through the ACCC’s monitoring process.
Note: The data in table 5.1 is not comparable with data in table 9.1 (PULP IPP) as one refiner-wholesaler calculates its PULP IPP differently. The components in table 9.1 have been adjusted to reflect this.
Monitoring of the Australian petroleum industry December 2014 41

Chart 5.1 Components of annual average IPP for RULP in the five largest cities as a proportion: 2013−14
Other 0.2%Wharfage 0.3%Insurance and loss 0.4%Total freight 2.8%
Quality premium 1.0%
Mogas 95 95.3%
Source: ACCC analysis based on data obtained from firms monitored through the ACCC’s monitoring process.
The chart shows that the main component of the IPP in 2013−14 was the price of Mogas 95. For the past two years Mogas 95 has accounted for around 95 per cent of the IPP. Due to both the significance of the price of Mogas 95 in the IPP and its variability, changes in Mogas 95 prices drive changes in the IPP.
Table 5.1 shows that the other components of the IPP are small and do not change much over the years.
Another influence contributing to changes in the IPP is the AUD–USD exchange rate. Many components of the IPP, and most importantly Mogas 95 prices, are quoted in USD. The AUD–USD exchange rate was significantly lower in 2013−14 than in the previous two years, leading to higher Mogas 95 prices in Australian cents per litre.
5.3.1.1 IPP and actual import costs
While the IPP is a measure of the notional cost of imported petrol, it is likely to be different from the actual cost of imports for a number of reasons. These include: differences in the timing of payment for import cargoes; movements in the AUD–USD exchange rate; and the number of import transactions in a particular period.68
Generally the average actual cost of importing RULP into the five largest Australian cities has closely followed the IPP. This is evident from chart 5.2 which shows monthly average actual import costs and the IPP for RULP in the five largest cities in 2013−14.
68 For a more extensive analysis of the IPP see chapter 6 of the 2009 ACCC petrol monitoring report.
42 Monitoring of the Australian petroleum industry December 2014

Chart 5.2 Monthly average actual import costs and the IPP for RULP in the five largest cities: July 2013 to June 2014
0
10
20
30
40
50
60
70
80
90
100
110
120
130
140
150
Jun-14May-14Apr-14Mar-14Feb-14Jan-14Dec-13Nov-13Oct-13Sep-13Aug-13Jul-13
cpl
Import costs (weighted by volume) IPP
Source: ACCC analysis based on data obtained from firms monitored through the ACCC’s monitoring process.
The difference between monthly average actual import costs and the monthly average IPP in 2013−14 was 2.7 cpl, which indicates that the IPP is generally a reasonable approximation of actual import costs.
5.3.1.2 IPP and buy-sell transactions
In those locations where a refiner-wholesaler does not operate a refinery but maintains a presence in the wholesale market, it is faced with three options to source refined petrol:
• import petrol to its own or another company’s terminal
• transport petrol from a refinery or terminal it operates in another location
• obtain petrol from a refinery or terminal in the local area, operated by a different refiner-wholesaler.
The third option is often the most efficient way for a refiner-wholesaler to access local supplies in those locations where it does not operate a refinery. Traditionally referred to as ‘buy-sell’ transactions, these are considered pre-wholesale transactions, occurring in the supply sector along with production and import activities (see figure 5.1).
Chart 5.3 shows monthly average net buy–sell prices (i.e. excluding excise and GST) and the IPP for RULP in the five largest cities in 2013−14. It indicates that buy-sell prices also closely track the IPP.
Monitoring of the Australian petroleum industry December 2014 43

Chart 5.3 Monthly average net buy–sell prices and the IPP for RULP in the five largest cities: July 2013 to June 2014
0
10
20
30
40
50
60
70
80
90
100
110
120
130
140
150
Jun-14May-14Apr-14Mar-14Feb-14Jan-14Dec-13Nov-13Oct-13Sep-13Aug-13Jul-13
cpl
Net buy–sell price (weighted by volume) IPP
Source: ACCC analysis based on data obtained from firms monitored through the ACCC’s monitoring process.
If buy-sell prices were to move significantly out of line with the IPP, this would create incentives to import or export refined petrol. For example, if buy-sell prices were noticeably higher than the IPP, refiner-wholesalers could opt to import petrol at the lower cost of import parity. The strong relationship between the IPP and buy-sell prices suggests that buy-sell prices are generally competitive with the costs of importing.
5.3.2 Terminal gate pricesTGPs are the spot prices at which petrol can be bought from a refinery or terminal. As most wholesale transactions are governed by a contract, or similar negotiated agreement, few transactions actually occur at the published TGP.
Despite this, TGPs are an informative point of reference for analysing trends in average wholesale prices. Under the Oilcode, each refiner-wholesaler and independent wholesalers publish their TGPs online daily.
TGPs are calculated with reference to the IPP and by adding excise and the GST, other operating costs incurred in the wholesale sector (including storage and local transportation) and a wholesale margin.
The TGP formula, which may vary from company to company, can be commonly expressed as:
TGP = IPP + excise + GST + wholesale operating costs + wholesale margin
The components of the TGP in the five largest cities over the last three years are shown in table 5.2 and the components of the TGP in 2013−14 as a proportion of the total TGP are shown in chart 5.4.
44 Monitoring of the Australian petroleum industry December 2014

Table 5.2 Components of annual average TGP for RULP in the five largest cities: 2011−12 to 2013−14
IPPcpl
Excisecpl
GSTcpl
Operating costs
cpl
Wholesale margin
cpl
TGPcpl
2011−12 79.8 38.1 12.4 1.0 3.8 135.1
2012−13 79.1 38.1 12.3 1.0 3.8 134.2
2013−14 86.5 38.1 13.0 1.1 3.7 142.5
Source: ACCC analysis based on data obtained from firms monitored through the ACCC’s monitoring process.
Chart 5.4 Components of annual average TGP for RULP in the five largest cities as a proportion: 2013−14
IPP 60.7%
Operating costs 0.8%Wholesale margin 2.6%
GST 9.1%
Excise 26.8%
Source: ACCC analysis based on data obtained from firms monitored through the ACCC’s monitoring process.
Chart 5.4 indicates that the IPP is the largest component of, and contributor to, changes in the TGP. In 2013−14 it represented around 61 per cent of the annual average TGP. Excise and the GST combined accounted for a further 36 per cent. The other components of the TGP—operating costs and wholesale margins—represented only around 3 per cent of the annual average TGP in 2013−14.
Table 5.2 shows that, other than the IPP, the components of the TGP have changed little over the years.
5.4 Relationship between actual wholesale prices and wholesale benchmarks
Comparing actual wholesale prices paid by market participants with the IPP, and the TGP, provides an indication of the extent to which they reflect notional import costs.
The IPP does not include tax. Therefore, it is appropriate to compare it with a ‘net’ wholesale price (i.e. the average actual wholesale price less excise and GST). In contrast, TGPs are spot prices which do include tax. Therefore, they are compared with actual wholesale prices.
Monitoring of the Australian petroleum industry December 2014 45

5.4.1 Wholesale prices and the IPPChart 5.5 shows monthly average net wholesale prices and the monthly average IPP for RULP in the five largest cities (i.e. Sydney, Melbourne, Brisbane, Adelaide and Perth) in 2013−14. It indicates that the two series have a close relationship.
Chart 5.5 Monthly average net wholesale prices and the IPP for RULP in the five largest cities: July 2013 to June 2014
0
10
20
30
40
50
60
70
80
90
100
110
120
130
140
150
Jun-14May-14Apr-14Mar-14Feb-14Jan-14Dec-13Nov-13Oct-13Sep-13Aug-13Jul-13
cpl
Net wholesale price IPP
Source: ACCC analysis based on data obtained from firms monitored through the ACCC’s monitoring process.
Note: Wholesale prices have been adjusted to exclude excise and GST.
The difference between net wholesale prices and the IPP includes wholesale operating costs (including storage and local transportation) and the wholesale profit margin in the five cities.
Table 5.3 shows the difference between the annual average net wholesale price and the IPP in each of the five largest cities in 2013−14.
Table 5.3 Annual average net wholesale price and the IPP for RULP in the five largest cities: 2013–14
Net wholesale pricecpl
IPPcpl
Differencecpl
Sydney 89.7 86.8 2.9
Melbourne 90.9 86.7 4.2
Brisbane 91.0 86.5 4.5
Adelaide 89.8 86.7 3.1
Perth 91.0 85.7 5.3
Source: ACCC analysis based on data obtained from firms monitored through the ACCC’s monitoring process.
Note: Wholesale prices have been adjusted to exclude excise and GST.
The smallest difference was in Sydney (2.9 cpl) and the largest was in Perth (5.3 cpl). The differentials increased in all cities in 2013−14.
46 Monitoring of the Australian petroleum industry December 2014

5.4.2 Wholesale prices and TGPsActual wholesale prices can be compared with TGPs to illustrate how actual wholesale prices reflect the spot price benchmark for wholesale transactions.
Chart 5.6 shows monthly average wholesale prices and TGPs for RULP in the five largest cities in 2013−14. It indicates that movements in gross wholesale prices and TGPs tracked each other closely.
Chart 5.6 Monthly average wholesale prices and TGPs for RULP in the five largest cities: July 2013 to June 2014
90
100
110
120
130
140
150
160
170
180
190
Jun-14May-14Apr-14Mar-14Feb-14Jan-14Dec-13Nov-13Oct-13Sep-13Aug-13Jul-13
Wholesale price TGP
Source: ACCC analysis based on data obtained from firms monitored through the ACCC’s monitoring process.
Table 5.4 shows annual average wholesale prices and TGPs in the five largest cities in 2013−14. It shows that wholesale prices were marginally lower than TGPs in most cities in 2013−14. This was similar to the differentials observed in 2012−13.
Table 5.4 Annual average wholesale prices and TGPs for RULP in the five largest cities: 2013–14
Wholesale price cpl
TGP cpl
Difference cpl
Sydney 141.4 143.0 –1.6
Melbourne 142.2 142.4 –0.2
Brisbane 142.1 142.5 –0.4
Adelaide 141.1 142.6 –1.5
Perth 142.3 142.0 0.3
Source: ACCC analysis based on data obtained from firms monitored through the ACCC’s monitoring process.
Monitoring of the Australian petroleum industry December 2014 47

48 Monitoring of the Australian petroleum industry December 2014

6 Retail prices
Key points• The annual average retail price of regular unleaded petrol (RULP) in the five largest cities in
2013−14 was 150.6 cents per litre (cpl). – This was the third highest annual average price on record in real terms. – It was an increase of 9.3 cpl in nominal terms from 2012−13.
• In 2013−14 daily average retail petrol prices (on a seven-day rolling average basis) across the five largest cities ranged from a low of around 140 cpl in November 2013 to a high of around 159 cpl in January 2014—a range of 19 cpl. – However, the volatility in prices was generally within a narrow band—on around 82 per cent
of days in 2013−14 prices were within a 10 cpl range between 145 cpl and 155 cpl.
• Movements in Australian retail RULP prices are primarily determined by movements in the international price of refined petrol (Singapore Mogas 95 Unleaded) and the AUD–USD exchange rate.
• In 2013−14 Australian motorists were less protected than in recent years from higher international petrol prices because the annual average value of the Australian dollar (measured in US dollars) fell to its lowest level since 2009−10. – The average AUD-USD exchange rate in 2013−14 was USD 0.92 compared with USD 1.03
in 2012−13 and USD 0.88 in 2009−10. – If the average AUD-USD exchange rate in 2013−14 had been at the same level as in
2012−13, retail petrol prices in 2013−14 would have been around 10 cpl lower.
• As in previous years, the main components of retail RULP prices in 2013−14 were the international price of refined petrol (54 per cent) and excise and the GST (34 per cent).
6.1 IntroductionThis chapter primarily focuses on regular unleaded petrol (RULP) prices across the five largest cities (i.e. Sydney, Melbourne, Brisbane, Adelaide and Perth).69 However, it also examines:
• the prices of other grades of petrol—such as premium unleaded petrol (PULP) 95, PULP 98, and E10 (i.e. RULP with up to 10 per cent ethanol)—and diesel and automotive liquefied petroleum gas (LPG)
• retail prices in the three smaller capital cities (Canberra, Hobart and Darwin).
Petrol prices in regional locations across Australia are analysed in chapter 7.
While the analysis of petrol price movements in this chapter largely focuses on average prices across the five largest cities, price levels and price movements are not uniform across these cities. This is because factors specific to each city influence the extent of competition (and therefore prices).
69 References to petrol in this chapter are to regular unleaded petrol (RULP) unless otherwise specified.
Monitoring of the Australian petroleum industry December 2014 49

6.2 Retail petrol price movements
6.2.1 July 2013 to June 2014Chart 6.1 shows seven-day rolling average retail petrol prices, across the five largest cities for the period 1 July 2013 to 30 June 2014.70
A seven-day rolling average price is the average of the current day’s price and prices on the six previous days. Traditionally, the ACCC has used a seven-day rolling average to smooth out the influence of the regular petrol price cycles in the larger capital cities on price movements. This has been less effective in recent years because the duration of price cycles in most of the larger capital cities has become greater than seven days (see chapter 10).
Chart 6.1 Seven-day rolling average retail petrol prices, five largest cities: 1 July 2013 to 30 June 2014
135
140
145
150
155
160
165
170
cpl
Jul-
13
Aug
-13
Sep
-13
Oct
-13
Nov
-13
Dec
-13
Jan-
14
Feb
-14
Mar
-14
Ap
r-14
May
-14
Jun-
14
Source: ACCC calculations based on Informed Sources data.
Chart 6.1 shows that:
• as in previous years, retail prices were relatively volatile on a daily basis
• daily average retail petrol prices (on a seven-day rolling average basis) across the five largest cities ranged from a low of around 140 cpl in November 2013 to a high of around 159 cpl in January 2014—a range of 19 cpl
• the volatility in prices was generally within a narrow band—on around 82 per cent of days in 2013−14 prices were within a 10 cpl range between 145 cpl and 155 cpl.
The annual average price of petrol across the five largest cities in 2013−14 was 150.6 cpl. This was the third highest annual average price, in real terms, on record after 2007−08 (157.3 cpl) and 2005−06 (151.1 cpl).
In nominal terms, it was the highest on record and was 9.3 cpl higher than in 2012−13 (141.3 cpl).
70 The price in each city is given equal weighting.
50 Monitoring of the Australian petroleum industry December 2014

6.2.2 July 2011 to June 2014Chart 6.2 shows seven-day rolling average retail petrol prices across the five largest cities over the three year period, 1 July 2011 to 30 June 2014.
Chart 6.2 Seven-day rolling average retail petrol prices, five largest cities: 1 July 2011 to 30 June 2014
Jul-
11
Sep
-11
Nov
-11
Jan-
12
Mar
-12
May
-12
Jul-
12
Sep
-12
Nov
-12
Jan-
13
Mar
-13
May
-13
Jul-
13
Sep
-13
Nov
-13
Jan-
14
Mar
-14
May
-14
cpl
Jun-
14 120
130
140
150
160
170
Source: ACCC calculations based on Informed Sources data.
Chart 6.2 shows that petrol prices:
• were less volatile in 2013−14 than in the previous two years – the range between the highest and lowest prices in 2013–14 was 19 cpl, compared with
ranges of 23 cpl in 2012−13 and 22 cpl in 2011−12
• reached a peak of 159.0 cpl in January 2014 – while this was the highest price over the three year period, it was 3.5 cpl below the record
high levels in July 2008 of 162.5 cpl
• for most of the period since July 2011 retail prices largely ranged between 130 cpl and 160 cpl.
6.2.3 Prices in the three smaller capital citiesChart 6.3 shows monthly average retail petrol prices in Canberra, Hobart and Darwin from July 2013 to June 2014, compared with prices across the five largest cities.
Monitoring of the Australian petroleum industry December 2014 51

Chart 6.3 Monthly average retail petrol prices in Canberra, Hobart and Darwin and the five largest cities: July 2013 to June 2014
Jun-
14
May
-14
Ap
r-14
Mar
-14
Feb
-14
Jan-
14
Dec
-13
Nov
-13
Oct
-13
Sep
-13
Aug
-13
Jul-1
3
cpl
140
150
160
170
180
Canberra Hobart Darwin Five largest cities
Source: ACCC calculations based on Informed Sources data.
The chart shows that:
• prices in the three smaller capital cities were always higher than in the five largest cities
• prices in Darwin were always higher than those in Hobart and Canberra, and the five largest cities
• price relativities between the smaller capital cities and the five largest cities vary over time.
Factors that may be influencing the relatively higher prices in Canberra, Hobart and Darwin are similar to those factors relating to smaller markets outlined in section 7.2.
6.3 Determinants of petrol pricesMovements in retail petrol prices in Australia are primarily influenced by two factors:
• movements in the international price of refined petrol (which itself is driven by the price of crude oil)
• the AUD–USD exchange rate (as the international prices of crude oil and refined petrol are expressed in US dollars).
Other influences on retail prices include the degree of competition at the wholesale and retail levels (including the regular retail price cycles that occur in the largest capital cities), the level of excise and taxes, international and domestic freight costs, the fuel quality premium (which includes a component for producing petrol to Australian fuel quality standards), and other wholesale and retail costs and margins.
6.3.1 International price of refined petrolThe price of refined petrol in Australia is set with reference to international benchmark prices. The relevant international benchmark price for petrol in Australia is the price of refined petrol in the Asia-Pacific region, the price of Singapore Mogas 95 Unleaded (Mogas 95).
52 Monitoring of the Australian petroleum industry December 2014

July 2013 to June 2014
Chart 6.4 shows movements in weekly average Mogas 95 prices for the period July 2013 to June 2014.
Chart 6.4 Weekly average Mogas 95 prices: July 2013 to June 2014
105
110
115
120
125
130
USD
per bl
Jul-
13
Aug
-13
Sep
-13
Oct
-13
Nov
-13
Dec
-13
Jan-
14
Feb
-14
Mar
-14
Ap
r-14
May
-14
Jun-
14
Source: ACCC calculations based on Platts data.
Over 2013−14 weekly average Mogas 95 prices were influenced by a range of factors:
• In the first half of July 2013 Mogas 95 prices increased by around USD 7 per barrel influenced by increases in regional demand, tightening of regional supply and increases in crude oil prices due to geopolitical concerns over Syria. Subsequently, they decreased by around USD 11 per barrel as regional demand fell amid an increase in gasoline stock levels.
• From mid-August to early-September 2014 Mogas 95 prices recovered by around USD 6 per barrel to a peak of around USD 121 as crude prices increased due to increased tensions in Syria. From then until early-November 2014 Mogas 95 decreased by around USD 10 per barrel to a trough of around USD 112 per barrel. This mirrored falls in crude oil prices due to an easing of tensions in Syria, high oil inventories in the US and a resolution to North Sea oil supply issues.
• From early-November 2014 to the end of June 2014 Mogas 95 prices trended upwards due to strong demand for refined petrol in the Asia-Pacific region and higher crude prices influenced by the conflicts in the Middle East and Ukraine.
The annual average Mogas 95 price in 2013−14 was around USD 119 per barrel. This was USD 2 below the annual average price in 2012−13 (USD 121 per barrel) and USD 4 below the highest ever level (in nominal terms) of USD 123 per barrel in 2011−12.
Refined petrol and crude oil prices
The price of crude oil is the major determinant of Mogas 95 prices. However, like the prices of most internationally traded commodities, the price of Mogas 95 is also determined by global and regional supply and demand conditions.
Monitoring of the Australian petroleum industry December 2014 53

Mogas 95 generally trades at a premium to Tapis crude oil.71 However, at times Mogas 95 may be cheaper than Tapis crude oil, when demand for refined petrol is relatively low compared with demand for crude oil. Conversely, the premium can be large when demand for refined petrol is relatively high compared with demand for crude oil.
Chart 6.5 shows the close relationship between Mogas 95 prices and Tapis crude oil prices in the period July 2013 to July 2014. While Mogas 95 prices and Tapis crude oil prices generally moved in a similar fashion over the year, the differential between weekly average Mogas 95 prices and Tapis crude oil prices varied from a high of around USD 12 per barrel in July 2013 to a low of around minus USD 3 per barrel in October 2013. The differential increased in the first half of 2014 to be at around USD 10 per barrel at the end of June 2014.
Chart 6.5 Weekly average Mogas 95 and Tapis crude oil prices: July 2013 to June 2014
105
110
115
120
125
130
USD
per bl
Mogas 95 Tapis
Jul-
13
Aug
-13
Sep
-13
Oct
-13
Nov
-13
Dec
-13
Jan-
14
Feb
-14
Mar
-14
Ap
r-14
May
-14
Jun-
14
Source: ACCC calculations based on Platts data.
6.3.2 AUD–USD exchange rateThe AUD–USD exchange rate is an important influence on domestic retail petrol prices because the international benchmark prices of refined petrol are expressed in US dollars.
Chart 6.6 shows movements in the daily AUD–USD exchange rate between 1 July 2013 and 30 June 2014.72
71 As noted in chapter 4, Australian refiner-wholesalers are increasingly using Brent crude oil as the appropriate international benchmark price.
72 These are the daily RBA 4.00 pm closing rates. See: http://www.rba.gov.au/statistics/frequency/exchange-rates.html.
54 Monitoring of the Australian petroleum industry December 2014

Chart 6.6 Daily AUD–USD exchange rates: 1 July 2013 to 30 June 2014USD
0.82
0.84
0.86
0.88
0.90
0.92
0.94
0.96
0.98
Jul-
13
Aug
-13
Sep
-13
Oct
-13
Nov
-13
Dec
-13
Jan-
14
Feb
-14
Mar
-14
Ap
r-14
May
-14
Jun-
14
Source: Reserve Bank of Australia (RBA) data.
Note: Exchange rates are the daily RBA 4.00 pm closing rates. See: http://www.rba.gov.au/statistics/frequency/exchange-rates.html.
From the beginning of July 2013 the value of the Australian dollar increased by around USD 0.05 to a peak of around USD 0.97 in October 2013. From then until late-January 2014 the AUD–USD exchange rate decreased by around USD 0.10 to a trough of around USD 0.87. Subsequently, the AUD–USD exchange rate increased by USD 0.07 to around USD 0.94 at the end of June 2014.
The average AUD–USD exchange rate in 2013−14 was USD 0.92. This was USD 0.11 lower than in 2012−13 (USD 1.03) and was the lowest annual exchange rate since 2009−10 (USD 0.88).
Influence of the exchange rate—July 2013 to June 2014
Chart 6.7 shows actual seven-day rolling average retail prices in the five largest cities in the period 1 July 2013 to 30 June 2014 and retail prices if the exchange rate was held constant at the average daily exchange rate in 2012−13 (i.e. around USD 1.03), everything else being equal (referred to as ‘calculated retail prices’).
Monitoring of the Australian petroleum industry December 2014 55

Chart 6.7 Seven-day rolling average retail petrol prices in the five largest cities with actual and constant AUD-USD exchange rates: 1 July 2013 to 30 June 2014
Seven-day rolling average (actual) Calculated retail prices: AUD=USD 1.03
120
125
130
135
140
145
150
155
160
165
170Ju
l-13
Aug
-13
Sep
-13
Oct
-13
Nov
-13
Dec
-13
Jan-
14
Feb
-14
Mar
-14
Ap
r-14
May
-14
Jun-
14
cpl
Source: ACCC calculations based on Informed Sources, Platts and RBA data.
The chart shows that actual retail prices were always higher than calculated retail prices during 2013−14. If the AUD-USD exchange rate in 2013−14 had been at the same level as it had been in 2012−13, calculated retail prices in 2013−14 would have been on average around 10 cpl lower than actual retail prices.
6.3.3 Retail petrol prices compared with Mogas 95 pricesChart 6.8 shows seven-day rolling average retail petrol prices in the five largest cities, and seven-day rolling average Mogas 95 prices (lagged by 10 days), over the period 1 July 2013 to 30 June 2014.73 For comparison purposes, it also shows retail prices with excise and GST removed (referred to as ‘adjusted retail prices’).
73 For retail prices the seven-day rolling average is the average of calendar days, but for Mogas 95 it is the average of working days (i.e. Monday to Friday). The refiner-wholesalers use a rolling average for Mogas 95 prices when determining their wholesale prices. Mogas 95 prices are lagged by 10 days as there is generally around a one to two-week lag between changes in international prices and changes in retail prices in the five largest cities. This is because of the averaging formula used by refiners in Australia when setting their wholesale prices and there is a lag between changes in wholesale prices and retail prices. The lag may be more pronounced during times of significant price volatility.
56 Monitoring of the Australian petroleum industry December 2014

Chart 6.8 Seven-day rolling average retail petrol prices, adjusted retail prices and Mogas 95 prices: 1 July 2013 to 30 June 2014
50
70
90
110
130
150
170
cpl
Retail petrol price—five largest cities, seven-day rolling average Adjusted retail petrol price (i.e. with excise and GST removed)—five largest cities, seven-day rolling average Mogas 95—seven working-day rolling average, lagged 10 days
Jul-
13
Aug
-13
Sep
-13
Oct
-13
Nov
-13
Dec
-13
Jan-
14
Feb
-14
Mar
-14
Ap
r-14
May
-14
Jun-
14
Source: ACCC calculations based on Informed Sources, Platts and RBA data.
The chart shows that in the period 1 July 2013 to 30 June 2014 retail prices in the five largest cities have closely followed movements in Mogas 95 prices in AUD terms. This indicates that, in aggregate, changes in domestic retail prices are overwhelmingly driven by changes in the international price of refined petrol.
Chart 6.9 shows the daily differential between seven-day rolling average adjusted retail petrol prices in the five largest cities and seven-day rolling average Mogas 95 prices (lagged by 10 days) in Australian cents per litre over the period 1 July 2013 to 30 June 2014.
The differential between adjusted retail prices and international refined petrol prices is also influenced by a range of other factors, including changes in the fuel quality premium, freight costs, wholesale and retail costs, and the level of local competition.
Monitoring of the Australian petroleum industry December 2014 57

Chart 6.9 Daily differential between seven-day rolling average adjusted retail petrol prices in the five largest cities and Mogas 95 prices: 1 July 2013 to 30 June 2014
12
14
16
18
20
22
24
cpl
Daily di�erential between adjusted retail petrol prices and Mogas 95 prices Average di�erential over the period
Jul-
13
Aug
-13
Sep
-13
Oct
-13
Nov
-13
Dec
-13
Jan-
14
Feb
-14
Mar
-14
Ap
r-14
May
-14
Jun-
14
Source: ACCC calculations based on Informed Sources, Platts and RBA data.
Between 1 July 2013 and 30 June 2014 the average daily differential between adjusted retail prices and Mogas 95 prices was 17.4 cpl.74 This was 0.7 cpl higher than the average in 2012−13 (16.7 cpl).
Chart 6.9 shows that the differential between Australian retail prices and the price of Mogas 95 moves up and down rapidly as a result of the influence of price cycles. Over the medium term, the differential varies around the average for the period. Therefore, comparisons between domestic retail prices and international benchmark prices should not focus on the differential on a particular day but consider the trend of the differential over a longer period of time.
6.4 Components of retail petrol pricesThere are three broad components of the retail price of petrol: the international price of refined petrol, domestic taxes (excise and the GST), and other costs and margins at the wholesale and retail levels.
Chart 6.10 shows the components of the annual average retail petrol price across the five largest cities in 2013−14. The two largest components of the pump price—Mogas 95 and taxes (excise and the GST)—accounted for 88 per cent of the price of petrol. These components are largely outside the control of the local petrol retailers.
74 This is slightly higher than the ‘Other costs and margins’ component in the petrol bowser in Chart 6.10 (17.3 cpl). This is because there are differences in the way these estimates have been calculated. Firstly, there is a 10-day lag in the Mogas 95 data in Chart 6.9, whereas no lag is used in Chart 6.10. Furthermore, seven-day rolling average prices are used in Chart 6.9, whereas annual data is used in Chart 6.10.
58 Monitoring of the Australian petroleum industry December 2014

Chart 6.10 Components of annual average retail petrol price in the five largest cities: 2013−14
Other costs and marginsTaxesMogas 95
PETROL150.6 cpl
cpl %
17.3 12
51.8 34
81.5 54
Source: ACCC calculations based on Informed Sources, Platts and RBA data.
The proportions of the annual average price in 2013−14 represented by each of Mogas 95, taxes and other costs and margins were broadly similar to those in 2012−13. In 2013−14 other costs and margins represented 12 per cent of the annual average price of a litre of petrol (an increase of 1 percentage point from 2012−13).
Chart 6.11 shows the proportion of the annual average retail petrol price of petrol across the five largest cities accounted for by taxes in each of the 15 years between 1999−2000 and 2013−14.
Monitoring of the Australian petroleum industry December 2014 59

Chart 6.11 Taxes as a percentage of the annual average retail petrol price in the five largest cities: 1999−2000 to 2013−14
per cen
t
20
30
40
50
60
70
1999
–00
2000
–01
2001
–02
2002
–03
2003
–04
2004
–05
2005
–06
2006
–07
2007
–08
2008
–09
2009
–10
2010
–11
2011
–12
2012
–13
2013
–14
Source: ACCC calculations based on Informed Sources and Parliamentary Library Research Brief, 13 April 2006, no. 15, 2005−06, Excise Taxation: developments since the mid-1990s.
The chart shows that over the 15 year period, the percentage of the total price that is made up of taxes has been steadily decreasing, from around 56 per cent in 1999−2000 to around 34 per cent in 2013−14.
An alternative way of showing the components of the price of petrol is presented in Chart 6.12. It shows the build-up of the annual average retail petrol price across the five largest cities in 2013−14 according to the relevant industry sector. Note that the components are to scale.
60 Monitoring of the Australian petroleum industry December 2014

Chart 6.12 Build-up of Australian retail petrol prices—five largest cities: 2013−14
Crude oil+
Refining costsand margins
(= refined petrol)+
Other costs, such as wharfage,shipping,
insurance (=IPP)+
Excise+
Wholesale GST(=TGP)
+
Retail GST+
Retail costsand margins
(= final bowser price)
cpl
Wholesale costs and
margins+
0
20
40
60
80
100
120
140
160
78.2 78.2 78.2 78.2 78.2 78.2 78.2 78.2
3.3 3.3
5.0 5.0 5.0 5.0 5.0 5.04.9 4.9 4.9 4.9 4.9
38.1 38.1 38.1 38.1
13.0 13.0 13.00.7 0.7
7.4
3.3 3.3 3.3 3.3 3.3
International component Wholesale component Retail component
Source: ACCC calculations based on Informed Sources, Platts, RBA, WA FuelWatch and information provided by the monitored companies.
The chart highlights that the starting point in the retail petrol price is the price of crude oil. It also indicates that, since the other largest component of the retail price of petrol is excise, movements in the price of petrol are fundamentally driven by movements in the international price of crude oil.
6.5 Gross indicative retail differences for petrolGross indicative retail differences (GIRDs) are calculated by subtracting average terminal gate prices (TGPs) from average retail petrol prices.
TGPs are the prices at which petrol can be purchased from wholesalers in the spot market and are posted on a regular basis on the websites of the major wholesalers. Not all wholesale transactions are at TGPs—some will be at higher prices and some will be at lower prices, depending on the specific commercial arrangements. However, TGPs can be regarded as indicative wholesale prices. Furthermore, TGPs reflect the price of petrol only, and exclude other retail operating costs (such as branding, transportation, labour, etc.).
As a result, GIRDs should be treated only as a useful approximate benchmark for the difference between wholesale and retail prices. They should not be confused with actual retail profits.75
Table 6.1 shows annual GIRDs in the five largest cities over the three year period 2011−12 to 2013−14.
75 Chapter 12 presents data on retail profits derived from financial data provided by the monitored companies.
Monitoring of the Australian petroleum industry December 2014 61

Table 6.1 Annual average retail petrol prices, TGPs and gross indicative retail differences, five largest cities: 2011−12 to 2013−14
Location YearAverage retail
price cpl
Average TGP cpl
Gross indicative retail difference
cpl
Five city average 2011–12 142.8 135.1 7.7
2012–13 141.3 134.2 7.1
2013–14 150.6 142.5 8.1
Sydney 2011–12 141.9 135.2 6.7
2012–13 140.4 134.6 5.8
2013–14 149.8 143.0 6.8
Melbourne 2011–12 141.1 134.7 6.4
2012–13 140.2 134.1 6.1
2013–14 149.0 142.4 6.6
Brisbane 2011–12 145.4 134.8 10.6
2012–13 144.0 134.1 9.9
2013–14 153.5 142.4 11.1
Adelaide 2011–12 142.1 135.1 7.0
2012–13 140.1 134.3 5.8
2013–14 149.7 142.6 7.1
Perth 2011–12 143.3 135.4 7.9
2012–13 141.9 134.0 7.9
2013–14 151.3 142.1 9.2
Source: ACCC calculations based on Informed Sources, WA FuelWatch and information provided by the monitored companies.
Table 6.1 shows that annual average GIRDs:
• increased in each of the five largest cities in 2013−14 from the previous year, and increased by 1.0 cpl on average across the five largest cities
• this followed a decrease in GIRDs in all of the five largest cities in 2012−13 except for Perth (where there was no change).
62 Monitoring of the Australian petroleum industry December 2014

6.6 Other grades of petrol
6.6.1 Retail prices of the different petrol gradesThe retail prices of the different grades of unleaded petrol—RULP, PULP 95 and 98, and E10—tend to move in a similar manner.
Chart 6.13 shows monthly average retail prices for these four grades of petrol in the five largest cities from July 2013 to June 2014.
Chart 6.13 Monthly average retail prices of RULP, PULP 95, PULP 98 and E10 in the five largest cities: July 2013 to June 2014
cpl
PULP 95 PULP 98E10 RULP
Jun-
14
May
-14
Ap
r-14
Mar
-14
Feb
-14
Jan-
14
Dec
-13
Nov
-13
Oct
-13
Sep
-13
Aug
-13
Jul-
13
130
135
140
145
150
155
160
165
170
175
Source: ACCC calculations based on Informed Sources data.
Retail prices of the different grades of petrol move in a similar manner because they are all set according to international refined petrol benchmark prices (which primarily move in line with changes in the price of crude oil). However, the price differentials between the various types of petrol vary over time. For example, retailers will generally set the price of PULP at a fixed premium to RULP. They will then adjust this premium from time to time reflecting changes in international benchmark differentials, local supply and demand factors, and other factors.
In 2013−14 across the five largest cities the average differential between:
• RULP and PULP 95 prices was 10.6 cpl—an increase of 0.2 cpl from 2012−13
• RULP prices and PULP 98 in 2013−14 was 16.3 cpl—an increase of 0.9 cpl from 2012−13
• E10 and RULP prices in 2013−14 was 3.1 cpl—an increase of 0.4 cpl from 2012−13.
For a discussion of the markets for PULP and E10, including movements in average retail prices, see chapters 9 and 10 respectively.
Monitoring of the Australian petroleum industry December 2014 63

6.7 Diesel and LPG prices
6.7.1 Diesel and LPG prices compared with petrol pricesRetail prices of petrol, diesel and LPG generally move in line with their respective international benchmark prices, which are influenced by different supply and demand factors.
The appropriate international benchmark price for diesel is the price of Singapore Gasoil with 10 parts per million sulphur content (Gasoil 10 ppm). International demand for diesel is different to that for petrol, in part because of diesel’s off-road, industrial and electricity generation uses. However, both petrol and diesel are refined from crude oil and their prices will tend to follow broadly similar movements over the long term.
The appropriate benchmarks for LPG are the Saudi Aramco Contract Prices for propane and butane (Saudi CP). These prices only change once a month, at the start of each month. International LPG prices loosely move in line with international refined petrol or diesel prices.
Chart 6.14 shows monthly average retail petrol, diesel and LPG prices in the five largest cities from July 2013 to June 2014.
Chart 6.14 Monthly average retail prices of petrol, diesel and LPG in the five largest cities: July 2013 to June 2014
60
80
100
120
140
160
180
cpl
LPGPetrol Diesel
Jul-
13
Aug
-13
Sep
-13
Oct
-13
Nov
-13
Dec
-13
Jan-
14
Feb
-14
Mar
-14
Ap
r-14
May
-14
Jun-
14
Source: ACCC calculations based on Informed Sources data.
The chart shows that over 2013−14:
• petrol and diesel prices broadly moved in line with each other (generally following movements in the price of crude oil)
• diesel prices were always higher than petrol prices. This reflected relatively higher demand for diesel compared with petrol, particularly from the Asian region
• LPG prices were significantly lower than petrol and diesel prices – a major reason for this is that in 2013−14 excise was imposed on petrol and diesel at a rate
of 38.14 cpl, whereas excise on LPG was imposed at a rate of 7.5 cpl.
64 Monitoring of the Australian petroleum industry December 2014

6.7.2 Diesel prices
Retail diesel prices compared with Gasoil prices
Chart 6.15 shows seven-day rolling average retail diesel prices in the five largest cities and Gasoil 10 ppm prices over the period 1 July 2013 to 30 June 2014. Retail diesel prices broadly followed movements in Gasoil 10 ppm prices in Australian cents per litre throughout the period.
Chart 6.15 Seven-day rolling average retail diesel prices in the five largest cities and Gasoil 10 ppm prices: 1 July 2013 to 30 June 2014
cpl
cpl
Retail diesel price—five largest cities (seven-day rolling average) (LHS) Gasoil 10 ppm (seven-day rolling average, lagged 11 days) (RHS)
Jul-
13
Aug
-13
Sep
-13
Oct
-13
Nov
-13
Dec
-13
Jan-
14
Feb
-14
Mar
-14
Ap
r-14
May
-14
Jun-
14 75
80
85
90
95
100
105
140
145
150
155
160
165
170
Source: ACCC calculations based on Informed Sources, Platts and RBA data.
Components of diesel prices
Chart 6.16 shows the components of the annual average retail price of diesel across the five largest cities in 2013−14.
Monitoring of the Australian petroleum industry December 2014 65

Chart 6.16 Components of annual average retail diesel price in the five largest cities: 2013−14
Other costs and marginsTaxesGasoil 10 ppm
DIESEL157.8 cpl
cpl %
20.0 13
52.4 33
85.4 54
Source: ACCC calculations based on Informed Sources, Platts and RBA data.
The international price of refined diesel (Gasoil 10 ppm) accounted for more than half of the average price of diesel in 2013−14. The proportion of the average pump price represented by other costs and margins in 2013−14 (13 per cent) was the same as in 2012–13.
6.7.3 LPG prices
Retail LPG prices compared with the Saudi CP benchmarks
Chart 6.17 shows seven-day rolling average retail LPG prices in the five largest cities and monthly Saudi CP benchmarks in Australian cents per litre over the period 1 July 2013 to 30 June 2014. As the Saudi CP benchmarks only change at the start of each month, the relationship between movements in the international benchmark prices and retail prices for LPG is somewhat different from petrol and diesel.
66 Monitoring of the Australian petroleum industry December 2014

Chart 6.17 Seven-day rolling average retail LPG prices in the five largest cities and monthly Saudi CP benchmarks: 1 July 2013 to 30 June 2014
30
40
50
60
70
80
90
100
cpl
Retail LPG price—five largest cities (seven-day rolling average)
Saudi Contract Price benchmarks
Jul-
13
Aug
-13
Sep
-13
Oct
-13
Nov
-13
Dec
-13
Jan-
14
Feb
-14
Mar
-14
Ap
r-14
May
-14
Jun-
14
Source: ACCC calculations based on Informed Sources, RBA and Gas Energy Australia data.
The chart shows that LPG retail prices broadly tracked movements in the international benchmark prices over the period.
The Saudi international benchmark prices reached a record high of 68.2 cpl in December 2013, as a result of tight supply in the Middle East and strong demand from the Northern Hemisphere and South East Asia. The subsequent decrease in prices was due to ample supply in Japan and falling demand toward the end of the Northern Hemisphere winter.
Components of LPG prices
Chart 6.18 shows the components of the annual average retail price of LPG across the five largest cities in 2013−14.
Monitoring of the Australian petroleum industry December 2014 67

Chart 6.18 Components of annual average retail LPG price in the five largest cities: 2013−14
Other costs and marginsTaxesSaudi CP
LPG83.0 cpl
cpl %
15.0 18
15.0 18
53.0 64
Source: ACCC calculations based on Informed Sources, Gas Energy Australia and RBA data.
Almost two-thirds of the average price of LPG in 2013−14 was accounted for by the Saudi CP benchmarks. The proportion of the price accounted for by other costs and margins in 2013−14 (18 per cent) was 1 percentage point lower than in 2012–13 (19 per cent).
Other costs and margins make up a relatively larger proportion of the retail price for LPG compared with those for petrol and diesel, because of higher transportation and storage costs for LPG, and the low rate of excise.
6.8 Australian prices compared with other countriesThe Bureau of Resources and Energy Economics (BREE) publishes a ranking of Australia’s petrol, diesel and LPG retail prices relative to prices of other countries in the Organisation for Economic Cooperation and Development (OECD).
Chart 6.19 shows the retail price of petrol—both including and excluding taxes—among countries in the OECD in the June quarter 2014.76 It shows that Australia had the fourth lowest retail petrol prices in the OECD.
The main determinant of lower retail petrol prices in Australia is Australia’s relatively low rate of taxation on fuel. In the June quarter 2014 taxes represented around 34 per cent of the retail price of petrol in Australia, compared with an OECD average of around 50 per cent. Taxes as a percentage of the retail petrol price in OECD countries ranged from a high of around 62 per cent in the Netherlands, Finland and the UK to a low of around 14 per cent in the US and Mexico. When retail prices are assessed without the tax component, Australia ranks close to the average of OECD countries (the red line in the chart).
The retail prices of diesel and LPG in Australia also compare favourably with other OECD countries. Charts 6.20 and 6.21 respectively show that, in the June quarter 2014, Australian retail diesel prices were the sixth lowest in the OECD and LPG prices were the lowest in the OECD.
76 Care must be taken when making international comparisons of fuel prices because fuel quality standards (including octane rating and the components of fuel) can differ between countries.
68 Monitoring of the Australian petroleum industry December 2014

Chart 6.19 Petrol prices and taxes in OECD countries: Australian cents per litre, June quarter 2014
0 25 50 75 100 125 150 175 200 225 250 275 300
United States
Mexico
Canada
Australia
Japan
Poland
Korea
Luxembourg
New Zealand
Austria
Czech Republic
Hungary
Spain
Slovak Republic
France
Ireland
United Kingdom
Portugal
Germany
Belgium
Sweden
Finland
Greece
Denmark
Netherlands
Italy
Turkey
Norway
cplPrice less tax Tax component Average price less tax
156.8
154.4
150.0
152.9
134.4
141.3
142.8
134.3
128.4
129.8
125.5
135.9
125.5
125.5
109.6
102.4
100.8
103.5
103.8
81.7
90.9
91.1
91.4
67.8
51.8
40.5
14.0
15.0
108.5
103.1
98.1
90.9
103.4
95.2
89.4
97.1
102.4
96.6
96.6
86.0
95.2
93.7
99.5
102.4
95.4
92.1
90.9
105.6
96.6
95.9
91.1
101.0
99.0
90.0
87.6
85.8
Source: Bureau of Resources and Energy Economics (BREE), Australian Petroleum Statistics, Issue 215, June 2014.
Monitoring of the Australian petroleum industry December 2014 69

Chart 6.20 Diesel prices and taxes in OECD countries: Australian cents per litre, June quarter 2014
0 25 50 75 100 125 150 175 200 225 250 275
Mexico
United States
New Zealand
Canada
Japan
Australia
Korea
Luxembourg
Poland
Austria
France
Spain
Portugal
Greece
Slovak Republic
Czech Republic
Hungary
Germany
Netherlands
Belgium
Ireland
Denmark
Switzerland
Finland
Turkey
United Kingdom
Italy
Sweden
Norway
cpl
127.5
123.3
131.2
139.3
120.1
113.9
105.7
102.1
109.6
98.1
105.3
101.0
97.7
93.7
86.5
83.6
89.4
86.5
95.2
90.9
84.6
70.7
67.9
52.5
42.1
33.4
16.9
13.5
14.5
Tax componentPrice less tax Average price less tax
112.1
114.3
105.3
96.3
114.2
105.3
112.8
111.7
103.8
111.0
101.0
103.8
105.8
104.4
111.0
112.5
105.3
103.8
93.7
98.1
99.0
101.0
101.0
105.7
106.1
110.2
112.7
97.5
91.0
Source: BREE, Australian Petroleum Statistics, Issue 215, June 2014.
70 Monitoring of the Australian petroleum industry December 2014

Chart 6.21 LPG prices and taxes in OECD countries: Australian cents per litre, June quarter 2014
0 25 50 75 100 125 150 175 200
Australia
Luxembourg
Slovak Republic
Poland
Belgium
Czech Republic
Germany
Spain
Korea
Portugal
Japan
Netherlands
Italy
France
Hungary
Turkey
cplTax componentPrice less tax Average price less tax
61.9
44.6
28.8
43.3
46.1
15.8
37.5
32.1
23.1
28.8
28.6
15.9
33.0
27.4
13.0
14.5
109.5
87.6
95.2
76.4
69.2
97.1
75.0
79.4
82.2
72.1
68.6
77.9
57.7
60.6
73.6
62.8
Source: BREE, Australian Petroleum Statistics, Issue 215, June 2014.
Monitoring of the Australian petroleum industry December 2014 71

72 Monitoring of the Australian petroleum industry December 2014

7 Retail prices in regional locations
Key points• Retail petrol prices in regional locations in Australia are typically higher than those in the
capital cities, although they generally tend to follow the same overall price movements. – 94 per cent of the regional locations monitored by the ACCC in 2013−14 had annual
average retail petrol prices higher than the prices in their respective capital cities.
• Movements in retail petrol prices in regional locations are largely driven by changes in international refined petrol prices and the AUD–USD exchange rate, just as they are in the five largest cities.
• However, the extent to which petrol prices in each regional location are influenced by changes in these factors varies between locations, due to the specific characteristics of each regional location.
• Petrol prices in regional locations are generally higher than in the five largest cities for a number of reasons, including: – a lower level of local competition, often reflecting the lower number of retail sites – lower volumes of petrol sold – distance/location factors – lower convenience store sales.
• These factors also explain differences in petrol prices between regional locations.
• Movements in petrol prices in regional locations—both up and down—tend to lag those in the five largest cities.
7.1 IntroductionThis chapter examines retail petrol prices in regional locations in Australia and the city–country price differential.77 In 2013−14 the ACCC monitored fuel prices in all capital cities and around 180 regional locations.78
Retail petrol prices in regional locations in Australia are typically higher than those in the capital cities, although they generally tend to follow the same overall price movements. In 2013–14, of the 173 regional locations for which petrol price data was reliably available, 162 regional locations (94 per cent) had higher annual average petrol prices than their respective capital city.79
Furthermore, in many regional locations there is a lag between movements in capital city prices and local prices. This lag arises because the turnover of petrol stocks is generally lower in the country than in the capital cities due to lower volume of sales in regional areas. As a result, price changes in the five largest cities often take longer to be passed on to regional locations. This lag occurs both when prices are increasing and when they are decreasing.
77 All references to petrol in this chapter are to regular unleaded petrol (RULP). All prices in this chapter are in nominal terms.
The city-country price differential for each state and the Northern Territory is the difference between the arithmetic average of prices in each regional location in the state and Northern Territory and the average capital city price.
78 The specific regional locations in each state and the Northern Territory which are monitored by the ACCC are listed in appendix E, which also provides annual average retail prices for petrol, diesel, automotive LPG and E10 in 2013−14 for all capital cities and regional locations.
79 To be considered reliable the price data for a regional location had to meet a number of quality thresholds. In general, there had to be a price observation on at least 75 per cent of days over the year, with no break in price data of more than 30 consecutive days.
Monitoring of the Australian petroleum industry December 2014 73

7.2 Influences on prices in regional locationsMovements in retail petrol prices in regional locations are largely driven by changes in international refined petrol prices and the AUD–USD exchange rate, just as they are in the five largest cities. However, prices are generally higher in regional locations. A number of factors contribute to these higher prices and they are outlined below. The influence of these factors varies significantly from location to location. This means that there may be substantial differences in prices between specific regional locations.
7.2.1 A lower level of local competitionIn general, the degree of competition in a market will be greater the larger the number of sellers. Therefore, everything else being equal, the higher the number of retail sites in a location, the greater the level of competition. Smaller populations in regional locations generally have fewer vehicles, and therefore less retail sites, compared with the larger cities. Often this results in less competition in regional locations. In small country towns with a small number of retail sites there may be little incentive to reduce prices. This is because competitors will also quickly reduce their prices and the net result is the same volume of petrol sold at each retail site but with a lower margin.
While the number of retail sites may be a general indicator of the degree of competition, there are other factors which influence how competitive a market is and may lead to different prices occurring in regional locations with a similar number of retail sites. These include: the composition of the market (such as the number of independent and supermarket sites), the nature of the business operation (whether it is primarily a petrol retailer or there are other businesses associated with it, like a mechanical workshop), and the different pricing strategies of market participants.
7.2.2 Lower volumes of petrol soldThe volume of petrol sold at any particular retail site can significantly influence the price. Generally, the greater the volume of petrol sold the lower the price. Certain costs of running a retail site (such as rent and maintenance) remain unchanged irrespective of the volume of petrol sold. However, retail sites in regional locations generally sell lower volumes of petrol than retail sites in larger cities because they have fewer customers. Retail sites with higher volume sales can spread their fixed costs over this greater volume, which reduces the unit cost of supplying their petrol compared with retail sites with lower volumes of sales.
7.2.3 Distance/location factorsIt generally costs more to deliver fuel to regional locations than it does to the largest capital cities. In regional locations, fuel needs to be moved further from the fuel terminals, leading to higher freight costs. Additional storage costs may also be necessary if the fuel is stored in a local storage facility before being supplied to retail sites. Regional locations which are situated along a major highway may have lower prices due to increased competition. This is because they may sell higher volumes due to the passing traffic on the highway, and may also have lower delivery and storage costs.
7.2.4 Lower convenience store salesThe margin on convenience store sales is usually significantly higher than on fuel sales. In the five largest cities convenience store sales generally make a greater contribution to the overall returns of a retail site than they do in regional locations. These retail sites can remain profitable on much lower margins on fuel sales. As a result, upward pressure is put on retail petrol prices in retail sites with lower convenience store sales, such as in regional locations.
7.2.5 Lags in price movements in regional locationsPrice movements in regional locations generally lag behind movements in the five largest cities. This is due in part to a lower volume of sales in these locations, and hence slower replenishment of fuel stocks by wholesalers and retailers. Consequently, prices in regional locations often take more
74 Monitoring of the Australian petroleum industry December 2014

time to reflect changes in international prices than those in the five largest cities. Furthermore, retail prices in some regional locations are ‘sticky’, i.e. they are less responsive—both upwards and downwards—to movements in international prices.
Chart 7.1 shows monthly average petrol prices in the five largest cities (i.e. Sydney, Melbourne, Brisbane, Adelaide and Perth), regional locations in aggregate, and the monthly average price of refined petrol price in Singapore (Mogas 95) in Australian cents per litre in the period July 2013 to June 2014.
Chart 7.1 Monthly average retail petrol prices in the five largest cities and regional locations in aggregate, and Mogas 95 prices in Australian cents per litre: July 2013 to June 2014
70
75
80
85
90
95
100
105
Regional locations (LHS) Mogas 95 (RHS)Five largest cities (LHS)
cpl
130
135
140
145
150
155
160
165
Jun-14May-14Apr-14Mar-14Feb-14Jan-14Dec-13Nov-13Oct-13Sep-13Aug-13Jul-13
cpl
cpl
Source: ACCC calculations based on Informed Sources, Platts and RBA data.
An example of the lag and sticky prices occured in the period October 2013 to March 2014:
• monthly average Mogas 95 prices troughed in October 2013 and increased by 8.3 cpl over the four months to February 2014
• monthly average retail prices across the five largest cities troughed in November 2013 and increased by 9.9 cpl to March 2014
• monthly average retail prices across regional locations also troughed in November 2013 but increased by only 3.9 cpl to March 2014.
7.3 Petrol prices in regional locations
7.3.1 Prices in aggregateChart 7.2 shows seven-day rolling average retail prices across all the monitored regional locations in Australia in aggregate and seven-day rolling average retail prices in the five largest cities.
It can be seen that prices in the regional locations in aggregate:
• broadly follow prices in the five largest cities
• were more stable than prices in the five largest cities
• were generally higher than those in the five largest cities.
Monitoring of the Australian petroleum industry December 2014 75

Chart 7.2 Seven-day rolling average petrol prices in the five largest cities and the regional locations in aggregate: 1 July 2013 to 30 June 2014
cpl
130
135
140
145
150
155
160
165
170
175
180
Jun-14May-14Apr-14Mar-14Feb-14Jan-14Dec-13Nov-13Oct-13Sep-13Aug-13Jul-13
Regional locationsFive largest cities
Source: ACCC calculations based on Informed Sources data.
7.3.2 Prices in each of the states and the Northern TerritoryCharts 7.3 to 7.9 show seven-day rolling average retail petrol prices for the monitored regional locations in aggregate in each state and the Northern Territory, along with the relevant capital city prices, from 1 July 2013 to 30 June 2014.80 The charts are all on the same scale to enable comparison across states and the Northern Territory.
The charts show that:
• Apart from the fluctuations associated with regular price cycles in the larger capital cities, prices in regional locations on average have generally followed movements in prices in their respective capital cities.
• There were times when the city-country price differentials were larger than usual. These are particularly evident when there were periods of discounting in the capital cities. – For example, in Sydney between October and December 2013 (see chart 7.3). The
average city-country price differential in New South Wales in these three months was 8.9 cpl, compared with an average differential of 6.4 cpl for the remaining nine months of 2013−14.
• Prices in regional locations in Western Australia, where many locations are a long way from a refinery and import terminals, are significantly higher than those in Perth. Conversely, in Tasmania, where distances from terminals are smaller, prices in regional locations are relatively close to those in Hobart.
80 Note that there are no prices available for locations in the Australian Capital Territory other than Canberra.
76 Monitoring of the Australian petroleum industry December 2014

Chart 7.3 Seven-day rolling average petrol prices in Sydney and New South Wales regional locations: 1 July 2013 to 30 June 2014
cpl
130
135
140
145
150
155
160
165
170
175
180
Jun–14May–14Apr–14Mar–14Feb–14Jan–14Dec–13Nov–13Oct–13Sep–13Aug–13Jul–13
Jun-14
May-14
Apr-14
Mar-14
Feb-14
Jan-14
Dec-13
Nov-13
Oct-13
Sep-13
Aug
-13
Jul-1
3
NSW regional locationsSydney
Source: ACCC calculations based on Informed Sources data.
Chart 7.4 Seven-day rolling average petrol prices in Melbourne and Victorian regional locations: 1 July 2013 to 30 June 2014
cpl
130
135
140
145
150
155
160
165
170
175
180
Jun–13May–13Apr–13Mar–13Feb–13Jan–13Dec–12Nov–12Oct–12Sep–12Aug–12Jul–12
Jun-14
May-14
Apr-14
Mar-14
Feb-14
Jan-14
Dec-13
Nov-13
Oct-13
Sep-13
Aug
-13
Jul-1
3
Vic. regional locationsMelbourne
Source: ACCC calculations based on Informed Sources data.
Monitoring of the Australian petroleum industry December 2014 77

Chart 7.5 Seven-day rolling average petrol prices in Brisbane and Queensland regional locations: 1 July 2013 to 30 June 2014
cpl
130
135
140
145
150
155
160
165
170
175
180
Jun–13May–13Apr–13Mar–13Feb–13Jan–13Dec–12Nov–12Oct–12Sep–12Aug–12Jul–12
Jun-14
May-14
Apr-14
Mar-14
Feb-14
Jan-14
Dec-13
Nov-13
Oct-13
Sep-13
Aug
-13
Jul-1
3
Qld regional locationsBrisbane
Source: ACCC calculations based on Informed Sources data.
Chart 7.6 Seven-day rolling average petrol prices in Adelaide and South Australian regional locations: 1 July 2013 to 30 June 2014
cpl
130
135
140
145
150
155
160
165
170
175
180
Jun–13May–13Apr–13Mar–13Feb–13Jan–13Dec–12Nov–12Oct–12Sep–12Aug–12Jul–12
Jun-14
May-14
Apr-14
Mar-14
Feb-14
Jan-14
Dec-13
Nov-13
Oct-13
Sep-13
Aug
-13
Jul-1
3
SA regional locationsAdelaide
Source: ACCC calculations based on Informed Sources data.
78 Monitoring of the Australian petroleum industry December 2014

Chart 7.7 Seven-day rolling average petrol prices in Perth and Western Australian regional locations: 1 July 2013 to 30 June 2014
cpl
130
135
140
145
150
155
160
165
170
175
180
Jun–13May–13Apr–13Mar–13Feb–13Jan–13Dec–12Nov–12Oct–12Sep–12Aug–12Jul–12
Jun-14
May-14
Apr-14
Mar-14
Feb-14
Jan-14
Dec-13
Nov-13
Oct-13
Sep-13
Aug
-13
Jul-1
3
WA regional locationsPerth
Source: ACCC calculations based on Informed Sources data.
Chart 7.8 Seven-day rolling average petrol prices in Hobart and Tasmanian regional locations: 1 July 2013 to 30 June 2014
cpl
130
135
140
145
150
155
160
165
170
175
180
Jun–13May–13Apr–13Mar–13Feb–13Jan–13Dec–12Nov–12Oct–12Sep–12Aug–12Jul–12
Jun-14
May-14
Apr-14
Mar-14
Feb-14
Jan-14
Dec-13
Nov-13
Oct-13
Sep-13
Aug
-13
Jul-1
3
Tas. regional locationsHobart
Source: ACCC calculations based on Informed Sources data.
Monitoring of the Australian petroleum industry December 2014 79

Chart 7.9 Seven-day rolling average petrol prices in Darwin and Northern Territory regional locations: 1 July 2013 to 30 June 2014
cpl
130
135
140
145
150
155
160
165
170
175
180
Jun–13May–13Apr–13Mar–13Feb–13Jan–13Dec–12Nov–12Oct–12Sep–12Aug–12Jul–12
Jun-14
May-14
Apr-14
Mar-14
Feb-14
Jan-14
Dec-13
Nov-13
Oct-13
Sep-13
Aug
-13
Jul-1
3
NT regional locationsDarwin
Source: ACCC calculations based on Informed Sources data.
7.3.3 Price differentials over timeThe city–country price differential varies between states and over time. Table 7.1 provides data on nominal annual average price differentials between the capital city and regional locations for each state and the Northern Territory. It also shows two aggregate indicators of the city–country price differential: five-city and eight-city.81
81 The five-city city-country price differential is the difference between the arithmetic average of prices in the monitored regional locations in the six states and the Northern Territory and the arithmetic average price in the five largest cities (Sydney, Melbourne, Brisbane, Adelaide and Perth).
The eight-city city-country price differential is the difference between the arithmetic average of prices in the monitored regional locations in the six states and the Northern Territory and the arithmetic average price in the eight capital cities (the five largest cities plus Canberra, Hobart and Darwin).
80 Monitoring of the Australian petroleum industry December 2014

Table 7.1 Average petrol price differentials between the capital city and the monitored regional locations in each state and the Northern Territory: 2012−13, 2013−14 and the 10-year average
State/Territory 2012−13cpl
2013−14cpl
10-year avg.cpl
NSW 8.7 7.0 5.5
Vic 6.3 4.4 4.0
Qld 5.8 3.7 3.6
SA 7.2 5.6 4.9
WA 12.3 10.1 12.1
Tas 1.1 0.9 0.4
NT 4.0 4.6 6.3
Aggregate indicators
5-city 8.3 5.9 5.8
8-city 3.6 1.9 2.9
Source: ACCC calculations based on Informed Sources data.
2013−14 compared with 2012−13
Table 7.1 shows that in 2013−14, compared with 2012−13:
• the city-country price differential decreased in all states except the Northern Territory—with the magnitude of the decrease ranging from 0.2 cpl in Tasmania to 2.2 cpl in Western Australia
• the city-country price differential in the Northern Territory increased by 0.6 cpl
• the five-city price differential decreased by 2.4 cpl and the eight-city price differential decreased by 1.7 cpl.
2013−14 compared with the 10-year average
Table 7.1 shows that in 2013−14, compared with the 10-year average:
• the city-country price differential was higher in all states except Western Australia, and lower in the Northern Territory
• the five-city price differential was higher and the eight-city price differential was lower.
Monitoring of the Australian petroleum industry December 2014 81

82 Monitoring of the Australian petroleum industry December 2014

8 Petrol price cycles
Key points• Retail petrol prices in the five largest cities in Australia—Sydney, Melbourne, Brisbane,
Adelaide and Perth—move in cycles. These price cycles do not generally occur in Canberra, Hobart and Darwin, or in most regional locations.
• In the first half of 2014 petrol price cycles in Sydney, Melbourne, Brisbane and Adelaide had the following characteristics: – they generally lasted more than two weeks – daily average prices increased from trough to peak by 14 cents per litre or more.
• Choosing when to buy petrol in these cities continued to be difficult for motorists, because the cheapest day of the week often varied from one price cycle to the next.
• In the first half of 2014 petrol price cycles in Perth were regular, with every price cycle lasting seven days. – This has been a feature of petrol price cycles in Perth over recent years. – The cheapest day of the week to buy petrol in Perth was Wednesday.
• Over the last five years the size of price cycle increases before public holidays was on average no larger than the size of price increases at any other time of the year.
8.1 IntroductionRetail petrol prices in the five largest cities in Australia—Sydney, Melbourne, Brisbane, Adelaide and Perth—move in cycles.82 These price cycles do not occur in Canberra, Hobart and Darwin, or in most regional locations. These petrol price cycles have been examined extensively in previous ACCC petrol monitoring reports.
This chapter extends the analysis to the end of June 2014. In particular, it considers the following elements of petrol price cycles:
• average price cycle increases
• the days of the week on which prices peak and trough
• the duration of price cycles
• consumer buying patterns over the course of the week
• the size of price cycle increases before public holidays.
8.2 Price cyclesPrice cycles are a prominent feature of retail petrol prices in the five largest cities. They are of concern to many consumers due to the large price increases that occur in a single day, and across most retail sites, on a regular basis. Many consumers try to take advantage of the bottom of the price cycle to buy petrol at relatively low prices.
Price cycles occur as a result of the pricing policies of fuel retailers and only occur at the retail level. Wholesale prices do not exhibit similar cyclical movements.
82 All references to petrol in this chapter are to regular unleaded petrol (RULP). All prices in this chapter are nominal prices.
Monitoring of the Australian petroleum industry December 2014 83

8.2.1 Definition of a price cycleA petrol price cycle is a movement in price from a trough to a peak to a subsequent trough. The ACCC defines a price cycle as having occurred when:
• the increase in price from the trough to the peak is 3 per cent or more of that trough price
• the decrease in price to the subsequent trough is also 3 per cent or more of the first trough price.
A price cycle increase is the increase in price from the first trough to the peak. The duration of the price cycle is the number of days from the first trough to the second trough. Chart 8.1 shows these elements of a petrol price cycle using daily average retail petrol prices in Perth in May 2014.
Chart 8.1 Elements of a petrol price cycle, Perth: 11 May to 24 May 2014
cpl
140
145
150
155
160
23 May21 May19 May17 May15 May13 May11 May
peak
trough
trough
duration
pricecycleincrease
Source: ACCC analysis based on FUELtrac data.
Petrol price cycles in the five largest cities typically move in a ‘sawtooth’ pattern—prices increase quickly at the outset and then steadily decrease over the rest of the cycle.
Most market participants increase prices within a few days of each other. Generally, a small number of retail sites increase their prices first and the rest of the market follows.
8.2.2 Example of price cycles in the five largest citiesIn 2013 and the first half of 2014:
• price cycles in Sydney, Melbourne and Brisbane broadly moved in line with each other, reaching their peaks and troughs at around the same time
• Adelaide price cycles were often shorter, although they occasionally moved in line with these cities
• price cycles in Perth continued to move in a regular weekly pattern.
These patterns are illustrated in chart 8.2, which shows daily average retail petrol prices in the five largest cities from 1 May to 31 May 2014.
84 Monitoring of the Australian petroleum industry December 2014
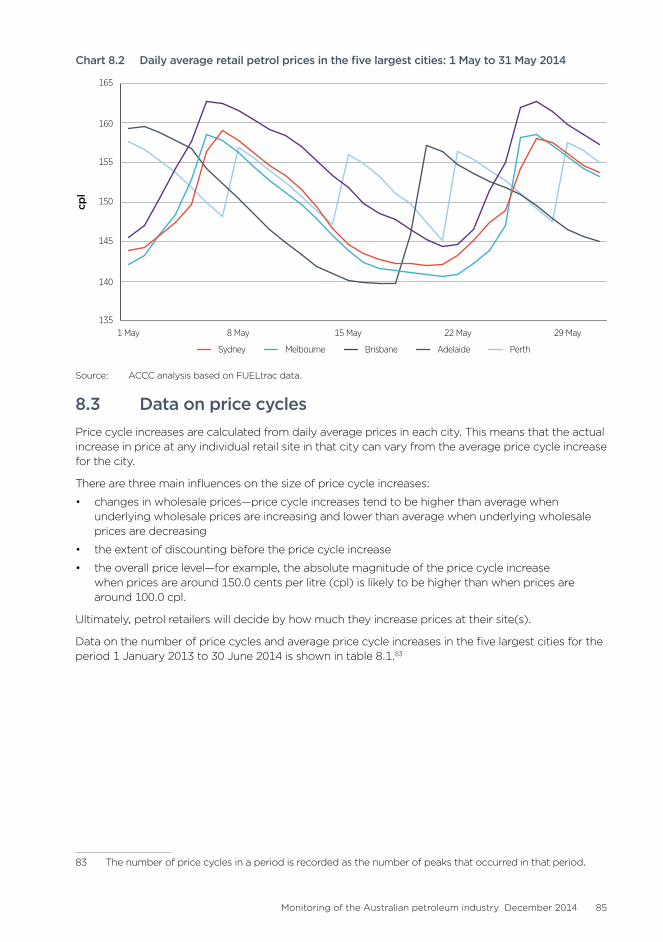
Chart 8.2 Daily average retail petrol prices in the five largest cities: 1 May to 31 May 2014
cpl
135
140
145
150
155
160
165
29 May22 May15 May8 May1 May
BrisbaneMelbourne PerthAdelaideSydney
Source: ACCC analysis based on FUELtrac data.
8.3 Data on price cyclesPrice cycle increases are calculated from daily average prices in each city. This means that the actual increase in price at any individual retail site in that city can vary from the average price cycle increase for the city.
There are three main influences on the size of price cycle increases:
• changes in wholesale prices—price cycle increases tend to be higher than average when underlying wholesale prices are increasing and lower than average when underlying wholesale prices are decreasing
• the extent of discounting before the price cycle increase
• the overall price level—for example, the absolute magnitude of the price cycle increase when prices are around 150.0 cents per litre (cpl) is likely to be higher than when prices are around 100.0 cpl.
Ultimately, petrol retailers will decide by how much they increase prices at their site(s).
Data on the number of price cycles and average price cycle increases in the five largest cities for the period 1 January 2013 to 30 June 2014 is shown in table 8.1.83
83 The number of price cycles in a period is recorded as the number of peaks that occurred in that period.
Monitoring of the Australian petroleum industry December 2014 85

Table 8.1 Annual average price cycle increase in cents per litre and as a percentage of average price, and number of price cycles—five largest cities: 2013 and the first half of 2014
Sydney Melbourne Brisbane Adelaide Perth
Average price cycle increase (cpl)
2013 13.3 14.4 12.9 16.4 9.8
H1 2014 14.0 14.7 14.5 15.5 9.4
Period average price (cpl)
2013 145.0 144.4 148.1 144.3 146.2
H1 2014 150.9 150.3 155.5 151.3 153.3
Average price cycle increase as a percentage of period average price (%)
2013 9.1 9.9 8.7 11.4 6.7
H1 2014 9.3 9.7 9.3 10.3 6.2
Number of price cycles
2013 20 21 20 25 52
H1 2014 10 10 10 12 26
Source: ACCC analysis based on Informed Sources data.
In 2013 and the first half of 2014 the average price cycle increase was largest in Adelaide and smallest in Perth. These were also the only two cities where the average price cycle increase in cents per litre in the first half of 2014 was smaller than in 2013.
As a percentage of period average prices, the average price cycle increases in the first half of 2014 were lower compared with 2013 in Melbourne, Adelaide and Perth.
In 2013 and the first half of 2014 Perth had a price cycle every week of the year, while in the other cities price cycles occurred on average less than once every two weeks.
Table 8.1 shows that compared with Sydney, Melbourne, Brisbane and Adelaide (subsequently referred to as the eastern capital cities), Perth had more price cycles with smaller average price cycle increases. Unlike other states, Western Australia has fuel price regulations under which retail sites must keep their prices constant for a 24-hour period and the price at each retail site is publicly available on the FuelWatch website.84 Because of these arrangements, petrol retailers may adopt different pricing strategies from those employed in the eastern capital cities.
8.4 Number of troughs and peaks by day of the weekThis section examines the days of the week on which price cycles troughed and peaked in 2013 and the first half of 2014.
Prior to 2010 there were long periods when price cycle troughs and peaks generally occurred on the same day each week. Analysis in the 2011 ACCC petrol monitoring report showed that in all of the eastern capital cities the price cycle trough in 2009 generally occurred on a Wednesday, and the price cycle peak was always on Thursday or Friday.85 However, from 2011, because of the longer duration of price cycles, the price cycle troughs and peaks have varied over the week in the eastern capital cities.
In contrast, price cycles in Perth have become more regular and predictable compared with previous years.
84 See: http://www.fuelwatch.wa.gov.au/fuelwatch/pages/home.jspx
85 See ACCC, Monitoring of the Australian petroleum industry, December 2011, pp. 192–5.
86 Monitoring of the Australian petroleum industry December 2014

Table 8.2 shows the number of troughs and peaks (and percentage of the period total) on each day of the week in each of the five largest cities in 2013 and the first half of 2014.
Table 8.2 Number of troughs and peaks (and percentage of period total) in petrol prices on each day of the week, five largest cities: 2013 and the first half of 2014
Mon Tue Wed Thu Fri Sat Sun Total
Sydney
Trough
2013 4 (19%) 6 (29%) 4 (19%) 3 (14%) 1 (5%) 3 (14%) 21
H1 2014 2 (22%) 1 (11%) 4 (44%) 1 (11%) 1 (11%) 9
Peak
2013 2 (10%) 3 (15%) 3 (15%) 2 (10%) 1 (5%) 5 (25%) 4 (20%) 20
H1 2014 1 (10%) 2 (20%) 4 (40%) 3 (30%) 10
Melbourne
Trough
2013 4 (18%) 2 (9%) 3 (14%) 6 (27%) 2 (9%) 1 (5%) 4 (18%) 22
H1 2014 1 (11%) 2 (22%) 4 (44%) 1 (11%) 1 (11%) 9
Peak
2013 2 (10%) 5 (24%) 1 (5%) 2 (10%) 1 (5%) 3 (14%) 7 (33%) 21
H1 2014 2 (20%) 2 (20%) 3 (30%) 2 (20%) 1 (10%) 10
Brisbane
Trough
2013 4 (19%) 6 (29%) 1 (5%) 3 (14%) 4 (19%) 2 (10%) 1 (5%) 21
H1 2014 2 (22%) 2 (22%) 4 (44%) 1 (11%) 9
Peak
2013 4 (20%) 5 (25%) 3 (15%) 2 (10%) 2 (10%) 1 (5%) 3 (15%) 20
H1 2014 4 (40%) 2 (20%) 1 (10%) 1 (10%) 2 (20%) 10
Adelaide
Trough
2013 7 (27%) 6 (23%) 1 (4%) 1 (4%) 3 (12%) 4 (15%) 4 (15%) 26
H1 2014 3 (27%) 3 (27%) 1 (9%) 2 (18%) 2 (18%) 11
Peak
2013 7 (28%) 6 (24%) 1 (4%) 1 (4%) 3 (12%) 4 (16%) 3 (12%) 25
H1 2014 3 (25%) 3 (25%) 1 (8%) 2 (17%) 3 (25%) 12
Perth
Trough
2013 52 (100%) 52
H1 2014 26 (100%) 26
Peak
2013 50 (96%) 2 (4%) 52
H1 2014 26 (100%) 26
Source: ACCC analysis based on Informed Sources data.
Monitoring of the Australian petroleum industry December 2014 87

The table shows that in the eastern capital cities:
• there was no particular day of the week on which motorists could consistently buy relatively cheap petrol in 2013 or the first half of 2014
• price cycle peaks and troughs occurred on every day of the week in Melbourne, Brisbane and Adelaide in 2013
• in the first half of 2014 price cycle peaks and troughs occurred on at least four different days of the week in each city
• in the first half of 2014, the most common day of the week for troughs was also the most common day for peaks in Sydney (Wednesday) and in Adelaide (Monday and Tuesday).
In Perth:
• the price cycle trough always occurred on a Wednesday in both 2013 and the first half of 2014
• the price cycle peak occurred on all but two Thursdays in 2013 and on every Thursday in the first half of 2014.
8.5 Duration of price cyclesThe duration of a price cycle is the number of days from trough to subsequent trough. A feature of petrol price cycles in recent years has been the increase in, and variability of, the duration of price cycles in the eastern capital cities. Price cycle durations in Perth have become increasingly stable over this time.
Table 8.3 shows the average duration of price cycles in each of the five largest cities from 2009 to the first half of 2014. It also shows the average number of days from trough to peak and the average number of days from peak to trough.86
In the eastern capital cities:
• In 2009 the average duration of price cycles was seven days in all cities.
• The average duration increased every year from 2009 to the first half of 2014 in almost all cities.
• In the first half of 2014 the average price cycle lasted over 18 days in Sydney, Melbourne and Brisbane, and over 15 days in Adelaide.
• The average trough to peak duration (that is, the increasing phase of the price cycle) has been around one-third to one-fifth of the overall duration of the price cycle. This proportion has changed little between 2009 and the first half of 2014.
In Perth:
• the average price cycle duration decreased from around nine days in 2009 to seven days in 2011
• the average duration has remained at seven days since then
• since 2011 the average trough to peak duration has been one day and the peak to trough duration has been six days.
Longer price cycles may have an adverse impact on price-sensitive consumers. A significant proportion of Australian motorists purchase petrol on a weekly basis, and can take full advantage of petrol price cycles when they are roughly a week in duration by timing their weekly purchase at or near the trough price. However, when price cycles become significantly longer motorists cannot do this and must fill up when prices are relatively higher.
86 As this section is based on daily average price data, it may over-estimate the actual duration of the trough to peak increase (or increasing phase of the price cycle). For example, suppose that prices started to increase at a number of retail sites around 4.00 pm one day and that most retail sites had moved to a similar price by around 4.00 pm the next day. In this case, the daily average price data may show that the trough to peak increase was two or three days, even though it had only taken 24 hours for prices to go up. Therefore, this analysis should not be used to indicate the changing duration of the phases of actual price cycles.
88 Monitoring of the Australian petroleum industry December 2014

Table 8.3 Annual average trough–peak duration, peak–trough duration, and price cycle duration, five largest cities: 2009 to the first half of 2014
Sydney Melbourne Brisbane Adelaide Perth
Average price cycle durations (days)
2009
Average duration trough–peak 1.8 1.8 2.0 1.4 4.5
Average duration peak–trough 5.2 5.2 5.0 5.6 4.7
Average cycle duration 7.0 7.0 7.0 7.0 9.2
2010
Average duration trough–peak 2.2 2.1 2.0 2.3 2.6
Average duration peak–trough 6.0 5.8 5.7 5.2 5.1
Average cycle duration 8.2 7.9 7.7 7.5 7.7
2011
Average duration trough–peak 2.5 2.1 2.5 2.9 1.0
Average duration peak–trough 6.3 6.7 6.9 7.0 6.0
Average cycle duration 8.8 8.8 9.4 9.9 7.0
2012
Average duration trough–peak 3.4 3.3 3.2 3.3 1.1
Average duration peak–trough 9.5 12.5 9.7 10.9 5.9
Average cycle duration 12.9 15.8 12.9 14.2 7.0
2013
Average duration trough–peak 5.3 4.8 5.8 3.0 1.0
Average duration peak–trough 12.7 12.3 12.2 11.2 6.0
Average cycle duration 18.0 17.1 18.0 14.2 7.0
H1 2014
Average duration trough–peak 5.8 5.2 5.6 3.2 1.0
Average duration peak–trough 12.9 13.0 12.7 12.3 6.0
Average cycle duration 18.7 18.2 18.3 15.5 7.0
Source: ACCC analysis based on Informed Sources data.
Monitoring of the Australian petroleum industry December 2014 89
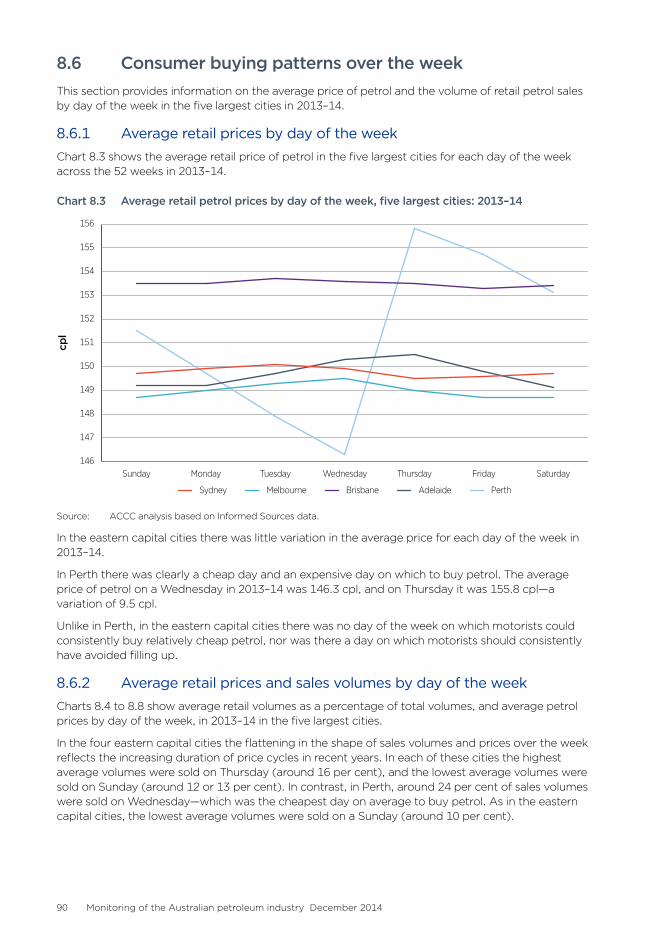
8.6 Consumer buying patterns over the weekThis section provides information on the average price of petrol and the volume of retail petrol sales by day of the week in the five largest cities in 2013–14.
8.6.1 Average retail prices by day of the weekChart 8.3 shows the average retail price of petrol in the five largest cities for each day of the week across the 52 weeks in 2013–14.
Chart 8.3 Average retail petrol prices by day of the week, five largest cities: 2013–14
cpl
146
147
148
149
150
151
152
153
154
155
156
SaturdayFridayThursdayWednesdayTuesdayMondaySunday
BrisbaneMelbourne PerthAdelaideSydney
Source: ACCC analysis based on Informed Sources data.
In the eastern capital cities there was little variation in the average price for each day of the week in 2013–14.
In Perth there was clearly a cheap day and an expensive day on which to buy petrol. The average price of petrol on a Wednesday in 2013–14 was 146.3 cpl, and on Thursday it was 155.8 cpl—a variation of 9.5 cpl.
Unlike in Perth, in the eastern capital cities there was no day of the week on which motorists could consistently buy relatively cheap petrol, nor was there a day on which motorists should consistently have avoided filling up.
8.6.2 Average retail prices and sales volumes by day of the weekCharts 8.4 to 8.8 show average retail volumes as a percentage of total volumes, and average petrol prices by day of the week, in 2013–14 in the five largest cities.
In the four eastern capital cities the flattening in the shape of sales volumes and prices over the week reflects the increasing duration of price cycles in recent years. In each of these cities the highest average volumes were sold on Thursday (around 16 per cent), and the lowest average volumes were sold on Sunday (around 12 or 13 per cent). In contrast, in Perth, around 24 per cent of sales volumes were sold on Wednesday—which was the cheapest day on average to buy petrol. As in the eastern capital cities, the lowest average volumes were sold on a Sunday (around 10 per cent).
90 Monitoring of the Australian petroleum industry December 2014

Chart 8.4 Average retail sales volumes and prices by day of the week in Sydney: 2013–14
per cen
t
0
5
10
15
20
25
30
SaturdayFridayThursdayWednesdayTuesdayMondaySunday
cpl
141
144
147
150
153
156
159
Sydney—daily average retail price (RHS)Sydney—volume sold (LHS)
Source: ACCC analysis based on Informed Sources data, and information provided by the monitored companies.
Chart 8.5 Average retail sales volumes and prices by day of the week in Melbourne: 2013–14
per cen
t
0
5
10
15
20
25
30
SaturdayFridayThursdayWednesdayTuesdayMondaySunday
cpl
141
144
147
150
153
156
159
Melbourne—daily average retail price (RHS)Melbourne—volume sold (LHS)
Source: ACCC analysis based on Informed Sources data, and information provided by the monitored companies.
Monitoring of the Australian petroleum industry December 2014 91

Chart 8.6 Average retail sales volumes and prices by day of the week in Brisbane: 2013–14per cen
t
0
5
10
15
20
25
30
SaturdayFridayThursdayWednesdayTuesdayMondaySunday
cpl
141
144
147
150
153
156
159
Brisbane—daily average retail price (RHS)Brisbane—volume sold (LHS)
Source: ACCC analysis based on Informed Sources data, and information provided by the monitored companies.
Chart 8.7 Average retail sales volumes and prices by day of the week in Adelaide: 2013–14
per cen
t
0
5
10
15
20
25
30
SaturdayFridayThursdayWednesdayTuesdayMondaySunday
cpl
141
144
147
150
153
156
159
Adelaide—daily average retail price (RHS)Adelaide—volume sold (LHS)
Source: ACCC analysis based on Informed Sources data, and information provided by the monitored companies.
92 Monitoring of the Australian petroleum industry December 2014

Chart 8.8 Average retail sales volumes and prices by day of the week in Perth: 2013–14
per cen
t
0
5
10
15
20
25
30
SaturdayFridayThursdayWednesdayTuesdayMondaySunday
cpl
141
144
147
150
153
156
159
Perth—daily average retail price (RHS)Perth—volume sold (LHS)
Source: ACCC analysis based on Informed Sources data, and information provided by the monitored companies.
8.7 Price cycle increases and public holidaysIt is often claimed that retail petrol prices always increase before public holidays, and in particular long weekends.
The ACCC has examined petrol price increases before public holidays in each of the five largest cities since January 2007 and has consistently found that the average price cycle increase before public holidays was equal to or above the annual average price cycle increase just under half of the time.87
As noted in section 8.3 there are three main influences on the size of price cycle increases: changes in wholesale prices, the extent of discounting before the price cycle increase and the overall price level. These factors are not influenced by the timing of public holidays.
In this monitoring report the analysis has been updated to cover the five-year period July 2009 to June 2014. Over that period the price cycle increase before a public holiday was compared with the relevant yearly average price cycle increase (or half yearly in the case of 2009 and 2014). The results are shown in table 8.4.
87 See ACCC, Monitoring of the Australian petroleum industry, various issues.
Monitoring of the Australian petroleum industry December 2014 93

Table 8.4 Number (and percentage) of price cycle increases before public holidays in the five largest cities: July 2009 to June 2014
Total Greater than or equal to calendar year average
Less than calendar year average
Less than calendar year maximum
Sydney 33 18 (55%) 15 (45%) 32 (97%)
Melbourne 32 11 (34%) 21 (66%) 30 (94%)
Brisbane 31 15 (48%) 16 (52%) 30 (97%)
Adelaide 36 22 (61%) 14 (39%) 34 (94%)
Perth 36 15 (42%) 21 (58%) 35 (97%)
Total 168 81 (48%) 87 (52%) 161 (96%)
Source: ACCC analysis based on Informed Sources data.
The table shows that in the five years to June 2014:
• price cycle increases before public holidays were equal to or above the yearly average price cycle increase less than half (48 per cent) of the time88
• in total, a majority of price cycles before public holidays had smaller price increases than the calendar year average price cycle increase
• in Melbourne, Brisbane and Perth, price cycle increases before public holidays were below the calendar year average price cycle increase more than half of the time
• in Sydney and Adelaide, price cycle increases before public holidays were below the calendar year average price cycle increase less than half of the time
• in Sydney, Brisbane and Perth there was only one occasion when the price cycle increase before a public holiday was the highest price cycle increase for the year. In Melbourne and Adelaide there were two.
The results from this analysis are consistent with the conclusions from previous ACCC petrol monitoring reports and show that there is little evidence to support the claim that price cycle increases before public holidays are always higher than the price cycle increases when there is no public holiday. Furthermore, there is little evidence that public holidays affect the timing of price cycle increases in any city.
88 In the eastern capital cities a price cycle increase before a public holiday has been defined as having occurred within the week up to and including the day of the public holiday in the years 2008 to 2010, and within two weeks from 2011. In Perth a price cycle increase before a public holiday has been defined as having occurred within two weeks up to and including the day of the public holiday prior to 2009 and within one week subsequently. The change to the methodology reflects the increasing duration of price cycles in the eastern capital cities since late 2010 and the decreasing duration in Perth since 2009. The price increase before (or on) the New Year’s Day public holiday is compared with the average price cycle increase for the previous year. This is because the price increase usually occurs in the last week of the previous year.
94 Monitoring of the Australian petroleum industry December 2014

9 Premium unleaded petrol
Key points• In 2013–14 around 5 billion litres of premium unleaded petrol (PULP) was sold in Australia.
– This represented around 28 per cent of total unleaded petrol sales. – Almost half of all PULP sales were in New South Wales (NSW).
• The large demand for PULP in NSW has been influenced by the ethanol mandate in that state, which commenced in October 2007. – Between 2007−08 and 2013−14 sales of PULP in NSW increased by 124 per cent, whereas
in the rest of Australia the increase over the same period was only 26 per cent.
• The two main grades of PULP sold in Australia are PULP 95 and PULP 98.
• In the five largest cities in 2013–14: – average PULP 95 retail prices were 161.2 cpl—10.6 cents per litre (cpl) higher than regular
unleaded petrol (RULP)■■ average wholesale prices were 7.5 cpl higher than RULP
– average PULP 98 retail prices were 166.9 cpl—16.3 cpl higher than RULP■■ average wholesale prices were 12.7 cpl higher than RULP.
• In 2013–14 the two largest components of the pump price—the international price of refined premium petrol and taxes—accounted for 84 per cent of the price of PULP 95. Other costs and margins made up 16 per cent of the pump price.
9.1 IntroductionThis chapter provides information on premium unleaded petrol (PULP) prices in the five largest cities (i.e. Sydney, Melbourne, Brisbane, Adelaide and Perth).89 It analyses the components that make up the retail price of PULP and compares these with the components of the price of regular unleaded petrol (RULP). It also discusses the supply of and demand for PULP in Australia.
9.2 Features of PULPPULP has a higher research octane number (RON) than RULP. RON is discussed in section 9.2.1.
The two main grades of PULP sold in Australia are:
• PULP 95—i.e. PULP with a minimum RON of 95
• PULP 98—i.e. PULP with a minimum RON of 98.
Other grades of PULP are also available but they are sold in much lower volumes. For example, United markets ‘Premium 100’, which is a high performance fuel containing ethanol with a RON of 100.
9.2.1 Who should use PULP?Some vehicles, such as most European or turbocharged cars, have a high engine compression ratio, which allows the engine to extract more power from a given amount of air-fuel mixture. Petrol with a higher RON than RULP—i.e. PULP—must be used in these engines.
Using lower octane fuel in these cars may cause engine knock, which can damage the engine. Most modern vehicles have knock sensors which will prevent or reduce engine knock if RULP is used. However, using RULP in these engines will result in lower power, higher fuel consumption, and potentially increase engine wear over the long term.
89 All prices in this chapter are nominal.
Monitoring of the Australian petroleum industry December 2014 95

Using PULP in vehicles designed to run on RULP will not cause engine damage, but motorists should not expect better fuel economy or more power from their engines.
9.2.2 Differences between PULP and RULPUnder the Australian fuel standards, there are three differences between PULP and RULP:90
• the minimum RON
• the minimum motor octane number (MON), and
• the maximum sulphur content.
The Australian fuel standards do not differentiate between different grades of PULP.
RON and MON
The RON and MON are measures of a fuel’s resistance to auto-ignition, which can cause engine knock and loss of fuel economy. The RON measures the fuel at low engine speeds, while the MON measures the fuel under load and at higher engine speeds. The Australian fuel standard for PULP mandates a minimum 95 RON and a minimum 85 MON. PULP 98 contains a minimum 98 RON.
The Australian standard for RULP has a lower octane rating, which means it is less resistant to auto-ignition. It requires a minimum 91 RON and a minimum 81 MON.
Sulphur content
Sulphur occurs naturally in crude oil and if not removed in the refining process it will contaminate refined fuel. Sulphur has a large impact on vehicle emissions as it forms toxic gases on combustion in the engine and affects the efficiency of vehicles’ catalytic converters. Under the Australian fuel standard PULP is required to contain no more than 50 parts per million (ppm) sulphur, compared with 150 ppm for RULP.
Proprietary premium unleaded petrol
In contrast to RULP, which is sold as a generic product, the refiner-wholesalers attempt to distinguish their PULP products from those of their competitors. While the PULP products of different companies may contain the same octane level, and in some cases have similar features, they are often marketed as a proprietary retail product with additives and characteristics unique to that brand. Companies’ proprietary premium fuels are blended with additives that are reported to remove carbon deposits in the engine, reduce engine friction and prevent corrosion.
9.3 Retail PULP pricesRetail PULP prices move in a similar pattern to retail RULP prices in the five largest cities. Price cycles for PULP occur in the five largest cities and other markets where regular RULP price cycles occur. While the difference in international benchmark prices for RULP and PULP can vary from one day to the next, most retailers sell PULP at a fixed margin to RULP. This margin is adjusted from time to time due to relative changes in wholesale prices, and changes in supply and demand factors at the retail level.
In 2013–14 in the five largest cities:
• the annual average retail price of PULP 95 was 161.2 cents per litre (cpl), an increase of 9.5 cpl from 2012–13
• the annual average retail price of PULP 98 was 166.9 cpl—10.2 cpl higher than in 2012–13.
In comparison, the annual average retail RULP price in 2013–14 in the five largest cities was 150.6 cpl (an increase of 9.3 cpl from the previous year).
90 Fuel quality standards are maintained by the Department of Environment and are available at: http://www.environment.gov.au/atmosphere/fuelquality/standards/petrol.html, accessed on 8 October 2014.
96 Monitoring of the Australian petroleum industry December 2014

Chart 9.1 shows seven-day rolling average retail prices for RULP, PULP 95 and PULP 98 across the five largest cities for the period 1 July 2013 to 30 June 2014.
Chart 9.1 Seven-day rolling average retail prices of RULP, PULP 95 and PULP 98 in the five largest cities: 1 July 2013 to 30 June 2014
cpl
135
145
155
165
175
185
Jun-14
May-14
Apr-14
Mar-14
Feb-14
Jan-14
Dec-13
Nov-13
Oct-13
Sep-13
Aug
-13
Jul-1
3
RULPPULP 98PULP 95
Source: ACCC calculations based on Informed Sources data.
In the five largest cities in 2013–14:
• PULP 95 and PULP 98 prices moved in a very similar pattern to RULP prices throughout the period – PULP 95 prices reached a low of 150.7 cpl on 12 November 2013 and a high of 169.5 cpl on
6 January 2014 – similarly, PULP 98 prices reached a low of 156.3 cpl on 12 November 2013 and a high
of 175.3 cpl on 6 January 2014 – in comparison, RULP prices reached a low of 140.3 cpl on 12 and 13 November 2013 and a
high of 159.0 cpl on 6 January 2014
• the difference between the price levels of each grade of petrol was broadly consistent over the period.
In terms of retail price differentials in 2013–14:
• the average retail price of PULP 95 was 10.6 cpl higher than RULP—the differential in 2013–14 was 0.2 cpl higher than in 2012–13
• the average retail price of PULP 98 was 16.3 cpl higher than RULP—the differential in 2013–14 was 0.9 cpl higher than in 2012–13
• the average retail price of PULP 98 was 5.7 cpl higher than PULP 95.
Monitoring of the Australian petroleum industry December 2014 97

9.4 Determinants of PULP pricesThe section outlines the determinants of PULP prices at the wholesale and retail levels.
Similar to RULP prices, wholesale PULP prices are primarily influenced by movements in the international price of refined petrol and the AUD–USD exchange rate. The relevant international benchmark price for PULP 95 in Australia is the price of refined premium petrol in the Asia–Pacific region, which is Singapore Mogas 97 Unleaded (Mogas 97).
The two key benchmarks for assessing PULP wholesale prices are the import parity price (IPP) and the terminal gate price (TGP). The IPP is a benchmark for actual import costs and the TGP is a benchmark for actual wholesale prices. All four refiner-wholesalers publish a TGP for PULP 95; however, only two publish a TGP for PULP 98. Therefore, this section focuses only on the determinants of PULP 95 prices in Australia.
9.4.1 Components of the IPP for PULP 95Table 9.1 shows the components of the IPP for PULP 95 in the five largest cities over the past three years.
Three of the four refiner-wholesalers use an IPP for PULP 95 based on Mogas 97 prices. The other refiner-wholesaler calculates its IPP using Singapore Mogas 95 Unleaded (Mogas 95) prices and adds a ‘PULP margin’. Data for this company has been excluded from the table. As a result, the data in table 9.1 is not directly comparable with table 5.1 in chapter 5 which shows the components of the IPP for RULP.
Table 9.1 Components of annual average IPP for PULP 95 in the five largest cities: 2011–12 to 2013–14
Exchange rate1 AUD = USD
Mogas 97cpl
Quality premium
cpl
Total freight
cpl
Insurance and loss
cpl
Wharfagecpl
Othercpl
IPPcpl
2011−12 1.03 76.7 4.2 2.0 0.3 0.3 0.0 83.6
2012−13 1.03 75.6 4.6 2.3 0.4 0.3 0.1 83.2
2013−14 0.92 82.5 4.9 2.4 0.4 0.3 0.1 90.5
Source: ACCC analysis based on data obtained from firms monitored through the ACCC’s monitoring process.
The table shows that in 2013–14:
• the IPP for PULP 95 was 90.5 cpl, an increase of 7.3 cpl (or 9 per cent) from 2012–13
• the price of Mogas 97 was the largest component of, and the main factor driving changes in, the IPP for PULP 95 – it represented 91 per cent of the annual average IPP – in 2011–12 it represented 92 per cent and in 2012–13 it represented 91 per cent
• the quality premium (described in section 9.4.2) represented 5 per cent of the IPP, and freight represented 3 per cent.
98 Monitoring of the Australian petroleum industry December 2014

9.4.2 Comparison of the IPP for PULP 95 and the IPP for RULPIn 2013–14 the annual average IPP for PULP 95 was 90.5 cpl, which was 4.0 cpl higher than the annual average IPP for RULP.91 For most refiner-wholesalers the two key differences between these IPPs are the differences in international benchmark prices and the quality premiums.
International benchmark prices
Chart 9.2 shows movements in weekly average Mogas 95 prices (which is the relevant international benchmark price for RULP) and Mogas 97 prices, in Australian cents per litre, over the period July 2013 to June 2014. It also shows the weekly average difference between the two prices.
Chart 9.2 Weekly average Mogas 97 and Mogas 95 prices and the difference, Australian cents per litre: July 2013 to June 2014
cpl
65
70
75
80
85
90
cpl
cpl
0
1
2
3
4
5
Jun-14
May-14
Apr-14
Mar-14
Feb-14
Jan-14
Dec-13
Nov-13
Oct-13
Sep-13
Aug
-13
Jul-1
3
Mogas 97 (LHS)Mogas 95 (LHS) Di�erence (RHS)
Source: ACCC calculations based on Platts and RBA data.
Mogas 97 prices and Mogas 95 prices generally move in a similar fashion, with Mogas 97 trading at a premium to Mogas 95. The difference between the two grades of Mogas varies due to relative changes in the supply-demand fundamentals for the two grades of petrol. In 2013–14 Mogas 97 prices were on average 82.6 cpl, which was 1.1 cpl higher than Mogas 95 prices.92 On a weekly basis, the difference ranged from a low of around 0.4 cpl to a high of around 2.0 cpl. The difference between the two grades was relatively small from early February 2014 through to the end of June 2014.
Quality premiums
The quality premiums for RULP and PULP primarily reflect the difference between the international benchmark prices of Mogas 95 and Mogas 97 and the prices of RULP and PULP refined to Australian standards, respectively. The quality premiums are influenced by the relative bargaining strengths of buyers and sellers and general market conditions for the two fuels.
91 The components of the IPP for RULP are described in section 5.3.1.
92 Prices in chart 9.2 are calculated using daily average Mogas prices from Platts and the Reserve Bank of Australia AUD–USD exchange rate. These Mogas prices are slightly different to the Mogas prices in table 5.1 and table 9.1. This is due to different methods used by the refiner-wholesalers to determine Mogas prices and their value in Australian dollars.
Monitoring of the Australian petroleum industry December 2014 99

In 2013–14 the average quality premium for PULP 95 in the five largest cities was around 4.9 cpl. It was 0.3 cpl higher than the average quality premium in 2012–13.
9.4.3 PULP 95 wholesale price benchmarks
Net wholesale prices compared with the IPP
Chart 9.3 shows monthly average net actual wholesale prices (i.e. actual wholesale prices less excise and GST) and the IPP for PULP 95 in the five largest cities in 2013–14. Actual wholesale prices are derived from data provided by the monitored companies.
Chart 9.3 Monthly average net wholesale prices and the IPP for PULP 95, five largest cities: July 2013 to June 2014
30
50
70
90
110
130
150
cpl
cpl
Net wholesale price IPP
Jun-14
May-14
Apr-14
Mar-14
Feb-14
Jan-14
Dec-13
Nov-13
Oct-13
Sep-13
Aug
-13
Jul-1
3
Source: ACCC analysis based on data obtained from firms monitored through the ACCC’s monitoring process.
The chart shows that movements in net wholesale prices closely tracked movements in the IPP.
In 2013–14 net wholesale prices were on average around 6.5 cpl higher than the IPP.
Actual wholesale prices compared with TGPs
Chart 9.4 shows monthly average actual wholesale prices and TGPs for PULP 95 in the five largest cities in 2013–14.
The TGP represents the spot price of purchasing PULP 95 from a wholesaler at the terminal gate. As with RULP, relatively few PULP transactions are made at the terminal gate; instead, they are negotiated in advance with prices struck slightly above or below TGP depending on volumes and additional services.
100 Monitoring of the Australian petroleum industry December 2014

Chart 9.4 Monthly average actual wholesale prices and TGPs for PULP 95, five largest cities: July 2013 to June 2014
80
100
120
140
160
180
200
cpl
cpl
TGP Actual wholesale price
Jun-14
May-14
Apr-14
Mar-14
Feb-14
Jan-14
Dec-13
Nov-13
Oct-13
Sep-13
Aug
-13
Jul-1
3
Source: ACCC analysis based on data obtained from firms monitored through the ACCC’s monitoring process.
The chart shows that in 2013–14 movements in actual wholesale prices and TGPs for PULP 95 also tracked each other closely.
TGPs in the five largest cities were on average around 2.0 cpl higher than actual wholesale prices.
The annual average wholesale price for PULP 95 in 2013–14 was 148.9 cpl, which was 7.8 cpl higher than in 2012–13.
A comparison with RULP prices shows that in 2013–14:
• average wholesale prices for PULP 95 were 6.9 cpl higher than wholesale prices for RULP
• average PULP 95 TGPs were 8.4 cpl higher than RULP TGPs.
A similar chart is not provided for PULP 98 as only two refiner-wholesalers publish a PULP 98 TGP.
In 2013–14 actual and net wholesale prices for PULP 98 moved in line with PULP 95 prices, albeit at a higher level:
• average net wholesale prices for PULP 98 were 102.6 cpl, or 5.6 cpl higher than for PULP 95
• average actual wholesale prices for PULP 98 were 155.1 cpl, or 6.2 cpl higher than for PULP 95.
9.4.4 Gross indicative retail differences for PULP 95Gross indicative retail differences (GIRDs) are calculated by subtracting average TGPs from average retail petrol prices.
GIRDs should be treated only as a useful approximate benchmark for the difference between wholesale and retail prices. They should not be confused with actual retail profits.93
Table 9.2 shows annual average GIRDs for PULP 95 in each of the five largest cities from 2011−12 to 2013−14.
93 Chapter 12 presents data on retail profits derived from financial data provided by the monitored companies.
Monitoring of the Australian petroleum industry December 2014 101

Table 9.2 Annual average PULP 95 retail prices, TGPs and gross indicative retail differences, five largest cities: 2011−12 to 2013−14
Location YearAverage retail
pricecpl
Average TGPcpl
Gross indicative retail difference
cpl
Five city average 2011−12 153.0 145.1 7.9
2012−13 151.7 142.7 9.0
2013−14 161.2 150.9 10.3
Sydney 2011−12 153.5 145.2 8.3
2012−13 152.0 143.1 8.9
2013−14 161.4 151.1 10.3
Melbourne 2011−12 150.8 144.6 6.2
2012−13 150.2 142.3 7.9
2013−14 159.1 150.7 8.4
Brisbane 2011−12 155.5 144.9 10.6
2012−13 154.2 142.6 11.6
2013−14 163.7 150.9 12.8
Adelaide 2011−12 152.3 145.3 7.0
2012−13 150.4 142.7 7.7
2013−14 160.3 151.0 9.3
Perth 2011−12 152.8 145.5 7.3
2012−13 151.7 143.0 8.7
2013−14 161.5 150.8 10.7
Source: ACCC calculations based on data from Informed Sources, WA FuelWatch, and information provided by the monitored companies.
Table 9.2 shows that GIRDs:
• increased in the five largest cities on average from 7.9 cpl in 2011–12 to 10.3 cpl in 2013–14, an increase of 2.4 cpl
• increased in every city in both 2012–13 and 2013–14
• were highest in Brisbane (they were higher than 10 cpl in each year)
• were lowest in Melbourne in 2011–12 and 2013–14, and in Adelaide in 2012–13.
A comparison with RULP GIRDs shows that:94
• GIRDs for PULP 95 and RULP across the five largest cities were broadly similar in 2011–12 (there was only a 0.2 cpl difference)
• the differential between GIRDs for PULP 95 and RULP across the five largest cities increased to 1.9 cpl in 2012–13 and 2.2 cpl in 2013–14
• in 2013–14 the differential between GIRDs for PULP 95 and RULP was highest in Sydney (3.5 cpl) and lowest in Perth (1.5 cpl).
94 RULP GIRDs are shown in table 6.1 in chapter 6.
102 Monitoring of the Australian petroleum industry December 2014

9.4.5 Components of the retail PULP 95 priceChart 9.5 shows the three main components of the annual average retail PULP 95 price across the five largest cities in 2013−14. The two largest components of the pump price—Mogas 97 and taxes (excise and the GST)—accounted for 84 per cent of the price of PULP 95. Around half of the pump price of PULP 95 was the cost of international refined petrol. Other costs and margins made up 16 per cent of the pump price, compared with 13 per cent for RULP.95
Chart 9.5 Components of annual average retail PULP 95 price in the five largest cities: 2013–14
Other costs and marginsTaxesMogas 97
PULP 95161.2 cpl
cpl %
25.8 16
52.8 33
82.6 51
Source: ACCC calculations based on Informed Sources, Platts and RBA data.
9.5 Supply of PULPPULP in Australia is either refined locally or imported. Chart 9.6 shows the volume and percentage of PULP sales by source of supply over the five years 2009–10 to 2013–14. It shows that:
• sales of PULP in Australia steadily increased between 2009–10 and 2012–13 and stabilised in 2013–14
• domestic production continues to be the main source of supply for PULP, accounting for 73 per cent of all sales volumes in 2013–14
• in 2013–14 PULP sales were 5034 megalitres (ML), an increase of 34 ML from 2012–13—domestic refinery production increased by 124 ML, while import volumes decreased by 90 ML.
95 Components of the retail RULP price are described in section 6.4.
Monitoring of the Australian petroleum industry December 2014 103

Chart 9.6 Volume and percentage of PULP sales by source, Australia: 2009–10 to 2013–14
0
1000
2000
3000
4000
5000
6000
7000
2013–142012–132011–122010–112009–10
meg
alitres
Imports (estimated)Domestic refinery production
24%
76%78% 75% 71% 73%
22%25% 29% 27%
Source: ACCC analysis based on data obtained from firms monitored through the ACCC’s monitoring process; Department of Resources, Energy and Tourism (RET) and Bureau of Resources and Energy Economics (BREE), Australian Petroleum Statistics, various issues.
9.6 Demand for PULPTable 9.3 shows annual sales of PULP in each of the states and the Northern Territory from 2009–10 to 2013–14. It shows that:
• aggregate demand for PULP has increased steadily over the past five years, with sales in Australia increasing from 3573 ML in 2009–10 to 5034 ML in 2013–14—an increase of 1461 ML or 41 per cent
• in 2013–14 New South Wales (NSW) had the largest share of PULP sales in Australia (46 per cent), followed by Victoria (20 per cent) and Queensland (18 per cent)
• PULP sales in NSW increased by 997 ML (76 per cent) between 2009–10 and 2013−14—this increase was largely due to the reduced availability of RULP following the NSW ethanol mandate.
As a result of the ethanol mandate in NSW some motorists who cannot, or choose not to, use E10 (i.e. RULP containing up to 10 per cent ethanol) in their vehicles have decided to use PULP, because of the reduced availability of RULP. Between 2007−08 and 2013−14 sales of PULP in NSW increased by 124 per cent, whereas in the rest of Australia the increase over the same period was only 26 per cent.
104 Monitoring of the Australian petroleum industry December 2014

Table 9.3 Annual sales of PULP by state and percentage of total Australian sales: 2009−10 to 2013−14
2009−10 2010−11 2011−12 2012−13 2013−14
ML
% of total Aust. sales ML
% of total Aust. sales ML
% of total Aust. sales ML
% of total Aust. sales ML
% of total Aust. sales
New South Wales (incl. ACT) 1316 37 1849 43 2149 45 2288 46 2313 46
Victoria 804 23 896 21 952 20 1012 20 1019 20
Queensland 772 22 828 19 895 19 926 19 917 18
South Australia 205 6 206 5 214 5 221 4 227 5
Western Australia 383 11 398 9 434 9 462 9 467 9
Tasmania 69 2 70 2 68 1 69 1 70 1
Northern Territory 23 1 21 0 22 0 21 0 20 0
Australia 3573 4267 4735 5000 5034
Source: RET and BREE, Australian Petroleum Statistics, various issues.
9.6.1 Sales of PULP compared with other grades of petrolChart 9.7 shows annual sales of RULP, PULP and ethanol blended petrol (EBP) in Australia from 2009–10 to 2013–14.
Chart 9.7 Annual sales of RULP, PULP and EBP, Australia: 2009–10 to 2013–14
0
2
4
6
8
10
12
14
2013–142012–132011–122010–112009–10
gigalitres
EBPPULPRULP
Source: RET and BREE, Australian Petroleum Statistics, various issues.
Chart 9.7 indicates that sales of PULP increased over the five years, sales of RULP decreased over the five years, and sales of EBP decreased each year since 2010–11.
In 2009–10 PULP made up 18 per cent of all unleaded petrol sales in Australia. By 2013–14 the share of PULP had increased to 28 per cent.
Monitoring of the Australian petroleum industry December 2014 105
9.6.2 Sales of PULP 95 and PULP 98Over the five years to 2013–14 volume sales of PULP 95 and PULP 98 have been broadly similar.96 However, the volume of sales of PULP 98 have grown at a greater rate than that of PULP 95 over this time.
In 2013–14 PULP 98 made up 52 per cent of total PULP volumes sold.
Between 2009–10 and 2013–14 annual sales of PULP 95 increased by 23 per cent to 2316 ML and annual sales of PULP 98 increased by 44 per cent to 2538 ML.
96 Sales of PULP 95 and PULP 98 are based on ACCC calculations of wholesale sales volumes provided by firms monitored through the ACCC’s monitoring process.
106 Monitoring of the Australian petroleum industry December 2014

10 Ethanol blended petrol
Key points• Ethanol is added to petrol to produce various grades of ethanol blended petrol (EBP). The
most common type of EBP is E10, which is regular unleaded petrol (RULP) containing up to 10 per cent ethanol.
• In 2013−14 total sales of EBP in Australia decreased by around 8 per cent from 2012–13. – Sales were down in New South Wales (NSW) and Queensland, and increased in Victoria
(albeit from a very low base). – EBP sales represented 13 per cent of total petrol sales in Australia (a decrease of
1 percentage point from 2012−13).
• The largest volume of EBP was sold in NSW, which accounted for 82 per cent of the Australian EBP market in 2013−14. This is primarily a result of the NSW government ethanol mandate. – From October 2011 the mandate has required that 6 per cent of the total volume of petrol
sold in NSW should be ethanol. – However, in 2013−14 only around 3.3 per cent of the total volume of petrol sold in NSW
was ethanol.
• Since its introduction in October 2007 the NSW mandate has had a significant impact on competition and consumers: – it has affected the competitive dynamic among retailers by reducing the availability of
RULP from many retail sites – it has reduced consumer choice—some motorists who cannot, or choose not to, use E10 in
their vehicles have, because of the reduced availability of RULP, decided to use PULP – since PULP retails at a higher price than RULP, it has meant that these motorists have been
paying significantly higher prices than if they had continued to purchase RULP.
• In 2013−14 across all retail sites selling both RULP and E10 which are monitored by the ACCC, RULP prices were higher on average than E10 prices by around 2.1 cents per litre (cpl). This was almost the same differential as in 2012−13 (2.0 cpl).
• In 2013−14 there continued to be ample supply of fuel grade ethanol in Australia: – ethanol production capacity in Australia was estimated to be 450 megalitres (ML) – ethanol demand was estimated to be around 236 ML.
10.1 IntroductionEthanol is added to petrol to produce various grades of ethanol blended petrol (EBP). Most ethanol is produced by fermenting raw materials such as sugar cane, sugar beet, molasses, wheat, grain and forest products. In Australia up to 10 per cent ethanol is blended with RULP to produce E10, which is the most common EBP marketed domestically. Ethanol is also used in E85 (a fuel blend consisting of 70–85 per cent ethanol with the remainder being petrol, which may only be used in vehicles specifically built or modified to use it) and in some premium unleaded petrol (PULP), such as ‘Premium 98’ and ‘Premium 100’ from United.
Monitoring of the Australian petroleum industry December 2014 107

10.2 EBP and government policyThere is no Australian Government mandate covering the supply of EBP in Australia. New South Wales (NSW) is the only state to have a mandate on the supply of EBP.
10.2.1 New South WalesThe NSW ethanol mandate was introduced in 2007 and required that, from 1 October 2007, 2 per cent of the total volume of petrol sold in NSW should be ethanol. On 1 January 2010 the mandated level increased to 4 per cent and on 1 October 2011 it increased to 6 per cent.
There have been no changes to the ethanol mandate in NSW in 2013–14.
Impact on competition and consumers in NSW
Since its introduction in October 2007 the mandate has had a significant impact on competition and consumers in NSW:
• It has affected the competitive dynamic among retailers by reducing the availability of RULP from many retail sites. – However, consumers have been able to source RULP from those retail sites excluded from the
requirements of the legislation. – Retail sites are excluded if they are part of an operation of 20 or fewer sites. In 2012 it was
estimated that these retail sites comprised around 25 per cent of retail sites in NSW.97
• It has reduced consumer choice. Some motorists who cannot, or choose not to, use E10 in their vehicles have decided to use PULP due to the reduced availability of RULP. – This is reflected in the fact that between 2007−08 and 2013−14 sales of PULP in NSW
increased by 124 per cent, whereas in the rest of Australia the increase over the same period was only 26 per cent.
• Furthermore, as PULP retails at a higher price than RULP, it has meant that these motorists have been paying significantly higher prices than if they had continued to purchase RULP. – In 2013−14 average PULP 95 prices in Sydney were 11.6 cents per litre (cpl) higher than
RULP prices.
10.2.2 QueenslandThere have been no public statements by the Queensland Government regarding the ethanol mandate since it was elected in February 2012.
On 3 April 2014 the Member for Condamine, Mr Ray Hopper MP, introduced the Liquid Fuel (Ethanol) Amendment Bill 2014 (the Bill) into the Queensland Parliament. The objective of the Bill was to amend the Liquid Fuel Supply Act 1984 to require minimum ethanol content in relation to the total volume of motor spirit sales in Queensland. Initially this would be 5 per cent, increasing after a period to 10 per cent.
97 Independent Pricing and Regulatory Tribunal, Ethanol supply and demand in NSW—Other Industries—Final Report, March 2012, p 4, http://www.ipart.nsw.gov.au/Home/Industries/Other/Reviews/Ethanol/Review_of_Ethanol_Supply_and_Demand_in_NSW/23_May_2012_-_Released_Final_Report/Final_Report_-_Ethanol_supply_and_demand_in_NSW_-_March_2012, accessed on 28 October 2014.
108 Monitoring of the Australian petroleum industry December 2014

The Bill was referred to the State Development, Infrastructure and Industry Committee of the Queensland Parliament for examination and report. On 24 October 2014 the Committee released its report, concluding that:
As the Bill was largely copied from the Liquid Fuel Supply (Ethanol) Amendment Bill 2008, it has not taken into account the current policy context, considered the developments in the broader biofuels industry, or assessed the lessons learned from ethanol mandates introduced in New South Wales and New Zealand. The failure to take these factors into consideration prior to the Bill’s introduction has meant that the committee cannot support the Bill.98
10.2.3 Ethanol Production Grants ProgramIn 2013–14 transport fuels such as petrol (including EBP) and diesel were subject to a fuel excise of 38.143 cpl. The Ethanol Production Grants Program (EPGP), which commenced in September 2002, provides full excise reimbursement to ethanol producers for ethanol produced and supplied for transport use in Australia from locally derived feedstocks. The EPGP effectively makes the ethanol component of Australian produced EBP excise free. Imported ethanol for transport purposes is subject to the excise (and is also subject to import duty of 5 per cent).
In the 2014−15 Budget the Australian Government announced that it would cease the EPGP on 30 June 2015.99 It also announced that the fuel excise on domestically produced ethanol would be reduced to zero from 1 July 2015 and then increased by 2.5 cpl per year for five years from 1 July 2016 until it reaches 12.5 cpl (which represents 50 per cent of the energy content equivalent rate). The excise-equivalent customs duty for ethanol would be retained.
10.3 Sales of EBPNSW, Queensland and Victoria are the only states that sell EBP in any significant quantities in Australia. Table 10.1 shows sales of EBP, RULP and PULP in these states, and the total across Australia, in 2012−13 and 2013−14.100
Table 10.1 Sales of EBP, RULP and PULP in NSW, Queensland, Victoria, and Australia: 2012−13 and 2013−14
NSW Qld Vic Australia
ML % ML % ML % ML
EBP2012−13 2 117 35 386 9 66 1 2 569
2013−14 1 918 33 353 9 81 2 2 352
RULP2012−13 1 679 28 2 731 68 3 719 78 11 090
2013−14 1 624 28 2 584 67 3 630 77 10 736
PULP*2012−13 2 288 37 926 23 1 012 21 5 000
2013−14 2 313 40 917 24 1 019 22 5 034
Total2012−13 6 084 100 4 043 100 4 797 100 18 659
2013−14 5 855 100 3 854 100 4 730 100 18 122
* Includes proprietary blends.
Source: ACCC calculations based on Bureau of Resources and Energy Economics (BREE), Australian Petroleum Statistics, Issue 205, August 2013 and Issue 215, June 2014.
98 Queensland Parliament (2014), State Development, Infrastructure and Industry Committee Report No. 52: Liquid Fuel Supply (Ethanol) Amendment Bill 2014, October 2014, p. v.
99 Australian Government (2014), Budget measures: budget paper no. 2: 2014−15, p. 165.
100 Note that NSW data includes the ACT.
Monitoring of the Australian petroleum industry December 2014 109

The table shows that, compared with 2012−13, sales of EBP in 2013−14:
• totalled 2352 megalitres (ML) across Australia, a decrease of 217 ML (or around 8 per cent)
• totalled 1918 ML in NSW, a decrease of 199 ML (or around 9 per cent)101
• decreased by 33 ML in Queensland (also around 9 per cent)
• increased in Victoria by 23 per cent, but this was from a very low base.
As a proportion of total petrol sales in the state, sales of EBP in NSW decreased by 2 percentage points to 33 per cent in 2013−14. In Victoria there was a marginal increase (by 1 percentage point) to 2 per cent. In Queensland there was no change (9 per cent).
Chart 10.1 shows annual sales of EBP in Australia since 2006−07 and the proportion of total petrol sales represented by EBP.
Chart 10.1 Total ethanol blended petrol sales by volume and as a proportion of total petrol sales: 2006−07 to 2013−14
0
500
1000
1500
2000
2500
3000
3500
2013-142012-132011-122010-112009-102008-092007-082006-07
meg
alitres
1%
4%
9%
12%
16%
14%14%
13%
Source: ACCC calculations based on Department of Resources, Energy and Tourism (RET) and BREE, Australian Petroleum Statistics, various issues.
The chart shows that:
• there was steady growth in sales of EBP between 2006−07 and 2010−11, peaking at 16 per cent of total petrol sales
• since then sales of EBP have steadily declined—in 2011−12 and 2012−13 they represented 14 per cent of total petrol sales
• in 2013–14 this proportion decreased to 13 per cent of total petrol sales.
Chart 10.2 shows annual sales of EBP in the three largest markets—NSW, Queensland and Victoria—as a proportion of total Australian EBP sales over the period 2006−07 to 2013−14.
101 Data from the NSW Office of Biofuels indicates that sales of EBP have been slowly decreasing since the fourth quarter of 2012. See NSW Government Office of Biofuels, Biofuels results, at: http://www.resourcesandenergy.nsw.gov.au/energy-consumers/sustainable-energy/office-of-biofuels/biofuels-results, accessed on 20 October 2014.
110 Monitoring of the Australian petroleum industry December 2014

Chart 10.2 Sales of EBP in the three largest markets as a proportion of total Australian EBP sales: 2006−07 to 2013−14
0
10
20
30
40
50
60
70
80
90
100
2013–142012–132011–122010–112009–102008–092007–082006–07
per cen
t
QldVicNSW
Source: ACCC calculations based on RET and BREE, Australian Petroleum Statistics, various issues.
The chart indicates that since 2006−07:
• NSW’s share of national EBP sales steadily increased (from 24 per cent in 2006−07 to 82 per cent in 2012−13). In 2013−14 NSW’s share remained at 82 per cent.
• Queensland’s share steadily decreased (from 74 per cent in 2006−07 to 15 per cent in 2012−13). In 2013−14 Queensland’s share remained at 15 per cent.
• Victoria’s share of national EBP sales remained small over this period (ranging between 1 per cent and 5 per cent). In 2013−14 it was 3 per cent.
10.4 Retail sites selling E10 petrolChart 10.3 shows the number of retail sites selling E10 in Australia over the period January 2007 to June 2014.102 The chart shows that:
• the number of retail sites selling E10 increased steadily between January 2007 (around 250 sites) and September 2010 (around 1530 sites)
• since then the number of retail sites selling E10 has declined to around 1300 sites in June 2014 (a decrease of 230 retail sites, or around 15 per cent)
• over the last three years the number of sites selling E10 has been relatively stable, generally ranging between 1200 and 1300 sites.
The average number of retail sites selling E10 in Australia in 2013−14 was around 1300 sites. This was 40 sites more than the average in 2012−13 (around 1260 sites).
102 The data in charts 10.3 and 10.4 is based on the number of retail sites on the first day of each month selling E10, and E10 but not RULP, for which Informed Sources had price data.
Monitoring of the Australian petroleum industry December 2014 111

Chart 10.3 Number of retail sites selling E10 in Australia: January 2007 to June 2014nu
mber of retail s
ites
0
200
400
600
800
1000
1200
1400
1600
1800
Apr-14Jan-14Oct–13Jul–13Apr–13Jan–13Oct–12Jul–12Apr–12Jan–12Oct–11Jul–11Apr–11Jan–11Oct–10Jul–10Apr–10Jan–10Oct–09Jul–09Apr–09Jan–09Oct–08Jul–08Apr–08Jan–08Oct–07Jul–07Apr–07Jan–07
Oct–13
Jan-14
Apr-14
Jun-14
Jul–13
Apr–13
Jan–13
Oct–12
Jul–12
Apr–12
Jan–12
Oct–11
Jul–11
Apr–11
Jan–11
Oct–10
Jul–10
Apr–10
Jan–10
Oct–09
Jul–09
Apr–09
Jan–09
Oct–08
Jul–08
Apr–08
Jan–08
Oct–07
Jul–07
Apr–07
Jan–07
Introduction of NSW ethanol mandate
Source: ACCC calculations based on Informed Sources data.
Chart 10.4 shows the number of retail sites selling E10, and E10 but not RULP (referred to as E10 only), in Sydney and Brisbane between July 2011 and June 2014. These are the two cities with the most number of E10 sites—as at June 2014 they accounted for around 48 per cent of the total number of E10 sites in Australia.
In Sydney the number of retail sites selling E10 has remained in a band of between 500 and 550 sites over the three year period. However, the number of sites selling E10 only has been trending downwards—from around 400 sites in early 2012 to around 315 sites in June 2014 (a decrease of over 20 per cent).
As the number of sites selling E10 only in Sydney during 2013−14 has decreased, this diminishes the adverse impact of the NSW ethanol mandate on those consumers that wish to purchase RULP.
In Brisbane the number of retail sites selling E10 increased in 2013−14 to around 170 sites, an increase of 25 sites from the average in 2012−13 (of around 145 sites). The number of sites selling E10 only in Brisbane has remained broadly stable over the three years at less than 30 sites.
112 Monitoring of the Australian petroleum industry December 2014

Chart 10.4 Number of sites selling E10, and E10 only, in Sydney and Brisbane: July 2011 to June 2014
number of retail s
ites
0
100
200
300
400
500
600
700
Jun-14May-14Apr-14Mar-14Feb-14Jan-14Dec-13Nov-13Oct-13Sep-13Aug-13Jul-13Jun-13May-13Apr-13Mar-13Feb-13Jan-13Dec-12Nov-12Oct-12Sep-12Aug-12Jul-12Jun-12May-12Apr-12Mar-12Feb-12Jan-12Dec-11Nov-11Jul-11
Apr–14
Jan–14
Oct–13
Jul–13
Apr–13
Jan–13
Oct–12
Jul–12
Apr–12
Jan–12
Oct–11
Jul–11
Jun–14
Sydney E10 only Brisbane E10 Brisbane E10 onlySydney E10
Source: ACCC calculations based on Informed Sources data.
10.5 Price differentialsThe ACCC commenced monitoring and reporting on the price differential between RULP and E10 in October 2006. Under this monitoring program, E10 prices were collected from various retail sites in a particular location and compared with the RULP prices at those retail sites. To be included in the analysis retail sites must sell both E10 and RULP.
Retail RULP prices have tended to be higher than E10 prices. This may reflect a number of influences, including:
• the ethanol component of E10 is effectively excise free
• the energy component of ethanol is lower compared with RULP
• motorists will not purchase E10 unless it is cheaper than RULP.
Chart 10.5 shows the monthly average differential between RULP and E10 prices, in nominal terms, across all retail sites selling both RULP and E10 which are monitored by the ACCC over the period July 2011 to June 2014.103 It indicates that the differential has increased marginally over the three years—from a low of around 1.7 cpl in July to September 2011 to a high of 2.2 cpl in August and September 2013. It subsequently decreased slightly to end the period at 2.0 cpl in June 2014.
In 2013−14 average RULP prices were higher than average E10 prices by 2.1 cpl. This was almost the same as in 2012−13 (2.0 cpl).
103 Additional information on the RULP-E10 price differential for each of the locations included in the ACCC’s monitoring, and a description of the methodology used, is at appendix F.
Monitoring of the Australian petroleum industry December 2014 113

Chart 10.5 Monthly average RULP–E10 differentials, all monitored locations: July 2011 to June 2014
cpl
0
0.5
1.0
1.5
2.0
2.5
3.0
Mar–14
Nov–13
Jul–13
Mar–13
Nov–12
Jul–12
Mar–12
Nov–11
Jul–11
Jun–14
Source: ACCC calculations based on Informed Sources data.
As shown in table 10.1, the most widely used types of petrol in NSW are E10 and PULP. In 2013−14 the PULP 95–E10 price differential in Sydney was 13.0 cpl (a decrease of 0.2 cpl from 2012−13).
10.6 Ethanol supply and demandThere are currently three fuel grade ethanol producers in Australia: Manildra (which produces ethanol from wheat starch); Wilmar (which produces ethanol from molasses); and Dalby (which produces ethanol from sorghum).
According to the APAC biofuel consultants report Australian Biofuels 2014–15 (APAC report) ethanol production capacity in Australia in 2013−14 was estimated to be 450 ML (the same as last year). Demand for ethanol in 2013−14 was 236 ML, a decrease of 48 ML (or around 17 per cent) from 2012−13.104 This represents a 52 per cent plant utilisation rate (down from 63 per cent in 2012−13).
The APAC report provides estimates of existing ethanol production capacity and forecast planned production capacity to 2020. These are shown in table 10.2.105
104 APAC biofuel consultants, Australian Biofuels 2013−14 (October 2014), p. 3.
105 Ibid, p. 32.
114 Monitoring of the Australian petroleum industry December 2014

Table 10.2 Australian ethanol production capacity (ML): 2014 to 2020
Operator 2014 2015 2016 2017 2018 2019 2020
Manildra—Nowra, NSW 300 300 300 300 300 300 300
Wilmar—Sarina, Qld 60 60 60 60 60 60 60
Dalby Biorefinery—Dalby, Qld 90 90 90 90 90 90 90
Total—existing plants 450 450 450 450 450 450 450
Total—planned plants – 5 5 150 350 405 405
Total—existing and planned plants 450 455 455 600 800 855 855
Source: APAC biofuel consultants, Australian Biofuels 2013−14 (October 2014), p. 32.
Four new producers are forecast to come on stream by 2020, and total production capacity is forecast to increase from 450 ML in 2014 to 855 ML in 2020. The table does not take into account the increasing portion of capacity diverted to supplying the export market, industrial market or other non-fuel ethanol markets.106 The APAC report cautions that:
…unless there is a material change in the fuel ethanol market place, history shows that the likelihood of there being a need for additional ethanol capacity beyond the existing capacity is slim. No new greenfield ethanol plant has been constructed in Australia since 2009 when the Dalby plant was commissioned.107
In section 10.2 it was noted that a bill had been introduced into the Queensland Parliament that would require minimum ethanol content in relation to the total volume of motor spirit sales in Queensland of 5 per cent initially, increasing after a period to 10 per cent. While the State Development, Infrastructure and Industry Committee of the Queensland Parliament reported on 24 October 2014 that the bill could not be supported, the APAC report considered whether there would be sufficient supplies of ethanol to meet a possible mandate in Queensland, as well as the current mandate in NSW. In line with the projected ethanol production capacity in table 10.2, the APAC report concluded:
…on the assumption that each state will import/export ethanol to make up demand, there appears to be surplus existing and planned plant capacity in the two states to meet the NSW 6% ethanol mandate and the proposed Queensland 5% or 10% ethanol mandate.108
106 Ibid, p. 32.
107 Ibid, p. 33.
108 Ibid, p. 48.
Monitoring of the Australian petroleum industry December 2014 115

116 Monitoring of the Australian petroleum industry December 2014

11 Financial performance of the Australian downstream petroleum industry
Key points• In 2013–14 net profits for the Australian downstream petroleum industry for all products
increased by 46 per cent to $1.16 billion. In terms of cents per litre (cpl) of fuel sold, they were 1.30 cpl. – This includes any oil based products that are derived from crude oil processed in
oil refineries, and other services such as convenience store sales. – In 2012–13 real net profits were $796 million, or 0.88 cpl.
• The industry sold 89 billion litres of fuel products in 2013–14, and earned $84 billion in total revenue. – In 2012–13 sales of fuel products were 90 billion litres, earning $82 billion in real
total revenue.
• In 2013–14 petrol products (i.e. RULP, PULP and EBP) recorded net profits of $728 million from 36 billion litres sold (or 2.01 cpl), compared with $699 million real net profits in 2012–13. – RULP net profits were $187 million, a 6 per cent increase on 2012–13 ($176 million). – PULP grades continued to earn significant net profits—in 2013–14 they were $506 million, a
4 per cent increase on 2012–13 ($488 million).
• In 2013–14 diesel net profits were $276 million, an increase of 26 per cent on 2012–13 ($218 million).
• Net profits by sector were mixed in 2013–14: – The refinery sector reported net profits of $27 million, turning around real net losses of
$110 million in 2012–13 and $626 million in 2011–12. – The total supply sector recorded net losses of $170 million. – The wholesale and retail sectors continued to record the highest net profits of $836 million
and $495 million, respectively.
11.1 IntroductionThis chapter reports on the financial results (revenues, costs and profits) for 2013–14 of the monitored firms in the Australian downstream petroleum industry. All financial data in this chapter are presented in real terms.109
As noted in chapter 1, the Australian downstream petroleum industry can be divided into three sectors: total supply (i.e. refining, imports and buy-sell transactions), wholesale and retail. The ACCC also separately assesses the financial performance of the refinery sector (which is part of total supply). The financial performance of each sector is analysed separately in chapter 12.
109 Base year is 2013–14, using Australian Bureau of Statistics (ABS), 6401.0 Consumer Price Index, Australia, June 2014, TABLES 1 and 2. CPI: All Groups, Index Numbers and Percentage Changes, 23 July 2014.
Monitoring of the Australian petroleum industry December 2014 117

11.2 Overview of the financial performance of the downstream petroleum industry
Table 11.1 shows sales volumes, revenue, net profits and unit net profit in real terms for the downstream petroleum industry for three categories:110
• all products and services—i.e. any oil based products that are derived from crude oil processed in oil refineries, and other services such as convenience store sales
• petrol products—i.e. regular unleaded petrol (RULP), premium unleaded petrol (PULP) and ethanol blended petrol (EBP)
• diesel.
The key performance indicator used to monitor the profitability of the downstream petroleum industry is adjusted earnings before interest and taxes (EBIT). EBIT measures the total returns before interest income, expenses and taxes are taken into account. The ACCC adjusts EBIT by excluding costs and revenues associated with activities that are one-off and not part of a firm’s normal business operations (such as non-operating income and impairment costs associated with a writedown of refinery asset values).
Table 11.1 Sales volumes, revenue and net profits in the downstream petroleum industry: 2013−14 and average in real terms for 2002–03 to 2013–14
2013–14 2002–03 to 2013–14 average (real)
All products and services Sales volumes (ML) 89 348 81 574
Total revenue ($ million) 84 288 67 679
Net profits ($ million) 1 161 1 618
Unit net profit (cpl) 1.30 1.98
Petrol products(RULP, PULP and EBP)
Sales volumes (ML) 36 318 36 384
Total revenue ($ million) 33 426 29 296
Net profits ($ million) 728 643
Unit net profit (cpl) 2.01 1.77
Diesel Sales volumes (ML) 36 753 28 757
Total revenue ($ million) 33 576 23 796
Net profits ($ million) 276 680
Unit net profit (cpl) 0.75 2.36
Source: ACCC calculations based on data obtained from firms monitored through the ACCC’s monitoring process; and ABS, 6401.0 Consumer Price Index, Australia, June 2014, TABLES 1 and 2. CPI: All Groups, Index Numbers and Percentage Changes, 23 July 2014.
Note: Real values in 2013–14 dollars.
Table 11.1 shows that in 2013–14:
• For all products and services: – sales volumes were 89.3 billion litres, a decrease of 1 per cent from last year – total revenue increased by 3 per cent to $84.3 billion – net profits increased by 46 per cent to $1.16 billion – unit net profit was 1.30 cents per litre (cpl), an increase of 47 per cent on 2012–13 (0.88 cpl).
110 Unit net profit is expressed in terms of cents per litre (cpl) and is derived by dividing net profits by sales volumes. Total industry sales volumes are derived after the elimination of intra-company transfers.
118 Monitoring of the Australian petroleum industry December 2014

• For petrol products: – sales volumes were 36.3 billion litres, a decrease of 2 per cent – total revenue was $33.4 billion, a marginal increase from $33.2 billion in 2012–13 – net profits increased to $728 million, an increase of 4 per cent – unit net profit was 2.01 cpl, an increase of 7 per cent on 2012–13 (1.88 cpl).
• For diesel: – total revenue was $33.6 billion from 36.8 billion litres sold – revenues and volumes were higher than for all petrol products combined.
The largest contributor to industry net profits by product was PULP, for the third consecutive year. PULP net profits were $506 million in 2013–14, an increase of 4 per cent on 2012–13. This compares with $187 million for RULP and $276 million for diesel.
The largest contributor to industry net profits by sector was the wholesale sector with earnings of $836 million in 2013–14. The retail sector contributed $495 million to net profits.
11.3 Revenue, costs and profits in the downstream petroleum industry—all products and services
11.3.1 Revenue and costs—all products and servicesChart 11.1 shows total real revenue and costs for all products and services in the downstream petroleum industry over the period 2002–03 to 2013–14.
Chart 11.1 Downstream petroleum industry total real revenue and costs, all products and services: 2002–03 to 2013–14
0
10
20
30
40
50
60
70
80
90
2013–142012–132011–122010–112009–102008–092007–082006–072005–062004–052003–042002–03
$ billion
Real costsReal revenue
Source: ACCC calculations based on data obtained from firms monitored through the ACCC’s monitoring process; and ABS, 6401.0 Consumer Price Index, Australia, June 2014, TABLES 1 and 2. CPI: All Groups, Index Numbers and Percentage Changes, 23 July 2014.
Notes: Included in total costs are all expenses including impairment, amortisation and profit or loss on the sale of assets. These items are excluded from net profit calculations.
Real values in 2013–14 dollars.
Monitoring of the Australian petroleum industry December 2014 119

In the total downstream petroleum industry in 2013–14:
• total revenue increased by 3 per cent to $84.3 billion—the highest result since monitoring began in 2002–03
• total costs increased by 3 per cent to $83.9 billion, the second highest result after 2011–12 (when they were $85.2 billion)
• unit revenue and unit costs for 2013–14 were 94.3 cpl and 93.9 cpl, respectively
• both unit revenue and costs increased by 4 per cent.
11.3.2 Total and unit net profits—all products and services
Total net profits
Chart 11.2 shows real net profits for all products and services in the downstream petroleum industry over the period 2002–03 to 2013–14.
Chart 11.2 Downstream petroleum industry real net profits, all products and services: 2002−03 to 2013–14
–1.5
–1.0
–0.5
0.0
0.5
1.0
1.5
2.0
2.5
3.0
3.5
4.0
2013–142012–132011–122010–112009–102008–092007–082006–072005–062004–052003–042002–03
$ billion
Average: 2002–03 to 2013–14
Source: ACCC calculations based on data obtained from firms monitored through the ACCC’s monitoring process; and ABS, 6401.0 Consumer Price Index, Australia, June 2014, TABLES 1 and 2. CPI: All Groups, Index Numbers and Percentage Changes, 23 July 2014.
Note: Real values in 2013–14 dollars.
Chart 11.2 shows that:
• total industry net profits were $1.16 billion in 2013–14, an increase of 46 per cent on 2012–13 profits of $796 million
• over the period 2002–03 to 2013–14 annual average net profits were $1.62 billion.
The increase in net profits from last year was largely due to improvements in the financial performance of the total supply sector. The refinery sector was profitable in 2013–14 for the first time since 2010–11, while net losses in the other parts of the supply sector decreased.
The wholesale and retail sectors both reported declining profits in 2013–14, with decreases of 6 per cent and 10 per cent, respectively.
The refiner-wholesalers contributed the largest share of net profits with $658 million (57 per cent). Businesses operating only in the retail sector contributed $344 million (29 per cent) and the independent wholesalers contributed $159 million (14 per cent).
120 Monitoring of the Australian petroleum industry December 2014

Unit net profit
Chart 11.3 shows real unit net profit for all products and services in the downstream petroleum industry over the period 2002–03 to 2013–14.
Chart 11.3 Downstream petroleum industry real unit net profit, all products and services: 2002−03 to 2013–14
–2
–1
0
1
2
3
4
5
2013–142012–132011–122010–112009–102008–092007–082006–072005–062004–052003–042002–03
cpl
Average: 2002–03 to 2013–14
Source: ACCC calculations based on data obtained from firms monitored through the ACCC’s monitoring process; and ABS, 6401.0 Consumer Price Index, Australia, June 2014, TABLES 1 and 2. CPI: All Groups, Index Numbers and Percentage Changes, 23 July 2014.
Note: Real values in 2013–14 dollars.
Chart 11.3 shows that real unit net profit:
• was 1.30 cpl in 2013–14, an increase on 2012–13 (0.88 cpl)
• increased over the two years to 2013–14 but was still well below the average over 2002–03 to 2013–14 (1.98 cpl)
• was highest in the four years immediately preceding the Global Financial Crisis (GFC).
In 2013–14 independent wholesalers had the highest unit net profit at 3.48 cpl, followed by the retailers at 2.77 cpl and the refiner-wholesalers at 0.91 cpl.
11.3.3 Other key performance indicators—all products and servicesIn addition to net profits, two other key performance indicators are used to assess the performance of the downstream petroleum industry. These are:
• Return on sales (RoS)—the ratio of adjusted EBIT to sales revenue. RoS calculates the extent to which profit is earned from each dollar of revenue after deducting all relevant operating costs, other than interest and tax.
• Return on assets (RoA)—the ratio of adjusted EBIT to assets. RoA calculates the extent to which profit is earned from each dollar of assets controlled.
Chart 11.4 shows RoS and RoA over the period 2002–03 to 2013–14.
Monitoring of the Australian petroleum industry December 2014 121

Chart 11.4 Downstream petroleum industry return on sales and return on assets, all products and services: 2002–03 to 2013–14
-10
-5
0
5
10
15
20
2013–142012–132011–122010–112009–102008–092007–082006–072005–062004–052003–042002–03
per cen
t
RoARoS
Source: ACCC calculations based on data obtained from firms monitored through the ACCC’s monitoring process.
RoS was 1.38 per cent in 2013–14, an increase from 0.97 per cent in 2012–13:
• average RoS for the period 2002–03 to 2013–14 was 2.29 per cent
• the low average RoS over the period highlights that the downstream petroleum industry is a high turnover, low margin industry
• independent wholesalers reported the highest RoS in 2013–14 with 3.59 per cent.
RoA was 5.61 per cent in 2013–14, an increase from 3.42 per cent in 2012–13:111
• average RoA for the period 2002–03 to 2013–14 was 7.80 per cent
• the highest RoA over the period occurred in 2005–06, when it reached 16.63 per cent
• retail-only businesses reported the highest RoA in 2013–14 with 22.49 per cent.
111 There are a number of caveats concerning RoA for the refinery sector. The value of assets is not market-based as refinery assets are not generally traded in a liquid market. Therefore, RoA may be influenced by asset evaluation methodologies and accounting depreciation rates. This may complicate comparisons of RoA data with industries where firms’ asset values are market-based. Over the past three years, there have been significant write-downs of asset values and impairment charges against four refineries.
122 Monitoring of the Australian petroleum industry December 2014

11.4 Revenue, costs and profits in the downstream petroleum industry—petrol products
This section assesses financial results for petrol products in the downstream petroleum industry. As noted earlier, petrol products are RULP, PULP and EBP.
The methodology used to allocate expenses and estimate individual product profits is discussed in appendix B.
11.4.1 Revenue and costs—petrol productsAnalysis of total revenue and costs for petrol products in 2013–14 indicates that:
• total revenue for petrol products increased by 1 per cent to $33.4 billion – the higher prices for petrol products in 2013–14 were offset by a 2 per cent decrease in the
volume of petrol sold
• total costs increased by 1 per cent to $33.0 billion
• total revenue by petrol product was broadly the same as in 2012–13: – both RULP and PULP total revenue increased by 1 per cent to $20.4 billion and $9.3 billion,
respectively – EBP total revenue decreased by 1 per cent to $3.8 billion.
11.4.2 Total and unit net profits—petrol products
Total net profits
Chart 11.5 shows total real net profits on petrol products over the period 2002–03 to 2013–14.
Chart 11.5 Downstream petroleum industry real net profits, petrol products: 2002–03 to 2013–14
–1000
–500
0
500
1000
1500
2013–142012–132011–122010–112009–102008–092007–082006–072005–062004–052003–042002–03
$ million
Average: 2002–03 to 2013–14
Source: ACCC calculations based on data obtained from firms monitored through the ACCC’s monitoring process; and ABS, 6401.0 Consumer Price Index, Australia, June 2014, TABLES 1 and 2. CPI: All Groups, Index Numbers and Percentage Changes, 23 July 2014.
Notes: Due to data revisions, this chart is not comparable with previous ACCC petrol monitoring reports.
Real values in 2013–14 dollars.
Chart 11.5 shows that real net profits on petrol products were:
• $728 million in 2013–14, an increase of 4 per cent from 2012–13
• on average $643 million over the period 2002–03 to 2013–14.
Monitoring of the Australian petroleum industry December 2014 123

In 2013–14 PULP contributed 69 per cent of petrol net profits, despite comprising only around a quarter of volume sold. RULP contributed 26 per cent, and EBP contributed 5 per cent.
Unit net profit
Chart 11.6 shows real unit net profit on petrol products over the period 2002–03 to 2013–14.
Chart 11.6 Downstream petroleum industry real unit net profit, petrol products: 2002–03 to 2013−14
–2
–1
0
1
2
3
4
2013–142012–132011–122010–112009–102008–092007–082006–072005–062004–052003–042002–03
cpl
Average: 2002–03 to 2013–14
Source: ACCC calculations based on data obtained from firms monitored through the ACCC’s monitoring process; and ABS, 6401.0 Consumer Price Index, Australia, June 2014, TABLES 1 and 2. CPI: All Groups, Index Numbers and Percentage Changes, 23 July 2014.
Notes: Due to data revisions, this chart is not comparable with previous ACCC petrol monitoring reports.
Real values in 2013–14 dollars.
The chart shows that real unit net profit on petrol products in the downstream petroleum industry was:
• 2.01 cpl in 2013–14, an increase of 7 per cent from 1.88 cpl in 2012–13
• on average 1.77 cpl over the period 2002–03 to 2013–14.
Unit net profits increased for all petrol grades in 2013–14. RULP unit net profit increased by 9 per cent from 2012–13 to 0.81 cpl.
11.5 Net profits by sectorThis section provides an overview of net profits for the three sectors of the Australian downstream petroleum industry. It also provides information on the refinery sector, which is a component of total supply (which also includes imports and buy-sell transactions). Chapter 12 provides detailed financial information on each these sectors.
The ACCC collects data for all operations and by sector for all monitored companies. Some of these companies do not have internal structures that mirror the conventional and ACCC sector split. Therefore, internal allocations and accounting arrangements (especially for vertically integrated firms) may affect the profit results of individual sectors.
124 Monitoring of the Australian petroleum industry December 2014

11.5.1 Net profits by sector—all productsTotal real net profits by sector over the period 2002–03 to 2013–14 are shown in chart 11.7.
Chart 11.7 Downstream petroleum industry net profits by sector in real terms, all products: 2002−03 to 2013–14
–3
–2
–1
0
1
2
3
2013–142012–132011–122010–112009–102008–092007–082006–072005–062004–052003–042002–03
$ billion
RetailWholesaleRefinery Total supply
Source: ACCC calculations based on data obtained from firms monitored through the ACCC’s monitoring process; and ABS, 6401.0 Consumer Price Index, Australia, June 2014, TABLES 1 and 2. CPI: All Groups, Index Numbers and Percentage Changes, 23 July 2014.
Note: Real values in 2013–14 dollars.
Chart 11.7 shows that:
• annual net profits for the refinery sector have gone through two clear trends since 2002–03: – prior to the GFC, the sector made annual average net profits of $1.4 billion between 2002–03
and 2007–08 – between 2008–09 and 2013–14 the refinery sector incurred annual average net losses of
$127 million
• the total supply sector reduced its net losses from $640 million in 2012–13 to net losses of $170 million in 2013–14 – this result was due in part to the refinery sector recording net profits for the first time in
three years – the refinery sector made net profits of $27 million in 2013–14, an improvement of $137 million
from net losses of $110 million in 2012–13
• in 2013–14 the wholesale sector made net profits of $836 million, a decrease of 6 per cent from 2012–13 – since the GFC, the wholesale sector has been the most profitable of the downstream sectors
• the retail sector earned $495 million in net profits in 2013–14, a decrease of 10 per cent from 2012–13 – this decrease was partly due to reduced volumes, which decreased by 1.7 per cent.
Over the period 2002–03 to 2013–14:
• the wholesale sector was the most profitable, with average annual net profits of $834 million
• the total supply sector was the next most profitable, with average annual net profits of $496 million – however, this sector has recorded net losses for all but one year since 2008–09.
Monitoring of the Australian petroleum industry December 2014 125

The retail sector had annual average net profits of $354 million over the period 2005–06 to 2013–14.
11.5.2 Net profits by sector—petrol productsChart 11.8 shows real net profits by sector on petrol products over the period 2002–03 to 2013–14.
Chart 11.8 Downstream petroleum industry real net profits by sector, petrol products: 2002−03 to 2013–14
–1000
–500
0
500
1000
1500
2013–142012–132011–122010–112009–102008–092007–082006–072005–062004–052003–042002–03
$ million
RetailWholesaleRefinery Total supply
Source: ACCC calculations based on data obtained from firms monitored through the ACCC’s monitoring process; and ABS, 6401.0 Consumer Price Index, Australia, June 2014, TABLES 1 and 2. CPI: All Groups, Index Numbers and Percentage Changes, 23 July 2014.
Notes: Refinery is a sub-sector of total supply.
Real values in 2013–14 dollars.
The chart shows that:
• the retail sector recorded the largest net profits from petrol products with $271 million—this was 11 per cent lower than in 2012–13 when it was $306 million
• the wholesale sector had the second largest net profits from petrol products with $245 million in 2013–14
• the total supply sector reported net profits from petrol products of $212 million in 2013–14, an increase of 19 per cent from 2012–13
• the largest growth in petrol profits occurred in the refinery sector which increased net profits from petrol by 29 per cent to $167 million.
126 Monitoring of the Australian petroleum industry December 2014

12 Financial performance by sector
Key pointsRefinery• The Australian refinery sector reported net profits of $27 million, or 0.08 cents per litre (cpl),
on the sale of all products in 2013–14.
• Total revenue in 2013–14 was $28.7 billion earned on sales of 33.7 billion litres.
• Petrol products (i.e. RULP, PULP and EBP) recorded net profits of $167 million, compared with real net profits of $129 million in 2012–13.
Total supply• The total supply sector recorded net losses of $170 million, or 0.24 cpl, on the sale of all
products in 2013–14.
• Total revenue in 2013–14 was $60.1 billion earned on sales of 71.6 billion litres.
• Petrol products recorded net profits of $212 million in 2013–14, compared with real net profits of $178 million in 2012–13.
Wholesale• The wholesale sector recorded net profits of $836 million, or 1.59 cpl on total revenue of
$49.5 billion and total sales volumes of 52.6 billion litres in 2013–14.
• Net profits on petrol products were $245 million, up 14 per cent on 2012–13 in real terms.
• Other products, including lubricants and oils, were the largest contributor to total wholesale net profits earning $470 million in 2013–14.
Retail• The retail sector recorded net profits of $495 million in 2013–14 on 18.0 billion litres of
fuel sold. – The retail sector earned a unit net profit of 2.75 cpl—the highest for any sector.
• Net profits on petrol products were $271 million, down from real net profits of $306 million in 2012–13.
• Convenience store sales earned total net profits of $201 million, a real decrease of 4 per cent from 2012–13.
12.1 IntroductionThis chapter provides financial performance data for the refinery, total supply, wholesale and retail sectors of the Australian downstream petroleum industry.
As at 30 June 2014 the refinery sector consisted of five refineries across Australia’s four largest cities. These refineries were operated by BP, Caltex, Mobil and Shell (the ‘refiner-wholesalers’).
The total supply sector includes refining, importing and buy-sell transactions between the refiner-wholesalers. Due to the closure of domestic refineries over recent years imports are expected to play a more significant role in Australia’s fuel supply chain in the future. Refinery and total supply data were collected from the four refiner-wholesalers.
Monitoring of the Australian petroleum industry December 2014 127

The wholesale sector includes the four refiner-wholesalers and a number of independent wholesalers. Petroleum products are purchased either locally or through direct imports. Wholesale financial data in this monitoring report were collected from the four refiner-wholesalers and Ausfuel, Liberty, Neumann and United.112 The refiner-wholesalers account for the majority of wholesale sales.
The retail sector includes BP and Caltex, two supermarkets, independent wholesalers, large independent retailers and many smaller independent owner-operators.113 Retail financial data in this monitoring report have been collected from 7-Eleven, Ausfuel, BP, Caltex, Coles, Neumann, On The Run, United and Woolworths.
Accounting data are provided to the ACCC on a historical cost basis. Net earnings in the refinery and total supply sectors will be influenced by the exposure of the companies to international crude oil or petrol prices and exchange rate movements. This is due to changes in international prices or exchange rate movements between the time that crude oil is purchased and the time that refined petrol is processed and sold.
All financial data presented in this chapter are in real terms.114
12.2 Overview of financial performance in the refinery, total supply, wholesale and retail sectors
Table 12.1 shows sales volumes, revenue, net profits and unit net profit by sector in real terms for the downstream petroleum industry for three categories:115
• all products and services—i.e. any oil based products that are derived from crude oil processed in oil refineries, and other services such as convenience store sales
• petrol products—i.e. regular unleaded petrol (RULP), premium unleaded petrol (PULP) and ethanol blended petrol (EBP)
• diesel.
As noted in chapter 11 the ACCC uses adjusted earnings before interest and taxes (EBIT) as its key measure of net profits. Costs and revenues that are one-off and not part of a firm’s normal business operations are excluded from adjusted EBIT. This includes refinery impairment costs associated with a write-down of refinery asset values.
112 Ausfuel and Neumann are now owned by Puma Energy.
113 Note that the smaller independent owner-operators in the retail sector are not monitored under the ACCC’s monitoring process. Mobil no longer operates in the retail sector while Shell operated only a small number of refuelling sites that also sell to the public—these sites are not included in the monitoring of the retail sector.
114 The base year is 2013–14, using Australian Bureau of Statistics (ABS), 6401.0 Consumer Price Index, Australia, June 2014, TABLES 1 and 2. CPI: All Groups, Index Numbers and Percentage Changes, 23 July 2014.
115 Unit net profit is expressed in terms of cents per litre (cpl) and is derived by dividing net profits by sales volumes. Total industry sales volumes are derived after the elimination of intra-company transfers.
128 Monitoring of the Australian petroleum industry December 2014

Table 12.1 Sales volumes and net profits by sector: 2013–14 and average in real terms between 2002–03 and 2013–14
2013–14 2002–03 to 2013–14 average (real)
Refinery sector
All products
Sales volumes (ML) 33 720 37 343
Net profits ($ million) 27 628
Unit net profit (cpl) 0.08 1.68
Petrol
Sales volumes (ML) 14 453 15 920
Net profits ($ million) 167 415
Unit net profit (cpl) 1.16 2.61
Diesel
Sales volumes (ML) 11 935 12 031
Net profits ($ million) 262 503
Unit net profit (cpl) 2.20 4.18
Total supply sector
All products
Sale volumes (ML) 71 569 67 219
Net profits ($ million) -170 496
Unit net profit (cpl) -0.24 0.74
Petrol
Sales volumes (ML) 25 005 26 420
Net profits ($ million) 212 443
Unit net profit (cpl) 0.85 1.68
Diesel
Sales volumes (ML) 31 907 25 964
Net profits ($ million) 88 459
Unit net profit (cpl) 0.28 1.77
Wholesale sector
All products
Sale volumes (ML) 52 615 47 960
Net profits ($ million) 836 834
Unit net profit (cpl) 1.59 1.74
Petrol
Sales volumes (ML) 17 578 18 917
Net profits ($ million) 245 72
Unit net profit (cpl) 1.40 0.38
Diesel
Sales volumes (ML) 23 922 18 810
Net profits ($ million) 82 159
Unit net profit (cpl) 0.34 0.85
Retail sector^
All products and services
Sale volumes (ML) 17 976 16 611
Net profits ($ million) 495 354
Unit net profit (cpl) 2.75 2.13
Petrol
Sales volumes (ML) 12 221 11 992
Net profits ($ million) 271 162
Unit net profit (cpl) 2.22 1.35
Diesel
Sales volumes (ML) 4 781 3 373
Net profits ($ million) 106 73
Unit net profit (cpl) 2.22 2.17
Source: ACCC calculations based on data obtained from firms monitored through the ACCC’s monitoring process; and ABS, 6401.0 Consumer Price Index, Australia, June 2014, TABLES 1 and 2. CPI: All Groups, Index Numbers and Percentage Changes, 23 July 2014.
Notes: ^ Time series average for the retail sector is for the period 2005–06 to 2013–14.
Real values in 2013–14 dollars.
Monitoring of the Australian petroleum industry December 2014 129

12.3 Refinery sectorThe refinery sector is in transition with competition from newer and more efficient refineries in the Asia–Pacific region putting pressure on Australia’s refineries.
As noted in chapter 3, Viva Energy took ownership of Shell’s Geelong refinery in August 2014, and Caltex’s Kurnell refinery in Sydney ceased operating as a refinery in October 2014 and commenced operations as a terminal. BP’s Bulwer Island refinery in Brisbane is scheduled to close by mid-2015. This will leave just four refineries in Australia: two in Victoria (operated by Mobil and Viva Energy), one in Queensland (Caltex) and one in Western Australia (BP).
12.4 Refinery sector: revenue, costs and profits—all products
12.4.1 Refinery sector: revenue and costs—all productsChart 12.1 shows total real revenue and costs for the refinery sector over the period 2002–03 to 2013–14.
Chart 12.1 Refinery sector total real revenue and costs, all products: 2002–03 to 2013–14
0
5
10
15
20
25
30
35
2013–142012–132011–122010–112009–102008–092007–082006–072005–062004–052003–042002–03
$ billion
Refinery real costsRefinery real revenue
Source: ACCC calculations based on data obtained from firms monitored through the ACCC’s monitoring process; and ABS, 6401.0 Consumer Price Index, Australia, June 2014, TABLES 1 and 2. CPI: All Groups, Index Numbers and Percentage Changes, 23 July 2014.
Notes: Refinery costs include impairment expenses for the years 2010–11 to 2013–14 inclusive.
Real values in 2013–14 dollars.
In the refinery sector in 2013–14:
• total revenue and total costs were $28.7 billion and $29.4 billion, respectively—both revenue and costs increased by 3 per cent from 2012–13 – refinery sector costs have exceeded revenues every year since 2008–09, in part due to
impairment expenses associated with the write-downs of the values of refinery assets for the years 2010–11 to 2013–14 inclusive
• total sales volumes were 33.7 billion litres, a decrease of 4 per cent from 2012–13
• unit revenue and unit costs were 85.0 cpl and 87.3 cpl, respectively
• since 2002–03 revenue has increased by 48 per cent – despite refinery closures and a decrease in production volumes, revenues have increased due
to the increase in international crude oil and refined product prices.
130 Monitoring of the Australian petroleum industry December 2014

12.4.2 Refinery sector: total and unit net profits—all products
Total net profits
Refinery sector real net profits over the period 2002–03 to 2013–14 are shown in chart 12.2.
Chart 12.2 Refinery sector real net profits, all products: 2002–03 to 2013–14
–1000
–500
0
500
1000
1500
2000
2500
2013–142012–132011–122010–112009–102008–092007–082006–072005–062004–052003–042002–03
$ million
Average: 2002–03 to 2007–08
Average: 2008–09 to 2013–14
Source: ACCC calculations based on data obtained from firms monitored through the ACCC’s monitoring process; and ABS, 6401.0 Consumer Price Index, Australia, June 2014, TABLES 1 and 2. CPI: All Groups, Index Numbers and Percentage Changes, 23 July 2014.
Note: Real values in 2013–14 dollars.
The chart shows that:
• the refinery sector made net profits of $27 million in 2013–14, an increase of $137 million from real net losses of $110 million in 2012–13
• there were two distinct phases over the past 12 years: – prior to the Global Financial Crisis (GFC, 2002–03 to 2007–08) the refinery sector recorded
annual average net profits of $1.38 billion – in contrast, the refinery sector reported annual average net losses of $127 million since the
GFC (2008–09 to 2013–14).
As noted in chapter 11, adjusted EBIT excludes one-off and non-operating expenses, such as impairment expenses associated with the write-downs of the values of refinery assets.
In 2013–14 unadjusted EBIT for the refinery sector was a net loss of $701 million, compared with net losses of $565 million in 2012–13.
Unit net profit
Chart 12.3 shows real unit net profit for the refinery sector over the period 2002–03 to 2013–14.
Monitoring of the Australian petroleum industry December 2014 131

Chart 12.3 Refinery sector real unit net profit, all products: 2002–03 to 2013–14
–3
–2
–1
0
1
2
3
4
5
6
7
2013–142012–132011–122010–112009–102008–092007–082006–072005–062004–052003–042002–03
cpl
Average: 2002–03 to 2007–08
Average: 2008–09 to 2013–14
Source: ACCC calculations based on data obtained from firms monitored through the ACCC’s monitoring process; and ABS, 6401.0 Consumer Price Index, Australia, June 2014, TABLES 1 and 2. CPI: All Groups, Index Numbers and Percentage Changes, 23 July 2014.
Note: Real values in 2013–14 dollars.
The chart shows that real unit net profit for the refinery sector was:
• 0.08 cpl in 2013–14, compared with a unit net loss of 0.31 cpl in 2012–13
• 1.68 cpl on average over the period
• highest in 2005–06 (6.02 cpl), and lowest in 2011–12 (-1.68 cpl).
12.4.3 Refinery sector: other key performance indicators—all products In addition to net profits, two other key performance indicators are used to assess the performance of the refinery sector. These are return on sales (RoS) and return on assets (RoA), which are described in appendix B.
Chart 12.4 shows RoS and RoA for the refinery sector over the period 2002–03 to 2013–14.
132 Monitoring of the Australian petroleum industry December 2014

Chart 12.4 Refinery sector return on sales and return on assets, all products: 2002–03 to 2013–14
–15
–10
–5
0
5
10
15
20
25
30
2013–142012–132011–122010–112009–102008–092007–082006–072005–062004–052003–042002–03
per cen
t
RoARoS
Source: ACCC calculations based on data obtained from firms monitored through the ACCC’s monitoring process.
Return on sales
Chart 12.4 shows that:
• RoS increased from −0.39 per cent in 2012–13 to 0.09 per cent in 2013–14
• average RoS over the period was 2.14 per cent – average RoS prior to the GFC (2002−03 to 2007−08) was 5.39 per cent, and post-GFC
(2008−09 to 2013−14) it was −0.45 per cent.
Return on assets
Chart 12.4 shows that:
• RoA increased from −2.28 per cent in 2012–13 to 0.61 per cent in 2013–14
• average RoA over the period was 8.29 per cent – average RoA prior to the GFC (2002–03 to 2007–08) was 18.48 per cent, and post-GFC
(2008–09 to 2013–14) it was −1.95 per cent.
The write-down of the value of refinery assets from 2011–12 to 2013–14 reduced the value of refinery assets by more than half (in real terms) from its peak in 2007–08.116
116 There are a number of caveats concerning RoA for the refinery sector. The value of assets is not market-based as refinery assets are not generally traded in a liquid market. Therefore, RoA may be influenced by asset evaluation methodologies and accounting depreciation rates. This may complicate comparisons of RoA data with industries where firms’ asset values are market-based. Over the past three years, there have been significant write downs of asset values and impairment charges against four refineries.
Monitoring of the Australian petroleum industry December 2014 133

12.5 Refinery sector: revenue, costs and profits—petrol products
This section assesses financial results on petrol products (i.e. RULP and PULP) for the refinery sector.117
The methodology used to allocate expenses and estimate individual product profits is discussed in appendix B.
12.5.1 Refinery sector: revenue and costs—petrol productsAnalysis of total revenue and costs on petrol products in the refinery sector in 2013–14 indicates that:
• total revenue on petrol products increased by 3 per cent to $12.6 billion – the increase in revenue was driven by higher prices for petrol products in 2013–14, despite a
4 per cent decrease in sales volumes (to 14.5 billion litres)
• revenue on RULP was essentially unchanged from 2012–13 at $9.2 billion
• revenue on PULP increased by 10 per cent to $3.4 billion – PULP 95 revenue decreased by 3 per cent while PULP 98 revenue increased by 24 per cent
• total costs increased by 4 per cent to $12.7 billion.
12.5.2 Refinery sector: total and unit net profits—petrol products
Total net profits
Chart 12.5 shows net profits on petrol products for the refinery sector over the period 2002–03 to 2013–14.
Chart 12.5 Refinery sector real net profits, petrol products: 2002–03 to 2013–14
–400
–200
0
200
400
600
800
1000
1200
2013–142012–132011–122010–112009–102008–092007–082006–072005–062004–052003–042002–03
$ million
Average: 2002–03 to 2013–14
Source: ACCC calculations based on data obtained from firms monitored through the ACCC’s monitoring process; and ABS, 6401.0 Consumer Price Index, Australia, June 2014, TABLES 1 and 2. CPI: All Groups, Index Numbers and Percentage Changes, 23 July 2014.
Note: Real values in 2013–14 dollars.
117 EBP is not blended in the refinery sector and therefore not considered in the calculation of petrol profits for this sector.
134 Monitoring of the Australian petroleum industry December 2014

Chart 12.5 shows that real net profits on petrol products for the refinery sector were:
• $167 million in 2013–14, an increase of 29 per cent from 2012–13 – net losses on RULP decreased by 34 per cent to $21 million – net profits on PULP increased by 17 per cent to $188 million – PULP 95 net profits increased by 11 per cent – PULP 98 net profits increased by 20 per cent
• $415 million on average over the period 2002–03 to 2013–14.
Unit net profit
Refinery sector real unit net profit on petrol products over the period 2002–03 to 2013–14 are shown in chart 12.6.
Chart 12.6 Refinery sector real unit net profit, petrol products: 2002–03 to 2013–14
–2
–1
0
1
2
3
4
5
6
7
8
2013–142012–132011–122010–112009–102008–092007–082006–072005–062004–052003–042002–03
cpl
Average: 2002–03 to 2013–14
Source: ACCC calculations based on data obtained from firms monitored through the ACCC’s monitoring process; and ABS, 6401.0 Consumer Price Index, Australia, June 2014, TABLES 1 and 2. CPI: All Groups, Index Numbers and Percentage Changes, 23 July 2014.
Note: Real values in 2013–14 dollars.
The chart shows that real unit net profit on petrol products for the refinery sector was:
• 1.16 cpl in 2013–14, an increase of 34 per cent from 0.86 cpl in 2012–13
• 2.61 cpl on average over the period 2002–03 to 2013–14 – average unit net profit on petrol products prior to the GFC (2002–03 to 2007–08) was
4.52 cpl, and post-GFC (2008–09 to 2013–14) it was 0.53 cpl.
RULP made a unit net loss of 0.19 cpl in 2013–14, compared with a unit net loss of 0.27 cpl in the previous year—an improvement of 29 per cent. PULP unit net profit in 2013–14 increased by 13 per cent to 5.09 cpl.
Monitoring of the Australian petroleum industry December 2014 135

12.6 Total supply sectorThis section assesses the revenue, costs and profits of the total supply sector. This sector covers the following activities:
• domestic oil refining (the refinery sector being a sub-sector of total supply)
• imports of refined fuel products (and some exports)
• transactions between the refiner-wholesalers through buy-sell arrangements.118
The following caveats must be taken into consideration when assessing the financial performance of the total supply sector:
• Not all refiner-wholesalers’ operations are structured with a separate total supply sector. Refiner-wholesalers that do not have a total supply sector may carry out their importing function within the refinery operations while the buy-sell transactions may be included in the wholesale sector.
• This structural variation among refiner-wholesalers prompted the ACCC to adopt the concept of a separate total supply sector to bring consistency to the sectoral analysis. This decision was taken in consultation with the industry.
• Those companies that did have a total supply sector did not necessarily operate it as a separate cost centre.
• Achieving consistency in sectoral reporting meant some companies were required to make allocations not normally undertaken in their internal accounting systems.
12.7 Total supply sector: revenue, costs and profits—all products
12.7.1 Total supply: revenue and costs—all productsChart 12.7 shows total real revenue and costs for the total supply sector over the period 2002–03 to 2013–14.
118 Buy-sell arrangements are bilateral arrangements between one refiner-wholesaler to supply another with refined product where they do not have a refinery. For example, a refiner which does not have a refinery in Victoria can supply refined petrol in that state by having a buy-sell agreement with one of the Victorian refineries.
136 Monitoring of the Australian petroleum industry December 2014

Chart 12.7 Total supply sector total real revenue and costs, all products: 2002–03 to 2013–14
0
10
20
30
40
50
60
70
2013–142012–132011–122010–112009–102008–092007–082006–072005–062004–052003–042002–03
$ billion
Total supply real costsTotal supply real revenue
Source: ACCC calculations based on data obtained from firms monitored through the ACCC’s monitoring process; and ABS, 6401.0 Consumer Price Index, Australia, June 2014, TABLES 1 and 2. CPI: All Groups, Index Numbers and Percentage Changes, 23 July 2014.
Note: Real values in 2013–14 dollars.
In the total supply sector in 2013–14:
• total revenue and total costs were $60.1 billion and $61.1 billion, respectively – both revenue and costs increased by 2 per cent from 2012–13 – costs were greater than revenues in 2013–14 in part due to impairment expenses associated
with the write-downs of the values of refinery assets
• total sales volumes were 71.6 billion litres, a decrease of 2 per cent from 2012–13 – with the exception of PULP 98, sales volumes decreased for all petrol grades and diesel in
2013–14
• unit revenue and unit costs were 84.0 cpl and 85.3 cpl, respectively.
12.7.2 Total supply sector: total and unit net profits—all products
Total net profits
Chart 12.8 shows real net profits for all products for the total supply sector over the period 2002−03 to 2013–14.
Monitoring of the Australian petroleum industry December 2014 137

Chart 12.8 Total supply sector real net profits, all products: 2002–03 to 2013–14
–3000
–2000
–1000
0
1000
2000
3000
2013–142012–132011–122010–112009–102008–092007–082006–072005–062004–052003–042002–03
$ million
Average: 2002–03 to 2013–14
Source: ACCC calculations based on data obtained from firms monitored through the ACCC’s monitoring process; and ABS, 6401.0 Consumer Price Index, Australia, June 2014, TABLES 1 and 2. CPI: All Groups, Index Numbers and Percentage Changes, 23 July 2014.
Note: Real values in 2013–14 dollars.
The chart shows that the total supply sector:
• incurred net losses of $170 million in 2013–14119
– this was a 73 per cent improvement from net losses of $640 million in 2012–13
• incurred net losses in five of the last six years, with the largest net losses of $2.52 billion in 2008−09
• annual average net profits were $496 million over the period.
Unit net profit
Chart 12.9 shows real unit net profits for the total supply sector for all products over the period 2002–03 to 2013–14.
119 Note that if all expenses were included in the EBIT calculation, the total net losses (unadjusted) for the total supply sector would have been $891 million in 2013–14.
138 Monitoring of the Australian petroleum industry December 2014

Chart 12.9 Total supply sector real unit net profit, all products: 2002–03 to 2013–14
–5
–4
–3
–2
–1
0
1
2
3
4
5
2013–142012–132011–122010–112009–102008–092007–082006–072005–062004–052003–042002–03
cpl
Average: 2002–03 to 2013–14
Source: ACCC calculations based on data obtained from firms monitored through the ACCC’s monitoring process; and ABS, 6401.0 Consumer Price Index, Australia, June 2014, TABLES 1 and 2. CPI: All Groups, Index Numbers and Percentage Changes, 23 July 2014.
Note: Real values in 2013–14 dollars.
The total supply sector reported a unit net loss of 0.24 cpl in 2013–14, compared with a unit net loss of 0.88 cpl in 2012–13. Average unit net profit in the supply sector for the period 2002–03 to 2013–14 was 0.74 cpl, with real unit net profit exceeding 4.0 cpl in 2005–06 (4.09 cpl) and again in 2007–08 (4.05 cpl).
12.8 Total supply sector: revenue, costs and profits—petrol products
12.8.1 Total supply sector: revenue and costs—petrol productsFor petrol products in the total supply sector in 2013–14:
• total petrol revenue was $21.0 billion, a decrease of 1 per cent from 2012–13
• total petrol costs were also $21.0 billion, essentially unchanged from 2012–13
• petrol volumes decreased by 2 per cent to 25.0 billion litres – volumes of PULP 98 increased in 2013–14, while they decreased for all other grades of petrol
in 2013–14 – RULP sales were 16.4 billion litres, and PULP sales were 6.6 billion litres.
Note that only relatively small volumes of EBP are sold in the total supply sector—EBP is normally blended in the wholesale sector. Issues relating to sector and product allocation of data are discussed in appendix B, and these should be taken into account when assessing industry performance in the total supply sector.
Monitoring of the Australian petroleum industry December 2014 139

12.8.2 Total supply: total and unit net profits—petrol products
Total net profits
Chart 12.10 shows real net profits on petrol products for the total supply sector over the period 2002–03 to 2013–14.
Chart 12.10 Total supply sector real net profits, petrol products: 2002–03 to 2013–14
–1000
–500
0
500
1000
1500
2013–142012–132011–122010–112009–102008–092007–082006–072005–062004–052003–042002–03
$ million
Average: 2002–03 to 2013–14
Source: ACCC calculations based on data obtained from firms monitored through the ACCC’s monitoring process; and ABS, 6401.0 Consumer Price Index, Australia, June 2014, TABLES 1 and 2. CPI: All Groups, Index Numbers and Percentage Changes, 23 July 2014.
Notes: Due to data revisions, this chart is not comparable with previous ACCC petrol monitoring reports.
Real values in 2013–14 dollars.
Real net profits on petrol products in the total supply sector:
• increased by 19 per cent, from $178 million in 2012–13 to $212 million in 2013–14 – the increase was driven by net profits on PULP, which increased by $34 million to $240 million
• were $443 million on average over the period – historically RULP was the most profitable grade of petrol, with annual average net profits of
$381 million.
Unit net profit
Real unit net profit on petrol products for the total supply sector was 0.85 cpl in 2013–14, an increase of 22 per cent from 2012–13. Over the period 2002–03 to 2013–14 average unit net profit on petrol products was 1.68 cpl.
12.9 Total supply sector: foreign exchange gains and lossesThe total supply sector has high exposure to international markets through the importation of crude and refined product. This sector is also required to hold and store product, as it coordinates its purchase, sale and distribution. Volatile and rapidly changing international prices and exchange rates can impact significantly on the financial results for this sector. Foreign exchange gains and losses may therefore have a significant effect on the profitability of the total supply sector.
Chart 12.11 shows real foreign exchange gains and losses in the total supply sector over the period 2006–07 to 2013–14.
140 Monitoring of the Australian petroleum industry December 2014

Chart 12.11 Total supply sector real foreign exchange gains and losses: 2006–07 to 2013–14
–800
–600
–400
–200
0
200
400
600
2013–142012–132011–122010–112009–102008–092007–082006–07
$ million
Source: ACCC calculations based on data obtained from firms monitored through the ACCC’s monitoring process; and ABS, 6401.0 Consumer Price Index, Australia, June 2014, TABLES 1 and 2. CPI: All Groups, Index Numbers and Percentage Changes, 23 July 2014.
Note: Real values in 2013–14 dollars.
The chart shows that in 2013–14 the total supply sector reported gains of $63 million in foreign exchange transactions. This compares with real losses of $225 million in 2012–13.
Over the period 2006−07 to 2013−14 the total supply sector experienced average foreign exchange losses of $23 million, although this was heavily influenced by losses of $767 million in 2008–09.
Monitoring of the Australian petroleum industry December 2014 141

12.10 Wholesale sectorMonitored firms operating in the wholesale sector derive their income from the purchasing and reselling of petroleum products and lubricants to retail and commercial customers. These same firms source refined petroleum products locally from the refiner-wholesalers, other wholesalers or through direct imports, and then on-sell to other distributors/wholesalers and to retailers.
12.11 Wholesale sector: revenue, costs and profits—all products
12.11.1 Wholesale sector: revenue and costs—all productsIn 2013–14 revenue and costs in the wholesale sector both increased from 2012–13. Chart 12.12 shows total real revenue and costs for the wholesale sector over the period 2002–03 to 2013–14.
Chart 12.12 Wholesale sector total real revenue and costs, all products: 2002–03 to 2013–14
0
10
20
30
40
50
60
2013–142012–132011–122010–112009–102008–092007–082006–072005–062004–052003–042002–03
$ billion
Wholesale real costsWholesale real revenue
Source: ACCC calculations based on data obtained from firms monitored through the ACCC’s monitoring process; and ABS, 6401.0 Consumer Price Index, Australia, June 2014, TABLES 1 and 2. CPI: All Groups, Index Numbers and Percentage Changes, 23 July 2014.
Note: Real values in 2013–14 dollars.
Chart 12.12 shows that in the wholesale sector in 2013–14:
• total revenue and costs increased to $49.5 billion and $48.7 billion, respectively—this growth was associated mostly with increased product prices – revenue was 7 per cent higher and costs were 8 per cent higher than in 2012–13
• total volume was 52.6 billion litres, broadly unchanged from 2012–13
• unit revenue was 94.1 cpl in 2013–14, an increase of 7 per cent from 2012–13
• unit costs were 92.6 cpl in 2013–14, an increase of 7 per cent from 2012–13.
142 Monitoring of the Australian petroleum industry December 2014

12.11.2 Wholesale sector: total and unit net profits—all products
Total net profits
Chart 12.13 presents real net profits for the wholesale sector over the period 2002–03 to 2013–14.
Chart 12.13 Wholesale sector real net profits, all products: 2002–03 to 2013–14
0
200
400
600
800
1000
1200
1400
2013–142012–132011–122010–112009–102008–092007–082006–072005–062004–052003–042002–03
$ million
Average: 2002–03 to 2013–14
Source: ACCC calculations based on data obtained from firms monitored through the ACCC’s monitoring process; and ABS, 6401.0 Consumer Price Index, Australia, June 2014, TABLES 1 and 2. CPI: All Groups, Index Numbers and Percentage Changes, 23 July 2014.
Note: Real values in 2013–14 dollars.
Chart 12.13 shows that:
• net profits for the wholesale sector were $836 million in 2013–14, a decrease of 6 per cent from 2012–13
• the wholesale sector has shown relatively strong net profits since 2008–09 and continues to be the most profitable sector in the downstream petroleum industry
• annual average net profits were $834 million for the period 2002–03 to 2013–14.
Net profits of $470 million were earned from lubricants and oil products in 2013–14, compared with $366 million on all fuels.
Unit net profit
Real unit net profit on all products for the wholesale sector over the period 2002–03 to 2013–14 is presented in chart 12.14.
Monitoring of the Australian petroleum industry December 2014 143

Chart 12.14 Wholesale sector real unit net profit, all products: 2002–03 to 2013–14
0.0
0.5
1.0
1.5
2.0
2.5
3.0
2013–142012–132011–122010–112009–102008–092007–082006–072005–062004–052003–042002–03
cpl
Average: 2002–03 to 2013–14
Source: ACCC calculations based on data obtained from firms monitored through the ACCC’s monitoring process; and ABS, 6401.0 Consumer Price Index, Australia, June 2014, TABLES 1 and 2. CPI: All Groups, Index Numbers and Percentage Changes, 23 July 2014.
Note: Real values in 2013–14 dollars.
The chart shows that:
• unit net profit for the wholesale sector was 1.59 cpl in 2013–14, down 6 per cent from 2012–13
• average unit net profit was 1.74 cpl from 2002–03 to 2013–14.
Unit net profit in the wholesale sector was generally lower and more variable than in the refinery sector prior to the GFC in 2007–08. From 2008–09 to 2013–14 unit net profit in the wholesale sector was higher than in the refinery sector.
12.11.3 Wholesale sector: other key performance indicatorsThis section presents data on return on sales (RoS) and return on assets (RoA) to assess the performance of the wholesale sector. For further details on these key performance indicators see appendix B.
Chart 12.15 shows RoS and RoA over the period 2002–03 to 2013–14.
144 Monitoring of the Australian petroleum industry December 2014
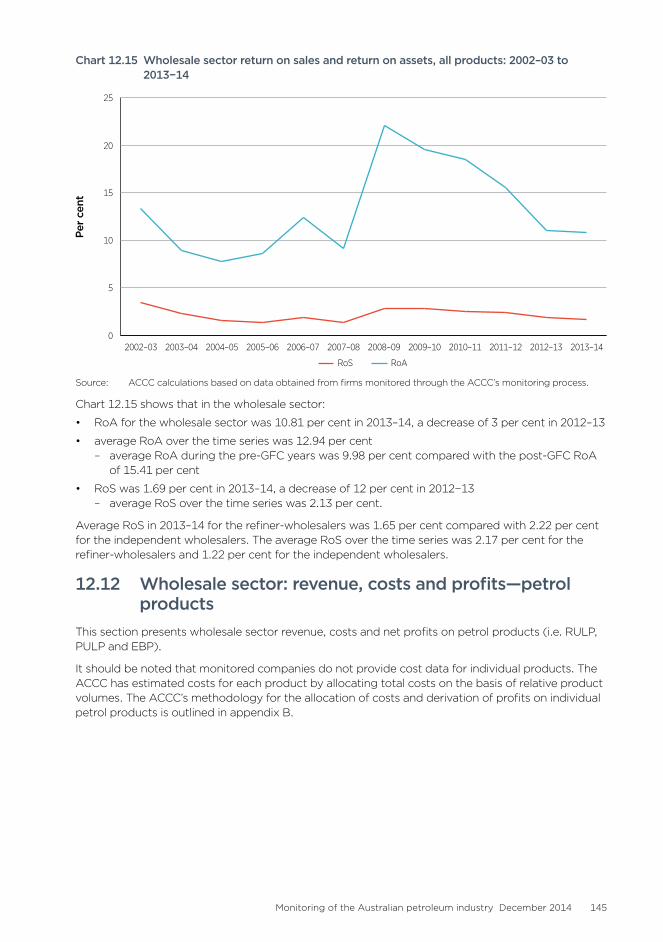
Chart 12.15 Wholesale sector return on sales and return on assets, all products: 2002–03 to 2013−14
0
5
10
15
20
25
2013–142012–132011–122010–112009–102008–092007–082006–072005–062004–052003–042002–03
Per ce
nt
RoARoS
Source: ACCC calculations based on data obtained from firms monitored through the ACCC’s monitoring process.
Chart 12.15 shows that in the wholesale sector:
• RoA for the wholesale sector was 10.81 per cent in 2013–14, a decrease of 3 per cent in 2012–13
• average RoA over the time series was 12.94 per cent – average RoA during the pre-GFC years was 9.98 per cent compared with the post-GFC RoA
of 15.41 per cent
• RoS was 1.69 per cent in 2013–14, a decrease of 12 per cent in 2012−13 – average RoS over the time series was 2.13 per cent.
Average RoS in 2013–14 for the refiner-wholesalers was 1.65 per cent compared with 2.22 per cent for the independent wholesalers. The average RoS over the time series was 2.17 per cent for the refiner-wholesalers and 1.22 per cent for the independent wholesalers.
12.12 Wholesale sector: revenue, costs and profits—petrol products
This section presents wholesale sector revenue, costs and net profits on petrol products (i.e. RULP, PULP and EBP).
It should be noted that monitored companies do not provide cost data for individual products. The ACCC has estimated costs for each product by allocating total costs on the basis of relative product volumes. The ACCC’s methodology for the allocation of costs and derivation of profits on individual petrol products is outlined in appendix B.
Monitoring of the Australian petroleum industry December 2014 145

12.12.1 Wholesale sector: revenue and costs—petrol productsFor petrol products in the wholesale sector in 2013–14:
• total revenue and costs on petrol products were around $16.7 billion and $16.4 billion, respectively – total revenue and costs on petrol products both increased by 3 per cent from 2012–13
• total sales volumes of petrol products continued to decrease in 2013–14 – they decreased by 4 per cent from 2012–13 and by 11 per cent since 2004–05 – EBP volumes decreased by 9 per cent from 2012–13 while PULP volumes increased
marginally.
12.12.2 Wholesale sector: total and unit net profits—petrol products
Total net profits
Chart 12.16 shows real net profit on petrol products in the wholesale sector over the period 2002–03 to 2013–14.
Chart 12.16 Wholesale sector real net profits, petrol products: 2002–03 to 2013–14
–200
–150
–100
–50
0
50
100
150
200
250
300
2013–142012–132011–122010–112009–102008–092007–082006–072005–062004–052003–042002–03
$ million
Average: 2002–03 to 2013–14
Source: ACCC calculations based on data obtained from firms monitored through the ACCC’s monitoring process; and ABS, 6401.0 Consumer Price Index, Australia, June 2014, TABLES 1 and 2. CPI: All Groups, Index Numbers and Percentage Changes, 23 July 2014.
Note: Real values in 2013–14 dollars.
Chart 12.16 shows that real net profits on petrol products in the wholesale sector:
• increased by 14 per cent to $245 million in 2013–14
• were substantially higher and more stable from 2009–10 to 2013–14 compared with the seven years to 2008–09 – the main driver of increased profits on petrol products in recent years was PULP – on average PULP contributed 77 per cent of petrol net profits in the three years to 2013–14 – net profits on RULP were $47 million in 2013–14, an increase of 129 per cent from 2012–13.
The wholesale sector incurred net losses on petrol products from 2003–04 to 2006–07, while the sector overall remained profitable over this period, earning much of its profits from non-petrol products, i.e. diesel, lubricants and oil products.
146 Monitoring of the Australian petroleum industry December 2014

Unit net profit
Chart 12.17 presents real unit net profit on petrol products in the wholesale sector over the period 2002–03 to 2013–14.
Chart 12.17 Wholesale sector real unit net profit, petrol products: 2002–03 to 2013–14
–1.0
–0.5
0.0
0.5
1.0
1.5
2013–142012–132011–122010–112009–102008–092007–082006–072005–062004–052003–042002–03
cpl
Average: 2002–03 to 2013–14
Source: ACCC calculations based on data obtained from firms monitored through the ACCC’s monitoring process; and ABS, 6401.0 Consumer Price Index, Australia, June 2014, TABLES 1 and 2. CPI: All Groups, Index Numbers and Percentage Changes, 23 July 2014.
Note: Real values in 2013–14 dollars.
Chart 12.17 shows that wholesale sector real unit net profit on petrol products:
• increased from 1.18 cpl in 2012–13 to 1.40 cpl in 2013–14 – unit net profit on RULP was 0.45 cpl in 2013–14, an increase from 0.19 cpl in 2012–13 – unit net profit on PULP was 3.21 cpl, virtually unchanged from 2012–13
• was on average 0.38 cpl from 2002–03 to 2013–14 – over the five years to 2013–14 it averaged 1.17 cpl—this is compares with the average for the
seven years to 2008–09 of –0.16 cpl.
12.13 Retail sectorThe retail sector has undergone significant change in recent years. Two refiner-wholesalers have withdrawn from retailing, while large independent retailers such as 7-Eleven, On The Run and Puma have increased their market share. However, by share of volume, the two supermarket chains continue to be the largest fuel retailers in Australia.
The majority of data presented in this retail section covers the period from 2005–06 to the present as earlier data are not comparable due to structural changes in the industry.120
12.14 Retail sector: revenue, costs and profitsWhile over four-fifths of revenue in the retail sector is generated on the sale of petroleum products, convenience store and other non-fuel sales have become increasingly important for overall profitability in the sector. Gross margins on non-fuel sales are generally far larger than can be earned through fuel sales.
120 Profits in 2013–14 are not fully comparable with those in previous years because the fuel retailing businesses of the supermarkets were required to fully fund shopper docket discounts from January 2014.
Monitoring of the Australian petroleum industry December 2014 147

The range of products sold at retail sites includes food and grocery items, trailer hire, car washes, ATM services and gas bottle exchanges. Revenue is also generated by sub-leasing a section of the store to fast food and coffee franchises.
12.14.1 Retail sector: revenue and costs—all products and servicesChart 12.18 shows total real revenue and costs for all products and services in the retail sector over the period 2005–06 to 2013–14.
Chart 12.18 Retail sector total real revenue and costs in real terms, all products and services 2005–06 to 2013–14
0
5
10
15
20
25
2013–142012–132011–122010–112009–102008–092007–082006–072005–06
$ billion
Retail real costsRetail real revenue
Source: ACCC calculations based on data obtained from firms monitored through the ACCC’s monitoring process; and ABS, 6401.0 Consumer Price Index, Australia, June 2014, TABLES 1 and 2. CPI: All Groups, Index Numbers and Percentage Changes, 23 July 2014.
Notes: Profits in 2013–14 are not fully comparable with those in previous years because the fuel retailing businesses of the supermarkets were required to fully fund shopper docket discounts from January 2014.
Real values in 2013–14 dollars.
Chart 12.18 shows that in the retail sector:
• total revenue and costs in 2013–14 were $21.4 billion and $21.0 billion, respectively – revenue was 4 per cent higher than 2012–13 while costs were 5 per cent higher – revenue and costs were both higher in 2013–14 than for any year since 2005–06 – revenue of monitored firms increased by 39 per cent between 2005–06 and 2013–14 – annual average revenue over the period was $18.1 billion.
Total sales volumes decreased by 2 per cent to 18.0 billion litres in 2013–14:
• this was the first year that volumes decreased since the series began in 2005–06
• diesel and PULP 98 volumes increased from 2012–13 while all other fuel volumes decreased
• LPG had the largest decrease in percentage terms, with volumes down 14 per cent on 2012−13.
Unit revenue in 2013–14 was 119.3 cpl, compared with 112.2 cpl in 2012–13 and unit costs in 2013–14 were 116.6 cpl, an increase from 109.3 cpl in 2012–13.
148 Monitoring of the Australian petroleum industry December 2014

12.14.2 Retail sector: total and unit net profits—all products and services
Total net profits
Total net profits include profits from the sale of fuel and non-fuel products and services sold through the convenience stores attached to the retail outlets. Chart 12.19 shows real net profits in the retail sector over the period 2005–06 to 2013–14.
Chart 12.19 Retail sector real net profits, all products and services: 2005–06 to 2013–14
0
100
200
300
400
500
600
2013–142012–132011–122010–112009–102008–092007–082006–072005–06
$ million
Average: 2005–06 to 2013–14
Source: ACCC calculations based on data obtained from firms monitored through the ACCC’s monitoring process; and ABS, 6401.0 Consumer Price Index, Australia, June 2014, TABLES 1 and 2. CPI: All Groups, Index Numbers and Percentage Changes, 23 July 2014.
Notes: Profits in 2013–14 are not fully comparable with those in previous years because the fuel retailing businesses of the supermarkets were required to fully fund shopper docket discounts from January 2014.
Real values in 2013–14 dollars.
Chart 12.19 shows that real net profits:
• were $495 million in 2013–14, a decrease of 10 per cent from 2012–13 – despite this decrease, they were the second highest for any year over the period 2005–06 to
2013–14
• were on average $354 million over the period 2005–06 to 2013–14
• increased each year over the period, except for 2008–09 and 2013–14.
Unit net profit
This section provides data on unit net profits in the retail sector and highlights the contribution of convenience store sales on overall profitability.
Chart 12.20 shows real unit net profit in the retail sector over the period 2005–06 to 2013–14. It shows net profit on fuel sales for every litre of fuel sold, and net profit on all retail products and services for every litre of fuel sold.
Monitoring of the Australian petroleum industry December 2014 149

Chart 12.20 Retail sector real unit net profit on fuel and all products and services: 2005–06 to 2013–14
0.0
0.5
1.0
1.5
2.0
2.5
3.0
3.5
2013–142012–132011–122010–112009–102008–092007–082006–072005–06
cpl
Unit net profit—all products and servicesUnit net profit—fuel
Average—all products and services: 2005–06 to 2013–14Average—fuel: 2005–06 to 2013–14
Source: ACCC calculations based on data obtained from firms monitored through the ACCC’s monitoring process; and ABS, 6401.0 Consumer Price Index, Australia, June 2014, TABLES 1 and 2. CPI: All Groups, Index Numbers and Percentage Changes, 23 July 2014.
Notes: Profits in 2013–14 are not fully comparable with those in previous years because the fuel retailing businesses of the supermarkets were required to fully fund shopper docket discounts from January 2014.
Real values in 2013–14 dollars.
Real unit net profit in the retail sector was:
• 2.75 cpl on all products and services, compared with 3.00 cpl in 2012–13 – on average 2.13 cpl over the period 2005–06 to 2013–14
• 1.63 cpl on fuel only, compared with 1.85 cpl in 2012–13 – on average 1.29 cpl over the period 2005–06 to 2013–14.
While non-fuel sales made up less than 20 per cent of total revenue in 2013–14 they contributed over 40 per cent to retail sector net profits.
12.14.3 Effects of the ACCC investigation into shopper dockets on retail sector profits
A key feature of retail sector unit net profit for petrol products shown in chart 12.19 is the decrease in unit net profit in 2013−14. This follows a period of increasing unit net profit since 2008−09.
An important contributor to the decrease in 2013−14 is the change in the way the supermarkets fund their shopper docket fuel discounts. Prior to 1 January 2014 Coles and Woolworths funded a substantial portion of these discounts from their supermarket businesses. Since then, Coles and Woolworths have fully funded their shopper docket fuel discount offers from their fuel retailing businesses. The change in these funding arrangements was the result of undertakings made by Coles and Woolworths to the ACCC.
As noted earlier, the ACCC’s investigation into the shopper docket fuel discount offers of the major supermarkets was completed in December 2013. The ACCC accepted court-enforceable undertakings from Coles and Woolworths that they would voluntarily cease making fuel discount offers which are wholly or partially funded by any part of their business other than their fuel retailing business, and would in addition limit fuel discount offers which are linked to supermarket purchases to a maximum of 4.0 cpl.
150 Monitoring of the Australian petroleum industry December 2014

The influence of this factor was acknowledged by Wesfarmers in their full year results when they noted that:
…reduced fuel volumes driven largely by the capping of fuel docket discounts, and increased funding of fuel docket discounts, contributed to the reduction in Convenience [i.e. Coles Express] earnings.121
It may also have been the case that expanded shopper docket discounts, by impacting on the incentives and ability of retailers to compete, led to margins being higher than they otherwise would have been, and that that effect has now ended.
12.14.4 Retail sector: other key performance indicators—all products and services
Chart 12.21 shows RoS and RoA for the retail sector over the period 2002–03 to 2013–14.
Chart 12.21 Retail sector return on sales and return on assets, all products and services: 2002–03 to 2013–14
0
2
4
6
8
10
12
14
16
18
2013–142012–132011–122010–112009–102008–092007–082006–072005–062004–052003–042002–03
per cen
t
RoARoS
Source: ACCC calculations based on data obtained from firms monitored through the ACCC’s monitoring process.
Note: Profits in 2013–14 are not fully comparable with those in previous years because the fuel retailing businesses of the supermarkets were required to fully fund shopper docket discounts from January 2014.
Return on sales
Chart 12.21 shows that:
• RoS decreased from 2.68 per cent in 2012–13 to 2.31 per cent in 2013–14 – average RoS was 1.88 per cent over the period – independent wholesalers were the most profitable of the monitored firms in the retail sector,
with an average RoS of 4.23 per cent – the specialist retailers had an average RoS of 2.32 per cent.
121 Wesfarmers (2014), 2014 Full-Year Results, 20 August 2014, page 2. http://www.wesfarmers.com.au/investors/reports-results-presentations.html#results-presentations, accessed on 16 October 2014.
Monitoring of the Australian petroleum industry December 2014 151

Return on assets
Chart 12.21 shows that:
• RoA increased from 12.94 per cent in 2012–13 to 14.66 per cent in 2013–14 – average RoA was 12.52 per cent over the period 2002–03 to 2013–14, and 14.06 per cent in
the five years to 2013–14 – the specialist retailers had the highest average RoA in the retail sector at 22.49 per cent.
12.15 Retail sector: revenue, costs and profits—petrol products
This section assesses financial results on petrol products (i.e. RULP, PULP and EBP) for the retail sector.
The methodology used to allocate expenses and estimate individual product profits is discussed in appendix B.
12.15.1 Retail sector: revenue and costs—petrol productsIn the retail sector, for petrol products in 2013–14:
• total revenue and costs on petrol products were around $12.5 billion and $12.2 billion, respectively – total revenue and costs both increased by around 3 per cent from 2012–13
• petrol sales volumes decreased by 3 per cent – this was the first time that retail petrol volumes decreased over period 2005−06 to 2013−14 – RULP sales were 6.9 billion litres—they decreased by 24 per cent since 2005–06 – PULP sales were 3.3 billion litres—they increased by 82 per cent since 2005–06 – EBP sales were 2.0 billion litres, substantially above the volume reported for 2005–06 (around
107 000 litres).
12.15.2 Retail sector: total and unit net profits—petrol products
Total net profits
Chart 12.22 shows retail real net profits on petrol products over the period 2005–06 to 2013–14.
152 Monitoring of the Australian petroleum industry December 2014

Chart 12.22 Retail sector real net profits, petrol products: 2005–06 to 2013–14
0
50
100
150
200
250
300
350
2013–142012–132011–122010–112009–102008–092007–082006–072005–06
$ million
Average: 2005–06 to 2012–13
Source: ACCC calculations based on data obtained from firms monitored through the ACCC’s monitoring process; and ABS, 6401.0 Consumer Price Index, Australia, June 2014, TABLES 1 and 2. CPI: All Groups, Index Numbers and Percentage Changes, 23 July 2014.
Notes: Profits in 2013–14 are not fully comparable with those in previous years because the fuel retailing businesses of the supermarkets were required to fully fund shopper docket discounts from January 2014.
Real values in 2013–14 dollars.
Chart 12.22 shows that real net profits on petrol products for the retail sector:
• were $271 million in 2013–14, a decrease of 11 per cent from 2012–13
• were on average $162 million over the period 2005–06 to 2013–14 – net profits grew by 282 per cent between 2008–09 and 2012–13.
The largest contributor to net profits was RULP at $121 million, followed by PULP at $110 million. Net profits in 2013–14 decreased for all grades of petrol from 2012–13.
Unit net profit
Chart 12.23 shows real unit net profit on petrol products for the retail sector over the period 2005−06 to 2013–14.
Monitoring of the Australian petroleum industry December 2014 153

Chart 12.23 Retail sector real unit net profit, petrol products: 2005–06 to 2013–14
0.0
0.5
1.0
1.5
2.0
2.5
3.0
2013–142012–132011–122010–112009–102008–092007–082006–072005–06
cpl
Average: 2005–06 to 2013–14
Source: ACCC calculations based on data obtained from firms monitored through the ACCC’s monitoring process; and ABS, 6401.0 Consumer Price Index, Australia, June 2014, TABLES 1 and 2. CPI: All Groups, Index Numbers and Percentage Changes, 23 July 2014.
Notes: Profits in 2013–14 are not fully comparable with those in previous years because the fuel retailing businesses of the supermarkets were required to fully fund shopper docket discounts from January 2014.
Real values in 2013–14 dollars.
Real unit net profit on petrol products in the retail sector was:
• 2.22 cpl in 2013–14, a decrease of 8 per cent from 2012–13
• on average 1.35 cpl over the period 2005–06 to 2013–14.
Unit net profit in 2013–14 was:
• 1.75 cpl for RULP
• 3.30 cpl for PULP 95
• 3.35 cpl for PULP 98
• 2.02 cpl for EBP.
Unit net profit in 2013–14 decreased for all grades of petrol from 2012–13:
• for RULP and EBP, unit net profit in 2013–14 was the second highest since 2005–06 (after 2012−13)
• for both grades of PULP, unit net profit in 2013–14 was the lowest since 2009–10.
12.16 Retail sector: convenience store salesThis section examines convenience store sales and profitability in the retail sector. It covers the period 2006–07 to 2013–14.122
The monitored retail companies have a wide variety of business models which can affect convenience store profits. These include:
• profit sharing arrangements with franchisees
• a third party operating the convenience store and sharing profits on fuel sales
122 Note that the time series for convenience store profits can only be calculated from 2006–07 onwards. A shortened template was used for earlier years and convenience store key performance indicators cannot be calculated from this shortened template.
154 Monitoring of the Australian petroleum industry December 2014

• a more conventional business model where all convenience store profits go to the owner of the retail site.
12.16.1 Retail sector: convenience store gross marginsGross margins are calculated by subtracting the cost of goods sold (purchases and usually transport costs in the retail sector) from revenue. This measure—expressed as a percentage of revenue—represents the proportion of each revenue dollar that a retailer retains after deducting the direct costs associated with the sale of the good.
Chart 12.24 shows real gross margins on petrol, diesel, automotive LPG and convenience store sales over the period 2006–07 to 2013–14.
Chart 12.24 Retail sector real gross margins on petrol, diesel, automotive LPG and convenience store sales: 2006–07 to 2013–14
–5
0
5
10
15
20
25
30
35
40
2013–142012–132011–122010–112009–102008–092007–082006–07
per cen
t
Convenience storeAuto LPG Diesel Petrol
Source: ACCC analysis based on data obtained from firms monitored through the ACCC’s monitoring process.
Note: Profits in 2013–14 are not fully comparable with those in previous years because the fuel retailing businesses of the supermarkets were required to fully fund shopper docket discounts from January 2014.
Chart 12.24 shows that real gross margins on convenience store sales were substantially larger than on petroleum products:
• in 2013–14 gross margins on convenience store sales were 30.6 per cent, the lowest in the period 2006–07 to 2013–14 – they were on average 32.0 per cent over the period
• in contrast, gross margins on petroleum products in 2013–14 were: – 8.1 per cent on petrol – 8.3 per cent on diesel – negative 3.2 per cent on automotive LPG
• gross margins for the total retail sector were 11.29 per cent in 2013–14.
Monitoring of the Australian petroleum industry December 2014 155

12.16.2 Retail sector: convenience store net profitsChart 12.25 shows real net profits on petrol, diesel, automotive LPG and convenience store sales over the period 2006−07 to 2013–14.
The methodology for allocating costs among individual retail products and services is outlined in appendix B.
Chart 12.25 Retail sector real net profits for petrol, diesel, automotive LPG and convenience store sales: 2006–07 to 2013–14
–100
–50
0
50
100
150
200
250
300
350
2013–142012–132011–122010–112009–102008–092007–082006–07
$ million
Convenience storeAuto LPG Diesel Petrol
Source: ACCC calculations based on data obtained from firms monitored through the ACCC’s monitoring process; and ABS, 6401.0 Consumer Price Index, Australia, June 2014, TABLES 1 and 2. CPI: All Groups, Index Numbers and Percentage Changes, 23 July 2014.
Notes: Profits in 2013–14 are not fully comparable with those in previous years because the fuel retailing businesses of the supermarkets were required to fully fund shopper docket discounts from January 2014.
Real values in 2013–14 dollars.
Chart 12.25 shows that:
• petrol sales contributed $271 million to retail sector net profits in 2013–14 – petrol sales have been the largest contributor to retail sector net profits since 2009–10
• convenience store sales contributed $201 million to retail sector net profits in 2013–14 – convenience store sales contributed over 40 per cent to retail sector net profits in 2013–14
despite making up less than 20 per cent of total revenue
• diesel net profits exceeded $100 million in 2013–14 while automotive LPG recorded net losses for the fifth consecutive year.
156 Monitoring of the Australian petroleum industry December 2014

Appendix A: Minister’s letter and Direction
Monitoring of the Australian petroleum industry December 2014 157

158 Monitoring of the Australian petroleum industry December 2014

Appendix B: Data collection and methodological issues
This appendix outlines the process of data collection for the report and some issues relating to the processing of that data. It also details the methodology used to analyse the financial performance of the downstream petroleum industry.
CollectionThe ACCC’s approach to data collection for the 2014 report was similar to previous monitoring reports.
The report focuses on the Australian downstream petroleum industry. Consequently, the ACCC has not sought data from overseas suppliers of crude oil or refined product, domestic producers of crude oil or from minor wholesalers and retailers. The companies from which the ACCC obtained data are noted in chapter 1.
Data was sought from the refiner-wholesalers, independent wholesalers, importers and retailers on wholesale, import and retail transactions, pricing benchmarks and financial performance. Information on the operation and capacity of terminals was sought from terminal owners/operators.
Monitored companies were asked to complete templates which provided standardised data, allowing the ACCC to analyse and compare across companies, and with previous years.
In the petrol industry, as with other industries, different companies use different business models, organisational structures and reporting systems. Even among petrol companies that operate in the same sector, there are differences in the way they operate and report data.
Differences in company reporting structures and accounting systems can complicate comparison of data across companies. While the ACCC has sought to use data templates that as far as possible mirror the companies’ own reporting frameworks, it has been necessary to use standardised data templates to ensure that data collected in the monitoring program is comparable across companies.
The design and conceptual basis of the financial and transactional data templates for 2013–14 were the same as for 2012–13.
Data volatilityThe financial performance of the industry, particularly at the total supply level, is affected by many factors, some of which are particularly volatile.
The most significant factors are the price movements of the industry’s key input (crude oil) and outputs (refined petroleum products). These are globally traded commodities and their prices are subject to considerable volatility. As transactions for these commodities are undertaken in USD, changes in the USD–AUD exchange rate can also affect financial outcomes expressed in AUD. Changes in commodity prices and the exchange rate can also impact on the values of what are sometimes significant inventory holdings.
The effects of changes in the values of inventory holdings and foreign exchange transactions are reflected in the adjusted earnings before interest and tax (EBIT) data. The effects of foreign exchange transactions are reported separately only for the total supply sector—this sector has the greatest exposure to foreign currency fluctuations.
Financial performance can also be affected by one-off events such as impairment charges resulting from asset revaluations; for example, reassessments of the future earnings potential of a refinery. These costs have been reported separately to the ACCC, but as they are not associated with
Monitoring of the Australian petroleum industry December 2014 159

monitored firms’ normal business operations they have been excluded from the calculation of adjusted EBIT.
Time seriesGiven the volatility in financial performance, the ACCC generally presents data from 2002–03 to provide a long-term perspective.
Data for time series longer than three years is presented in real terms (with financial year 2013–14 used as the base year). In chapters 11 and 12 all data used to assess the financial performance of the downstream petroleum industry is in real terms.
Due to structural changes in the industry and changes in the collection instrument, most financial data for the retail sector covers the period from 2005–06 to 2013–14.
ConfidentialityThe information provided to the ACCC is mostly commercially sensitive and has been provided on a confidential basis. To protect confidentiality, this report presents aggregated analysis of costs, revenues and profits.
Financial assessment methodologyData presented in all financial chapters was collected from monitored firms through financial data templates established in consultation with the companies. The templates are comprehensive and collect data on revenues and cost of goods sold by product. Financial data was not collected from the terminal owners/operators.
Key performance indicators for the assessment of the downstream petroleum industry are provided at the end of this appendix at box 1.
Product coverageIn reporting on the prices, costs and profits of unleaded petrol products (RULP, PULP 95, PULP 98 and EBP), the ACCC also considers other products in the Australian downstream petroleum market, specifically diesel, automotive liquefied petroleum gas, oils and lubricants, as well as non-fuel retail sales. Most monitored companies include some or all of these in their operations; hence they are included to provide a more comprehensive analysis of the industry.
Cost allocationOne of the issues in monitoring an industry producing, importing and selling a range of products is that costs cannot necessarily be directly attributed to a particular product or service. Petroleum products are produced jointly as part of a suite of products. The nature of petrol refining is that it is more efficient and economical to employ refinery processes and staff to produce a number of petroleum products as part of the same operations. Similarly, many wholesale and retail costs are common to the supply of both fuel and non-fuel products for retailers, as they are generally sold from the same premises and by the same staff.
The existence of common and joint costs means that costs must be allocated to individual products. As the monitored companies do not generally measure profits by product or service, they do not allocate costs to individual products or services.
The methodology the ACCC has used to allocate common costs in this report is consistent with that used in previous reports. Product volumes have been used as the basis for splitting costs, assuming that costs indirectly associated with refining or selling products tend to be proportional to their volumes. This methodology has been used for the refinery, total supply and wholesale sectors.
160 Monitoring of the Australian petroleum industry December 2014

The allocation of common costs in the retail sector differs slightly due to the existence of convenience store activities. Costs are first allocated on the basis of gross profit on petroleum sales and on convenience sales. Costs estimated for petroleum product activities are then further allocated to individual products on the basis of their respective sales volumes.
While the ACCC has used well accepted cost allocation rules and conventions such as using production volumes, sales volumes and sales values, care should be taken when interpreting data presented in this report as there is no exact way of allocating common costs.
Comparing consolidated and combined sector financial resultsMany of the firms monitored by the ACCC have operations in more than one of the sectors of the downstream petroleum industry. Some companies are integrated through all sectors. Transactions across sectors within integrated companies can potentially distort the consolidated net results for the entire downstream industry. Due to adjustments made for inter-sector transactions by integrated companies, combined financial results by sector may not be comparable with estimates for the consolidated performance of the downstream petroleum industry.
Financial data reported on a historical cost basisFinancial data can be measured and reported either on the basis of historical costs or current (replacement) costs. Historical cost is based on the actual or original cost, while replacement cost is based on the current market price of the product. Depending on the volatility of costs, the basis used can have an impact on financial results. In an environment of price stability, historical and replacement costs are likely to be similar. However, when prices are volatile, there is a divergence in the data produced by historical and replacement cost measures.
The cost of the major input into the production of refined fuel (crude oil) can change significantly between the times of purchase and when it is used to produce refined fuel. Consequently, the use of historical cost at a time of rapidly changing prices means that refining profits are affected by timing considerations.
Replacement cost on the other hand is a popular measure used in the oil industry by firms with refinery operations. This measure excludes the impact of changes in the price of oil and refined products which are seen as external factors impacting profits outside the control of management. By excluding these movements, replacement cost provides a more effective understanding of management performance.
For the ACCC monitoring program, data is collected from companies on a historical cost basis for a number of reasons: not all monitored companies report on a replacement cost basis; historical cost accounting is consistent with Australian and international accounting standards; and historical cost valuation allows the ACCC to compare monitored companies with companies in other industries.
Financial performance by sector
Comparability with other data sources
The assessment of the downstream petroleum industry is based on data included in total company returns for each monitored company and also company returns by sector.
For the purposes of this monitoring program the ACCC segmented the industry into four broad sectors: refinery (a sub-sector of total supply); total supply (i.e. refining, imports and buy-sell transactions); wholesale; and retail. Three of these sectors—refining, wholesaling and retailing—directly align with the Australian and New Zealand Standard Industrial Classification 2006 (ANZSIC06). These classes are: 1701 Petroleum and Coal Product Fuel Manufacturing; 3321 Petroleum Product Wholesaling; and 4000 Fuel Retailing.
Note that direct comparison with Australian Bureau of Statistics industry data may not be possible due to the limited scope of monitored units compared with all Australian firms operating in the downstream petroleum industry, and also due to the allocation of activities to total supply.
Monitoring of the Australian petroleum industry December 2014 161

The total supply sector used by the ACCC to monitor the Australian downstream petroleum industry does not directly align to any ANZSIC06 class.
Coverage
The ACCC collects data from the four Australian refiner-wholesalers and the major importers, so the report has close to comprehensive coverage of the total supply sector.
In the wholesale sector the monitoring program covers the refiner-wholesalers, as well as the major independent wholesalers. There are a large number of other small independent wholesalers from which the ACCC does not collect data; therefore, while coverage is extensive it is not complete.
Similarly, the retail sector includes a large number of small independent operators from which it was not possible to collect data. Therefore, the coverage of this sector is less than complete. Data on this sector was obtained from the four refiner-wholesalers and the large independent retailers. Retail price data for some of the smaller retailers was obtained from Informed Sources and FUELtrac. Retail sales volumes of smaller operators can be estimated from wholesale sales volume data.
Wholesale allocations
The data presented for the Australian wholesale sector includes imports by independent wholesalers. It was not methodologically possible to allocate these imports to the total supply sector as with the refiner-wholesalers’ imports. The revenues and costs associated with these volumes are included in the independents’ wholesale financial data.
The assessment of revenue in the wholesale sector is further complicated by the provision of price support. Price support is a mechanism used by some wholesalers to provide assistance to linked retailers during times of heavy price discounting (normally at the trough of a retail petrol price cycle). Among other things, price support allows the supplier to partly control or influence the setting of prices at certain retail sites. For the purposes of assessing revenues, price support has been deducted from each product’s sales revenue.
Retail sector sample
The ACCC’s monitoring program does not encompass the entire retail sector, due to the very large number of small independent single and multi-site retail site operators. The ACCC has collected data from retail businesses operated by BP and Caltex, major independent wholesalers, supermarkets and the larger specialist retailers. Although the ACCC does not collect data from every retail outlet, it does consider that the scope of the monitoring program is sufficiently wide to capture a significant proportion of retail outlets.
Convenience store net profits
While sales and purchases by type of product in the retail sector can be measured without difficulty, estimating convenience store profits is complicated by the presence of common costs. In order to calculate net profits by product, common costs were allocated through a two-stage process. Firstly, gross profit by convenience store and fuel sales were used to prorate costs between these two broad activities. Secondly, costs were then split by product on the basis of the relative product volumes sold.
162 Monitoring of the Australian petroleum industry December 2014

Key performance indicators for assessing the financial performance of the downstream petroleum industry
Box 1 Key performance indicators
Gross profit: Gross profit is a measure of profit calculated by deducting the costs of goods or services sold from sales revenues.
Gross margin: Gross margin is the ratio of gross profit to sales and indicates how much is left from each dollar of sales after costs of goods sold have been subtracted.
Adjusted EBIT (net profit): EBIT is a common accounting measure of profit and measures the total returns to the firm before interest incomes or expenses and taxes are taken into account. The ACCC uses an adjusted EBIT profit measure. Adjusted EBIT excludes non-operating incomes, amortisation, impairment charges, and profits or losses on sales of fixed assets.
Adjusted EBIT to sales (return on sales): The ratio of adjusted EBIT relative to sales revenue calculates the extent to which profit is earned from each dollar of revenue after deducting all relevant operating costs, other than interest and tax.
Return on adjusted total assets (return on assets): The ratio of adjusted EBIT to total assets calculates the extent to which profit is earned relative to assets used in the business. Total assets have been adjusted to exclude deferred tax assets as they are not relevant to an after-tax profit assessment. Intangibles are excluded since those values have not been consistently provided by the monitored companies, and usually arise from the acquisition of other companies (as opposed to growth solely by increasing sales). It is expressed as a percentage of total assets.
Monitoring of the Australian petroleum industry December 2014 163

Appendix C: Major infrastructure schematics
Figure C.1 New South Wales oil flow schematic
Term
inal
Ref
iner
y
Tran
spor
t Rou
te
Ship
Tra
nspo
rt
Roa
d Tr
ansp
ort
Pipe
line
Lege
nd
Rai
l Tra
nspo
rtD
istri
butio
n Ar
ea(s
)
Ban
ksm
eado
wC
alte
xS
ilver
wat
erC
alte
x/M
obil
New
cast
le(4
)B
P,S
hell,
Cal
tex,
Sto
lthav
en
Dis
tribu
tion
Mul
ti-P
rodu
ctP
ipel
ine
Cal
tex
Dis
tribu
tion
Dis
tribu
tion
Syd
ney
Airp
ort
Gor
eB
ayS
hell
Dis
tribu
tion
SM
PC
alte
x/M
obil
Por
tKem
bla
Par
kP
tyLt
dD
iese
lfro
min
tern
atio
nals
ourc
es
Par
ram
atta
She
ll
Bot
any
Vop
ak
Dis
tribu
tion
Ref
ined
fuel
from
inte
rnat
iona
lsou
rces
Now
raE
than
olP
lant
Man
ildra
Aub
urn
Eth
anol
Dep
otP
ark
Pty
Ltd
Res
tofN
SW
and
inte
rsta
teD
istri
butio
n
Dis
tribu
tion
Dis
tribu
tion
Ref
ined
fuel
from
dom
estic
and
inte
rnat
iona
lsou
rces
Ref
ined
fuel
from
dom
estic
and
inte
rnat
iona
lsou
rces
Dis
tribu
tion
Bio
dies
elK
urne
llC
alte
x
Ref
ined
fuel
from
dom
estic
and
in
tern
atio
nal s
ourc
es(B
P an
d S
tolth
aven
onl
y)
Source: Prepared by the ACCC and RLMS Pty Ltd.
164 Monitoring of the Australian petroleum industry December 2014

Figure C.2 Queensland oil flow schematic
Term
inal
Ref
iner
y
Dis
tribu
tion
Area
Tran
spor
t Rou
te
Oil
Fiel
d
Ship
Tra
nspo
rt
Roa
d Tr
ansp
ort
Pipe
line
Lege
nd
Mou
nt Is
a
Wes
tern
Q
ueen
slan
d
Erom
anga
Min
i-Ref
iner
yIn
land
Oil
Kenm
ore
Nap
tha
Cen
tral Q
ueen
slan
d
Rai
l Tra
nspo
rt
Die
sel
SE
Qld
&N
orth
ern
NS
W
Mul
ti-P
rodu
ctJa
ckso
nP
roce
ssin
gFa
cilit
yS
anto
s
Jack
son
Jack
son
Sou
thN
acco
wla
hW
ilson
Moo
mba
Gat
herin
gan
dP
roce
ssin
gFa
cilit
y
Moo
nie
Bul
wer
Isla
ndR
efin
ery
BP
Lytto
nR
efin
ery
Cal
tex
Whi
nsta
nes
BP
Pin
kenb
aS
hell
Eag
leFa
rmN
eum
ann
Dis
tribu
tion
Dis
tribu
tion
Dis
tribu
tion
Cai
rns
(3)
BP
,She
ll,C
alte
x
Tow
nsvi
lle(2
)C
alte
x/S
hell
&B
P
Mac
kay
(4)
BP
,She
ll,C
alte
x,P
uma
Por
tAlm
aS
tolth
aven
Gla
dsto
ne(2
)C
alte
x&
BP
/She
ll
Bun
dabe
rgS
tolth
aven
(unu
sed)
Dis
tribu
tion
Dis
tribu
tion
Dis
tribu
tion
Dis
tribu
tion
Dis
tribu
tion
QUEENSLAND
SOUTHAUSTRALIA
Bris
bane
Airp
ort
Lytto
nC
alte
x
Cru
deoi
lfro
min
tern
atio
nals
ourc
esR
efin
edfu
elfro
min
tern
atio
nals
ourc
es
Dis
tribu
tion
Ref
ined
fuel
from
inte
rnat
iona
lsou
rces
Die
sel
Moo
nie
Term
inal
San
tos
Ref
ined
fuel
also
from
inte
rnat
iona
lsou
rces
Ref
ined
fuel
also
from
inte
rnat
iona
lsou
rces
Pet
rola
lso
from
inte
rnat
iona
lsou
rces
Pet
rola
lso
from
inte
rnat
iona
lsou
rces
Dal
byE
than
olP
lant
Uni
ted
Sar
ina
Eth
anol
Pla
ntW
ilmar
Dis
tribu
tion
Res
tofQ
ldan
din
ters
tate
Res
tofQ
ldan
din
ters
tate
Dis
tribu
tion
Lytto
n(c
rude
)S
anto
sC
rude
(low
volu
me)
Dis
tribu
tion
Dis
tribu
tion
Inte
rsta
te
Source: Prepared by the ACCC and RLMS Pty Ltd.
Monitoring of the Australian petroleum industry December 2014 165

Figure C.3 Victoria and Tasmania oil flow schematic
Bell
Bay
Uni
ted
Dev
onpo
rtSh
ell
Burn
ieBP
Hob
art (
2)BP
, Cal
tex
TAS
MA
NIA
Term
inal
Ref
iner
y
Tran
spor
t Rou
te
Oil
Fiel
d
Ship
Tra
nspo
rt
Roa
d Tr
ansp
ort
Pipe
line
Lege
nd
Dis
tribu
tion
Dis
tribu
tion
Dis
tribu
tion
Dis
tribu
tion
New
port
Cal
tex
Alto
naR
efin
ery
Mob
il
Yar
ravi
lleM
obil
Long
Isla
ndB
HP
Bill
iton/
Ess
o
Gip
psla
ndB
asin
Oil
Fiel
ds
Gee
long
Ref
iner
yS
hell
WA
GP
ipel
ine
WA
GP
ipel
ine
Long
ford
Pro
cess
ing
Pla
nt
Cru
deoi
lfro
mdo
mes
tican
din
tern
atio
nals
ourc
esR
efin
edfu
elfro
min
tern
atio
nals
ourc
es
Dan
deno
ngW
AG
Pip
elin
e
Has
tings
Uni
ted
Som
erto
n(je
tfue
l)Tu
llam
arin
eA
irpor
t
Dis
tribu
tion
Cru
deoi
lfro
min
tern
atio
nals
ourc
esC
rude
oils
entt
odo
mes
tican
din
tern
atio
nalr
efin
erie
s
Ref
ined
fuel
from
dom
estic
and
inte
rnat
iona
lso
urce
s
Pet
rolf
rom
inte
rnat
iona
lsou
rces
Dis
tribu
tion
Ref
ined
fuel
from
dom
estic
and
inte
rnat
iona
lsou
rces
Pet
rols
enti
nter
stat
e
New
port
She
ll
Dis
tribu
tion
Dis
tribu
tion
Dis
tribu
tion
Pet
rolt
oS
outh
Aus
tralia
(Mob
il)
Bio
dies
el
Source: Prepared by the ACCC and RLMS Pty Ltd.
166 Monitoring of the Australian petroleum industry December 2014

Figure C.4 Western Australia, Northern Territory and South Australia oil flow schematic
Term
inal
Ref
iner
y
Tran
spor
t Rou
te
Oil
Fiel
d
Ship
Tra
nspo
rt
Roa
d Tr
ansp
ort
Pipe
line
Lege
nd
Rai
l Tra
nspo
rt
Kw
inan
aR
efin
ery
BP
Ger
aldt
on(2
)B
P,S
hell
Alb
any
Cal
tex
Esp
eran
ce(2
)B
P,S
hell
Cru
deoi
l
Por
tHed
land
(2)
BP
,Cal
tex
Bro
ome
(2)
BP
,She
ll
Car
narv
onB
asin
Nor
thW
estS
helf
Cru
deoi
lfro
min
tern
atio
nals
ourc
esR
efin
edfu
elfro
min
tern
atio
nals
ourc
es
HM
AS
Stir
ling
Dis
tribu
tion
Dis
tribu
tion
Dis
tribu
tion
Dis
tribu
tion
Kew
dale
BP
Kw
inan
aC
ooge
eC
hem
ical
sP
etro
lfro
mdo
mes
tican
din
tern
atio
nals
ourc
es
Pet
rols
enti
nter
stat
e
Pet
rola
lso
from
inte
rnat
iona
lsou
rces
(She
llon
ly)
Cru
deoi
lsen
tto
dom
estic
and
inte
rnat
iona
lref
iner
ies
Nor
thFr
eman
tleB
PD
istri
butio
n
Per
thA
irpor
t
Dis
tribu
tion
Dis
tribu
tion
Dis
tribu
tion
Mer
eeni
eO
ilFi
elds
Bre
wer
Est
ate
Alic
eS
prin
gs
Dar
win
Vop
akR
efin
edfu
elfro
mdo
mes
tican
din
tern
atio
nals
ourc
es
Gro
ote
Eyl
andt
She
ll
Larg
sN
orth
BP
Birk
enhe
ad(2
)M
obil,
Cal
tex
Por
tLin
coln
(2)
She
ll,C
alte
x
Por
tBon
ytho
nP
roce
ssin
gFa
cilit
y
Coo
perB
asin
Oil
Fiel
ds
Moo
mba
Gat
herin
gan
dP
roce
ssin
gFa
cilit
y
NO
RTH
ER
NTE
RR
ITO
RY
SO
UTH
AU
STR
ALI
A
Cru
deoi
lexp
orte
dan
dse
ntto
dom
estic
refin
erie
s Ref
ined
fuel
from
dom
estic
and
inte
rnat
iona
lsou
rces
From
Que
ensl
and
Dis
tribu
tion
Mer
eeni
eP
roce
ssin
gFa
cilit
y
(Mob
ilon
ly)
Dis
tribu
tion
Dis
tribu
tion
Dis
tribu
tion
Out
erH
arbo
urTe
rmin
als
Pty
Ltd
Dis
tribu
tion
NO
RTH
ERN
TER
RIT
OR
Y &
SO
UTH
AU
STR
ALI
A
WES
TER
N A
UST
RA
LIA
Source: Prepared by the ACCC and RLMS Pty Ltd.
Monitoring of the Australian petroleum industry December 2014 167

Appendix D: Major Australian terminals
Table D.1 Major terminals: New South Wales123
Location Owner(s) Operator User(s) (type of arrangement)
Import access
Banksmeadow (Sydney)
Caltex Caltex Caltex Mobil (minor)
Indirectly through Kurnell terminal or Vopak Botany by pipeline.
Kurnell (Sydney)
Caltex Caltex Caltex Direct from port.
Parramatta (Sydney)
Shell Shell Shell BP (JTA)124
Directly via Gore Bay terminal.
Silverwater (Sydney)
Caltex/Mobil (SMP)125
Mobil Caltex Mobil
Indirectly through Kurnell terminal or Vopak Botany then via pipeline.
Botany (Sydney)
Vopak Vopak BP, Mobil, Shell and independent wholesalers (co-mingled leases)
Direct from Port Botany.
Botany (Sydney)
Terminals Pty Ltd
Terminals Pty Ltd
Independent wholesaler (lease)
Direct from Port Botany. No petrol throughput, primarily diesel.
Newcastle BP BP BP Mobil (minor)
Direct from Port of Newcastle. Indirect through Sydney terminals.
Newcastle Caltex Caltex Caltex Mobil (minor)
Indirect through Sydney terminals.
Newcastle Shell Shell Shell Mobil (JTA)
Indirect through Sydney terminals.
Newcastle Stolthaven Stolthaven New terminal Direct from Port of Newcastle.
Port Kembla Park Pty Ltd Park Pty Ltd Park Pty Ltd Manildra
Direct from Port Kembla.
123 The source for this appendix is ACCC analysis based on data obtained from firms monitored through the ACCC’s monitoring process. Major terminals are defined as terminals which have a pipeline connection to a port and/or refinery.
124 JTA refers to joint terminal arrangement.
125 Sydney Metropolitan Pipeline (SMP) is a Caltex/Mobil (60/40) joint venture which also owns the pipeline from Banksmeadow terminal to Silverwater terminal.
168 Monitoring of the Australian petroleum industry December 2014

Table D.2 Major terminals: Queensland
Location Owner(s) Operator User(s) (type of arrangement)
Import access
Lytton (Brisbane)
Caltex Caltex Caltex Indirect through Lytton refinery.
Pinkenba (Brisbane)
Shell Shell Shell Direct from own port. Indirect through both Brisbane refineries.
Whinstanes (Brisbane)
BP BP BP Mobil (JTA)
Indirect through Bulwer Island refinery. Import by Mobil not allowed under current JTA.
Eagle Farm (Brisbane)
Puma Puma Puma Independent wholesalers (hosted)
Direct from own port. Indirect through both Brisbane refineries.
Bundaberg Stolthaven Stolthaven Unused Direct from port.
Cairns BP BP BP Mobil (hosted)
Direct from port.
Cairns Caltex Caltex Caltex Mobil (minor)
Direct from port.
Cairns Shell Shell Shell Mobil (minor)
Direct from port.
Gladstone BP/Shell BP BP Shell
Direct from port.
Gladstone Caltex Caltex Caltex Mobil
Direct from port.
Mackay BP BP BP Mobil (hosted)
Direct from port.
Mackay Caltex Caltex Caltex Mobil (minor)
Direct from port.
Mackay Shell Shell Shell Direct from port.
Mackay Puma Puma New terminal Direct from port.
Port Alma Stolthaven Stolthaven Independent wholesaler Direct from port.
Townsville BP BP BP Mobil (hosted)
Direct from port.
Townsville Caltex/Shell Shell Caltex, Shell Mobil (minor)
Direct from port.
Monitoring of the Australian petroleum industry December 2014 169

Table D.3 Major terminals: Victoria
Location Owner(s) Operator User(s) (type of arrangement)
Import access
Newport (Melbourne)
Caltex Caltex Caltex Direct from Holden Dock.
Newport (Melbourne)
Shell Shell Shell Caltex (minor)
Direct from Holden Dock.
Yarraville (Melbourne)
Mobil Mobil Mobil BP (JTA) Caltex (minor)
Direct from Holden Dock.
Coode Island (Melbourne)
Terminals Pty Ltd
Terminals Pty Ltd
Third party (lease) Direct from port. No petrol throughput; has ethanol capacity.
Corio (Geelong)
Shell Shell Shell Caltex
Indirect through refinery. Terminal is truck gantry at Geelong refinery.
Hastings United United United Direct from port.
Table D.4 Major terminals: South Australia
Location Owner(s) Operator User(s) (type of arrangement)
Import access
Birkenhead (Adelaide)
Caltex Caltex Caltex Direct from port.
Birkenhead (Adelaide)
Mobil Mobil Mobil Shell (JTA) Caltex (minor)
Direct from port.
Largs North (Adelaide)
BP BP BP Caltex (minor) Mobil (minor)
Direct from port.
Outer Harbour Terminals Pty Ltd
Terminals Pty Ltd
Caltex Direct from port.
Port Lincoln Caltex Caltex Caltex Direct from port.
Port Lincoln Shell Shell Shell Mobil (hosted) BP (minor) (hosted)
Direct from port.
Table D.5 Major terminals: Northern Territory
Location Owner(s) Operator User(s) (type of arrangement)
Import access
Darwin Vopak Vopak BP, Caltex, Shell, Mobil (minor) and independent wholesalers (co-mingled leases)
Direct from Port Darwin.
170 Monitoring of the Australian petroleum industry December 2014
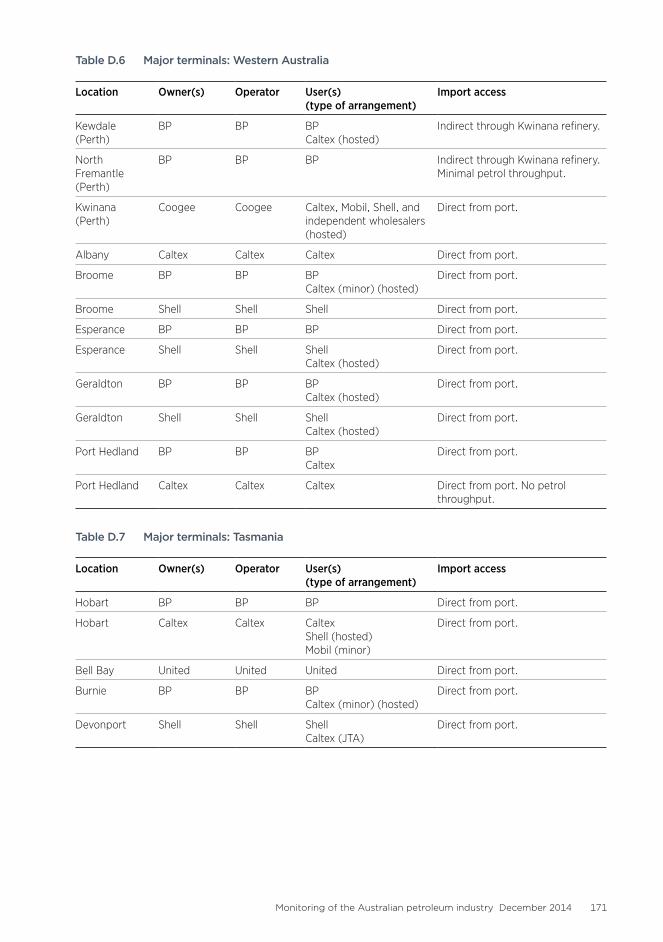
Table D.6 Major terminals: Western Australia
Location Owner(s) Operator User(s) (type of arrangement)
Import access
Kewdale (Perth)
BP BP BP Caltex (hosted)
Indirect through Kwinana refinery.
North Fremantle (Perth)
BP BP BP Indirect through Kwinana refinery. Minimal petrol throughput.
Kwinana (Perth)
Coogee Coogee Caltex, Mobil, Shell, and independent wholesalers (hosted)
Direct from port.
Albany Caltex Caltex Caltex Direct from port.
Broome BP BP BP Caltex (minor) (hosted)
Direct from port.
Broome Shell Shell Shell Direct from port.
Esperance BP BP BP Direct from port.
Esperance Shell Shell Shell Caltex (hosted)
Direct from port.
Geraldton BP BP BP Caltex (hosted)
Direct from port.
Geraldton Shell Shell Shell Caltex (hosted)
Direct from port.
Port Hedland BP BP BP Caltex
Direct from port.
Port Hedland Caltex Caltex Caltex Direct from port. No petrol throughput.
Table D.7 Major terminals: Tasmania
Location Owner(s) Operator User(s) (type of arrangement)
Import access
Hobart BP BP BP Direct from port.
Hobart Caltex Caltex Caltex Shell (hosted) Mobil (minor)
Direct from port.
Bell Bay United United United Direct from port.
Burnie BP BP BP Caltex (minor) (hosted)
Direct from port.
Devonport Shell Shell Shell Caltex (JTA)
Direct from port.
Monitoring of the Australian petroleum industry December 2014 171

Appendix E: Annual retail fuel prices in all monitored locations
The ACCC monitors fuel prices in all capital cities and around 180 regional locations across Australia.
Annual average regular unleaded petrol, diesel, automotive LPG and E10 retail prices in these locations in 2013−14 are shown in table E.1.126
Table E.1 Annual average regular unleaded petrol, diesel, automotive LPG and E10 retail prices in cents per litre: 2013−14
Location RULP Diesel LPG E10
Australian Capital Territory
Canberra 157.4 161.8 85.8 155.6
New South Wales
Sydney 149.8 156.6 81.5 148.4
Albury 152.6 159.2 80.7 151.2
Armidale 160.0 165.6 98.3 158.4
Ballina 160.4 86.7 152.4
Batemans Bay 163.7 92.0 158.8
Bathurst 156.8 160.4 89.9 152.8
Bega 160.4 164.6 100.1
Broken Hill 158.5 164.7 94.8
Bulahdelah 153.9 160.0 154.6
Buronga 156.0 159.9 86.5
Casino 153.4 159.9 96.3 150.5
Central Coast 152.5 159.9 84.4 150.3
Coffs Harbour 157.0 161.9 93.1 153.1
Cooma 160.6 168.0 100.9 158.2
Cootamundra 159.5 162.9 95.4
Cowra 160.7 97.4 152.0
Deniliquin 158.9 162.3 96.8
Dubbo 156.4 161.0 90.9 153.6
Forbes 155.8 160.3 98.9
Forster 157.0 160.4 92.4 155.5
Gilgandra 158.2 162.2 94.3
126 For a price to be included in the table it had to meet a number of quality thresholds: there had to be a price observation on at least 75 per cent of days over the year, with no break in price data of more than 30 consecutive days.
E10 price data is only available for the capital cities and a number of regional locations in New South Wales and Queensland.
The source for all prices in this appendix is ACCC calculations based on Informed Sources data.
172 Monitoring of the Australian petroleum industry December 2014

Location RULP Diesel LPG E10
Glen Innes 157.4 93.3 149.7
Goulburn 155.4 160.8 85.0 153.8
Grafton 154.6 161.0 93.2 151.3
Griffith 158.2 162.3 100.4
Gundagai 153.8 159.1 88.0 153.2
Gunnedah 159.7 161.2 103.4 157.2
Hay 153.0 160.4
Inverell 154.7 160.1 102.1 154.2
Jerilderie 157.0 157.4
Kempsey 155.9 160.5 87.7 151.9
Leeton 156.4 162.3 91.9
Lismore 153.4 160.5 93.0 150.8
Lithgow 158.8 162.8 83.6 154.8
Merimbula 156.9 159.1 96.6
Mittagong 169.3 88.4 155.5
Moama 152.2 157.7 81.0
Moree 158.8 161.4 99.3 154.9
Moruya 160.0 164.4 107.0
Moss Vale 156.1 163.1 81.8 154.9
Mudgee 159.7 166.0 100.8 156.8
Murwillumbah 157.7 162.2 91.1 151.2
Muswellbrook 154.7 161.1 93.4 148.8
Narrabri 160.4 164.4 106.1
Newcastle 155.4 159.4 86.8 152.9
Nowra 161.9 91.2 156.4
Nyngan 107.9
Orange 153.2 161.5 93.6 152.4
Parkes 157.8 162.2 99.1 154.0
Port Macquarie 158.4 164.1 96.4 155.6
Queanbeyan 156.3 159.8 87.5 154.9
Singleton 156.6 160.1 88.1 154.7
Tamworth 157.7 162.2 91.7 153.0
Taree 157.9 160.5 86.0 155.5
Temora 157.4 161.6 96.6
Tumut 164.0 170.1 91.8
Tweed Heads South 152.1 159.0 84.1 149.6
Ulladulla 163.6 96.7 156.0
Wagga Wagga 158.4 161.6 88.9 156.5
Monitoring of the Australian petroleum industry December 2014 173

Location RULP Diesel LPG E10
Wauchope 158.1 163.0 95.3
Wellington 155.7 159.1 92.5
West Wyalong 158.3 160.7 98.6 157.4
Wollongong 154.8 159.2 84.9 150.7
Woolgoolga 156.4 161.2
Yass 157.0 160.5 86.6 152.5
Northern Territory
Darwin 170.4 172.0 114.5
Alice Springs 178.4 179.9 115.2
Katherine 164.2 168.1 123.1
Tennant Creek 182.3 181.4
Queensland
Brisbane 153.5 158.9 84.0 150.8
Atherton 158.1
Ayr 159.1 159.3
Biloela 158.9 161.7
Blackall 165.9 169.9 98.1
Blackwater 157.0 161.1 106.6
Bowen 159.0 159.4 106.8 156.5
Bundaberg 155.8 158.9 96.2 153.1
Cairns 158.8 165.0 104.9
Charters Towers 157.6 161.2 101.4
Childers 156.1 159.7 101.9
Dalby 158.8 161.2 96.4
Emerald 156.4 160.4 96.2
Gladstone 157.9 161.4 99.0
Gold Coast 152.9 159.2 84.7
Goondiwindi 157.2 160.2 91.6
Gympie 153.7 157.0 93.5
Hervey Bay 154.4 158.0 96.1 152.1
Ingham 157.2 160.5 97.8 155.7
Innisfail 158.9 165.2
Ipswich 152.8 157.9 84.3
Kingaroy 156.3 160.5
Longreach 166.5 168.5
Mackay 155.4 162.2 97.9 152.4
Mareeba 157.3 163.9 109.9
Maryborough 154.4 157.9 104.3 152.4
174 Monitoring of the Australian petroleum industry December 2014

Location RULP Diesel LPG E10
Miles 161.7 164.2
Moranbah 163.1 167.4
Mount Isa 161.2 165.7 95.7
Rockhampton 158.1 160.9 98.8 154.5
Roma 156.9 159.0 110.7
Sunshine Coast 152.1 158.0 85.7
Toowoomba 152.0 160.1 85.5 149.9
Townsville 154.9 158.6 93.3 152.2
Tully 158.9 164.4
Warwick 151.0 159.2 94.5 147.7
Whitsunday 153.5 157.6 98.0 150.3
Yeppoon 156.6 158.9 94.6
South Australia
Adelaide 149.7 158.0 85.2 145.9
Bordertown 156.2 159.7 92.6
Ceduna 162.8 164.0 92.6
Clare 152.6 154.1 92.8
Coober Pedy 170.8
Gawler 151.2 159.2 85.6
Kadina 153.5 157.9 93.1
Keith 154.4 157.7 89.6
Loxton 153.8 158.9 93.7
Mt Gambier 153.8 159.4 85.8
Murray Bridge 152.7 160.1 91.2
Naracoorte 153.7 158.7 83.8
Port Augusta 153.9 158.7 86.8
Port Lincoln 159.0 159.9 81.1
Port Pirie 152.6 157.4 93.2
Renmark 152.6 159.2 90.4
Tailem Bend 153.7 159.7 95.5
Victor Harbour 153.1 160.2 85.1
Whyalla 155.6 160.7 86.2
Tasmania
Hobart 161.5 165.8 100.6 159.1
Burnie 161.9 166.0 101.0
Devonport 162.0 165.2 101.1
Huonville 161.9 166.1 102.7
Launceston 162.6 166.5 98.4
Monitoring of the Australian petroleum industry December 2014 175

Location RULP Diesel LPG E10
New Norfolk 163.3 166.2 103.1
Queenstown 164.0 166.4
Smithton 162.3 164.9
Sorell 160.4 164.2 100.9
Ulverstone 161.9 166.0 101.1
Wynyard 164.3 166.4 100.7
Victoria
Melbourne 149.0 155.0 75.8 146.3
Ararat 151.5 156.7 79.3
Bairnsdale 148.3 154.3 78.2
Ballarat 150.4 157.1 77.3
Benalla 156.2 161.3 88.3
Bendigo 148.7 159.8 80.1
Cobram 154.8 157.9 87.5
Colac 155.8 160.7 83.7
Corryong 159.4 164.7
Echuca 152.9 158.9 81.0
Euroa 155.6 157.9 85.9
Geelong 148.4 156.6 76.5
Hamilton 155.3 158.6 84.4
Horsham 155.6 159.2 86.6
Koo Wee Rup 150.8 155.2 78.3
Kyabram 155.8 157.6 82.1
Lakes Entrance 153.0 156.7 87.5
Leongatha 156.6 159.5 86.0
Mildura 155.5 161.0 89.7
Moe 151.8 157.2 83.0
Morwell 153.9 155.9 89.4
Portland 152.2 154.6 87.2
Sale 154.4 157.7 85.8
Seymour 150.5 159.1 80.0
Shepparton 155.2 158.3 81.8
Swan Hill 156.3 161.7 87.1
Traralgon 153.7 157.0 85.6
Wallan 149.8 155.1 76.6
Wangaratta 156.8 159.5 85.5
Warrnambool 150.9 155.9 82.3
Wodonga 153.1 160.1 83.1
Yarrawonga 153.2 159.4 89.1
176 Monitoring of the Australian petroleum industry December 2014

Location RULP Diesel LPG E10
Western Australia
Perth 151.3 160.5 88.3 146.4
Albany 157.2 162.1 105.4
Boulder 156.5 160.5 112.5
Bridgetown 161.6 165.8 112.6
Broome 176.9 176.9 130.0
Bunbury 151.9 159.8 94.2
Busselton 155.0 161.2 103.1
Carnarvon 172.2 175.7 113.3
Collie 156.5 161.9 107.7
Dongara 167.4 167.4 107.6
Esperance 162.4 165.1 125.2
Geraldton 158.6 162.1 106.7
Kalgoorlie 157.3 161.3 110.0
Karratha 168.0 171.3 117.9
Manjimup 160.9 165.2 115.8
Mount Barker 155.4 159.8 104.2
Port Hedland 166.9 168.5 117.1
Waroona 159.2 163.9 109.9
Monitoring of the Australian petroleum industry December 2014 177

Appendix F: E10 price monitoring
This appendix presents information on the ACCC’s E10 price monitoring in the period October 2013 to June 2014.127
E10 is regular unleaded petrol (RULP) which includes up to 10 per cent ethanol. The prices monitored are those for RULP and standard E10. The monitoring therefore excludes premium unleaded petrol that contains ethanol, and E85.
E10 prices are collected from various retail sites in a particular location and compared with the RULP prices at those retail sites. To be included in this analysis retail sites must sell both E10 and RULP.128
Since the 2013 petrol monitoring report, seven regional locations have been added to the monitoring program and five regional locations have dropped out.129 Over the period October 2013 to June 2014 the ACCC received data for all capital cities and 31 regional locations.
Some methodological issues relating to the collection and reporting of this price data are outlined at the end of this appendix.
All locations Table F.1 shows quarterly average differentials between RULP and E10 prices across all of the locations included in the ACCC’s E10 price monitoring program for the period October 2013 to June 2014. It shows that the quarterly average differential was stable at around 2.1 cents per litre over the period.
Table F.1 Quarterly average RULP – E10 differentials: December 2013 to June 2014
December 2013cpl
March 2014cpl
June 2014cpl
2.1 2.1 2.0
Specific locationsTable F.2 shows quarterly average RULP and E10 prices and the differential for each capital city and regional location across Australia included in the monitoring program in the period October 2013 to June 2014. For a location to be included in the table, price data over the full quarter had to be available.130 The table includes seven capital cities and 29 regional locations (16 in New South Wales and 13 in Queensland).
127 E10 price monitoring reports for the December 2006 quarter and the March, June and September 2007 quarters are available from the ACCC website at: http://www.accc.gov.au/publications/ethanol-pricing-quarterly-reports. Data from October 2007 to September 2013 can be found in past ACCC petrol monitoring reports.
The source for all data in this appendix is ACCC and Informed Sources. Note that some figures in the tables may not add exactly due to rounding. Where data is not available it is identified in the table as ‘n/a’.
128 This is different from the RULP-E10 differential in chapter 10, which compares market average RULP prices with market average E10 prices.
129 These are identified in the methodological section at the end of this appendix.
130 Locations not included in the table because price data for a full quarter was not available were: Darwin, Coffs Harbour and Inverell.
178 Monitoring of the Australian petroleum industry December 2014

Table F.2 Quarterly average RULP and E10 prices and the differential: December 2013 to June 2014
Location QuarterRULP
cplE10 cpl
Differential cpl
Sydney Dec-13 147.0 144.7 2.3
Mar-14 152.1 149.9 2.2
Jun-14 149.7 147.5 2.2
Melbourne Dec-13 145.3 143.1 2.2
Mar-14 151.8 149.4 2.4
Jun-14 148.1 145.8 2.3
Brisbane Dec-13 149.9 147.8 2.1
Mar-14 157.0 154.7 2.3
Jun-14 152.7 150.4 2.3
Adelaide Dec-13 145.5 143.1 2.4
Mar-14 151.7 149.4 2.3
Jun-14 147.7 145.5 2.2
Perth Dec-13 144.7 142.7 2.0
Mar-14 151.4 149.4 2.0
Jun-14 149.9 147.9 2.0
Canberra Dec-13 157.3 155.5 1.8
Mar-14 158.3 156.5 1.8
Jun-14 157.5 155.8 1.7
Hobart Dec-13 160.8 159.8 1.0
Mar-14 160.1 159.1 1.0
Jun-14 159.5 158.5 1.0
New South Wales regional locations
Albury Dec-13 152.1 150.6 1.5
Mar-14 154.1 152.6 1.5
Jun-14 153.9 152.4 1.5
Casino Dec-13 153.3 151.3 2.0
Mar-14 152.1 150.0 2.1
Jun-14 151.9 149.9 2.0
Central Coast Dec-13 151.2 148.7 2.5
Mar-14 152.9 150.7 2.2
Jun-14 153.8 151.7 2.1
Clarence Valley Dec-13 n/a n/a n/a
Mar-14 154.7 152.4 2.3
Jun-14 150.5 148.3 2.2
Goulburn Dec-13 155.9 154.1 1.8
Mar-14 155.9 154.1 1.8
Jun-14 154.9 153.1 1.8
Monitoring of the Australian petroleum industry December 2014 179

Location QuarterRULP
cplE10 cpl
Differential cpl
Moree Dec-13 155.6 153.0 2.6
Mar-14 158.0 155.5 2.5
Jun-14 n/a n/a n/a
Moss Vale Dec-13 154.4 152.9 1.5
Mar-14 159.6 158.1 1.5
Jun-14 152.3 150.8 1.5
Newcastle Dec-13 153.4 150.5 2.9
Mar-14 154.5 151.5 3.0
Jun-14 158.3 155.5 2.8
Nowra Dec-13 n/a n/a n/a
Mar-14 159.9 157.9 2.0
Jun-14 159.9 157.9 2.0
Orange Dec-13 154.7 152.3 2.4
Mar-14 154.3 152.4 1.9
Jun-14 153.7 151.9 1.8
Port Macquarie Dec-13 157.9 155.4 2.5
Mar-14 156.9 154.4 2.5
Jun-14 156.2 153.8 2.4
Tamworth Dec-13 155.7 152.1 3.6
Mar-14 n/a n/a n/a
Jun-14 n/a n/a n/a
Taree Dec-13 158.5 156.5 2.0
Mar-14 159.1 157.1 2.0
Jun-14 158.5 156.5 2.0
Tweed Heads South Dec-13 148.2 146.4 1.8
Mar-14 157.2 155.5 1.7
Jun-14 154.0 152.2 1.8
Wollondilly Dec-13 n/a n/a n/a
Mar-14 157.9 155.6 2.3
Jun-14 152.8 150.5 2.3
Wollongong Dec-13 152.6 150.6 2.0
Mar-14 154.8 152.6 2.2
Jun-14 152.9 150.8 2.1
180 Monitoring of the Australian petroleum industry December 2014

Location QuarterRULP
cplE10 cpl
Differential cpl
Queensland regional locations
Bowen Dec-13 158.2 155.7 2.5
Mar-14 159.9 157.5 2.4
Jun-14 160.0 157.5 2.5
Bundaberg Dec-13 155.1 152.5 2.6
Mar-14 155.9 153.6 2.3
Jun-14 155.6 153.2 2.4
Gold Coast Dec-13 n/a n/a n/a
Mar-14 156.2 154.2 2.0
Jun-14 151.3 149.3 2.0
Gympie Dec-13 n/a n/a n/a
Mar-14 151.1 149.1 2.0
Jun-14 151.2 149.2 2.0
Ingham Dec-13 156.9 154.9 2.0
Mar-14 159.8 157.8 2.0
Jun-14 159.0 157.0 2.0
Ipswich Dec-13 n/a n/a n/a
Mar-14 155.6 153.4 2.2
Jun-14 152.1 150.2 1.9
Maryborough Dec-13 151.5 150.0 1.5
Mar-14 154.4 152.9 1.5
Jun-14 153.9 152.4 1.5
Rockhampton Dec-13 157.2 155.2 2.0
Mar-14 157.7 155.7 2.0
Jun-14 155.8 153.8 2.0
Sunshine Coast Dec-13 n/a n/a n/a
Mar-14 154.2 152.1 2.1
Jun-14 148.9 146.5 2.4
Toowoomba Dec-13 150.1 148.3 1.8
Mar-14 151.7 149.8 1.9
Jun-14 150.9 149.0 1.9
Townsville Dec-13 154.7 152.2 2.5
Mar-14 155.0 152.3 2.7
Jun-14 154.7 152.0 2.7
Warwick Dec-13 149.6 147.6 2.0
Mar-14 150.9 148.9 2.0
Jun-14 149.3 147.3 2.0
Whitsunday Dec-13 153.5 152.0 1.5
Mar-14 154.8 153.2 1.6
Jun-14 154.1 152.4 1.7
Monitoring of the Australian petroleum industry December 2014 181

Methodology
Coverage
In 2013–14 the ACCC obtained petrol price data from Informed Sources. Informed Sources collects E10 price data from all states and territories. As at June 2014 Informed Sources collected E10 prices from around 1300 retail sites across Australia. Of this total, around 45 per cent of these sites are included in the locations covered in this appendix.
The number of locations included in the E10 monitoring program in 2013–14 increased by two locations from last year to 39 locations:
• Regional locations which were included in last year’s E10 monitoring program but which subsequently dropped out are: Ayr, Cairns, Childers, Hervey Bay and Home Hill in Queensland.
• Regional locations which were added in 2013–14 are: Clarence Valley, Coffs Harbour, and Nowra in NSW, and Gold Coast, Ipswich, Sunshine Coast and Wollondilly in Queensland.
Data collection
Informed Sources obtains daily average E10 and RULP prices for the locations included in this appendix. To be included in this analysis retail sites must sell both E10 and RULP.
The daily E10 price for these locations is the average price at retail sites selling E10 that are monitored by Informed Sources. The daily RULP price is the average price at those retail sites. Therefore, the average RULP price for a particular location included in this report may be different from the overall average RULP price in that location.
To ensure the robustness of the price data:
• Locations were only included in the tables where Informed Sources obtained daily E10 prices from two or more retail sites in that location.
• Data from some locations has been excluded where there were concerns about the robustness and accuracy of either the E10 or RULP prices.
182 Monitoring of the Australian petroleum industry December 2014

www.accc.gov.au
Mo
nito
ring
of th
e A
ustra
lian
pe
trole
um
ind
ustry: R
ep
ort o
f the A
CC
C in
to th
e p
rices, c
osts a
nd
pro
fits of u
nle
ad
ed
petro
l in A
ustra
lia D
ec
em
be
r 20
14