monitoring saccharomyces cerevisiea growth with ... onix_yeast... · monitoring saccharomyces...
TRANSCRIPT
Monitoring Saccharomyces cerevisiea Growth with Brightfield Microscopy in Real TimeUsing the Lionheart™ FX and the ONIX 2 system to Image and Analyze Yeast Cell Growth
A p p l i c a t i o n N o t e
Automation & Liquid Handling, Cell Imaging, Cell-based Assays
BioTek Instruments, Inc.P.O. Box 998, Highland Park, Winooski, Vermont 05404-0998 USAPhone: 888-451-5171 Outside the USA: 802-655-4740 Email: [email protected] www.biotek.comCopyright © 2016
Paul Held Ph.D, Laboratory Manager, BioTek Instruments, Inc., Winooski, VT USA
Key Words:
Perfusion
Yeast
Kinetic Growth
Kinetic Imaging
Yeast Cell
Strains of the yeast Saccharomyces cerevisiea serve critical roles in the production of many different products including food staples, medicines, and biofuels. Optimiza-tion of these processes often involve the development of strains that are capable of growth under a wide variety of environmental conditions. The ability to obtain the de-sired product reliably and repeatedly requires careful monitoring of not only the input materials, but the growth of the yeast strain during the process. Likewise the develop-ment of new strains often requires monitoring the growth of strains under various con-ditions. Here we describe the use of the Lionheart™ FX Automated Live Cell Imager and the ONIX2 Microfluidic Platform to monitor yeast cell growth through the analy-sis of kinetic brightfield images of yeast cells under a variety of conditions in real time.
Figure 2. Typical Yeast Growth Curve. Saccharomyces cerevisiea suspensions grown in YPD media at 30 °C for 12 hours with data measurements every 2 minutes using a Synergy H1 Microplate Reader.
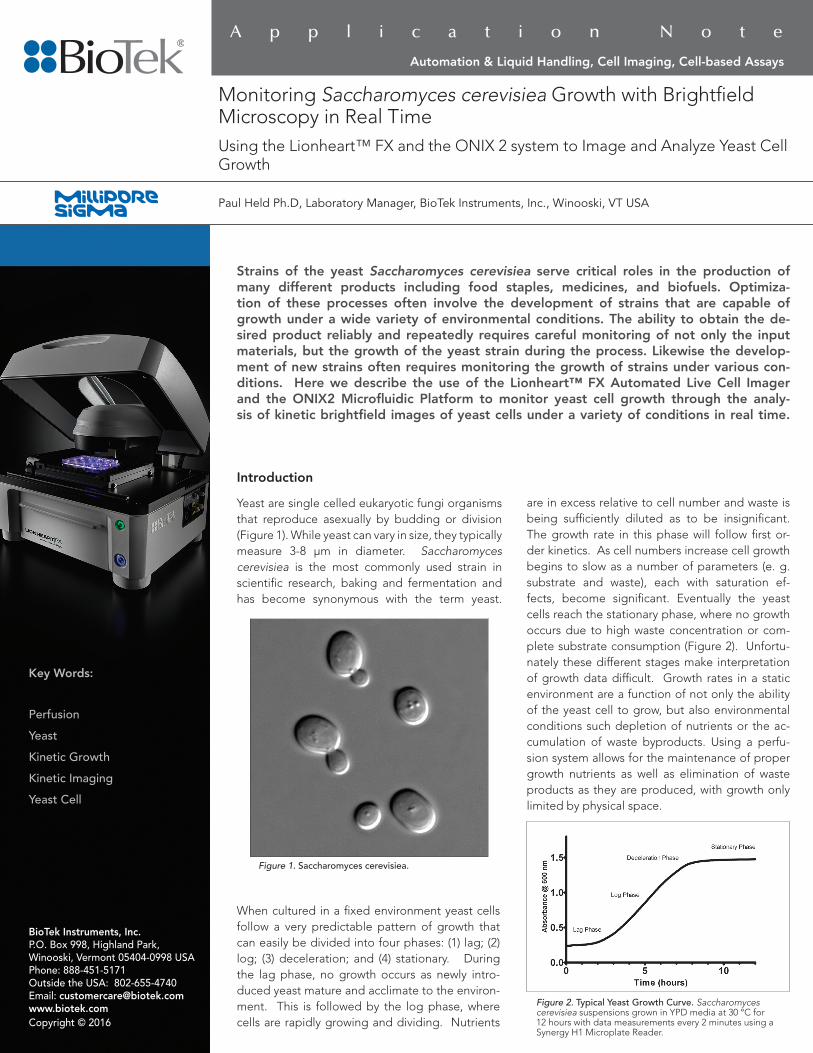
Figure 1. Saccharomyces cerevisiea.
When cultured in a fixed environment yeast cells follow a very predictable pattern of growth that can easily be divided into four phases: (1) lag; (2) log; (3) deceleration; and (4) stationary. During the lag phase, no growth occurs as newly intro-duced yeast mature and acclimate to the environ-ment. This is followed by the log phase, where cells are rapidly growing and dividing. Nutrients
Introduction
Yeast are single celled eukaryotic fungi organisms that reproduce asexually by budding or division (Figure 1). While yeast can vary in size, they typically measure 3-8 µm in diameter. Saccharomyces cerevisiea is the most commonly used strain in scientific research, baking and fermentation and has become synonymous with the term yeast.
are in excess relative to cell number and waste is being sufficiently diluted as to be insignificant. The growth rate in this phase will follow first or-der kinetics. As cell numbers increase cell growth begins to slow as a number of parameters (e. g. substrate and waste), each with saturation ef-fects, become significant. Eventually the yeast cells reach the stationary phase, where no growth occurs due to high waste concentration or com-plete substrate consumption (Figure 2). Unfortu-nately these different stages make interpretation of growth data difficult. Growth rates in a static environment are a function of not only the ability of the yeast cell to grow, but also environmental conditions such depletion of nutrients or the ac-cumulation of waste byproducts. Using a perfu-sion system allows for the maintenance of proper growth nutrients as well as elimination of waste products as they are produced, with growth only limited by physical space.
2
Application Note Automation & Liquid Handling, Cell Imaging, Cell-based Assays
Yeast growth experiments are often performed in microplates using light scatter vertical photometry, which allows for a large number of different experimental conditions to be tested rapidly. This format, which makes indirect measurements of cell number, can suffer when cell yeast cell suspensions flocculate and can no longer remain suspended, forming opaque clumps on the bottom of the well. This phenomenon results in aberrantly high absorbance levels, making analysis difficult if not impossible. Because this technique uses light scatter rather than true absorbance, measurements made with different optics (i.e. different reader types) will result in different values. Likewise, comparison of different yeast strains, with different sizes, can often be problematic as cell size has a substantial influence on light scatter.
CellASIC™ ONIX Plate
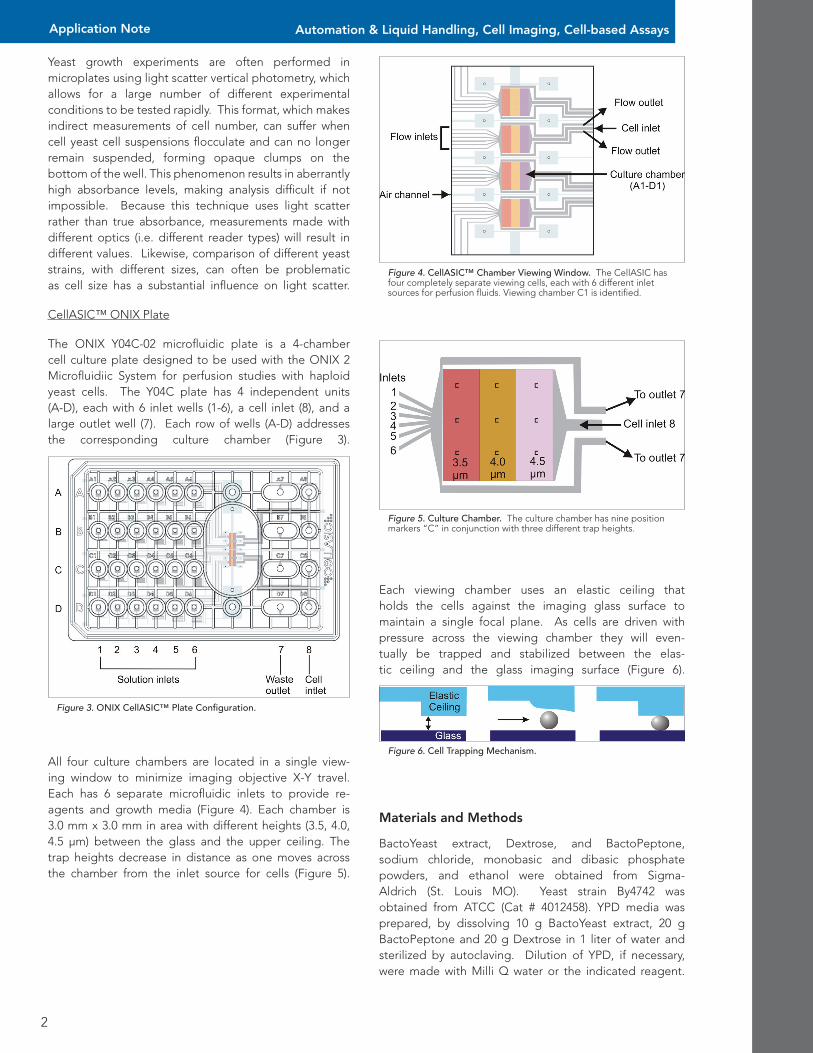
The ONIX Y04C-02 microfluidic plate is a 4-chamber cell culture plate designed to be used with the ONIX 2 Microfluidiic System for perfusion studies with haploid yeast cells. The Y04C plate has 4 independent units (A-D), each with 6 inlet wells (1-6), a cell inlet (8), and a large outlet well (7). Each row of wells (A-D) addresses the corresponding culture chamber (Figure 3).
Figure 3. ONIX CellASIC™ Plate Configuration.
All four culture chambers are located in a single view-ing window to minimize imaging objective X-Y travel. Each has 6 separate microfluidic inlets to provide re-agents and growth media (Figure 4). Each chamber is 3.0 mm x 3.0 mm in area with different heights (3.5, 4.0, 4.5 µm) between the glass and the upper ceiling. The trap heights decrease in distance as one moves across the chamber from the inlet source for cells (Figure 5).
Figure 4. CellASIC™ Chamber Viewing Window. The CellASIC has four completely separate viewing cells, each with 6 different inlet sources for perfusion fluids. Viewing chamber C1 is identified.
Figure 5. Culture Chamber. The culture chamber has nine position markers “C” in conjunction with three different trap heights.
Figure 6. Cell Trapping Mechanism.
Materials and Methods
BactoYeast extract, Dextrose, and BactoPeptone, sodium chloride, monobasic and dibasic phosphate powders, and ethanol were obtained from Sigma-Aldrich (St. Louis MO). Yeast strain By4742 was obtained from ATCC (Cat # 4012458). YPD media was prepared, by dissolving 10 g BactoYeast extract, 20 g BactoPeptone and 20 g Dextrose in 1 liter of water and sterilized by autoclaving. Dilution of YPD, if necessary, were made with Milli Q water or the indicated reagent.
Each viewing chamber uses an elastic ceiling that holds the cells against the imaging glass surface to maintain a single focal plane. As cells are driven with pressure across the viewing chamber they will even-tually be trapped and stabilized between the elas-tic ceiling and the glass imaging surface (Figure 6).
3
Application Note
Salt Sensitivity
Ionic strength of the growth media is a concern when yeast cells are propagated in mixtures not consisting of formulated nutrients diluted with deionized or distilled water. For example, remediation of contaminated water or the fermentation of cellulosic digests can be variable and possibly contain large amounts of ions.
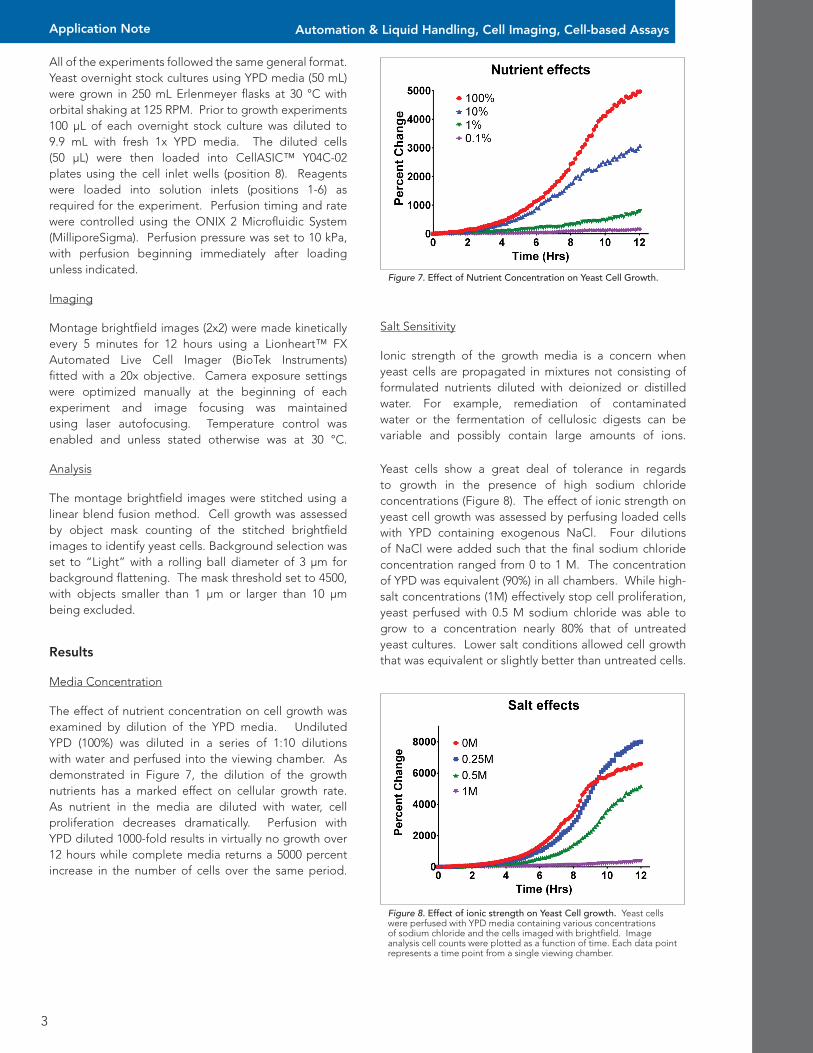
Yeast cells show a great deal of tolerance in regards to growth in the presence of high sodium chloride concentrations (Figure 8). The effect of ionic strength on yeast cell growth was assessed by perfusing loaded cells with YPD containing exogenous NaCl. Four dilutions of NaCl were added such that the final sodium chloride concentration ranged from 0 to 1 M. The concentration of YPD was equivalent (90%) in all chambers. While high-salt concentrations (1M) effectively stop cell proliferation, yeast perfused with 0.5 M sodium chloride was able to grow to a concentration nearly 80% that of untreated yeast cultures. Lower salt conditions allowed cell growth that was equivalent or slightly better than untreated cells.
Automation & Liquid Handling, Cell Imaging, Cell-based Assays
Figure 7. Effect of Nutrient Concentration on Yeast Cell Growth.
All of the experiments followed the same general format. Yeast overnight stock cultures using YPD media (50 mL) were grown in 250 mL Erlenmeyer flasks at 30 °C with orbital shaking at 125 RPM. Prior to growth experiments 100 µL of each overnight stock culture was diluted to 9.9 mL with fresh 1x YPD media. The diluted cells (50 µL) were then loaded into CellASIC™ Y04C-02 plates using the cell inlet wells (position 8). Reagents were loaded into solution inlets (positions 1-6) as required for the experiment. Perfusion timing and rate were controlled using the ONIX 2 Microfluidic System (MilliporeSigma). Perfusion pressure was set to 10 kPa, with perfusion beginning immediately after loading unless indicated.
Imaging
Montage brightfield images (2x2) were made kinetically every 5 minutes for 12 hours using a Lionheart™ FX Automated Live Cell Imager (BioTek Instruments) fitted with a 20x objective. Camera exposure settings were optimized manually at the beginning of each experiment and image focusing was maintained using laser autofocusing. Temperature control was enabled and unless stated otherwise was at 30 °C.
Analysis
The montage brightfield images were stitched using a linear blend fusion method. Cell growth was assessed by object mask counting of the stitched brightfield images to identify yeast cells. Background selection was set to “Light” with a rolling ball diameter of 3 µm for background flattening. The mask threshold set to 4500, with objects smaller than 1 µm or larger than 10 µm being excluded.
Results
Media Concentration
The effect of nutrient concentration on cell growth was examined by dilution of the YPD media. Undiluted YPD (100%) was diluted in a series of 1:10 dilutions with water and perfused into the viewing chamber. As demonstrated in Figure 7, the dilution of the growth nutrients has a marked effect on cellular growth rate. As nutrient in the media are diluted with water, cell proliferation decreases dramatically. Perfusion with YPD diluted 1000-fold results in virtually no growth over 12 hours while complete media returns a 5000 percent increase in the number of cells over the same period.
Figure 8. Effect of ionic strength on Yeast Cell growth. Yeast cells were perfused with YPD media containing various concentrations of sodium chloride and the cells imaged with brightfield. Image analysis cell counts were plotted as a function of time. Each data point represents a time point from a single viewing chamber.
4
Application Note Automation & Liquid Handling, Cell Imaging, Cell-based Assays
pH Sensitivity
In order to test the effect of pH on yeast cell growth cultures of Saccharomyces cerevisiea were perfused with YPD supplemented with 20 mM phosphate at pH ranging from 4.5 to 9.5. In all cultures YPD comprised 80% of the mixture and the phosphate buffer the remaining 20% by volume.
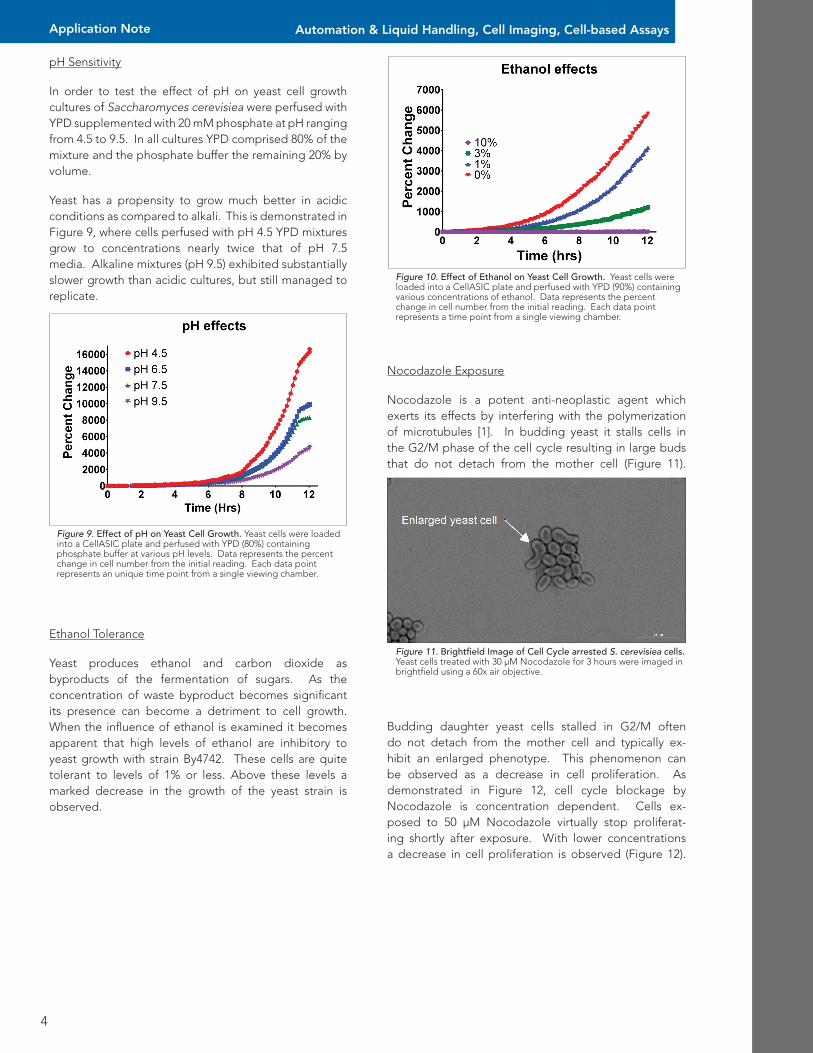
Yeast has a propensity to grow much better in acidic conditions as compared to alkali. This is demonstrated in Figure 9, where cells perfused with pH 4.5 YPD mixtures grow to concentrations nearly twice that of pH 7.5 media. Alkaline mixtures (pH 9.5) exhibited substantially slower growth than acidic cultures, but still managed to replicate.
Figure 9. Effect of pH on Yeast Cell Growth. Yeast cells were loaded into a CellASIC plate and perfused with YPD (80%) containing phosphate buffer at various pH levels. Data represents the percent change in cell number from the initial reading. Each data point represents an unique time point from a single viewing chamber.
Ethanol Tolerance
Yeast produces ethanol and carbon dioxide as byproducts of the fermentation of sugars. As the concentration of waste byproduct becomes significant its presence can become a detriment to cell growth. When the influence of ethanol is examined it becomes apparent that high levels of ethanol are inhibitory to yeast growth with strain By4742. These cells are quite tolerant to levels of 1% or less. Above these levels a marked decrease in the growth of the yeast strain is observed.
Figure 10. Effect of Ethanol on Yeast Cell Growth. Yeast cells were loaded into a CellASIC plate and perfused with YPD (90%) containing various concentrations of ethanol. Data represents the percent change in cell number from the initial reading. Each data point represents a time point from a single viewing chamber.
Nocodazole Exposure
Nocodazole is a potent anti-neoplastic agent which exerts its effects by interfering with the polymerization of microtubules [1]. In budding yeast it stalls cells in the G2/M phase of the cell cycle resulting in large buds that do not detach from the mother cell (Figure 11).
Figure 11. Brightfield Image of Cell Cycle arrested S. cerevisiea cells. Yeast cells treated with 30 µM Nocodazole for 3 hours were imaged in brightfield using a 60x air objective.
Budding daughter yeast cells stalled in G2/M often do not detach from the mother cell and typically ex-hibit an enlarged phenotype. This phenomenon can be observed as a decrease in cell proliferation. As demonstrated in Figure 12, cell cycle blockage by Nocodazole is concentration dependent. Cells ex-posed to 50 µM Nocodazole virtually stop proliferat-ing shortly after exposure. With lower concentrations a decrease in cell proliferation is observed (Figure 12).

5
Application Note
AN071916_18, Rev. 07/19/16
Automation & Liquid Handling, Cell Imaging, Cell-based Assays
The effectiveness of perfusion is demonstrated in Figure 13. Yeast cells seeded into the CellASIC plate and perfused with YPD media increase in number through cell budding. Shortly after the initiation of perfusion with 50 µM Nocodazole, cultures stop dividing and cell number no longer increases. Cultures seeded at the same time, but not treated continue budding and cell numbers rapidly increase.
Figure 12. Kinetic growth curves of yeast cells perfused with Nocodazole. Yeast were loaded into the CellASIC plate and immediately perfused with YPD media. After 3 yours the perfusion mixture was changed tom include various concentrations of Nocodazole in YPD. The initiation of Nocodazole perfusion is indicated by the arrow. Data points reflect the percent change for the initial cell count for a single viewing chamber.
Figure 13. Comparison of cell counts of S. cerevisiea perfused with either 0 µM or 50 µM Nocodazole. Yeast cells were loaded onto CellASIC plates and allowed to grow with YPD media perfusion. After 3 hours the perfusion mixture was changed to YPD containing either 0 µM or 50 µM Nocodazole. Data reflects the kinetic cell counts from separate cells.
Discussion
These data demonstrate the ability of the Lionheart ™ FX Automated Live Cell Imager in conjunc-tion with the ONIX 2 Microfluidic Platform to quantitate yeast growth by cell counting. The CellASIC Y04C plate uses different size traps to immobilize mother cells for repeated imaging. Brightfield imaging followed by digi-tal image analysis allows for cell quantitation in real time.
Perfusion of cultures provides a means to not only add fresh nutrients, but to also remove waste prod-ucts. A case in point is the production of ethanol by formation. This waste product can build up to levels that will effectively eliminate growth independent of the availability of nutrients. The removal of this by-product by a continuous flow system can conceivably prevent the stationary phase resulting from byprod-uct buildup. In the context of strain development, this would bypass the need to develop ethanol resistance.
In a general sense, the use of perfusion allows for un-abated growth resulting in the almost complete elimina-tion of the stationary phase observed with static experi-ments where nutrients are not added and wastes are not continually removed. When the viewing region chamber is completely filled, cell counts begin to level off as cell growth pushes cells out of the imaging area. Imaging us-ing larger montages can be used to lengthen the experi-mental window.
These data demonstrate both environmental, as well as drug induced changes in yeast cell growth can be monitored using the Lionheart FX in conjunction with the ONIX 2 Microfluidic Platform. Note that the data is actual cell number rather than an indirect measurement based on light scatter. These experiments used lengthy kinetic runs to analyze the capability of the yeast strains. An im-portant point to note is that despite markedly different growth rates, some of the different culture conditions re-sulted in the same final cell density. This is a finding that an end point determination at the end of a long incuba-tion would have missed. The data analysis was simplified by the ability of Gen5™ Microplate Reader and Imager Software to automatically count yeast cells in real time.
References
1. Vasquez, R.J. B. Howell, A.M. Yvon, P. Wadsworth, and L. Cassimeris (1997) Nanomolar Concentrations of Nocodazole alter Microtubule Dynamic Instability in vivo and in vitro, Mol Biol, Cell 8(6):973-985. PMCID: PMC305707