monitoring survey of caffeine in surface waters (lis river
TRANSCRIPT
Monitoring survey of caffeine in surface waters (Lis River)and wastewaters located at Leiria Town in Portugal
Paula Paíga1 & Sandra Ramos2 & Sandra Jorge3& Jaime Gabriel Silva4,5 & Cristina Delerue-Matos1
AbstractInvestigation during 11-month period was performed to study the presence of caffeine in the Lis River in Leiria Town in Portugal,and a monitoring during 9-month period was realized to check the contribution of the human pollution of two wastewatertreatment plants (WWTPs) that discharge their effluents to the studied river. The samples were collected in five sampling pointsalong the river and in two influents and two effluents of the studied WWTPs. Caffeine was detected in all ninety-one collectedsamples. The caffeine concentration ranged from 25.3 to 321 ng/L in the river samples, from 112 to 1927 ng/L in the WWTPeffluents, and from 9478 to 83,901 ng/L in the WWTP influents. The highest concentration in the river was detected in the twosampling points located after the effluent discharge points and reached 315 and 321 ng/L. Risk assessment was performed forthree trophic levels using the risk quotient calculation and revealed that caffeine do not cause toxic effect onDaphnia magna andon fish but could be possibly toxic to algae. The results proved that caffeine can be an effective indicator of human-born pollution.
Keywords Caffeine . Liquid chromatography .Mass spectrometry .Monitoring study . Risk assessment
IntroductionMillions of people all around the world consume daily prod-ucts containing caffeine. This compound can be commonlyfound in food and many beverages such as coffee, chocolate,tea, soft drinks, cakes, and cookies (Edwards et al. 2015;Peteffi et al. 2018) as well as in some medications like painrelievers, diet pills, and anti-cold and anti-allergy pharmaceu-ticals (Mahoney et al. 2019). The main caffeine pollutionsources are disposal of unconsumed caffeine-containing bev-erages, and activities such as washing of dirty coffee cups(Seiler et al. 1999). Direct consumption does not contributemuch as the human body can metabolize caffeine quite effi-ciently and only up to 10% is excreted unchangeably in urine(Ferreira 2005). The elimination of caffeine in wastewatertreatment plants (WWTPs) strongly depends on the treatmentmethods (Benotti and Brownawell 2007; Boisvert et al. 2012;Buerge et al. 2003; Siegener and Chen 2002; Yang et al. 2017)and can get below 10% using primary treatment (Boisvert etal. 2012).
Anthropogenic chemical markers have received a consid-erable attention in recent years as potential alternatives toidentify pollution sources correlated with human activities(Kurissery et al. 2012). The quality of water can be assessedbymicrobiological tests (Escherichia coli); however, these aretime-consuming and cannot indicate the origin of the contam-inants (Hillebrand et al. 2012). Caffeine has a big potential inthis field. In a study conducted in 40 sampling sites across theUSA, 110 human-specific chemicals were evaluated and
* Cristina [email protected]
1 REQUIMTE/LAQV, Instituto Superior de Engenharia do Porto,Politécnico do Porto, Rua Dr. António Bernardino de Almeida, 431,4200-072 Porto, Portugal
2 CEAUL, Universidade de Lisboa, Portugal and LEMA, InstitutoSuperior de Engenharia do Porto, Instituto Politécnico do Porto, RuaDr. António Bernardino de Almeida, 431, 4200-072 Porto, Portugal
3 Águas do Centro Litoral, SA, Grupo Águas de Portugal, ETA daBoavista, Avenida Dr. Luís Albuquerque,3030-410 Coimbra, Portugal
4 Águas de Santo André, Cerca da Água, Rua dos Cravos,7500-130 Vila Nova de Santo André, Portugal
5 Departamento de Engenharia Civil, Instituto Superior de Engenhariado Porto, Instituto Politécnico do Porto, Porto, Portugal
caffeine, carbamazepine, and diphenhydramine were used ashuman fecal indicators (Glassmeyer et al. 2005). Caffeine wasalso used as a domestic sewage indicator in Asahikawa RiverBasin, Japan (Kiguchi et al. 2016).
The European Union adopted a “Watch List” of potentialpriority substances including pesticides, pharmaceuticals, andpersonal care products. Monitoring studies are important toconfirm the pollution, identify its main sources, estimate thecontamination levels, and review the priority substances in the“Watch List.” Such activities should be applied especially inriver monitoring as they are the main water supplies for do-mestic uses, for many industry types, and for irrigation inagriculture. It is then essential to prevent and control theirpollution to maintain good water quality and safety.
The first objective of the conducted study was to assess themagnitude of human pollution in the Lis River that has beensubjected to continuous pollution by the effluents dischargedfromWWTPs and by illegal discharges of untreated wastewa-ters (Vieira et al. 2012). The second objective was to correlatethe contamination levels with the weather influence (precipi-tation), the WWTP localizations, and the effluent and influentloadings; and assess the removal efficiency. The third objec-tive was to evaluate toxicological effect on aquatic organismson three trophic levels (Daphnia magna, algae, and fish). Theaims were achieved by monitoring caffeine concentration inseveral points along the river course and in two WWTPs.
Materials and methods
Site description
Leiria is a city and a municipality in the Centro Region ofPortugal (Fig. 1). It is crossed by 39.5 km long Lis River(Vieira et al. 2012). The river is an important inland waterresource for domestic, industrial, and irrigation purposes inthe region (LeiriaMunicipality n.d.). For this reason, it is im-portant to prevent and control its water pollution (Akcay et al.2003). Continuous illegal discharges of wastewater are still ununfinished chapter in the Lis River history, and many diffusesources keep polluting water lines, contaminating water re-sources, and destroying biodiversity.
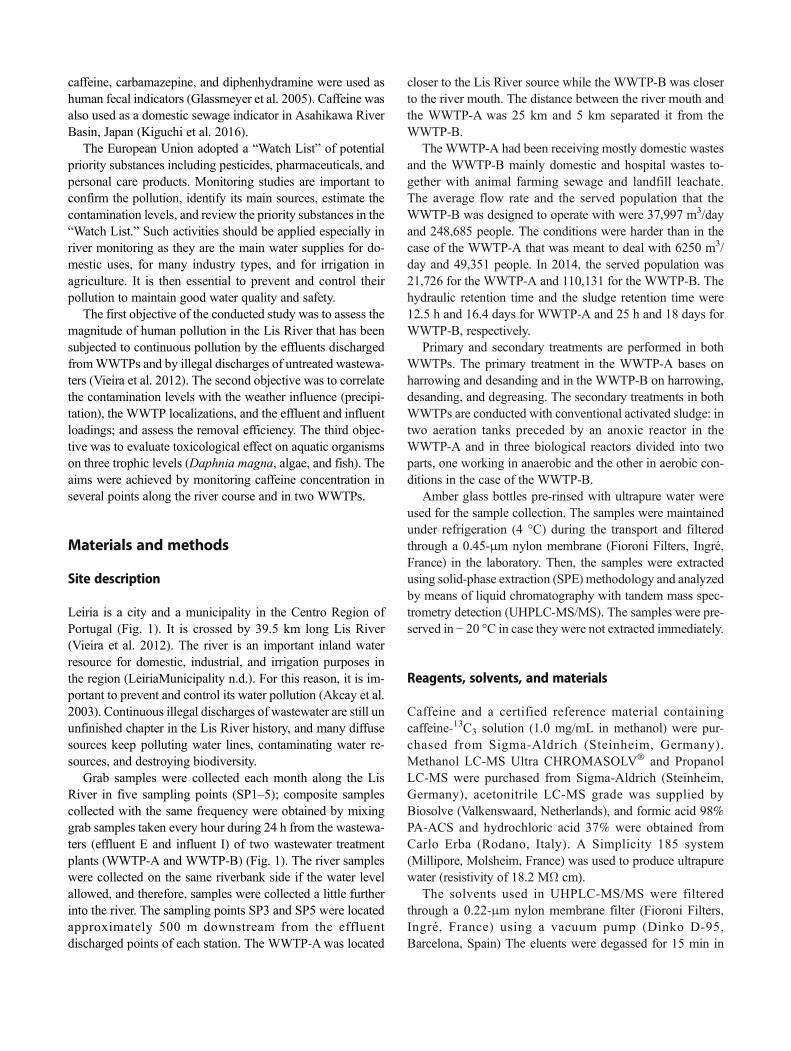
Grab samples were collected each month along the LisRiver in five sampling points (SP1–5); composite samplescollected with the same frequency were obtained by mixinggrab samples taken every hour during 24 h from the wastewa-ters (effluent E and influent I) of two wastewater treatmentplants (WWTP-A and WWTP-B) (Fig. 1). The river sampleswere collected on the same riverbank side if the water levelallowed, and therefore, samples were collected a little furtherinto the river. The sampling points SP3 and SP5 were locatedapproximately 500 m downstream from the effluentdischarged points of each station. The WWTP-Awas located
closer to the Lis River source while the WWTP-B was closerto the river mouth. The distance between the river mouth andthe WWTP-A was 25 km and 5 km separated it from theWWTP-B.
The WWTP-A had been receiving mostly domestic wastesand the WWTP-B mainly domestic and hospital wastes to-gether with animal farming sewage and landfill leachate.The average flow rate and the served population that theWWTP-B was designed to operate with were 37,997 m3/dayand 248,685 people. The conditions were harder than in thecase of the WWTP-A that was meant to deal with 6250 m3/day and 49,351 people. In 2014, the served population was21,726 for the WWTP-A and 110,131 for the WWTP-B. Thehydraulic retention time and the sludge retention time were12.5 h and 16.4 days for WWTP-A and 25 h and 18 days forWWTP-B, respectively.
Primary and secondary treatments are performed in bothWWTPs. The primary treatment in the WWTP-A bases onharrowing and desanding and in the WWTP-B on harrowing,desanding, and degreasing. The secondary treatments in bothWWTPs are conducted with conventional activated sludge: intwo aeration tanks preceded by an anoxic reactor in theWWTP-A and in three biological reactors divided into twoparts, one working in anaerobic and the other in aerobic con-ditions in the case of the WWTP-B.
Amber glass bottles pre-rinsed with ultrapure water wereused for the sample collection. The samples were maintainedunder refrigeration (4 °C) during the transport and filteredthrough a 0.45-μm nylon membrane (Fioroni Filters, Ingré,France) in the laboratory. Then, the samples were extractedusing solid-phase extraction (SPE) methodology and analyzedby means of liquid chromatography with tandem mass spec-trometry detection (UHPLC-MS/MS). The samples were pre-served in − 20 °C in case they were not extracted immediately.
Reagents, solvents, and materials
Caffeine and a certified reference material containingcaffeine-13C3 solution (1.0 mg/mL in methanol) were pur-chased from Sigma-Aldrich (Steinheim, Germany).Methanol LC-MS Ultra CHROMASOLV® and PropanolLC-MS were purchased from Sigma-Aldrich (Steinheim,Germany), acetonitrile LC-MS grade was supplied byBiosolve (Valkenswaard, Netherlands), and formic acid 98%PA-ACS and hydrochloric acid 37% were obtained fromCarlo Erba (Rodano, Italy). A Simplicity 185 system(Millipore, Molsheim, France) was used to produce ultrapurewater (resistivity of 18.2 MΩ cm).
The solvents used in UHPLC-MS/MS were filteredthrough a 0.22-μm nylon membrane filter (Fioroni Filters,Ingré, France) using a vacuum pump (Dinko D-95,Barcelona, Spain) The eluents were degassed for 15 min in
an ultrasonic bath (Sonorex Digital 10P, Bandelin DK 255P,Germany).
Standard stock solutions of caffeine and caffeine-13C3 of1 g/L concentrations were prepared in methanol and stored inthe dark at − 20 °C. Appropriate amounts of the caffeine stocksolution were mixed with 10% of organic phase (acetonitrile)and 90% of aqueous phase (0.1% formic acid in ultrapurewater) to obtain the working standard solutions. In the recov-ery tests, samples of the three matrices (river, effluents, andinfluent) were spiked with working standard solutions and twospiking levels were performed.
Strata-X SPE cartridges (200 mg, 3 mL) from Phenomenex(CA, USA) were used in the SPE extraction. The sample ex-tracts were filtered through 0.22-μm PTFE syringe filters(Specanalitica, Carcavelos, Portugal) before the chromato-graphic analysis.
Analytical method
Samples with the pH adjusted 2 were pre-concentrated onStrata-X cartridges. The SPE cartridges were conditionedusing the vacuum system manifold (Chromabond, Düren,Germany) first with 5 mL of methanol then with 5 mL ofultrapure water and finally 5 mL of ultrapure water of pH 2.The pH adjustments of samples and ultrapure water were doneusing hydrochloric acid 37%. In the next step, 250 mL of theriver water, 100 mL of the WWTP effluents, and 50 mL of the
WWTP influents were passed through the SPE cartridges. Theextraction was finished by passing 5 mL of ultrapure waterthrough the cartridges that were then left to dry under vacuumfor 60 min. In the next step, methanol was used to extract thecompound adsorbed in the cartridges. The extracts were evap-orated with nitrogen at room temperature until dry and theresidues dissolved in 10:90% (v/v) acetonitrile–0.1% formicacid in ultrapure water. Concentration factors of 500, 200, and100 were obtained for the river samples, WWTP effluent sam-ples, and WWTP influent samples, respectively (Paíga et al.2017). At the end, 5 μL of the caffeine-13C3 standard wasadded to the samples to obtain the final concentration of200 μg/L.
Chromatographic analysis was performed using aShimadzu Nexera LCMS system (LCMS-8030, Kyoto,Japan) equipped with an autosampler (SIL-30AC), a degasser(DGU-30A3), a column oven (CTO-30A), and two solventdelivery modules (LC-30AD), and coupled to a triple-quadru-pole MS detector with an electrospray ionization source (ESI).Argon was used as the collision gas at 230 kPa, and nitrogenwas used for the nebulizer and as the drying gas.
Identification and quantification were performed usingmultiple reaction monitoring (MRM, precursor > productions). The MRM transitions and the MS parameters (Q1 pre-bias (V), Q3 pre-bias (V), and collision energy) were opti-mized automatically using the MRM optimization featureavailable in the LabSolutions software. Injections of the
Fig. 1 Localization of the sampling points (SP) in the river and in the effluents and influents of the two WWTPs (source of the river (SP1) and before(SP2 and SP4) and after (SP3 and SP5) the discharge of the WWTPs)

standard were performed and two highest signal transitionswere recorded; the first on the most intensive was used forquantification and the second for identification.
The isotopically labeled internal caffeine-13C3 standardwas used to compensate the matrix effect. Only one transition(the most intense) was recorded for caffeine-13C3. The obtain-ed MS parameters are given below:
caffeine:
195.05 > 138.20 (Q1 pre-bias, − 10V; CE, − 22 eV; and Q3pre-bias, − 14 V, quantification ion); 195.05 > 42.15 (Q1 pre-bias, − 10 V; CE, − 37 eV; and Q3 pre-bias, − 15 V, identifi-cation ion)
caffeine-13C3:
198.05 > 140.10 (Q1 pre-bias, − 10V; CE, − 21 eV; and Q3pre-bias, − 27 V)
The LabSolutions software (version 5.80, Shimadzu) wasused for data processing and system control. Caffeine andcaffeine-13C3 were analyzed in positive ionization mode.
A standard 10 mg/L mixture solution was used for thesource-dependent parameter optimization by direct injection.The optimized parameter values were as follows: interfacevoltage, 5.0 kV; nebulizer gas flow rate, 2.6 L/min; dryinggas flow rate, 15 L/min; desolvation line temperature,300 °C; and heat block temperature, 425 °C.
A Cortecs™ UPLC® C18+ column (100 × 2.1 mm i.d.;1.6 μm particle size) from Waters (Milford, MA, USA)was used in the experiments. The mobile phase eluentswere 0.1% formic acid in ultrapure water (eluent A, aque-ous phase) and acetonitrile (eluent B, organic phase). Theelution gradient started with 10% of the eluent B, in-creased to 100% of the eluent B in 2 min, maintainedfor 0.5 min, and then returned to the initial conditions in1 min. The column was re-equilibrated for 2.5 min beforethe next injection. The retention times for caffeine andcaffeine-13C3 were 2.184 (RSD = 0.673%) and 2.182 min(RSD = 0.0850%), respectively; the injection volume was5 μL and the flow rate was 0.3 mL/min, respectively. Theautosampler temperature was 4 °C and the column tem-perature was 30 °C; the dwell time of 100 ms was used.
The identification and confirmation criteria for the caffeineanalysis were based on the Commission Decision 2002/657/EC (2002/657/EC 2002).
Quality assurance and control
The repeatability expressed as relative standard deviation(%RSD), the recovery, matrix effects (ME), linearity, methoddetection limit (MDL, lowest analyte concentration with theS/N ratio of 3), and method quantification limit (MQL,
concentration with the S/N ratio of 10) were evaluated, andthe results are presented in “Caffeine quantification and themethod validation.” Injection ofmobile phase (solvent blanks)was performed along the batch for the instrumental back-ground monitoring. The MDLs and MQLs were determinedusing the whole chromatogram range.
Statistical analysis
All the statistical analysis was performed using the R software(R Development Core Team 2016). The data is presented asmean ± standard deviation or as median and range (min–max).The hypotheses of normal caffeine concentration distributionfor several groups were rejected based on the Kolmogorov-Smirnov test. Consequently, differences between the groupswere analyzed by non-parametric versions of the ANOVAtest–the Kruskal-Wallis test for independent samples and bythe Friedman test for matched samples. Post hoc tests forpairwise multiple comparisons were applied whenever signif-icant differences were detected by the tests. The values p ≤0.050 were considered statistically significant.
Risk quotient
Risk quotient (RQ) was calculated at three different trophiclevels of the ecosystem: algae, Daphnia magna, and fishbased on data found in the literature and using ECOSARsoftware. According to the Technical Guidance Document ofthe European Commission, the RQ is calculated as the mea-sured environmental concentration (MEC) divided by the pre-dicted no-effect concentration (PNEC = (EC50 or LC50)/1000)(Vazquez-Roig et al. 2012). To predict the highest negativeeffect of caffeine, the highest concentration of caffeineachieved in each type of samples was used. If the RQ is equalor greater than 1, there is a potential environmental risk(EMEA 2006; Thomaidi et al. 2015).
Results and discussion
Caffeine quantification and the method validation
Calibration curves, linearity, MDL, MQL, repeatability, re-covery, and matrix effect were evaluated. The results and theirdiscussion are presented in the following subsections.
Calibration curves
The calibration curves in solvent and in the sample’s matrices(river water, WWTP influents, and WWTP effluents) wereplotted in the range of 10 to 1000 μg/L to ensure that theconcentrated samples would lie within the plotted curves.The curves were made for both transitions (precursor >

quantification product ions and precursor > identificationproduct ions) and were constructed using the ratio of the tran-sition ion to isotopically labeled internal standard peak areas(area of the transition ion/area of the isotopically labeled in-ternal standard) plotted against the caffeine ratio standard con-centrations (concentration of the caffeine standard/concentra-tion of the isotopically labeled internal standard). For bothcaffeine transitions, the calibration curves were linear withcorrelation coefficient (R) greater than 0.999. The quantifica-tion of the caffeine was performed by the internal standardapproach.
Method’s detection and quantification limits
MDLs and MQLs were determined using the river water andthe WWTP effluent and influent samples. The obtained MDLand MQL values were 1.08 and 3.61 ng/L for the river water,1.91 and 6.37 ng/L for the WWTP effluent, and 2.05 and6.82 ng/L for the WWTP influent, respectively. HigherMDLs and MQLs were achieved in WWTP influent com-pared with the other matrices.
Repeatability
Three standards with concentrations of 100, 250, and 500 μg/L were used for the repeatability analysis. One sequential andtwelve standard injections were performed. The obtained RSDvalues were 4.31 (100 μg/L), 3.57 (250 μg/L), and 1.94%(500 μg/L). In the next step, each standard was repeated inthe beginning, during, and in the end of the batch sequenceand the obtained RSD values were lower than 10% (8.51(100 μg/L), 8.25 (250 μg/L), and 5.65% (500 μg/L)). Asexpected, the highest RSD values were observed for the low-est concentrations and the lowest RSD values were achievedfor the highest concentrations.
Recoveries
Recoveries were evaluated for all sample’s types. The caffeinepeak areas of the samples spiked prior to the SPE extraction(pre-spiked sample) and after the extraction (post-spiked sam-ple) were compared (Paíga et al. 2017). Two spiking levels(0.2 (level I) and 0.5 (level II) μgcaffeine/Lsample) were per-formed. The results were:
& River water
Level I: 105% (RSD, 0.366%)Level II: 92.7% (RSD, 0.366%)
& WWTP effluent
Level I: 71.9% (RSD, 4.29%)
Level II: 74.8% (RSD, 3.99%)
& WWTP influent
Level I: 75.0% (RSD, 2.06%)Level II: 77.4% (RSD, 0.123%)
The results showed good precision of the developed meth-od with the RSD lower than 4.5%. The highest recoveries(between 93 and 105%) were observed in the river samples,and all the remaining samples had similar recoveries rangingfrom 72 to 75%.
Matrix effect
The slopes of the matrix-matched calibration curves for thethree samples types were compared with the calibration curveslope prepared in the solvent (standards prepared with initialmobile phase conditions). The matrix effect (ME) higher than100% indicates ionization enhancement and lower than 100%indicates suppression of the ionization (Panuwet et al. 2016).The results on the level of 17.9% for river water, 24.0% forWWTP effluent, and 37.4% for the WWTP influent showedion suppression signals.
Occurrence of caffeine in the Lis Riverand in the WWTP influents and effluents
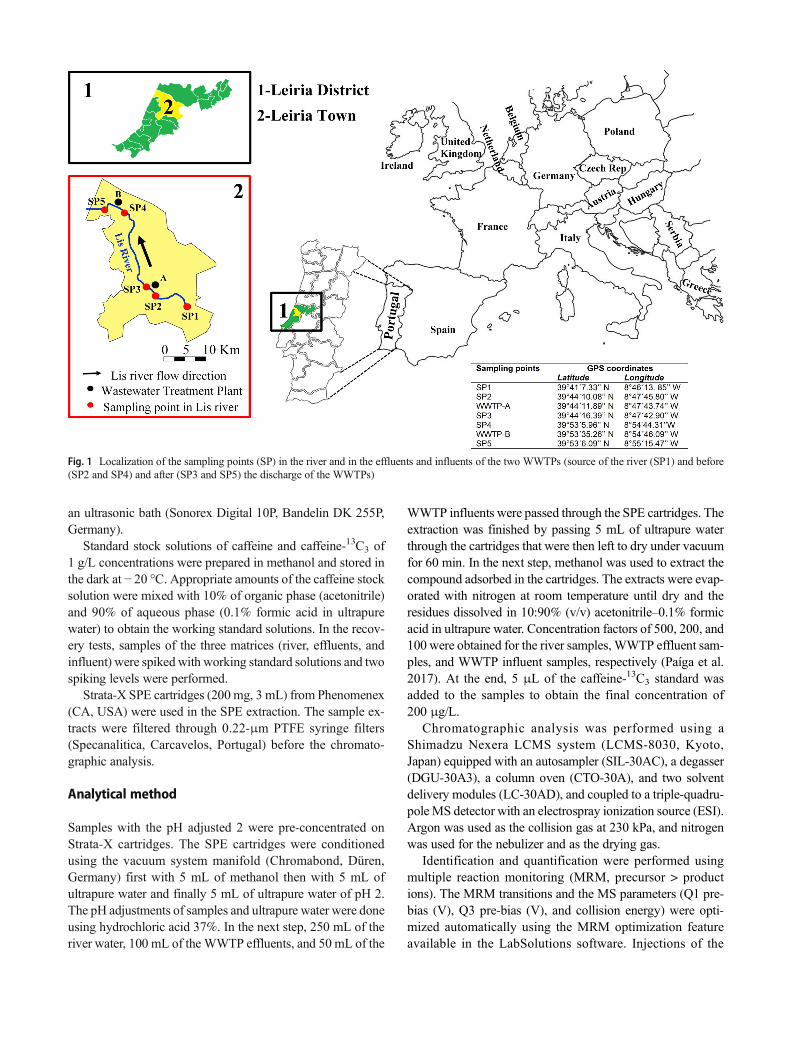
The caffeine concentration in all months and in all the sam-pling points is shown in Fig. 2. Caffeine was detected with theRSD values between 0.359 and 9.99% in all samples. Thelowest caffeine concentration was found in the river waterand the highest in the samples collected in the WWTP influ-ents. The WWTP effluents have no influence on the samplescollected at the SP1 and SP2 (Fig. 1) because these samplingpoints (SP) were upstream of the WWTP-A effluent dis-charge. The SP1 could be considered a control point becauseit is the furthest point from the first effluent discharge into theriver course. Contrary to what would be expected, caffeinelevels were higher in the SP2 than in the SP3 in January,February, April, May, and June of 2014. No discharge of theWWTP effluents was made from the SP3 to SP4 (Fig. 1).Therefore, the caffeine levels at the SP4 should be lower thanat the SP3 due to dilution occurred in the course of the river.Nonetheless, higher values at the SP4 were observed inJanuary, in April, in May, and in June of 2014 (Fig. 2).Located in a more urbanized area and at the end of the water-course, SP5 was more susceptible to anthropogenic activities(Fig. 1). It was observed that the minimum caffeine concen-tration detected at the SP5 was higher than the minimumvalues found at the remaining SP. The results indicated thatcaffeine concentration in the SP5 was higher than in the SP4,except for November of 2013 and January and June of 2014
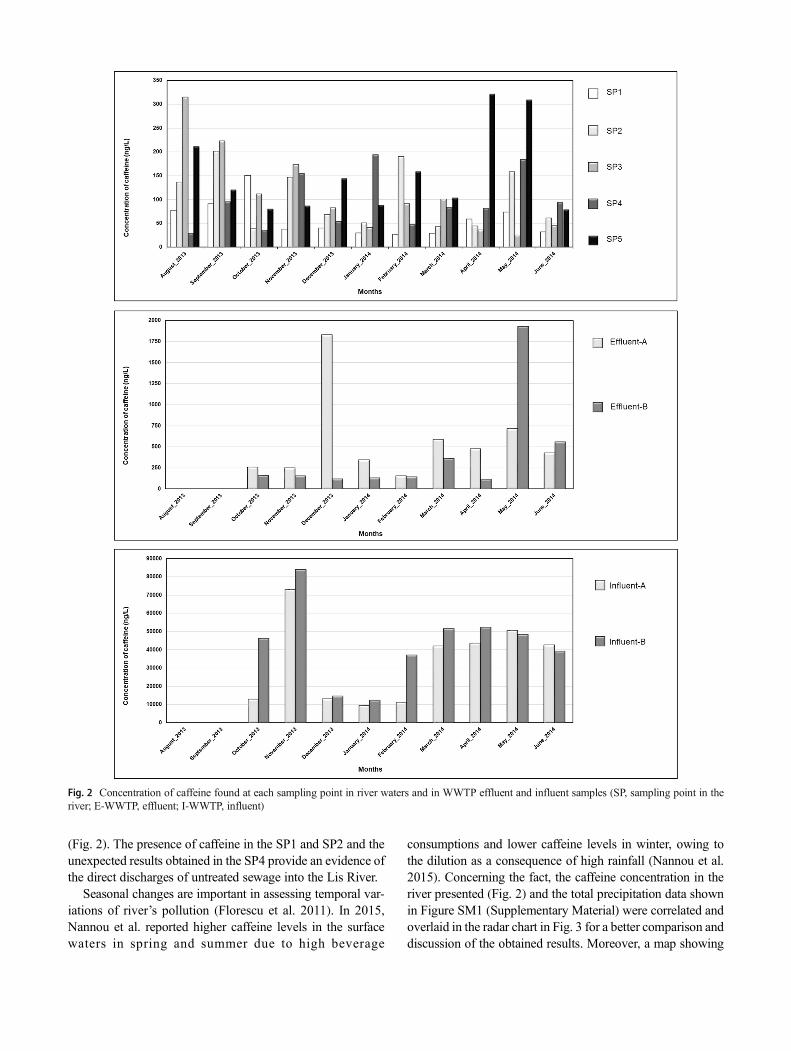
(Fig. 2). The presence of caffeine in the SP1 and SP2 and theunexpected results obtained in the SP4 provide an evidence ofthe direct discharges of untreated sewage into the Lis River.
Seasonal changes are important in assessing temporal var-iations of river’s pollution (Florescu et al. 2011). In 2015,Nannou et al. reported higher caffeine levels in the surfacewaters in spring and summer due to high beverage
consumptions and lower caffeine levels in winter, owing tothe dilution as a consequence of high rainfall (Nannou et al.2015). Concerning the fact, the caffeine concentration in theriver presented (Fig. 2) and the total precipitation data shownin Figure SM1 (Supplementary Material) were correlated andoverlaid in the radar chart in Fig. 3 for a better comparison anddiscussion of the obtained results. Moreover, a map showing
Fig. 2 Concentration of caffeine found at each sampling point in river waters and in WWTP effluent and influent samples (SP, sampling point in theriver; E-WWTP, effluent; I-WWTP, influent)
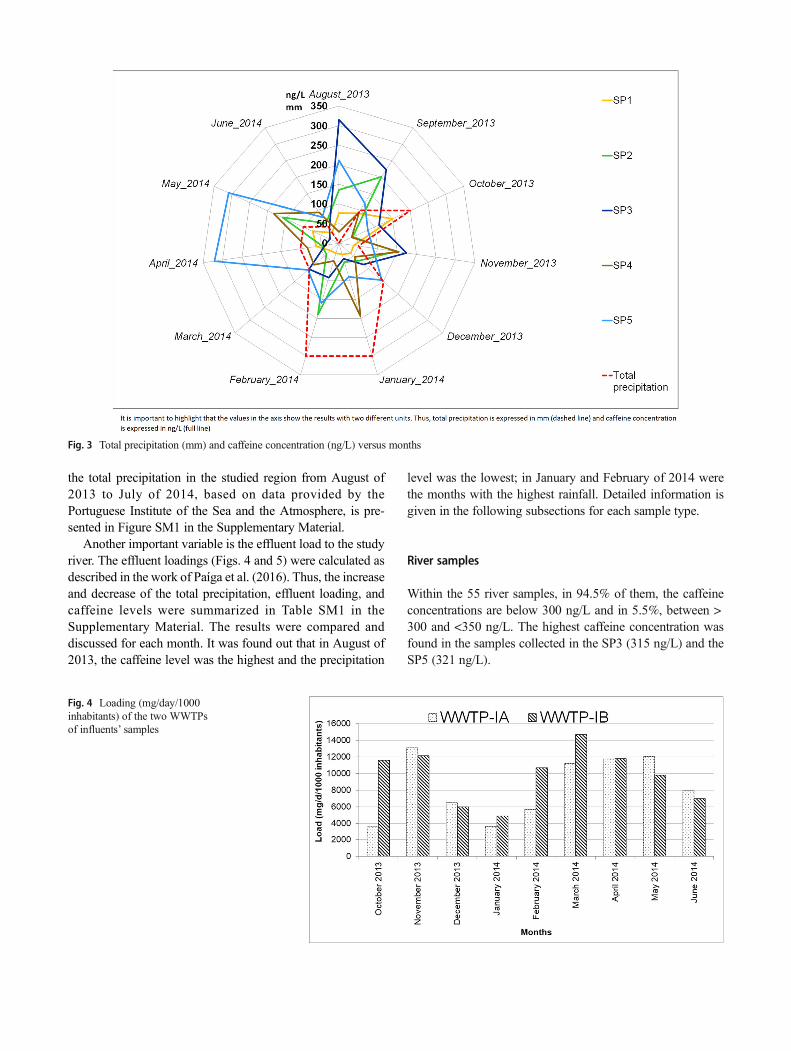
the total precipitation in the studied region from August of2013 to July of 2014, based on data provided by thePortuguese Institute of the Sea and the Atmosphere, is pre-sented in Figure SM1 in the Supplementary Material.
Another important variable is the effluent load to the studyriver. The effluent loadings (Figs. 4 and 5) were calculated asdescribed in the work of Paíga et al. (2016). Thus, the increaseand decrease of the total precipitation, effluent loading, andcaffeine levels were summarized in Table SM1 in theSupplementary Material. The results were compared anddiscussed for each month. It was found out that in August of2013, the caffeine level was the highest and the precipitation
level was the lowest; in January and February of 2014 werethe months with the highest rainfall. Detailed information isgiven in the following subsections for each sample type.
River samples
Within the 55 river samples, in 94.5% of them, the caffeineconcentrations are below 300 ng/L and in 5.5%, between >300 and <350 ng/L. The highest caffeine concentration wasfound in the samples collected in the SP3 (315 ng/L) and theSP5 (321 ng/L).
Fig. 3 Total precipitation (mm) and caffeine concentration (ng/L) versus months
Fig. 4 Loading (mg/day/1000inhabitants) of the two WWTPsof influents’ samples

The caffeine levels varied with seasonal changes and withvariation of the effluent loadings (Figs. 3 and 5 and Table SM1 (SupplementaryMaterial)). However, some exceptions wereobserved and may be associated with discharges of untreatedwastewater into the river or lower caffeine consumption by thepopulation. To improve the river water quality, the unknowncontamination sources should be identified by the authoritiesand some preventive action must take to stop the pollutiondischarges.
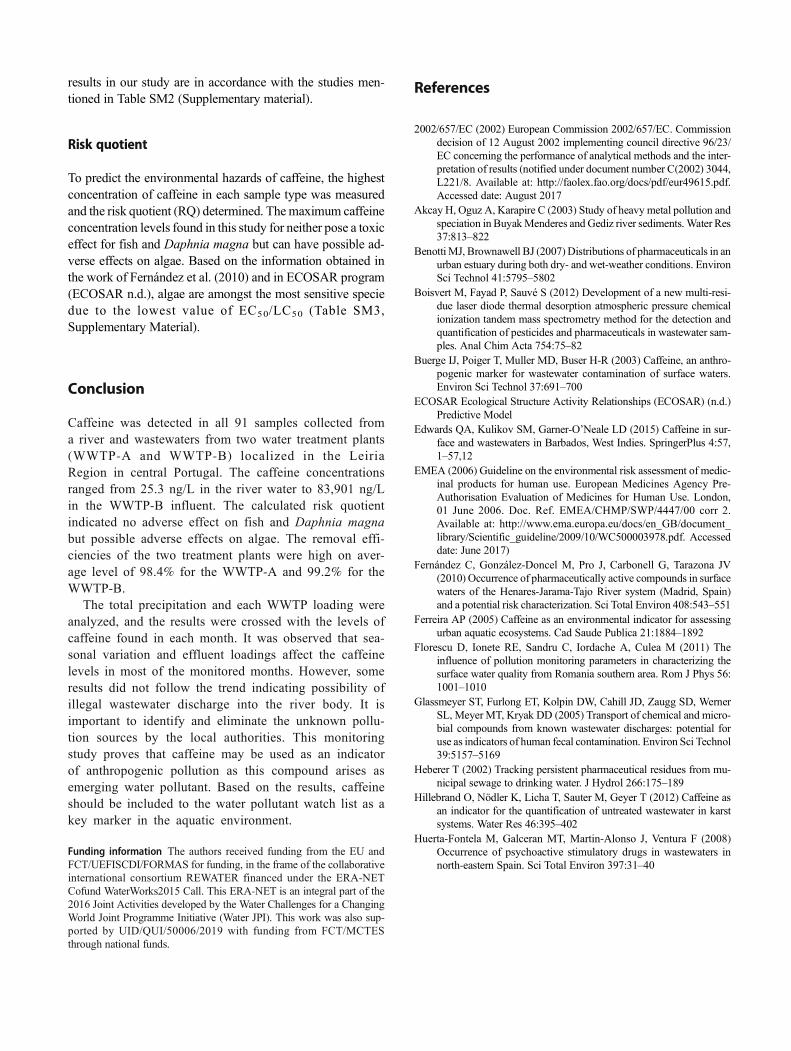
Despite the differences observed in each sampling point, aKruskal-Wallis test revealed that the caffeine concentrationlevels do not vary significantly between months based on theriver sample analysis (χ2(10) = 8.6026, p > 0.050) (Fig. 6).Although higher values of caffeine concentrations have beenobserved, in median terms, as the sampling points move awayfrom the river beginning, a post hoc Wilcoxon rank-sum tests
with Bonferroni’s correction showed only significant differencesbetween the sampling points SP1 and SP5 (p = 0.007) (Fig. 7).
Wastewater samples
In the WWTP influents, the caffeine concentration was in therange of micrograms per liter; in the case of the effluents, only11.1% of the samples exhibited caffeine concentration in suchrange. The months with the lowest loadings in the WWTPinfluents (Fig. 4) were October of 2013 for the WWTP-Aand January of 2014 for theWWTP-B. The highest loads wereobserved in November of 2013 for the WWTP-A and inMarch of 2014 for the WWTP-B. The most significant differ-ence between the two stations was recorded in October of2013 and February of 2014 when the loads in the WWTP-Bwere significantly higher (Fig. 4). October and February were
Fig. 6 Distribution of caffeine concentration (ng/L) by sample collection month between August of 2013 to June of 2014
Fig. 5 Loading (mg/day/1000inhabitants) of the two WWTPsof the effluents’ samples
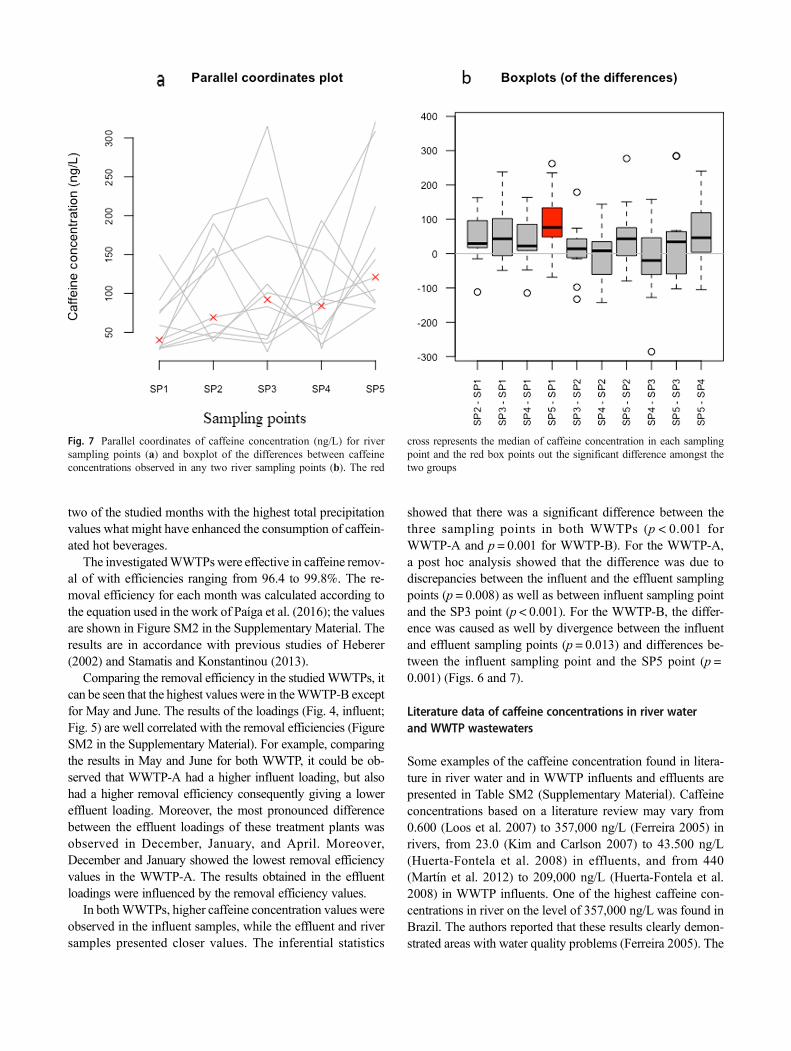
two of the studied months with the highest total precipitationvalues what might have enhanced the consumption of caffein-ated hot beverages.
The investigatedWWTPswere effective in caffeine remov-al of with efficiencies ranging from 96.4 to 99.8%. The re-moval efficiency for each month was calculated according tothe equation used in the work of Paíga et al. (2016); the valuesare shown in Figure SM2 in the Supplementary Material. Theresults are in accordance with previous studies of Heberer(2002) and Stamatis and Konstantinou (2013).
Comparing the removal efficiency in the studiedWWTPs, itcan be seen that the highest values were in theWWTP-B exceptfor May and June. The results of the loadings (Fig. 4, influent;Fig. 5) are well correlated with the removal efficiencies (FigureSM2 in the Supplementary Material). For example, comparingthe results in May and June for both WWTP, it could be ob-served that WWTP-A had a higher influent loading, but alsohad a higher removal efficiency consequently giving a lowereffluent loading. Moreover, the most pronounced differencebetween the effluent loadings of these treatment plants wasobserved in December, January, and April. Moreover,December and January showed the lowest removal efficiencyvalues in the WWTP-A. The results obtained in the effluentloadings were influenced by the removal efficiency values.
In bothWWTPs, higher caffeine concentration values wereobserved in the influent samples, while the effluent and riversamples presented closer values. The inferential statistics
showed that there was a significant difference between thethree sampling points in both WWTPs (p < 0.001 forWWTP-A and p = 0.001 for WWTP-B). For the WWTP-A,a post hoc analysis showed that the difference was due todiscrepancies between the influent and the effluent samplingpoints (p = 0.008) as well as between influent sampling pointand the SP3 point (p < 0.001). For the WWTP-B, the differ-ence was caused as well by divergence between the influentand effluent sampling points (p = 0.013) and differences be-tween the influent sampling point and the SP5 point (p =0.001) (Figs. 6 and 7).
Literature data of caffeine concentrations in river waterand WWTP wastewaters
Some examples of the caffeine concentration found in litera-ture in river water and in WWTP influents and effluents arepresented in Table SM2 (Supplementary Material). Caffeineconcentrations based on a literature review may vary from0.600 (Loos et al. 2007) to 357,000 ng/L (Ferreira 2005) inrivers, from 23.0 (Kim and Carlson 2007) to 43.500 ng/L(Huerta-Fontela et al. 2008) in effluents, and from 440(Martín et al. 2012) to 209,000 ng/L (Huerta-Fontela et al.2008) in WWTP influents. One of the highest caffeine con-centrations in river on the level of 357,000 ng/L was found inBrazil. The authors reported that these results clearly demon-strated areas with water quality problems (Ferreira 2005). The
Fig. 7 Parallel coordinates of caffeine concentration (ng/L) for riversampling points (a) and boxplot of the differences between caffeineconcentrations observed in any two river sampling points (b). The red
cross represents the median of caffeine concentration in each samplingpoint and the red box points out the significant difference amongst thetwo groups
results in our study are in accordance with the studies men-tioned in Table SM2 (Supplementary material).
Risk quotient
To predict the environmental hazards of caffeine, the highestconcentration of caffeine in each sample type was measuredand the risk quotient (RQ) determined. Themaximum caffeineconcentration levels found in this study for neither pose a toxiceffect for fish and Daphnia magna but can have possible ad-verse effects on algae. Based on the information obtained inthe work of Fernández et al. (2010) and in ECOSAR program(ECOSAR n.d.), algae are amongst the most sensitive speciedue to the lowest value of EC50/LC50 (Table SM3,Supplementary Material).
Conclusion
Caffeine was detected in all 91 samples collected froma river and wastewaters from two water treatment plants(WWTP-A and WWTP-B) localized in the LeiriaRegion in central Portugal. The caffeine concentrationsranged from 25.3 ng/L in the river water to 83,901 ng/Lin the WWTP-B influent. The calculated risk quotientindicated no adverse effect on fish and Daphnia magnabut possible adverse effects on algae. The removal effi-ciencies of the two treatment plants were high on aver-age level of 98.4% for the WWTP-A and 99.2% for theWWTP-B.
The total precipitation and each WWTP loading wereanalyzed, and the results were crossed with the levels ofcaffeine found in each month. It was observed that sea-sonal variation and effluent loadings affect the caffeinelevels in most of the monitored months. However, someresults did not follow the trend indicating possibility ofillegal wastewater discharge into the river body. It isimportant to identify and eliminate the unknown pollu-tion sources by the local authorities. This monitoringstudy proves that caffeine may be used as an indicatorof anthropogenic pollution as this compound arises asemerging water pollutant. Based on the results, caffeineshould be included to the water pollutant watch list as akey marker in the aquatic environment.
Funding information The authors received funding from the EU andFCT/UEFISCDI/FORMAS for funding, in the frame of the collaborativeinternational consortium REWATER financed under the ERA-NETCofund WaterWorks2015 Call. This ERA-NET is an integral part of the2016 Joint Activities developed by the Water Challenges for a ChangingWorld Joint Programme Initiative (Water JPI). This work was also sup-ported by UID/QUI/50006/2019 with funding from FCT/MCTESthrough national funds.
References
2002/657/EC (2002) European Commission 2002/657/EC. Commissiondecision of 12 August 2002 implementing council directive 96/23/EC concerning the performance of analytical methods and the inter-pretation of results (notified under document number C(2002) 3044,L221/8. Available at: http://faolex.fao.org/docs/pdf/eur49615.pdf.Accessed date: August 2017
Akcay H, Oguz A, Karapire C (2003) Study of heavy metal pollution andspeciation in BuyakMenderes and Gediz river sediments. Water Res37:813–822
Benotti MJ, Brownawell BJ (2007) Distributions of pharmaceuticals in anurban estuary during both dry- and wet-weather conditions. EnvironSci Technol 41:5795–5802
Boisvert M, Fayad P, Sauvé S (2012) Development of a new multi-resi-due laser diode thermal desorption atmospheric pressure chemicalionization tandem mass spectrometry method for the detection andquantification of pesticides and pharmaceuticals in wastewater sam-ples. Anal Chim Acta 754:75–82
Buerge IJ, Poiger T, Muller MD, Buser H-R (2003) Caffeine, an anthro-pogenic marker for wastewater contamination of surface waters.Environ Sci Technol 37:691–700
ECOSAR Ecological Structure Activity Relationships (ECOSAR) (n.d.)Predictive Model
Edwards QA, Kulikov SM, Garner-O’Neale LD (2015) Caffeine in sur-face and wastewaters in Barbados, West Indies. SpringerPlus 4:57,1–57,12
EMEA (2006) Guideline on the environmental risk assessment of medic-inal products for human use. European Medicines Agency Pre-Authorisation Evaluation of Medicines for Human Use. London,01 June 2006. Doc. Ref. EMEA/CHMP/SWP/4447/00 corr 2.Available at: http://www.ema.europa.eu/docs/en_GB/document_library/Scientific_guideline/2009/10/WC500003978.pdf. Accesseddate: June 2017)
Fernández C, González-Doncel M, Pro J, Carbonell G, Tarazona JV(2010) Occurrence of pharmaceutically active compounds in surfacewaters of the Henares-Jarama-Tajo River system (Madrid, Spain)and a potential risk characterization. Sci Total Environ 408:543–551
Ferreira AP (2005) Caffeine as an environmental indicator for assessingurban aquatic ecosystems. Cad Saude Publica 21:1884–1892
Florescu D, Ionete RE, Sandru C, Iordache A, Culea M (2011) Theinfluence of pollution monitoring parameters in characterizing thesurface water quality from Romania southern area. Rom J Phys 56:1001–1010
Glassmeyer ST, Furlong ET, Kolpin DW, Cahill JD, Zaugg SD, WernerSL, Meyer MT, Kryak DD (2005) Transport of chemical and micro-bial compounds from known wastewater discharges: potential foruse as indicators of human fecal contamination. Environ Sci Technol39:5157–5169
Heberer T (2002) Tracking persistent pharmaceutical residues from mu-nicipal sewage to drinking water. J Hydrol 266:175–189
Hillebrand O, Nödler K, Licha T, Sauter M, Geyer T (2012) Caffeine asan indicator for the quantification of untreated wastewater in karstsystems. Water Res 46:395–402
Huerta-Fontela M, Galceran MT, Martin-Alonso J, Ventura F (2008)Occurrence of psychoactive stimulatory drugs in wastewaters innorth-eastern Spain. Sci Total Environ 397:31–40
Kiguchi O, Sato G, Kobayashi T (2016) Source-specific sewage pollutiondetection in urban river waters using pharmaceuticals and personalcare products as molecular indicators. Environ Sci Pollut Res 23:22513–22529
Kim S-C, Carlson K (2007) Quantification of human and veterinary an-tibiotics inwater and sediment using SPE/LC/MS/MS. Anal BioanalChem 387:1301–1315
Kurissery S, Kanavillil N, Verenitch S, Mazumder A (2012) Caffeine asan anthropogenic marker of domestic waste: a study from LakeSimcoe watershed. Ecol Indic 23:501–508
LeiriaMunicipality (n.d.) Available http://www.cm-leiria.pt/.Accessed 14 Dec 2017
Loos R, Wollgast J, Huber T, Hanke G (2007) Polar herbicides, pharma-ceut ica l products , perf luorooctanesulfonate (PFOS),perfluorooctanoate (PFOA), and nonylphenol and its carboxylatesand ethoxylates in surface and tap waters around Lake Maggiore inNorthern Italy. Anal Bioanal Chem 387:1469–1478
Mahoney CR, Giles GE, Marriott BP, Judelson DA, Glickman EL,Geiselman PJ, Lieberman HR, (2019) Intake of caffeine from allsources and reasons for use by college students. Clinical Nutrition38 (2):668-675
Martín J, Camacho-Munoz D, Santos JL, Aparicio I, Alonso E (2012)Occurrence of pharmaceutical compounds in wastewater and sludgefrom wastewater treatment plants: removal and ecotoxicological im-pact of wastewater discharges and sludge disposal. J Hazard Mater239-240:40–47
Nannou CI, Kosma CI, Albanis TA (2015) Occurrence of pharmaceuti-cals in surface waters: analytical method development and environ-mental risk assessment. Int J Environ Anal Chem 95:1242–1262
Paíga P, Santos LHMLM, Ramos S, Jorge S, Silva JG, Delerue-Matos C(2016) Presence of pharmaceuticals in the Lis river (Portugal):sources, fate and seasonal variation. Sci Total Environ 573:164–177
Paíga P, Santos LHMLM, Delerue-Matos C (2017) Development of amulti-residue method for the determination of human and veterinarypharmaceuticals and some of their metabolites in aqueous environ-mental matrices by SPE-UHPLC–MS/MS. J Pharm Biomed Anal135:75–86
Panuwet P, Hunter REJ, D’Souza PE, Chen X, Radford SA, CohenJR, Marder ME, Kartavenka K, Ryan PB, Barr DB (2016)Biological matrix effects in quantitative tandem mass
spectrometry-based analytical methods: advancing biomonitor-ing. Crit Rev Anal Chem 46:93–105
Peteffi GP, Fleck JD, Kael IM, Girardi V, Bündchen R, Krajeski DM,Demoliner M, Silva FP, daRosa DC, Antunes MV, Linden R (2018)Caffeine levels as a predictor of Human mastadenovirus presence insurface waters-a case study in the Sinos River basin-Brazil. EnvironSci Pollut Res Int 25(16):15774–15784. https://doi.org/10.1007/s11356-018-1649-3
R Development Core Team (2016) R: A Language and Environment forStatistical Computing. R Foundation for Statistical Computing,Vienna
Seiler RL, Zaugg SD, Thomas JM, Howcroft DL (1999) Caffeine andpharmaceuticals as indicators of wastewater contamination in wells.Ground Water 37:405–410
Siegener R, Chen RF (2002) Caffeine in Boston Harbor seawater. MarPollut Bull 44:383–387
Stamatis NK, Konstantinou IK (2013) Occurrence and removal of emerg-ing pharmaceutical, personal care compounds and caffeine tracer inmunicipal sewage treatment plant in Western Greece. J Environ SciHealth B 48:800–813
Thomaidi VS, Stasinakis AS, Borova VL, Thomaidis NS (2015) Is there arisk for the aquatic environment due to the existence of emergingorganic contaminants in treated domestic wastewater? Greece as acase-study. J Hazard Mater 283:740–747
Vazquez-Roig P, Andreu V, Blasco C, Picó Y (2012) Risk assessment onthe presence of pharmaceuticals in sediments, soils and waters of thePego-Oliva marshlands (Valencia, eastern Spain). Sci Total Environ440:24–32
Vieira J, Fonseca A, Vilar VJP, Boaventura RAR, Botelho CMS (2012)Water quality in Lis river, Portugal. Environ Monit Assess 184:7125–7140
Yang Y-Y, Liu W-R, Liu Y-S, Zhao J-L, Zhang Q-Q, Zhang M, Zhang J-N, Jiang Y-X, Zhang L-J, Ying G-G (2017) Suitability of pharma-ceuticals and personal care products (PPCPs) and artificial sweet-eners (ASs) as wastewater indicators in the Pearl River Delta, SouthChina. Sci Total Environ 590–591:611–619