monitoring the eu platform on diet, physical activity and health platform plenary – 5 th february...
TRANSCRIPT

Monitoring the EU Platform on Diet, Physical Activity and Health
Platform Plenary – 5th February 2007
Jonathan Back – European Commission

The Process
• Monitoring forms required for the 2nd Monitoring Progress Report (to be published March 2007)• Initial deadline 17 November 2006• Extended deadline 22 December 2006• Forms received approx. 120 (commitments approx. 200)• Contractor working on these 120 forms as basis of progress report• Additional forms received since 17 January approx. 20

Overview of forms
• Purpose not to comment on the commitments as such, but how well they have been monitored• A chance to report on how far the monitoring identifies progress in a way that can be used in the second monitoring report• The statistics presented are indicative rather than scientific• There are many examples of good monitoring practice, but improvements are needed so that the full scale of achievements can be demonstrated• As far as possible tried to ensure contributors are anonymous

Summary of results: overall quality of monitoring
• This assessment refers to the quality of the monitoring only
Assessment of monitoring standard of reports
0
5
10
15
20
n/a Poor Fair-Poor Fair Fair-Good Good
Monitoring Quality Category
Fre
qu
ency
Based on a sample of 60 monitoring reports

Summary of results: use of quantitative data
• Most of the monitoring reports included at least some quantitative information.
• But far fewer reports included contextual information that made these figures meaningful.
• For example, it is difficult to assess the significance of a 40% market share if the size and value of the market is not stated.
“The objective has been achieved since these seven products have been effectively reformulated to date… The policy is applied to the given products all across the country in all [of member’s] outlets. ”
• We cannot know how popular these seven products are, which means we cannot understand the commitment fully. What are the sales figures? At least, how many outlets are there in the country?
“The policy applies to all [member] brand products offered in stores throughout the UK. That represents 3000 retail outlets and 1800 food stores across the UK. The [member] develops 4000 food lines.”

Summary of results: use of quantitative data
‘Publish [our website] in 5 languages, with work planned to extend to 9 languages by end 2007, to reach more European stakeholders with an interest in nutrition and food safety.’
• Good because a timescale has been established• Clearly states that 14 languages will be covered• Would be even better if gave quantitative information on how many millions of citizens benefit from this initiative • A corresponding output could then state that website reaches x% more native speakers in 2006 that it did in 2005• Therefore, making objectives more specific can fully reveal scale and potential impact of commitment

The scale of commitments
• Certain commitments can be difficult to monitor.
• However, this can be because the area covered by the commitment is very large:
“To improve the understanding of obesity by undertaking research, publishing reports, representing the field in public fora, providing media and other policy briefings, increasing coordination between obesity professional groups and other NGOs, and increasing professional knowledge and understanding.”
• In some cases it might be better to sub-divide larger commitments into sub-commitments that can be monitored accurately.
• Therefore, consider splitting up commitments into easily-measurable units.

Separating out actions into appropriate sections
One monitoring report contains the following in its input section:
‘Online interactive training, which more than 2,000 global employees in marketing and other functions must complete; completion is tracked. This training cost €55,000 to create and implement.
• This statement contains a combination of objectives, inputs and outputs. To make things rigorous and clear, each element should be separated out into its appropriate section.

Separating out actions into appropriate sections
‘Online interactive training, which more than 2,000 global employees in marketing and
other functions must complete;
“Online interactive training, which more
than 2,000 global employees in
marketing and other functions must
complete”
OBJECTIVE
Good because provides the figure
of 2,000 global employees, but
needs timescale to make this figure
meaningful.
“The training cost €55,000 to create and
implement”INPUT
Good - gives a precise figure that covers all aspects
of the action in
question.
“Completion is tracked” OUTPUT
Should be tracked in the outputs
section of the monitoring report itself.
This is the purpose of the monitoring
report. Otherwise the whole action
remains unproven.
completion is tracked. This training cost €55,000 to create and implement.

Linking between sections
An objective should be linked to at least one output •If this linkage is not established, then in terms of monitoring the objective is a vague aim that cannot be measured and therefore is not useful to other stakeholders. • If objectives aren’t associated with outputs (and vice versa), then attempts to monitor the commitment won’t work properly. It may be helpful to consider the issue this way:
Objectives without a corresponding output: not proven.
Outputs without a corresponding objective: irrelevant / of unclear significance.• External stakeholders should be able to see links through monitoring report: objectives > inputs > outputs > outcomes.

Objectives: Using the Monitoring Framework
Following the Monitoring Framework can easily improve monitoring reports
“SpecificWhat – to increase the consumption of fruit & vegetables in childrenWhere – in 150 primary schools throughout IrelandWhy – to improve the health of the population and reduce obesityWhen – commencing in September ’05 and finishing in June ’08
Measurable – To introduce the [member’s] Programme to 30,000 children in 150 schools over 3 years
Achievable – The training has been completed, the finance is in place, the partners are committed and the schools are willing to participate. It is on target after Year 1 and is achievable.
Realistic – Based on the achievements in Year 1, the expectations are realistic.
Timebound – Must and will be completed within three school years: September 05 to June 08.”

Objectives
Timescale• Often, the problem is the lack of a timescale attached to an objective. • This makes measurement difficult: it is unclear when things are going to plan.
Say how you will do things‘Share best practices in national promotion and dissemination strategies amongst the national partners.’ • The key missing element is how this will be done. Take it further, think it through to a point at which it is measurable.
“to create a pan-European logo for the promotion of fruit and vegetable consumption”“a number of member organisations committed to publishing articles on nutrition”
“[member] will establish best practice guidance on the publication of decisions and drive their implementation by 80% of [its] members in the EU-25 by the end of 2006.”

Inputs
Details
• Often quantitative input indicators are totally missing.
• Of course, it is easier to give figures for some activities than others, but we ask you to give the available figures.“At the [member] 3 people are in charge of running of the project, and additionally around 35 people were involved in different stages of the development of the project from participating members broadcasters. The costs for project: The total budget for the [member’s] project was estimated at: 1,873,843.46 €The amended total budget is: 1,873,568.99 €The requested contribution from the European Commission: 1,491,000.00 €The reported costs until end of contract: 2,055,799.11 €”
• Details of this kind allow monitoring to assess achievements in context.
“[member’s] Director General time – 1.5 months[member’s] Communications Manager time – 0.5 months2 interns time – each 2 months”
• If you are providing figures of time inputs, be precise and separate by job title.
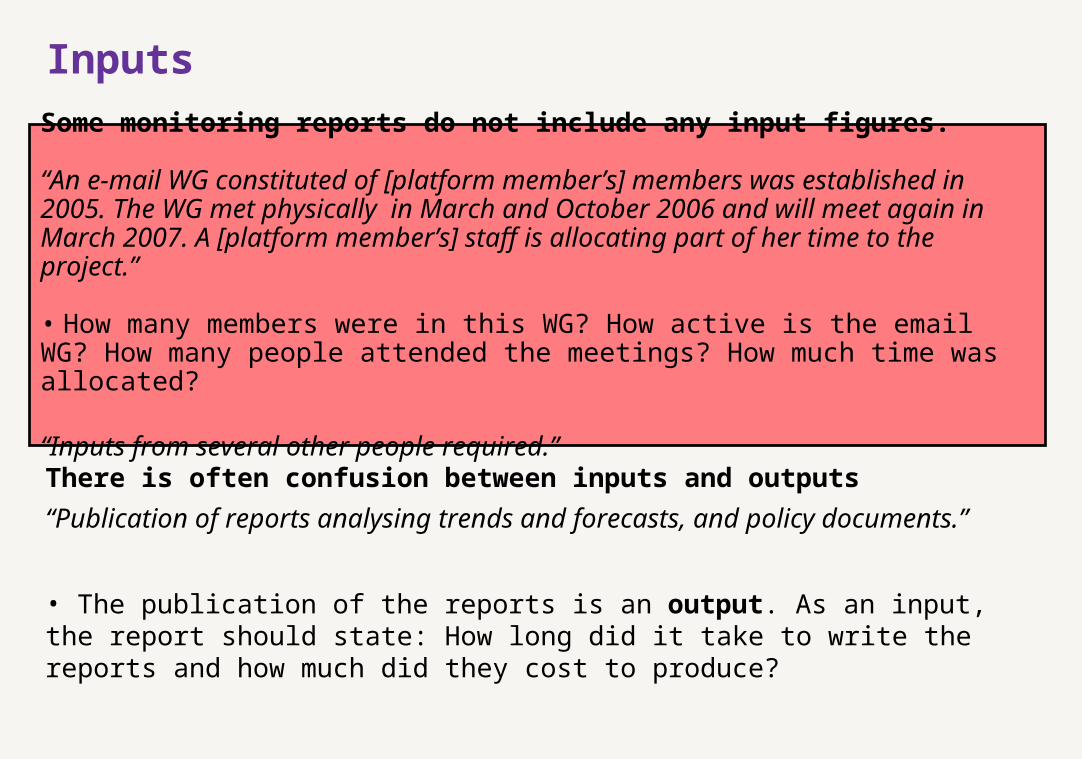
Inputs
Some monitoring reports do not include any input figures.
“An e-mail WG constituted of [platform member’s] members was established in 2005. The WG met physically in March and October 2006 and will meet again in March 2007. A [platform member’s] staff is allocating part of her time to the project.”
• How many members were in this WG? How active is the email WG? How many people attended the meetings? How much time was allocated?
“Inputs from several other people required.”
There is often confusion between inputs and outputs
“Publication of reports analysing trends and forecasts, and policy documents.”
• The publication of the reports is an output. As an input, the report should state: How long did it take to write the reports and how much did they cost to produce?

Outputs
Specific output data, put in context“The Mobile Kitchen visits approximately 15 towns and reaches 10 000 children per year. The one-day training sessions on ethics and consumer choices give children hands-on awareness. It reaches around 100 classes per year. The special two-month schoolchildren programme ‘Danish Championship on sport and spinach’… took place involving 10 000 classes for a total of 250 000 pupils.”
• At every point the outputs are supported by specific quantitative output information that illustrates the scope and reach of the commitment. Always says timescale.
“[Platform member’s] website is estimated to be visited by 85000 users”
• How have these figures been ‘estimated’? Such ambiguity raises questions about the quality of the data.
• Figure of 85000 users is difficult to assess because we don’t know if it is 85000 users every month, every 6 months, every year…

Outputs
What contribution did the Platform make? What did it enable or assist?
• It would aid monitoring if the reports pinpointed exactly how the Platform has helped or enabled the achievement of a commitment’s outputs.
• This means we can judge the Platform’s impact more accurately, since we know that a particular action would not have happened otherwise.
“The report draft will be ready by the German Presidency event on prevention relevant to obesity in February 2007. It will be circulated to all member state governments for comment. It will be peer-reviewed by independent health promotion experts as part of the network group now established....The report will then be a main agenda item at the [Platform members] General Assembly in March 2007 as per the Platform commitment, and will be submitted to the Platform process.None of this would have happened without the establishment of the EU Platform. Therefore the core focus of the network has significantly changed in the period of its participation from September 2005 to March 2007.”
• Although this is good, it would have been even better if it had stated exactly why this would not have happened without the Platform.

Outputs
Show progress where possible“When we decided to implement voluntary nutrition labelling in 2003 only 47% of all EU products carried a nutrition label. Currently, more than 97% of our products in the EU have nutrition information on the labels…100% of our products will have nutrition labelling by the end of March 2007 ”
• Good because charts evidence of progress, which shows impact of initiatives. However, comparison between all EU products / selected products is not exact. • How has your commitment changed things? How has the Platform helped?
“Production of material for trainers and coaches… Production of material for the medical organisations… Promotion material”
• Apart from the lack of detail, it is impossible to know if these are new initiatives – it could be that promotion material was always produced. Impossible to indicate progress.

Overall judgements and suggestions
• Adopting better monitoring practices is not a large or difficult undertaking.
• It is about adopting a ‘monitoring mindset’ that understands what information is required for successful monitoring.
• Provide as much quantitative information as possible – make things measurable.
• But figures alone cannot allow the scale of your commitment to be monitored and appreciated. To do this, give contextual information and figures.
• Best to avoid the phrase “various activities” – state them!

Production of the Second Monitoring Progress Report
Purpose of the report• The report will give an overview of the achievements
produced by the commitments and offer an analysis of members’ monitoring practices.
Progress to date• Between 15.12.06 and 31.01.06 RAND Europe received 5
requests for advice on monitoring reports, which concerned a total of 16 monitoring reports. RAND Europe has responded to all these requests.
• To date, RAND Europe has sent an additional 5 requests for specific information ‘missing' from monitoring reports. Currently, 2 of these requests have been answered.

Structure of the Second Monitoring Progress Report
1. Preface
2. The monitoring process• What is monitoring and why is it important?• Descriptive statistics regarding the monitoring
reports • Overall analysis of monitoring activities of
Platform members – including ‘quality’ assessment
• Obstacles to monitoring often encountered by Platform members
Limitations to the data

Structure of the Second Monitoring Progress Report
3. Achievements Summary of scope of Platform activities Promoting a healthy lifestyle Advertising / Marketing Nutrition information / Nutrition labelling Product Development / Product Reformulation Other areas (including, e.g. research)
4. Conclusions

Questions and comments?