monitoring the impacts of biodiversity projects under the ... · sarah brooks, cordula epple,...
TRANSCRIPT
Sarah Brooks, Cordula Epple, Robert Munroe, Rebecca Mant, Valerie Kapos, Claire Brown and
Elina Väänänen
Monitoring the impacts of biodiversity projects under the International Climate Initiative (IKI):
Recognizing and communicating IKI’s contribution to the Strategic Plan for Biodiversity 2011-2020
BfN-Skripten 387
2014

2
Monitoring the impacts of biodiversity projects under the International Climate
Initiative (IKI)
Recognizing and communicating IKI’s contribution to the Strategic Plan for Biodiversity 2011-2020
Sarah Brooks Cordula Epple Robert Munroe Rebecca Mant
Val Kapos Claire Brown
Elina Väänänen

3
Cover picture: Surveying mangroves. ©Theodora Panayides.
Authors’ address: Sarah Brooks Cordula Epple Robert Munroe Rebecca Mant Val Kapos Claire Brown Elina Väänänen
UNEP-WCMC 219 Huntingdon Road Cambridge CB3 0DL Email: [email protected]
Scientific Supervision at BfN: Gisela Stolpe FG II 5.3, International Academy for Nature Conservation, Isle of Vilm Dr. Ralf Grunewald FG II 5.3, International Academy for Nature Conservation, Isle of Vilm
This publication is included in the literature database “DNL-online” (www.dnl-online.de).
The BfN-Skripten are not available in book trade but can be downloaded in a pdf version from the internet at: http://www.bfn.de/0502_skripten.html
Publisher: Bundesamt für Naturschutz (BfN) Federal Agency for Nature Conservation Konstantinstrasse 110 53179 Bonn, Germany URL: http://www.bfn.de
All rights reserved by BfN.
The publisher takes no guarantee for correctness, details and completeness of statements and views in this report as well as no guarantee for respecting private rights of third parties. Views expressed in this publication are those of the authors and do not necessarily represent those of the publisher.
This work with all its parts is protected by copyright. Any use beyond the strict limits of the copyright law without the con-sent of the publisher is inadmissible and punishable.
Reprint, as well as in extracts, only with permission of Federal Agency for Nature Conservation.
ISBN 978-3-89624-122-1
Bonn-Bad Godesberg 2014

4
Acknowledgements Special thanks to Gisela Stolpe, Ralf Grunewald (both The German Federal Agency for Nature Conservation – Bundesamt für Naturschutz – BfN) and Rudolf Specht (The German Federal Ministry for the Environment, Nature Conservation, Building and Nuclear Safety (Bundesministerium für Umwelt, Naturschutz, Bau and Reaktorsicherheit – BMUB) for their helpful comments on this study. Thanks also to Nicolas Boenisch (WWF Germany) for his useful comments on the draft study and to the participants of the workshop associated with this study.
Citation Brooks, S., Epple, C., Munroe, R., Mant, R., Kapos, V., Brown, C., Väänänen, E. (2014). Monitoring the impacts of biodiversity projects under the International Climate Initiative (IKI): recognising and communicating IKI’s contribution to the Strategic Plan for Biodiversity 2011-2020, UNEP World Conservation Monitoring Centre, Cambridge, UK.
The United Nations Environment Programme World Conservation Monitoring Centre (UNEP-WCMC) is the specialist biodiversity assessment centre of the United Nations Environment Programme (UNEP), the world’s foremost intergovernmental environmental organisation. The Centre has been in operation for over 30 years, combining scientific research with practical policy advice.
The contents of this report do not necessarily reflect the views or policies of UNEP, contributory organisations or editors. The designations employed and the presentations of material in this report do not imply the expression of any opinion whatsoever on the part of UNEP or contributory organisations, editors or publishers concerning the legal status of any country, territory, city area or its authorities, or concerning the delimitation of its frontiers or boundaries or the designation of its name, frontiers or boundaries. The mention of a commercial entity or product in this publication does not imply endorsement by UNEP.

5

6
Contents
1 Introduction ................................................................................................................................... 8
1.1 The International Climate Initiative and study aims ................................................................... 8
1.2 The Convention on Biological Diversity and the Strategic Plan for Biodiversity 2011-2020 ....... 9
1.3 Monitoring project impact ......................................................................................................... 9
1.4 Biodiversity indicators ............................................................................................................ 10
2 Methodology for developing impact monitoring options ............................................................... 12
2.1 Biodiversity Indicator Development Framework ...................................................................... 12
2.2 Understanding the purpose of indicators – reviewing IKI projects and identifying the components of the Aichi Biodiversity Targets ................................................................... 13
2.3 Defining key questions ........................................................................................................... 15
2.4 Identifying potential indicators ................................................................................................ 16
2.5 Contribution to the Strategic Plan for Biodiversity 2011-2020 ................................................. 17
2.6 Workshop ............................................................................................................................... 17
3 Challenges in developing impact monitoring options ................................................................... 19
3.1 Scope of projects ................................................................................................................... 19
3.2 Scope of Aichi Biodiversity Targets ........................................................................................ 20
3.3 Variation between countries in national monitoring, reporting and indicators .......................... 20
3.4 Attribution of impacts .............................................................................................................. 20
3.5 Assessing change in terms of quality as well as quantity ........................................................ 21
4 Proposed biodiversity indicators for projects ............................................................................... 22
5 Recommendations for impact monitoring in IKI biodiversity projects ........................................... 74
6 References ................................................................................................................................. 80
7 Annexes ..................................................................................................................................... 82
7.1 Annex A: List of projects having a primary biodiversity focus and reason to address the Strategic Plan for Biodiversity 2011-2020 ............................................................................... 82
7.2 Annex B: Spreadsheet of potential indicators for each Aichi Biodiversity Target, including those currently not considered IKI priorities (see attached file) ................................ 86
7.3 Annex C: Workshop report (see attached file) ........................................................................ 86

7
Figures Figure 1: The Biodiversity Indicator Development Framework............................................................... 11 Tables Table 1: Projects for which information was available .......................................................................... 13 Table 2: Summary of suggested indicators and data sources .............................................................. 22 Table 3: Suggested Project Indicators for Aichi Biodiversity Target 1 ................................................... 27 Table 4: Suggested Project Indicators for Aichi Biodiversity Target 2 ................................................... 32 Table 5: Suggested Project Indicators for Aichi Biodiversity Target 3 ................................................... 38 Table 6: Suggested Project Indicators for Aichi Biodiversity Target 6 ................................................... 43 Table 7: Suggested Project Indicators for Aichi Biodiversity Target 11 ................................................. 49 Table 8: Suggested Project Indicators for Aichi Biodiversity Target 14 ................................................. 55 Table 9: Suggested Project Indicators for Aichi Biodiversity Target 15 ................................................. 60 Table 10: Suggested Project Indicators for Aichi Biodiversity Target 17 ............................................... 65 Table 11: Suggested Project Indicators for Aichi Biodiversity Target 20 ............................................... 71

8
1 Introduction
1.1 The International Climate Initiative and study aims The International Climate Initiative (IKI) was established in 2008 by the German Federal Ministry for the Environment, Nature Conservation, Building and Nuclear Safety (BMUB). The initiative finances projects in developing and transition countries, and emerging economies within four Focal Areas: (I) mitigating greenhouse gas emissions; (II) adapting to the impacts of climate change; (III) conserving natural carbon sinks with a focus on Reducing Emissions from Deforestation and Forest Degradation (REDD+); and (IV) conserving biological diversity (IKI, 2014). The conserving biological diversity (biodiversity) Focal Area was established after the other areas, in 2011. Whereas Focal Areas I-III have a primary climate focus, Focal Area IV has a primary biodiversity focus, namely to work towards implementation of the Convention on Biological Diversity (CBD) Strategic Plan for Biodiversity 2011-2020 and its Aichi Biodiversity Targets (see section 1.2).
From its launch in 2008 until 2014, BMUB had commissioned more than 411 projects with funding amounting to approximately 1.45 billion Euros (IKI, 2013b). Additional capital contributions by implementing agencies, and co-funding from public sources such as the European Union and the private sector, increases the total financing allocated to IKI projects to 3.45 billion Euros. IKI projects have been implemented in 97 partner countries across the world. The projects are implemented by a range of organisations, including state agencies, non-governmental organizations (NGOs), multilateral organisations, research institutes, foundations and private companies.
There have been several recent and ongoing projects to develop methods for monitoring the impact of IKI on behalf of BMUB. This work has led to the development of a comprehensive proposal for monitoring IKI projects from Focal Areas I, II and III1, as well as a proposed set of biodiversity criteria and related recommendations for compliance monitoring for IKI projects in Focal Areas II and III that involve wetlands and forests (MANT et al., 2014). Nevertheless, IKI has yet to develop a concept for how to monitor and analyse the impacts of projects from Focal Area IV, especially with regard to their contribution to the goals and objectives of the Convention on Biological Diversity (CBD) Strategic Plan for Biodiversity 2011-2020 as agreed in 2010.
Therefore, this study aims to support the development of options for monitoring and communicating the impacts of IKI Focal Area IV projects with relevance to the Strategic Plan for Biodiversity 2011-2020, drawing on the recent and ongoing work on impact monitoring for IKI projects under Focal Areas I-III. Additionally, the study aims to provide an overview of the feasibility of using project impact monitoring to analyse the total impact of the IKI projects on the Strategic Plan for Biodiversity 2011-2020 and for incorporating this into national reporting.
1 ‘Further development of a concept for monitoring and reporting of the International Climate Initiative’ commissioned by the Umweltbundesamt (UBA, German Federal Environment Agency) and conducted by Germanwatch, Wuppertal Institute and Ecofys.

9
1.2 The Convention on Biological Diversity and the Strategic Plan for Biodiversity 2011-2020
The CBD2 entered into force on 29 December 1993, following growing recognition of the value of biodiversity to present and future generations and the ever-increasing threats to species and ecosystems. The Convention has 3 main objectives:
1. The conservation of biological diversity; 2. The sustainable use of the components of biological diversity; 3. The fair and equitable sharing of the benefits arising out of the utilization of genetic resources.
Following the recognised failure to achieve the global 2010 Biodiversity Target, the Strategic Plan for Biodiversity 2011-20203 was adopted at the tenth Conference of the Parties to the CBD, held in Nagoya in 2010. This plan consists of a shared vision, a mission, and 20 Aichi Biodiversity Targets, organised under 5 Strategic Goals. Importantly, this plan provides a framework not only for the biodiversity-related conventions, but for the whole United Nations system.
The main objective for IKI Focal Area IV is to support the implementation of the CBD and, in particular, the Aichi Biodiversity Targets.
1.3 Monitoring project impact Monitoring the impact of projects has two important elements: firstly, monitoring whether a project has the intended impact and meets its primary objectives, and secondly, monitoring whether the project has additional benefits or negative impacts (often referred to as co-benefits and co-costs). Monitoring a project in relation to the primary objective is critical in order to assess progress towards the objectives or goals, for adaptive project management, and to understand the project’s final impact.
For the purposes of this report, impact refers to the project’s impacts related to the Aichi Biodiversity Targets. It is important to note in this context that several of the Aichi Biodiversity Targets are focussed on intermediate outcomes (such as raised awareness of biodiversity values or increased availability of resources for implementing the Strategic Plan), rather than direct impacts of efforts to implement the CBD on biodiversity conservation.
Monitoring is an important component of adaptive management, as it can help project managers ensure their interventions do have the intended impact and do not have negative impacts. Monitoring can support adaptive management by showing if the project is on course to accomplish its intended change, and whether the assumptions made while developing the theory for how the project will have its intended consequence (often referred to as the project ‘Theory of Change’4) are valid. Being able to demonstrate a project’s impact to local communities and other stakeholders can also be important for project engagement.
2 www.cbd.int 3 www.cbd.int/sp/ 4 ‘A Theory of Change defines all building blocks required to bring about a given long-term goal…[and] describes the types of interventions that bring about the outcomes depicted in the pathway of a change map’ (CENTRE FOR THEORY OF CHANGE, 2014).

10
The ability to demonstrate and understand project impacts can also be important for donors, such as BMUB via IKI, to help them ensure that projects are achieving their objectives and using the allocated funding appropriately. Donors can further use this information in order to monitor and account for fund expenditure (and in the case of IKI, the expenditure of public finance). Last but not least, collating the information on whether different projects have their intended impacts can help improve the wider evidence-base regarding whether various types of interventions are effective or not, which can in turn support future project development and the effective allocation of funds.
It is important that projects monitor not just whether their primary objectives have been achieved, but also potential unintended and indirect, positive and negative impacts. Within Focal Area IV, as with other Focal Areas, there is the potential for achieving additional benefits beyond the primary goal of the project. It is also possible for projects, including Focal Area IV projects, to have negative impacts, including on biodiversity. If potential negative impacts have been identified from the outset, efforts should be made to mitigate these impacts, and the effectiveness of these mitigation efforts should be monitored. Ideally, monitoring systems should also be able to identify unanticipated impacts that were not identified during the project development phase (MANT et al., 2014). This study focuses on monitoring the impacts related to the primary objective of IKI projects in Focal Area IV, conserving biodiversity and contributing to the Strategic Plan for Biodiversity 2011-2020. For further information on the issues associated with monitoring for compliance with biodiversity safeguards, and the biodiversity co-costs and co-benefits of IKI projects, please refer to Mant et al. (2014).
1.4 Biodiversity indicators A key component of developing impact monitoring is deciding what to monitor and which factors provide a good indication of the biodiversity impacts that have occurred. These factors should be identified during project planning and the development of a project Theory of Change, in order to select appropriate indicators for monitoring the project’s success. Developing indicators as part of the monitoring process may also advance the understanding of biodiversity issues amongst project developers by stimulating thinking about cause-and-effect relationships and assessment of the likely responsiveness of the indicator to change.
As outlined above, the primary objective of IKI Focal Area IV projects is supporting the Strategic Plan for Biodiversity 2011-2020 and the achievement of the Aichi Biodiversity Targets. A number of potential indicators for monitoring the achievement of Aichi Biodiversity Targets have already been developed and this study draws on such work.
The Biodiversity Indicators Partnership (BIP)5, have identified a number of global biodiversity indicators which track progress towards the global Aichi Biodiversity Targets. The BIP is a global initiative, established in 2007 and currently consisting of over 40 Partners working to promote the development and use of biodiversity indicators. The BIP define an indicator as a measure, based on verifiable data, which conveys information about more than just itself (BIP, 2011). Currently, there are just three Aichi Biodiversity Targets for which no global indicator has been identified, while all the remaining Targets have one or more indicator(s) which help evaluate progress towards their achievement.
5 www.bipindicators.net

11
Indicators for the Aichi Biodiversity Targets have also been proposed by the Secretariat of the CBD. In CBD decision X/2, taken at the tenth Conference of the Parties to the CBD, Parties were urged to revise their National Biodiversity Strategies and Action Plans (NBSAPs) in order to bring them into line with the Strategic Plan for Biodiversity 2011-2020 and to develop national targets and indicators to track their progress. An indicative list of indicators was provided for use as a flexible framework. Parties must report on progress in implementing their NBSAPs, and in achieving their national targets, in their National Reports to the CBD which are due every 4 years.
Finally, there are additional studies, for example, STEPHENSON AND O’CONNOR (2014) which have produced useful indicators for consideration for conservation monitoring related to the Aichi Biodiversity Targets.
12
2 Methodology for developing impact monitoring options
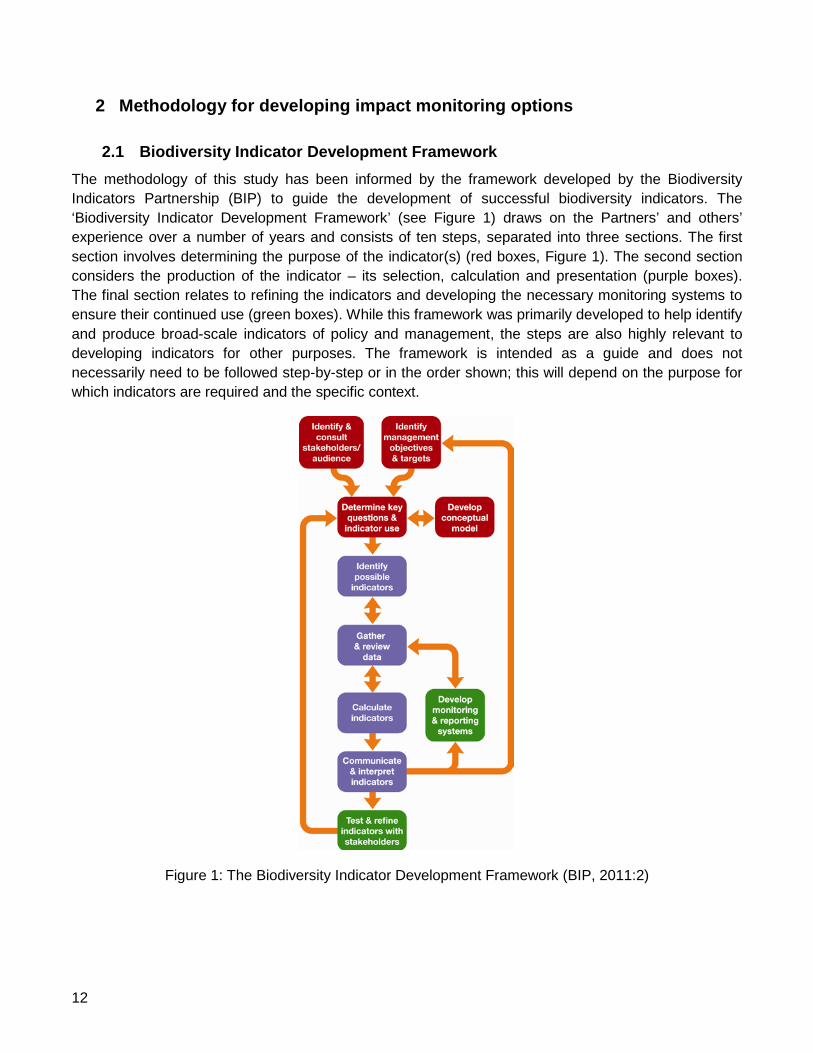
2.1 Biodiversity Indicator Development Framework The methodology of this study has been informed by the framework developed by the Biodiversity Indicators Partnership (BIP) to guide the development of successful biodiversity indicators. The ‘Biodiversity Indicator Development Framework’ (see Figure 1) draws on the Partners’ and others’ experience over a number of years and consists of ten steps, separated into three sections. The first section involves determining the purpose of the indicator(s) (red boxes, Figure 1). The second section considers the production of the indicator – its selection, calculation and presentation (purple boxes). The final section relates to refining the indicators and developing the necessary monitoring systems to ensure their continued use (green boxes). While this framework was primarily developed to help identify and produce broad-scale indicators of policy and management, the steps are also highly relevant to developing indicators for other purposes. The framework is intended as a guide and does not necessarily need to be followed step-by-step or in the order shown; this will depend on the purpose for which indicators are required and the specific context.
Figure 1: The Biodiversity Indicator Development Framework (BIP, 2011:2)

13
2.2 Understanding the purpose of indicators – reviewing IKI projects and identifying the components of the Aichi Biodiversity Targets
Understanding the purpose of indicators is essential so that the indicator fulfils the required use. The primary purpose of impact monitoring for biodiversity projects of the IKI, is to assess progress towards, and achievement of, the projects’ objectives. The main focus of IKI Focal Area IV is the achievement of the Aichi Biodiversity Targets and so there is also an objective of being able to recognize and communicate its contribution to the Strategic Plan for Biodiversity 2011-2020.
In order to identify the main objectives of IKI Focal Area IV projects, a short review of the projects was conducted. The list of projects to consider was provided by BMUB on the basis of the projects having a primary biodiversity focus and reason to address the Strategic Plan for Biodiversity 2011-2020 (see Annex A). This review was mainly based on those projects for which websites and other online information was directly available. Project documents (for example, proposal forms and mid-term reports where applicable) were also available from a number of projects and were reviewed to note existing efforts to monitor biodiversity impact (see Table 1 for a list of projects for which information was available).
Table 1: Projects for which information was available6
Country of implementation
Project title
Indonesia Biodiversity and climate change
Indonesia Developing a resilient and effectively managed network of Marine Protected Areas in the Lesser Sunda Ecoregion.
Malaysia, Philippines, Indonesia
Implementation of a trilateral action plan for the Sulu-Sulawesi Marine Ecoregion
Brazil Consolidating the Brazilian National System of Conservation Units – SNUC
Brazil Integration of climate and biodiversity protection in business
India Participatory Management for Sustainable Use and Conservation of Wetland, Coastal and Marine of Protected Areas
Mexico Protection and sustainable use of coastal and marine biodiversity in the Gulf of California
Philippines Protected Area Management Enhancement in the Philippines
Peru Forest protection and restoration in the Manu Biosphere Reserve
Global Lifeweb – Partnerships for financing biodiversity
Antigua, Barbuda, Dominica, Grenada, St. Lucia, St. Vincent, The Grenadines
Climate-Resilient Eastern Caribbean Marine Conservation Corridor (ECMCC)
6 For more information on each project, see Annex A.

14
Country of implementation
Project title
Brazil Protection of climate and biodiversity in the Mata Atlantica
Brazil Monitoring climate-relevant biodiversity in protected areas
Brazil, India, Mexico, Vietnam
ValuES: Methods for mainstreaming of biodiversity in international cooperation
Fiji, Kiribati, Solomon, Islands, Tonga, Tuvalu, Vanuatu
Marine and coastal biodiversity management in Pacific island states and atolls
Mexico Valuation of Mexico's Protected Areas Climate and Ecosystem Services: a Tool for Innovative Climate Change and Biodiversity Financing
Peru Conservation and sustainable use of biodiversity through Co-Management in the Amazon region
Global Blue Solutions - Implementation of the Strategic Plan of the CBD in marine and coastal conservation
Colombia Strengthening the system of protect areas for the protection of climate and biodiversity
Global Biofin – Building Transformative Policy and Financing Frameworks to Increase Investment in Biodiversity Management
Brazil, Ecuador, Colombia, Peru
Building resilience of the Amazon Biome: Protected Areas as an integrated part of climate change adaptation
Ethiopia Biodiversity and climate change: Community-based concepts for the conservation, management and development of areas of origin of wild coffee
Indonesia, Federated, States of Micronesia, Philippines
Scaling up innovative, community-based protection of coastal biodiversity in Indonesia, Philippines, and Pacific
Global Support to indigenous peoples’ and community conserved areas and territories (ICCAs) through the GEF Small Grants Programme (SGP) as a contribution to the achievement of Targets 11, 14 and 18 of the CBD Aichi 2020 framework
Global Global Nature
Benin Togo
Transboundary biosphere reserve Adjame-Mono
Namibia Resource mobilization for the implementation of the updated biodiversity strategy in Namibia
Philippines Forest and climate protection in Panay
There are 20 Aichi Biodiversity Targets and many of these Targets have multiple components. Therefore, in developing indicators for monitoring project contribution to the Aichi Biodiversity Targets it can be useful to look at these different components in more detail. The review mapped each project to

15
the ‘components’ of each of the 20 Aichi Biodiversity Targets. These components were identified using the ‘Aichi Biodiversity Target Quick Guides’7, which were prepared by the Secretariat of the CBD and explain key terms, highlight implications for national target setting, and identify possible indicators to monitor progress.
For example, Aichi Biodiversity Target 11 states that:
By 2020, at least 17 per cent of terrestrial and inland water, and 10 per cent of coastal and marine areas, especially areas of particular importance for biodiversity and ecosystem services, are conserved through effectively and equitably managed, ecologically representative and well connected systems of protected areas and other effective area-based conservation measures, and integrated into the wider landscapes and seascapes.
This Target can be broken down into five components, namely that protected areas should:
1. Increase in extent; 2. Include areas of particular importance for biodiversity and ecosystem services; 3. Be ecologically representative; 4. Be effectively and equitably managed; 5. Be well-connected.
A project addressing component 1 would require a different indicator to a project addressing component 2, 3, 4 or 5.
For a small number of Aichi Biodiversity Targets, the components of the Target identified by the CBD were found to be very hard to distinguish between at the project level (for example, respecting traditional knowledge and integrating and reflecting traditional knowledge in the implementation of the CBD). In these cases, the similar components were considered together for indicator development. For some Targets, the individual components identified still contained a number of very different elements and were therefore split into simpler components addressing just one main subject.
The review also identified the primary ecosystem type(s) where relevant and classified the project type as policy development, programme design, or site-based implementation, in anticipation that this may affect suitable indicators for different projects.
2.3 Defining key questions Identifying the key questions in relation to what we want to know about each of the Targets can also help develop clear and simple indicators which respond to the user’s needs (BIP, 2011). Therefore, key questions were identified for each of the components of the Aichi Biodiversity Targets. These key questions fell into two categories – firstly, the key questions that the indicators would actually respond to, for example, for Aichi Biodiversity Target 14: ‘are ecosystems providing essential services restored or undergoing restoration?’, secondly, the questions that would be important to answer for each project (and therefore link to project objective identification) in order to specify what the generic proposed
7 https://www.cbd.int/nbsap/training/quick-guides/

16
indicators mean at the project level (henceforth ‘project specific questions’), for example, again for Target 14, ‘which ecosystem services will be assessed?’. In some cases, it may only be possible to answer project specific questions as part of the project, in which case questions should be defined, and a clear commitment should be made to identify the answers as a first step in project implementation.
For example, Aichi Biodiversity Target 15 states that: By 2020, ecosystem resilience and the contribution of biodiversity to carbon stocks has been enhanced, through conservation and restoration, including restoration of at least 15 per cent of degraded ecosystems, thereby contributing to climate change mitigation and adaptation and to combating desertification.
The first component of this Target is the restoration of at least 15 per cent of degraded ecosystems. It is necessary to identify the key question that the indicators would actually respond to: ‘What extent of the identified degraded ecosystem(s) has been restored?’. To refine the indicator, addressing the other category of key question (project-specific question) is necessary as, for example, which ecosystems are degraded as this will be specific to the project area. Therefore the project-specific question would be: ‘Which ecosystems are degraded?’.
Although these key questions have been used to identify indicators in this instance, they could be used to support the development of a project’s Theory of Change and therefore the development of project objectives (for example, restoring a certain amount of a certain degraded ecosystem).
2.4 Identifying potential indicators The IKI biodiversity criteria project (MANT et al., 2014) identified a number of core principles of successful indicators, and these were considered when developing the list of indicators:
Strong relationship between the indicator and the impact on biodiversity. Use of the indicator is supported by the scientific understanding of the impact of planned activities on biodiversity and knowledge of the local context, the data to be used is reliable and verifiable (i.e. it has strong scientific validity). The indicator will respond to a change in the impact on biodiversity of the project within the timeframe required, for example, within the duration of project evaluation (i.e. it has high responsiveness). There are no other factors related to the impact on biodiversity that could be causing the indicator to change (i.e. it has few confounding factors), or changes due to other factors can be isolated. The indicator is indicative of wider changes in biodiversity not just a small aspect (i.e. it provides information on the whole or a large part of the impact).
Data is available: Data can be collected which is reliable and not too expensive or time-consuming to collect or process. The data can be collected at the relevant stages in the project cycle. It can be beneficial if data can continue to be collected after a project has finished.
Indicator is relevant to users’ needs: The indicator is conceptually understandable and can be used for the required needs.
Potential indicators for monitoring IKI project success have been identified for each component of each Aichi Biodiversity Target. The identification of indicators was based on the key questions identified for each Target (see section 2.3), the characteristics of good indicators (above), and by taking into consideration any relevant global indicators brought together by the BIP and relevant national indicators

17
suggested by the CBD. The potential indicators were then reviewed against current projects identified as contributing. The available information for the project was consulted in order to determine whether the suggested indicators related directly to, and were appropriate for, the project activities or objectives associated with the Aichi Biodiversity Target component. For those projects for which monitoring information was available, the indicators used for these projects were also compared with the suggested indicators and, where appropriate, used to refine the suggested indicators.
If for a given component no relevant global indicators had been developed by the BIP, and no relevant or appropriate national indicators were suggested in the Aichi Biodiversity Target Quick Guides, then a rapid internet search was conducted for monitoring methods and indicators that are commonly used for assessing the subject addressed in the component.
Where multiple indicators were identified for one component, feedback from the consultation workshop on this work (see section 2.6), as well as further consideration of the feasibility of monitoring and the applicability to aggregation of standard indicators for each Aichi Biodiversity Target, was used to identify indicators that could be part of a standard set. These are shown in bold in Table 2, as well as in the tables (Tables 3-11) of suggested project indicators under each Target, with further information provided under the headings ‘Feasibility of having standard indicators across IKI projects’ and ‘Potential for aggregating the contribution of all IKI Focal Area IV projects to the Strategic Plan for Biodiversity 2011-2020’ for each Target.
Only Aichi Biodiversity Targets identified as priorities for IKI by BMUB have been included in detail in this document. However, indicators have been identified where feasible and appropriate for all components of all twenty Targets in Annex B.
2.5 Contribution to the Strategic Plan for Biodiversity 2011-2020 For each of the indicators identified above, and taking into account the range of projects for which details were available, the potential for assessing overall cumulative contribution to the Strategic Plan for Biodiversity 2011-2020 was evaluated and recommendations made where feasible. The different indicators for individual components were assessed and any commonalities were identified (for example, two indicators in which impact would be measured as a measure of area). Suggestions were made as to whether aggregating these figures would result in a useful and meaningful figure.
2.6 Workshop In order to refine the list of proposed indicators and the assessment of the feasibility of using project monitoring to recognize and communicate IKI’s contribution to the Strategic Plan for Biodiversity 2011-2020, a workshop was held on Vilm from 19th-22nd June 2014. The workshop solicited the opinions of experts and project managers on a draft of the present study through discussions on the following questions:
(i) is the methodology for developing the suggested indicators sound? (ii) do the suggested indicators meet the principles of effective indicators? (iii) are the suggested indicators practical for IKI projects? (iv) can the information gathered for the suggested indicators be used to analyse the total impact of
the IKI projects on the Strategic Plan for Biodiversity 2011-2020?

18
(v) can the information gathered for the suggested indicators contribute to national reporting?
Recommendations on the options for impact monitoring within IKI Focal Area IV projects were also made with regard to procedural issues, i.e., whether projects should be requested to use a certain set of standard indicators, or whether they should be given more flexibility.
The results of the workshop (the comments and observations made by participants) fed into the analysis of challenges in developing a system of impact monitoring, the list of suggested indicators, and the final recommendations presented in the following sections of this study. The full workshop report is included in Annex C.

19
3 Challenges in developing impact monitoring options
A number of challenges arose in the process of developing options for measuring the cumulative impact of IKI’s contribution to the achievement of the Strategic Plan for Biodiversity 2011-2020. Through reviewing IKI projects (see section 2.2), identifying components of the Aichi Biodiversity Targets (see section 2.2), developing potential standard indicators (see section 2.3 and 2.4), and workshop discussions (see section 2.6), the following challenges were identified: the way in which projects contribute to the Target(s) will vary (section 3.1 below); the breadth of scope of individual Targets is large (section 3.2); assessing the potential for project indicators, or the data underpinning them, to feed into national-level indicators, is very much dependent on national context (section 3.3); attribution of impacts is difficult when IKI projects are likely to contribute to the achievement of biodiversity-related goals together with a wide range of other relevant actors (section 3.4); and progress towards biodiversity-related goals is often difficult to capture quantitatively (section 3.5).
3.1 Scope of projects The breadth of project scopes under IKI Focal Area IV is a primary challenge to the development of standard indicators for measuring the cumulative impact of IKI’s contribution to the achievement of the Strategic Plan for Biodiversity 2011-2020. In addition to the range of Aichi Biodiversity Targets that projects can contribute to (as considered below, see section 3.1), the way in which projects contribute to the Target(s) will vary. For example, for projects contributing to Aichi Biodiversity Target 11 (increasing the area conserved through effective and equitably managed, ecologically representative and well-connected systems of protected areas) the means of measuring this contribution will depend on whether the project is focusing on expanding the protected area network, or whether it aims to increase the effective management of the protected area network.
In addition, the breadth of project scopes means that projects work at a variety of levels. While some projects pertain to ‘on the ground’ project implementation, for example using the same Target as above, improving the management of a specific protected area, others aim to improve protected area effectiveness by working at the policy level. Other projects also aim to implement a funding mechanism. These different levels of projects present a challenge to monitoring impact in a consistent and coherent way, as well as to aggregating monitoring results in a meaningful way across projects.
Moreover, the scale of the projects in terms of funding varies, meaning more or less resources can be dedicated to monitoring (assuming that a certain percentage of project resources will be used for monitoring).
Finally, the different timeframes of projects (for example, typically 3-5 years), and the varying timescales of the intended impact, pose a challenge to determining monitoring requirements. For example, a habitat restoration project could take decades to achieve its intended results, while a project aiming to raise awareness of biodiversity could be able to identify impact immediately after a communication and outreach event or process.

20
3.2 Scope of Aichi Biodiversity Targets The Aichi Biodiversity Targets themselves are also extremely broad in scope. For example, Target 5 aims to reduce the loss of natural habitats, including forest, and also reduce degradation and fragmentation. Firstly, this Target addresses three separate concepts – habitat loss, degradation and fragmentation, all of which can require a different metric. This breadth of scope is not an issue in itself, but poses a potential problem for finding a single indicator that assesses progress towards each Aichi Biodiversity Target. For this reason, in this study, each Target was broken down into its constituent components (see section 2.2).
The scope of the Aichi Biodiversity Targets also affects the feasibility of assessing the contribution to the Strategic Plan for Biodiversity 2011-2020. Aggregating projects’ contribution to two different components of the same Target may not be straightforward – each could require a very different metric to measure impact.
The different subjects addressed by the Aichi Biodiversity Targets also have very different relevant timescales, and in a manner similar to that mentioned in section 3.1 this poses a challenge for determining monitoring requirements. For example, activities contributing to Target 1 (relating to public awareness of biodiversity) may have immediate impact among local populations. However, projects contributing to Target 15 by aiming to restore ecosystems, may take decades to achieve their full objectives and impact. Another issue posed by the subjects tackled by the different Aichi Biodiversity Targets is that certain subjects are more conducive to process indicators rather than impact indicators. This is particularly true of the Targets under Strategic Goal A, dealing with addressing the underlying causes of biodiversity loss, and those under Strategic Goal E, aiming to enhance implementation.
3.3 Variation between countries in national monitoring, reporting and indicators With regards to assessing the potential for project indicators, or the data underpinning them, to feed into national-level indicators, this is very much dependent on national context and will vary between projects. While Parties to the CBD are encouraged to make use of the Indicative List of Indicators adopted at the eleventh Conference of the Parties to the CBD, this is merely a flexible framework and is not prescriptive as to the indicators that each Party should use. Moreover, national targets are set primarily in accordance with national context and priorities, which will vary greatly from one country to another.
3.4 Attribution of impacts Under most circumstances, IKI projects will contribute to the achievement of biodiversity-related goals together with a wide range of other relevant actors such as government institutions, civil society organizations, private stakeholders and/or the implementers of projects funded by other donors. Generally, it becomes harder to ascribe observed change to the activities of a specific project or donor when considering large areas of interest and change, and the further along one moves on the impact chain towards actual changes in land management and the status of biodiversity. As with all impact monitoring, there may also be external confounding factors (such as general economic trends or extreme climate events) that affect the indicator values. If all changes in indicator values are interpreted as showing a project impact, this might lead to wrong assumptions. There is also a risk of double counting if several actors report on the same figures (for example, in communications to the CBD

21
Secretariat). Finding a way to address and communicate on the attribution of impacts is therefore very important to the development of a sound monitoring system with the aim of helping donors ensure that projects are achieving their objectives and using the allocated funding appropriately.
3.5 Assessing change in terms of quality as well as quantity Quantitative indicators often have the advantage of being easy to standardize, present and communicate. Using some kind of quantitative measures is also a condition for aggregating monitoring results across different projects. However, it is often difficult to capture the amount of progress towards biodiversity-related goals that an intervention has achieved merely by presenting quantitative figures. For example, a small but well-planned and strategically located expansion of a protected area may provide higher biodiversity benefits than a larger expansion in a less suitable location. There may thus be a risk of misinterpretation if quantitative indicator values are not appropriately analysed, put into context and communicated.

22
4 Proposed biodiversity indicators for projects
This section draws on the information given in the Aichi Biodiversity Target Quick Guides and the BIP global indicators in order to identify potential project-level indicators for each of the IKI priority Aichi Biodiversity Targets. It also assesses the feasibility of having standard indicators across projects. Finally, it assesses the potential for using project-level indicators and data to assess the overall contribution of IKI Focal Area IV projects to the Strategic Plan for Biodiversity 2011-2020, and within project country national reporting to the CBD.
Table 2 is a summary table of suggested indicators and data sources (suggested standard indicators for each Target in bold).
Table 2: Summary of suggested indicators and data sources
Aichi Biodiversity Target: Indicators:
Target 1: By 2020, at the latest, people are aware of the values of biodiversity and the steps they can take to conserve and use it sustainably.
Number/Percentage of people in project area/directly impacted by the project aware of the values of biodiversity Number/Percentage of people in project area/directly impacted by the project aware of steps they can take to conserve biodiversity and use it sustainably Number/Percentage of people in project area/directly impacted by the project changing behaviour (subcategories for degree of change, e.g. major shift in land-use/ecosystem management and/or livelihood strategies, changes in consumption patterns) to conserve biodiversity and use it sustainably
Target 2: By 2020, at the latest, biodiversity values have been integrated into national and local development and poverty reduction strategies and planning processes and are being incorporated into national accounting, as appropriate, and reporting systems.
Trends in number of national development strategies incorporating (subcategories for incorporating , e.g. support provided, integration into sectoral policies/budgets) biodiversity and ecosystem service values that have been supported by the project * Trends in number of local development strategies incorporating biodiversity and ecosystem service values that have been supported by the project Trends in number of national poverty reduction strategies incorporating biodiversity and ecosystem service values that have been supported by the project * Trends in number of local poverty reduction strategies incorporating biodiversity and ecosystem service values that have been supported by the project Trends in number of national planning processes (e.g. sectoral strategies and/or spatial planning processes) incorporating biodiversity and ecosystem service values that have been supported by the project *
Target 2: By 2020 at the latest biodiversity values have been integrated into Trends in number of local planning processes (e.g. sectoral strategies

23
national and local development and poverty reduction strategies and planning processes and are being incorporated into national accounting, as appropriate, and reporting systems.
and/or spatial planning processes) incorporating biodiversity and ecosystem service values that have been supported by the project Trends in number of national accounting systems incorporating biodiversity and ecosystem service values and using project information * Trends in number of national reporting systems incorporating biodiversity and ecosystem service values that have been supported by the project * Trends in number of assessments of biodiversity values in the project area as a consequence of project activities
Target 3: By 2020, at the latest, incentives, including subsidies, harmful to biodiversity are eliminated, phased out or reformed in order to minimize or avoid negative impacts, and positive incentives for the conservation and sustainable use of biodiversity are developed and applied, consistent and in harmony with the Convention and other relevant international obligations, taking into account national socio economic conditions.
Number/Percentage of identified incentives harmful to biodiversity eliminated/in the process of being eliminated/reformed in the project area as a consequence of project activities Monetary total of harmful incentives to biodiversity eliminated/in the process of being eliminated/reformed in the project area as a consequence of project activities Number of people whose well-being benefits from positive incentives (disaggregated by scheme) for the conservation and sustainable use of biodiversity in the project area as a consequence of project activities Area covered by PES schemes and other area-based incentive schemes (disaggregated by scheme) supported by the project in the project area Number of people enrolled in stewardship schemes
Target 6: By 2020 all fish and invertebrate stocks and aquatic plants are managed and harvested sustainably, legally and applying ecosystem based approaches, so that overfishing is avoided, recovery plans and measures are in place for all depleted species, fisheries have no significant adverse impacts on threatened species and vulnerable ecosystems and the impacts of fisheries on stocks, species and ecosystems are within safe ecological limits.
Percentage of fisheries in project area certified by MSC as a consequence of project activities Annual production of MSC certified fisheries (certified as a consequence of project activities) in tonnes in the project area Proportion of fish stocks within safe biological/ecological limits in the project area Proportion and number of depleted target and bycatch species with recovery plans and measures in place in the project area as a consequence of project activities Trends in area, frequency, and/or intensity of destructive fishing practices in the project area as a consequence of project activities Population trends in target and bycatch aquatic species in the project area Trends in catch per unit effort in the project area for given fishing techniques Marine Trophic Index in the project area
Target 11: By 2020, at least 17 per cent of terrestrial and inland water areas and 10 per cent of coastal and marine areas, especially areas of particular importance for biodiversity and ecosystem services, are conserved through effectively and equitably managed, ecologically representative and well-connected systems of protected areas and other effective area-based conservation measures, and integrated into the wider landscape and seascape.
Extent of terrestrial/marine protected area coverage achieved with support from the project Percentage of areas identified as important for biodiversity/ecosystem services under protection as a consequence of the project Improvements in ecological representativeness of protected areas achieved with support from the project as assessed by hectares of nationally underrepresented ecosystems newly protected Changes in protected areas management effectiveness achieved with support from the project
Target 11: By 2020, at least 17 per cent of terrestrial and inland water areas and 10 per cent of coastal and marine areas, especially areas of particular
Trends in the connectivity of protected areas (as measured by degree of habitat fragmentation in surrounding area, e.g. hectares of habitat in areas

24
importance for biodiversity and ecosystem services, are conserved through effectively and equitably managed, ecologically representative and well-connected systems of protected areas and other effective area-based conservation measures, and integrated into the wider landscape and seascape.
of important for connectivity in improved condition due to project activities; possibility of movement between protected areas and habitat fragments outside of species; isolation of protected areas from areas of similar habitat) as a consequence of project activities
Target 14: By 2020, ecosystems that provide essential services, including services related to water, and contribute to health, livelihoods and well-being, are restored and safeguarded, taking into account the needs of women, indigenous and local communities, and the poor and vulnerable.
Area of different ecosystem types undergoing restoration/having been restored and/or safeguarded as a consequence of project activities Number of people benefiting from services (subcategorised by type, e.g. provisioning, regulatory, cultural) provided by safeguarded/restored (subcategories for degree of restoration: e.g. partial, full restoration) ecosystems as a consequence of project activities Trends in income/well-being of people whose livelihoods depend directly on ecosystems within project area as a consequence of project activities Trends in stock of identified ecosystem services within and outside project area (e.g. products that can be harvested at sustainable levels, levels of carbon storage and sequestration) as a consequence of project activities Value of services provided by safeguarded/restored ecosystems supported by project (disaggregated by beneficiaries, subcategories would be required for beneficiaries: e.g. local farmers, or agricultural sector)
Target 15: By 2020, ecosystem resilience and the contribution of biodiversity to carbon stocks have been enhanced, through conservation and restoration, including restoration of at least 15 per cent of degraded ecosystems, thereby contributing to climate change mitigation and adaptation and to combating desertification.
Status and trends in extent and condition of ecosystems that provide high carbon storage as a consequence of project activities Trends in carbon stored as a consequence of project activities Trends in proportion and area of degraded habitats as a consequence of project activities Trends in proportion and area of degraded ecosystems (that provide services important for climate change adaptation e.g. hydrological regulation) restored or under restoration as a consequence of project activities Trends in proportion of land affected by desertification as a consequence of project activities Trends in adaptive capacity to climate change impacts (subcategories of adaptive capacity include: area of ecosystem providing essential services for adaptation made more resilient to degradation; area covered by improved governance system that allows adaptive management of natural resources)
Target 17: By 2015 each Party has developed, adopted as a policy instrument, and has commenced implementing an effective, participatory and updated national biodiversity strategy and action plan.
Status of NBSAPs (in project countries) that have been supported by the project Quality of NBSAPs as confirmed by peer-review (when available) Participation in NBSAP revision as a consequence of project activities Alignment of NBSAP with Strategic Plan for Biodiversity 2011-2020 (including national targets and indicators) as a consequence of project activities
Target 17: By 2015 each Party has developed, adopted as a policy instrument, and has commenced implementing an effective, participatory
Progress in implementation of NBSAP as a consequence of project activities Budget allocation for NBSAP implementation
25
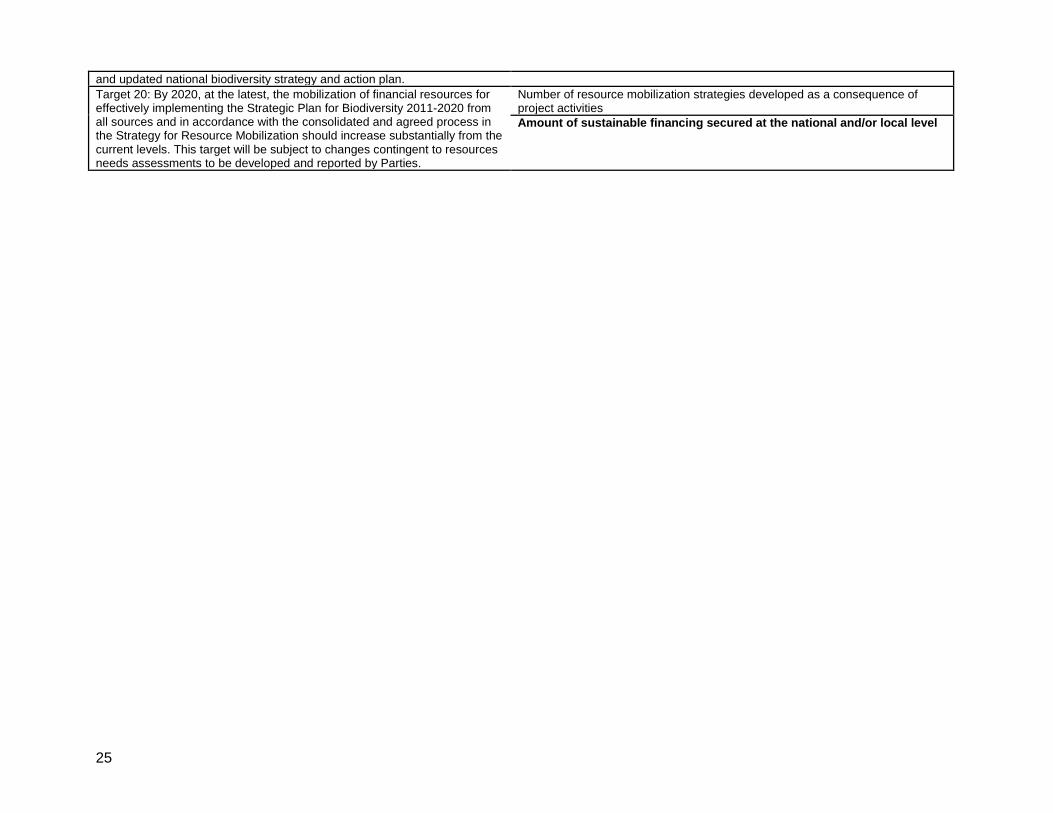
and updated national biodiversity strategy and action plan. Target 20: By 2020, at the latest, the mobilization of financial resources for effectively implementing the Strategic Plan for Biodiversity 2011-2020 from all sources and in accordance with the consolidated and agreed process in the Strategy for Resource Mobilization should increase substantially from the current levels. This target will be subject to changes contingent to resources needs assessments to be developed and reported by Parties.
Number of resource mobilization strategies developed as a consequence of project activities Amount of sustainable financing secured at the national and/or local level

26
Aichi Biodiversity Target 1: By 2020, at the latest, people are aware of the values of biodiversity and the steps they can take to conserve and use it sustainably.
Components:
• People are aware of the values of biodiversity • People are aware of the actions they can take to conserve and sustainably use biodiversity
Project-specific questions:
• What are the values of biodiversity to the project stakeholders? • What are the steps people can take to conserve biodiversity and use it sustainably? • How has the project defined awareness? • Who is impacted by the project?
Key questions:
• How many people are aware of the values of biodiversity? • How many people are aware of the steps that they can take to conserve biodiversity and use it sustainably?
Global Indicators:
• Biodiversity Barometer.
This is a survey carried out in 11 countries asking questions around respondents’ awareness and understanding of the term biodiversity among other subjects. National-level projects may be able to contribute to this indicator by using the same sampling methodology and asking the same short set of biodiversity-related questions. However, for projects at the sub-national scale, this would not be possible. Therefore, while the global indicator is useful as a guide, it is not necessary to fully emulate this for project level surveys, which can be better designed to respond specifically to the two components of Aichi Biodiversity Target 1.
Possible National Indicators suggested by CBD (in the Aichi Biodiversity Target Quick Guides):
• Trends in awareness and attitudes to biodiversity • Trends in public engagement with biodiversity • Trends in communication programmes and actions promoting social corporate responsibility

27
Table 3: Suggested Project Indicators for Aichi Biodiversity Target 1
Indicators: Data required: Possible data sources:
Indicator-specific notes:
Number/Percentage of people in project area/ directly impacted by the project aware of the values of biodiversity
Total number of people in project area/ directly impacted by project activities
Number aware of values (e.g. to human well-being or monetary values) of biodiversity
Unless national or local level surveys are carried out in the project area, project specific surveys will be required.
The proposed indicators would require standardized surveys to be carried out on project stakeholders. It will be necessary for the project to define stakeholders from the outset, which will depend on the scope and scale of the project. In general, these will be those identified as being impacted by the project. Surveys should be carried out using an appropriate sampling methodology. A knowledge, attitude and practice (KAP) survey may be an appropriate survey type, as these are generally considered cost-effective methods of measuring human knowledge, attitudes and practice in response to a specific method. Such a method covers the identification of the ‘domain’ (the subject of the study, in this case the values of biodiversity, definition of awareness etc.), the target audience, sampling methods and analysis and reporting methods. While reporting the indicator as a ‘percentage’ would be more relevant for a direct project indicator, ‘number’ would facilitate aggregation of project impacts, and would be easily produced by projects reporting on percentage of people aware of biodiversity values or steps they can take. Questions should focus on the two components of the Target: people’s awareness of ‘biodiversity’ as a concept, as well as of the values of biodiversity and of actions they can take to conserve biodiversity and use it sustainably. Measuring the incidence of behavioural change could provide a more cost-effective alternative to measuring awareness as it is likely that the project will be collecting this information for purposes of project management. In addition, there are a number of other questions that could be included to gauge respondents’ awareness of biodiversity as a concept. Surveys can be relatively resource intensive to conduct, so an appropriate number of people should be established for each survey early on in the project, relative to the size and scale of the project and its anticipated impact on public awareness of biodiversity. Respondents should also be identified early on as those who will be impacted by the project activities (not necessarily the direct beneficiaries alone). Frequency of surveys will depend on the length of the project; in all cases a baseline survey and a project-end survey would be required, and mid-term surveys should be completed in order to aid adaptive management. These indicators are examples where attribution of project impact may be difficult to establish. For example, there could be cases
Number/Percentage of people in project area/ directly impacted by the project, aware of steps they can take to conserve biodiversity and use it sustainably
Total number of people in project area/ directly impacted by project activities
Number aware of steps they can take to conserve biodiversity and use it sustainably
Unless national or local level surveys are carried out in the project area, project specific surveys will be required.

28
Indicators: Data required: Possible data sources:
Indicator-specific notes:
where awareness raising activities by different projects target the same people and raise awareness of different aspects of biodiversity-related issues.
Number/Percentage of people in project area/ directly impacted by the project changing behaviour (subcategories for degree of change, e.g. major shift in land-use/ecosystem management and/or livelihood strategies, changes in consumption patterns) to conserve biodiversity and use it sustainably
Total number of people in project area/ directly impacted by project activities
Number that have changed behaviour
Unless national or local level surveys are carried out in the project area, project specific surveys will be required.
As above. In addition, if choosing subcategories for degree of change it should be recognised that the likes of ‘major shift in land-use/ecosystem management and/or livelihood strategies’, is likely to require measurement over a long period.
BOLD – suggested standard indicators

29
Contribution of Project Indicators for tracking contribution to the Strategic Plan for Biodiversity 2011-2020:
Feasibility of having standard indicators across IKI projects
In many ways, the two components of Aichi Biodiversity Target 1 and the suggested indicators seem to present a relatively straightforward option for having standard indicators across projects. Variations in project timescales and activities may mean that the frequency of monitoring is not common across all projects, and the answers that would be taken to mean that the respondent is aware of biodiversity and its values would differ between projects. However, broadly it seems feasible that all projects contributing to Target 1 include at least the two key questions outlined above, and ideally further questions on the respondent’s understanding and appreciation of biodiversity (perhaps reflected in behavioural change), albeit potentially using different sampling techniques and at different time-intervals. One or both of the proposed indicators seems appropriate and feasible for all of the projects reviewed that were mapped to Aichi Biodiversity Target 1.
Survey questions could potentially be standardized for all projects, but the interpretation of the answers would have to depend on the project. For example, answers to ‘how can you conserve biodiversity?’ may be very different between respondents in a coastal fishing village to respondents in an urban environment, and whether the respondent was considered ‘aware’ of values would therefore depend on the specific context.
Potential for aggregating the contribution of all IKI Focal Area IV projects to the Strategic Plan for Biodiversity 2011-2020
For national-level projects that have used a similar sampling technique and have also asked (among others) the same questions as in the Biodiversity Barometer, this information could potentially contribute directly to the global indicator, for which data is currently only collected in 11 countries worldwide.
• Number of people with raised awareness of values of biodiversity due to IKI project activities • Number of people with raised awareness of steps to conserve/use biodiversity sustainably due to IKI project activities
Potential for using the indicators/information in national reporting
For many countries, public awareness of biodiversity is a new subject area, and few have previously attempted to monitor this. Therefore, if the project indicator, and in particular the survey questions, are developed in close coordination with relevant Ministries and Agencies, the data collected could feed into the national indicator and inform national reporting. Exactly how would be dependent on the national target adopted. Baseline project surveys could also be of use at the national level. However, particular care would need to be taken with sampling methodology as that used for a national indicator is likely to be very different to that used for a project at a sub-national scale.

30
If a national indicator for a national target for Aichi Biodiversity Target 1 already exists at the national level, it would need to be verified on a project-by-project basis how any project monitoring could feed into this.

31
Aichi Biodiversity Target 2: By 2020, at the latest, biodiversity values have been integrated into national and local development and poverty reduction strategies and planning processes and are being incorporated into national accounting, as appropriate, and reporting systems.
Components:
• Integrating biodiversity values into national and local development strategies • Integrating biodiversity values into national and local poverty reduction strategies • Integrating biodiversity values into national and local planning process • Integrating biodiversity values into national accounting • Integrating biodiversity values into reporting systems
Project-specific questions:
• What relevant policies and plans exist that the project is trying to influence? Or what is the nature of the policies and plans that the project is trying to influence (if specific policies and plans are not known for example at the project outset).
• What kind of influence can the project have? • Will the project have the intended influence over the project timeframe? • Which values of biodiversity are relevant? For which does data exist?
Key Questions:
• Does the country's national development strategy explicitly address biodiversity values? • What proportion of local development strategies explicitly address biodiversity values? • Does the country's national poverty reduction strategy explicitly address biodiversity values? • Do the country's national planning processes explicitly address biodiversity values? • What proportion of local planning processes explicitly address biodiversity values? • Do national accounts incorporate biodiversity values? • Do national reporting systems explicitly address biodiversity values?
Global indicators:
No global indicators currently exist to monitor progress towards Aichi Biodiversity Target 2

32
Possible National Indicators suggested by CBD:
• Trends in incorporating natural resource, biodiversity, and ecosystem service values into national accounting systems • Trends in number of assessments of biodiversity values, in accordance with the Convention • Trends in guidelines and applications of economic appraisal tools • Trends in integration of biodiversity and ecosystem service values into sectoral and development policies • Trends in policies considering biodiversity and ecosystem services in environmental impact assessment and strategic
environmental assessment
Table 4: Suggested Project Indicators for Aichi Biodiversity Target 2
Indicators: Data required: Possible data sources:
Trends in number of national development strategies incorporating (subcategories for incorporating, e.g. support provided, integration into sectoral policies/budgets) biodiversity and ecosystem service values that have been supported by the project *
Number of focal countries of project that do have a development strategy
Number of national development plans incorporating biodiversity and ecosystem service values
Number of strategies that the project has contributed to
Expenditure review; review of national development strategy(ies)
Trends in number of local development strategies incorporating biodiversity and ecosystem service values that have been supported by the project
Number of local development strategies identified by project
Number of local development strategies incorporating biodiversity and ecosystem service values
Number of, and area covered by, strategies that the project has contributed to
Review of relevant local development strategies
Trends in number of national poverty reduction strategies incorporating biodiversity and ecosystem service values that have been supported by the project *
Number of focal countries of project that do have a poverty reduction strategy
Number of poverty reduction strategies incorporating biodiversity and ecosystem service values
Number of strategies that the project has contributed to
Review of relevant national poverty reduction strategies
Trends in number of local poverty reduction strategies incorporating biodiversity and ecosystem service values that have been supported by the project
Number of local poverty reduction strategies identified by project
Number of local poverty reduction strategies incorporating biodiversity and ecosystem service values
Number of, and area covered by, strategies that the project has contributed to
Review of relevant local poverty reduction strategies
Trends in number of national planning processes (e.g. sectoral strategies and/or spatial planning processes) incorporating biodiversity and ecosystem service values that have been supported by the project *
Number of focal countries of project that do have relevant national planning processes
Number of relevant planning processes incorporating biodiversity and ecosystem service values
Number of strategies that the project has contributed to
Review of relevant national planning processes
Trends in number of local planning processes (e.g. sectoral strategies and/or spatial planning processes) incorporating biodiversity and
Number of local planning processes identified by project
Number of local planning processes incorporating biodiversity and
Number of, and area covered by, processes that the
Review of relevant local planning processes

33
Indicators: Data required: Possible data sources: ecosystem service values that have been supported by the project
ecosystem service values
project has contributed to
Trends in number of national accounting systems incorporating biodiversity and ecosystem service values and using project information *
Number of focal countries of project
Number of national accounts incorporating biodiversity and ecosystem service values
Number of national accounts using project information
Review of relevant national accounting systems
Trends in number of national reporting systems incorporating biodiversity and ecosystem service values that have been supported by the project *
Number of focal countries of project
Number of national reporting systems incorporating biodiversity and ecosystem service values
Number of systems using project information
Review of relevant national reporting systems (e.g. national statistical institutes)
Trends in number of assessments of biodiversity values in the project area as a consequence of project activities
Number of focal countries of project with assessments of biodiversity values
Number of site-based, national or regional assessments of biodiversity values
Inventory of relevant assessments
* If the project focuses on just one country rather than several, then these will be yes/no answers
BOLD – suggested standard indicators

34
General notes on the ‘Suggested Project Indicators’ above:
The incorporation of biodiversity concerns into poverty reduction or development strategies, planning processes, national accounts and national reporting systems does not necessarily imply that these have been adequately addressed. However, measuring the adequacy of their incorporation is highly complex, and little information exists around this subject, let alone consensus on how best to measure this. ‘Incorporation’ could be defined at different levels. It may consist of simple references within the context of the plan, but it could be a more detailed inclusion within action plans, or even result in the allocation of budget to a biodiversity-related area. Therefore, projects could assess the incorporation at different levels.
Additionally, measuring the impact of this incorporation itself is extremely complex, given the number of confounding factors and the potentially long timescale for the consideration of biodiversity and ecosystem services in national policies and plans to have ‘on-the-ground’ impact. Work is currently ongoing under the project ‘NBSAPs 2.08’ funded by the UK Government’s Darwin Initiative and co-funded by UKAID. This project aims to support biodiversity mainstreaming in four target countries, and has produced a number of tools and resources to support biodiversity mainstreaming. In addition, in 2014 the project will consider impacts of progress and impact for mainstreaming biodiversity. The results of this work may be of use to projects contributing to Aichi Biodiversity Target 2.
As a result of the inherent complexities described above, a number of relatively simple indicators are proposed. For these indicators, projects must first explicitly identify local or national plans or strategies that are relevant to the project activities and aims. The appropriate indicator for each component of the Target will depend on the scale of the project. For a project working across a number of countries and aiming to integrate biodiversity concerns into national development strategies, the number of national strategies addressing biodiversity will be a useful indicator of impact. However, for a project working at the sub-national or national scale, this indicator may not be helpful. For national-scale projects addressing the national development, poverty reduction or planning processes, the indicator may be a simple ‘yes/no’ answer.
It should be noted that given the complexity of procedures to amend policies and plans, particularly at the national level, this can be a very slow process and so results may only be seen outside of the project timeframe. Therefore, for such projects, narrative descriptions and any indicators or information showing that these procedures are underway would also be of value.
It is important to recognise from the outset that the incorporation of biodiversity and ecosystem service values into policies and plans may not necessarily be a result of the project alone. It may be helpful to identify other possible external factors influencing this inclusion. The ultimate aim is that relevant policies and plans recognise the value of biodiversity and ecosystem services, and therefore if they do then this in itself is a measure of progress. It could be suggested however that, in order to fully attribute this incorporation of values to the project activities, direct reference to the project, or use of its results, in the policies, plans, strategies and systems, would demonstrate a clearer relationship between the project activities and the attributed impact. Nonetheless, if there
8 http://povertyandconservation.info/en/pages/biodiversity-poverty-mainstreaming-nbsaps

35
is no direct reference to the project or its results, this does not necessarily mean that the project has not had an impact. The project could still have been the main driver of the inclusion of biodiversity and ecosystem services in policies and plans; the lack of direct reference simply means that this is difficult to state conclusively. In addition, a lack of reference may also be considered a positive result, as this demonstrates full integration and collaboration by the project team with country agencies and institutions. In order to overcome this difficulty, process indicators could be used related to the number of policy meetings attended and whether a strategy for policy influence is in place, accompanied by descriptions of how the project engage will/has engaged with policy and strategic development.
Contribution of Project Indicators to the Strategic Plan for Biodiversity 2011-2020:
Feasibility of having standard indicators across projects
Aichi Biodiversity Target 2 addresses a range of policies and plans at both the national and sub-national scales. Allowing for this, it seems reasonably feasible that projects contributing to this Target could be requested to produce the relevant indicators of the suite suggested above. It should be acknowledged that direct allusions to the IKI-funded project or to its results should be taken as the primary indicator of project impact. However, if this is not available, the remaining indicators could be taken as sufficient, ideally with some qualitative evidence that the project has had a direct contribution to the integration of biodiversity and ecosystem service values into the relevant policies and plans.
Potential for aggregating the contribution of all IKI Focal Area IV projects to the Strategic Plan for Biodiversity 2011-2020
The nature of this Target makes ascertaining a cumulative contribution relatively challenging. Simply producing a total of the number of local development plans that now incorporate biodiversity, for example, would be relatively meaningless. Therefore, the proposed means of measuring contribution to the Strategic Plan for Biodiversity 2011-2020 is through trends in the total number of countries incorporating biodiversity values into different plans/policies:
• Number of countries incorporating biodiversity values into national development plans/poverty reduction strategies/planning processes/national accounts/national reporting due to support from IKI projects.
For contributions to local processes and strategies, the proposed means of measuring is through trends in the area covered by processes and strategies that have been supported by the project that incorporate biodiversity values. This attempts to address the issue of, for example, the number of local development plans being higher in one country purely because its political system is more devolved/decentralised.

36
Potential for using the indicators/information in national reporting
The indicators proposed for projects contributing to this Target could potentially contribute directly to national reporting. While the indicators of project references in relevant plans may not be appropriate for national reporting, those of the number of policies and plans incorporating biodiversity and ecosystem values may be of use.
As with Target 1 and public awareness, the subject of mainstreaming is still relatively new, particularly in terms of monitoring progress and developing indicators, and few governments have addressed this. Therefore, if project indicators are developed in cooperation with government agencies developing indicators for national targets, there may be the opportunity for these to feed directly into national indicators. As mentioned previously, work is ongoing under the ‘NBSAPs 2.0’ project in order to develop indicators of mainstreaming progress, success and impact and therefore this project’s results may be highly relevant.

37
Aichi Biodiversity Target 3: By 2020, at the latest, incentives, including subsidies, harmful to biodiversity are eliminated, phased out or reformed in order to minimize or avoid negative impacts, and positive incentives for the conservation and sustainable use of biodiversity are developed and applied, consistent and in harmony with the Convention and other relevant international obligations, taking into account national socio economic conditions.
Components:
• Eliminate or phase out incentives, including subsidies, harmful to biodiversity • Positive incentives are developed and applied • Reform harmful incentives
Project-specific questions:
• What harmful incentives exist that impact on the project area? • What positive incentives could be developed and applied as a result of the project?
Key Questions:
• What percentage of identified harmful incentives have been or are in the process of being eliminated? What is the monetary total?
• What percentage of identified harmful incentives have been reformed? What is the monetary total? • What positive incentives have been developed and applied? What is the monetary total? • How many people are benefiting from Payments for Ecosystem Services (PES) schemes across how great an area? • What is the monetary total of the PES schemes?
Global Indicators:
No global indicators currently exist to monitor progress towards Aichi Biodiversity Target 3, although the Organisation for Economic Co-operation and Development (OECD) are working to develop one.
Possible National Indicators suggested by CBD:
• Trends in identification, assessment and establishment and strengthening of incentives that reward positive contribution to biodiversity and ecosystem services and penalize adverse impacts.

38
Table 5: Suggested Project Indicators for Aichi Biodiversity Target 3
Indicators: Data required: Possible data sources: Indicator-specific notes:
Number/Percentage of identified incentives harmful to biodiversity eliminated/in the process of being eliminated/reformed in the project area as a consequence of project activities
Total number of identified harmful incentives
Number eliminated/reformed
Number in the process of elimination/reform
Information on incentives can be compiled from tax codes, ministry publications or national statistics
It is necessary to firstly identify the relevant incentives to the area that the project covers. The CBD gives some guidance as to what an incentive is: ‘Incentives, including subsidies, harmful to biodiversity generally emanate from policies or programmes that induce unsustainable behaviour harmful to biodiversity, often as unanticipated and unintended side effects of policies or programmes designed to achieve other objectives. Types of possibly harmful incentives include production subsidies and consumer subsidies while policies and laws governing resource use, such as land tenure systems and environmental resource management, can also have harmful effects.’ (CBD SECRETARIAT, no date). It is important to note that incentives need not purely be financial. Once incentives that the project will address or affect have been identified, then during and at the end of the project an indicator showing the monetary total of the total number of identified incentives reformed or in the process of reform can be produced. It may also be possible to produce an indicator of the percentage of the monetary total of identified incentives reformed or in the process of reform, in cases where the monetary total of all incentives can be determined.
Monetary total of harmful incentives to biodiversity eliminated/in the process of being eliminated/reformed in the project area as a consequence of project activities
Monetary total of identified harmful incentives
Monetary total of incentives eliminated/reformed
Monetary total of incentives in the process of elimination/reform
Information on incentives can be compiled from tax codes, ministry publications or national statistics
Number of people whose well-being benefits from positive incentives (disaggregated by scheme) for the conservation and sustainable use of biodiversity in the project area as a consequence of project activities
Total number of PES schemes
Total number of other positive incentives
Number of people benefiting from each incentive
Information may be obtained from relevant national or local agencies responsible for implementing the positive incentive. This indicator is likely to be project-specific and depend on the specific positive incentives.
With regards to positive incentives, the CBD describes these as ‘…economic, legal or institutional measures designed to encourage activities beneficial to biodiversity. Positive incentives can include such things as public or grant-aided land purchases or conservation easements.’ (CBD SECRETARIAT, no date). This encompasses a wide variety of possible measures, including payments for ecosystem services schemes, agro-environmental

39
Indicators: Data required: Possible data sources: Indicator-specific notes:
Area covered by PES schemes and other area-based incentive schemes (disaggregated by scheme) supported by the project in the project area
Total number of PES schemes
Area of coverage of scheme (beneficiaries of both payments and improved services)
Information may be obtained from relevant national or local agencies responsible for implementing the positive incentive. This indicator is likely to be project-specific and depend on the specific positive incentives.
schemes and more. This wide variety of targeted actions, ecosystem-types, land-use types and more, presents a challenge to finding standard indicators.
Number of people enrolled in stewardship schemes
Total number of people enrolled
Information may be obtained from relevant national or local agencies responsible for implementing the positive incentive.
BOLD – suggested standard indicators
General notes on the ‘Suggested Project Indicators’ above:
Aichi Biodiversity Target 3 has no associated global indicator because of the lack of a global dataset (OECD are working to address this but the dataset they will produce will only be for OECD countries given their mandate).
It is important to note that the same incentives may prove harmful for particular species but beneficial for others. Some species rely on specific agricultural land, meaning that incentives for creating or maintaining such agricultural land may be beneficial to these species, but may be harmful for others, particularly if natural vegetation is converted to agriculture. This should be considered during the project proposal stage.
Contribution of Project Indicators to the Strategic Plan for Biodiversity 2011-2020:
Feasibility of having standard indicators across projects
The breadth of Target 3 makes having informative standard indicators across projects relatively challenging, in particular in terms of how to aggregate measures of both negative incentives reformed and positive incentives implemented. However, standard indicators for the different components may be feasible. The review of IKI projects did not identify many that contribute to Aichi Biodiversity Target 3 against which to ‘test’ the proposed indicators.

40
An additional issue with developing standard indicators for this Target could be that the means of measuring ‘value’ of positive incentives would vary from one project to another. For example, a project involving a PES scheme could measure the overall value of the scheme, but for a project aiming to use income generated from sustainable use of natural resources as an incentive for biodiversity conservation, this would not be appropriate. In the instance of the latter, the value of household income attributed to the project activities, or the increase in household income as a result of the project, might be appropriate, although attribution directly to the project may be difficult to prove. The term ‘monetary total’ has been used above to avoid the ambiguity of the term ‘value’ including the question of ‘value – to whom?’, although the issue identified above regarding variation between projects still applies to this alternative term.
Potential for aggregating the contribution of all IKI Focal Area IV projects to the Strategic Plan for Biodiversity 2011-2020
The indicators suggested for projects could be relatively simply totalled to give a cumulative contribution to the Strategic Plan for Biodiversity 2011-2020.
• Number of identified harmful incentives eliminated/in the process of being eliminated/reformed due to support from IKI projects
• Area over which negative incentives have been eliminated/in the process of being eliminated/reformed due to support from IKI projects
• Monetary total of harmful incentives eliminated/in the process of being eliminated/reformed due to support from IKI projects • Number of people receiving PES/benefiting from positive incentives through IKI project activities • Area covered by PES schemes implemented by IKI projects • Monetary total of PES schemes/positive incentives implemented by IKI projects
It should be noted that the definition of ‘beneficiaries’ of PES schemes could be difficult to ascertain and a standardized system should be put in place. While the people who receive the payments could be considered (the only direct beneficiaries), their families may also benefit due to the increased income and consequential improved well-being. In addition, some PES schemes are directed at entire communities, which may be very complex to measure.
Potential for using the indicators/information in national reporting
The information gathered for the suggested indicators could be useful for national reporting, particularly from those projects operating at the national scale, but also for sub-national and regional projects, so long as information from regional projects can be disaggregated to the national level.
In particular, the approach used for identifying harmful incentives could be applicable at the national scale and could inform national processes if developed and implemented in coordination with national agencies.

41
Aichi Biodiversity Target 6: By 2020 all fish and invertebrate stocks and aquatic plants are managed and harvested sustainably, legally and applying ecosystem based approaches, so that overfishing is avoided, recovery plans and measures are in place for all depleted species, fisheries have no significant adverse impacts on threatened species and vulnerable ecosystems and the impacts of fisheries on stocks, species and ecosystems are within safe ecological limits.
Components:
• Stocks need to be managed and harvested sustainably, legally and applying ecosystem-based approaches • Overfishing is avoided • Recovery plans and measures are in place for all depleted species • Fisheries have no significant adverse impacts on threatened species and vulnerable ecosystems • The impacts of fisheries on stocks, species and ecosystems are within safe ecological limits
Project-specific questions:
• Which fish stocks, invertebrate stocks and aquatic plants are harvested in the area covered by the project? • Which species are depleted in this area? • Which ecosystem-based approaches are to be used in the project? • What are the safe ecological limits / maximum sustainable yield of target species at the project site? • What is the impact of fisheries on threatened species and vulnerable ecosystems?
Key Questions:
• How many of these identified target species are managed and harvested sustainably? • How many of these identified target species are managed using ecosystem-based approaches? • Are any of the identified target species being over-harvested? • Do all depleted species have recovery plans and measures in place? • Are the impacts of fisheries on stocks, species and ecosystems within safe ecological limits?
Relevant global indicators:
• Wild Commodities Index • Living Planet Index • Red List Index • Wild Bird Index

42
• Marine Trophic Index • Proportion of fish stocks in safe biological limits • Number of Marine Stewardship Council (MSC) certified fisheries
The Wild Commodities Index tracks changes in a selection of utilized species’ populations using a methodology based on the Living Planet Index (LPI). The LPI uses time-series data for over 9000 populations of 2600 species globally, aggregating population changes for each species into a single index. The Red List Index is based on the IUCN Red List of Threatened Species and measures trends in extinction risk over time. The Wild Bird Index measures population trends of a number of representative wild birds, as an indicator of the general health of the environment. These four indicators do not relate specifically to fisheries but the methodologies could potentially be applied to fish stocks or to relevant species. The varying scales on which projects occur, and high data requirements of the indices, could pose a challenge to the development of a common methodology for calculating the indices used currently at the global scale, however these could be useful as a basis for developing project specific methodologies. The Marine Trophic Index is a useful measure that is readily available at various scales, using catch composition to determine changes in the mean trophic level of fisheries. Most global information can be disaggregated down to the national (Exclusive Economic Zone) level, but the methodology could potentially be adapted, and a similar indicator calculated for the project level. The indicator ‘Proportion of Fish Stocks in Safe Biological Limits’ is produced by FAO and does not use a classical concept of fish stocks. Therefore, although this may be a relevant indicator at the project scale, the definition of a fish stock would need to be adjusted. Finally, the number of MSC certified fisheries is a relatively simple indicator of sustainable fish stocks – this could also be stated as a proportion of total fisheries for a defined project area.
Possible national indicators:
• Trends in proportion of depleted target and bycatch species with recovery plans • Trends in area, frequency, and/or intensity of destructive fishing practices • Trends in catch per unit effort • Trends in extinction risk of target and bycatch aquatic species • Trends in fishing effort capacity • Trends in population of target and bycatch aquatic species • Trends in proportion of utilized stocks outside safe biological limits

43
Table 6: Suggested Project Indicators for Aichi Biodiversity Target 6
Indicators: Data required: Possible data sources: Indicator-specific notes:
Percentage of fisheries in project area certified by MSC as a consequence of project activities
Total number of fisheries in project area
Number certified by MSC through project support
Information on fisheries could be obtained via MSC
The indicators, ‘number of MSC certified fisheries’ and ‘annual production of MSC certified fisheries in tonnes’ will only be relevant to projects specifically focusing on encouraging and facilitating certification of fisheries. In order to be MSC-certified, the fisheries will also have to collect data on sustainability of fishing practices. This data could feed into the data collection for other suggested project indicators.
Annual production of MSC certified fisheries (certified as a consequence of project activities) in tonnes in the project area
Total production of fisheries in project area
Total production of fisheries certified by MSC in project area
Information on fisheries could be obtained via MSC
Proportion of fish stocks within safe biological/ecological limits in the project area
Targeted fish stocks
Maximum sustainable yield for each fish stock
Fishing level for each stock
Information might be obtained from catch data recorded by fisheries, surveys of fish catch, direct surveys of target species.
This indicator would require the identification of all target species, and the definition of maximum sustainable yield for each of these. This would be a resource-intensive indicator, which would perhaps be more feasible if projects were to simply concentrate on a number of identified keystone, flagship or threatened species.
Proportion and number of depleted target and bycatch species with recovery plans and measures in place in the project area as a consequence of project activities
Target and bycatch species in the project area
Number of target and bycatch species with recovery plans and measures in place
Information could be obtained from national or local laws, or specific fisheries.
Identifying population trends of all target and bycatch species would be extremely demanding and complex, and again it might be recommended to concentrate on a small subset of key species. The percentage of depleted species with recovery plans and measures in place would be an important supporting indicator for this.
Trends in area, frequency, and/or intensity of destructive fishing practices in the project area as a consequence of project activities
Types of destructive fishing practices occurring
Area over which they occur
Frequency/intensity with which fishers use destructive practices
Unless this information is recorded by fisheries or other agencies operating in the project area, specific surveys or monitoring are likely to be necessary.
Target 6 calls for fisheries to have no significant adverse impact on vulnerable ecosystems. The indicator of the trends in area, frequency and/or intensity of destructive fishing practices in the project area would help ensure that this component of the Target is met, as destructive fishing practices such as using cyanide or dynamite are responsible for major damage to habitats and vulnerable ecosystems such as coral reefs.

44
Indicators: Data required: Possible data sources: Indicator-specific notes:
Population trends in target and bycatch aquatic species in the project area
Target species populations
Bycatch species populations
Unless this information is recorded by fisheries or other agencies operating in the project area, specific surveys or monitoring are likely to be necessary.
An adapted form of the Red List Index, as at the global level, could be useful to monitor the component of the Target requiring that fisheries have no significant adverse impacts on threatened species and vulnerable ecosystems. However, such an index might mask important fluctuations in individual species, and therefore monitoring individual population trends and extinction risk in local populations of each identified target and by-catch species, and in particular threatened species, would be recommended.
Trends in catch per unit effort in the project area for given fishing techniques
Fishing effort for each fishery
Catch of each fishery
Prevalent fishing techniques
Information may be available from fisheries catch data
Catch per unit effort is also a useful measure of both pressure being exerted on fish stocks and also of the state of fish stocks themselves, as if pressure increases but catch is decreasing, this signifies a potential problem with the fish stock. Without the information on fishing effort, it is difficult to be sure if catch is decreasing due to, e.g. declining stocks, or due to declining effort. It is important to define which fishing technique is assessed with the indicator because a change in fishing technique may lead to a higher catch per unit effort even if fish stocks are not increasing.
Marine Trophic Index in the project area
Catch data by taxonomic group for each fishery
Estimate of trophic level for each taxonomic group
Some information may be available from fisheries catch data
The global Marine Trophic Index is calculated from FAO catch composition data, and can be disaggregated to the local scale. However, due to the frequency of updates of the global indicator, it would be necessary to collect project-specific data at an appropriate frequency (e.g. baseline data on project start-up, mid-term if project is sufficiently long and end-of-project).
BOLD – suggested standard indicators

45
Contribution of Project Indicators to the Strategic Plan for Biodiversity 2011-2020:
Feasibility of having standard indicators across projects
It is likely that each project contributing to Target 6 would need to produce more than one of the above indicators – at a minimum following population trends in target and bycatch species and ensuring that fish stocks are fished within biological limits. Depending on the project context and scope, other indicators may be appropriate. Although this Aichi Biodiversity Target is relatively broad in scope, the different components are all key to ensuring sustainability of fisheries and therefore could be relevant to most projects contributing to this Target.
Potential for aggregating the contribution of all IKI Focal Area IV projects to the Strategic Plan for Biodiversity 2011-2020
A number of the above indicators could be directly totalled in order to provide a cumulative contribution to the Strategic Plan for Biodiversity 2011-2020 (using simple counts rather than the proportions given in the project indicator):
• Number of fisheries certified by MSC as a result of IKI projects; • Annual production of fisheries certified by MSC as a result of IKI projects in tonnes; • Number of fish stocks in IKI project areas within safe biological limits; • Number of depleted target and bycatch species in IKI project areas with recovery plans and measures in place.
For others, slight modifications might be necessary.
• Number of target and bycatch species populations that are increasing in IKI project areas • Number of target and bycatch species for which extinction risk has decreased in IKI project areas
The above two indicators would risk ‘double-counting’ if two projects are both targeting the same species, necessitating reporting at the population level. As mentioned above, there will be few projects that will be wholly responsible for a change in conservation status of an entire species, with the exception of very localized species, and there will mostly be too many confounding factors for this to be possible.
A final possible indicator of cumulative contribution could simply be the area across which fish stocks are being maintained within safe biological/ecological limits and across which target and bycatch species populations are stable or increasing.
Example decision-tree for choosing between possible project-level indicators
If the above possible project-level indicators are agreed as possible standard indicators for IKI projects to choose between, the below ‘decision-tree’ could be used to support the choice between the indicators:
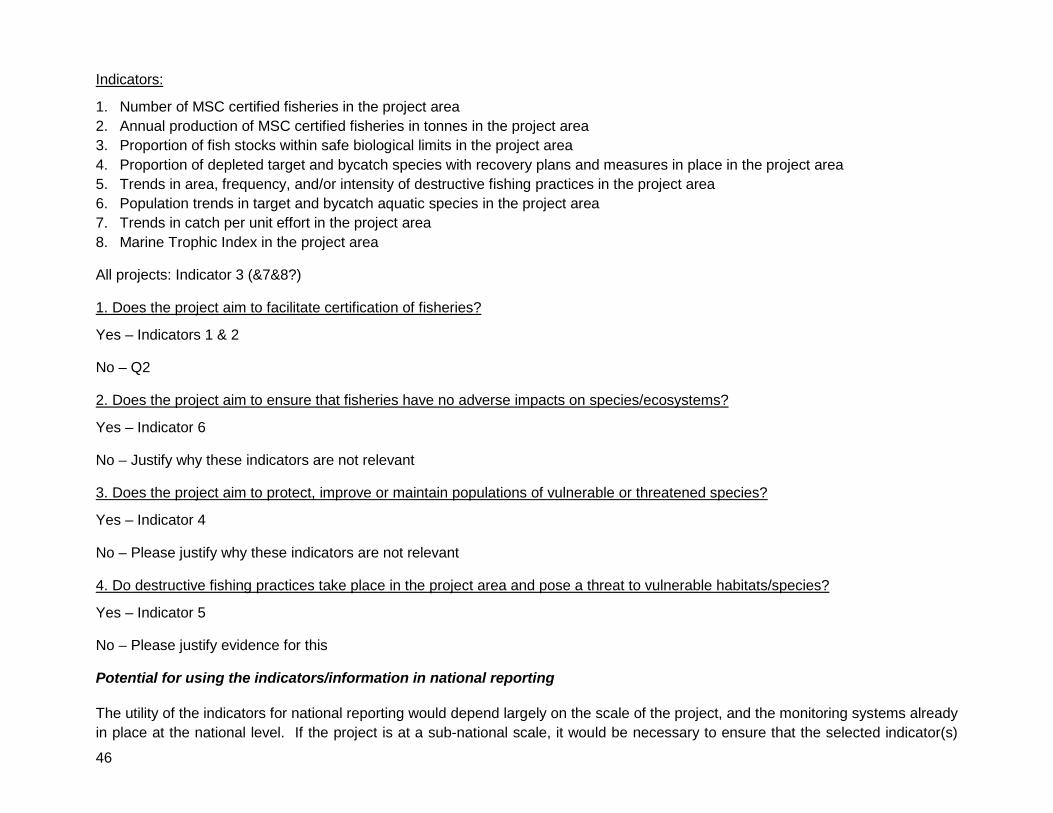
46
Indicators:
1. Number of MSC certified fisheries in the project area 2. Annual production of MSC certified fisheries in tonnes in the project area 3. Proportion of fish stocks within safe biological limits in the project area 4. Proportion of depleted target and bycatch species with recovery plans and measures in place in the project area 5. Trends in area, frequency, and/or intensity of destructive fishing practices in the project area 6. Population trends in target and bycatch aquatic species in the project area 7. Trends in catch per unit effort in the project area 8. Marine Trophic Index in the project area
All projects: Indicator 3 (&7&8?)
1. Does the project aim to facilitate certification of fisheries?
Yes – Indicators 1 & 2
No – Q2
2. Does the project aim to ensure that fisheries have no adverse impacts on species/ecosystems?
Yes – Indicator 6
No – Justify why these indicators are not relevant
3. Does the project aim to protect, improve or maintain populations of vulnerable or threatened species?
Yes – Indicator 4
No – Please justify why these indicators are not relevant
4. Do destructive fishing practices take place in the project area and pose a threat to vulnerable habitats/species?
Yes – Indicator 5
No – Please justify evidence for this
Potential for using the indicators/information in national reporting
The utility of the indicators for national reporting would depend largely on the scale of the project, and the monitoring systems already in place at the national level. If the project is at a sub-national scale, it would be necessary to ensure that the selected indicator(s)

47
and monitoring systems reflect those already in place at the national scale (if any) and are developed in close coordination with national agencies.

48
Aichi Biodiversity Target 11: By 2020, at least 17 per cent of terrestrial and inland water areas and 10 per cent of coastal and marine areas, especially areas of particular importance for biodiversity and ecosystem services, are conserved through effectively and equitably managed, ecologically representative and well-connected systems of protected areas and other effective area-based conservation measures, and integrated into the wider landscape and seascape.
Components:
• Protected areas should: • Increase • Include areas of particular importance for biodiversity and ecosystem services • Be ecologically representative • Be effectively and equitably managed • Be well-connected
Project-Specific Questions:
• What are the different ecosystems covered by the project? • Which areas covered by the project are important for biodiversity and ecosystem services? • What percentage of areas identified as being particularly important for biodiversity and ecosystem services are protected?
Key Questions:
• What is the extent of protected terrestrial and marine area? • What is the extent of different IUCN categories of protected area? • What percentage of different ecosystems/habitats is protected at the national level? • How effective is the management of protected areas? • How equitable is the management of protected areas? • How well connected are the protected areas?
Relevant global indicators:
• Coverage of Protected Areas • Protected Area Overlays With Biodiversity • Management Effectiveness of Protected Areas

49
These three global indicators are all highly relevant at the project level. The Coverage of Protected Areas is a simple measure given in hectares, or as a percentage of the earth’s surface, and separated into marine and terrestrial protected areas. The indicator of Protected Area Overlays With Biodiversity considers firstly the amount of each ecoregion (a ‘large unit of land or water containing a geographically distinct assemblage of species, natural communities, and environmental conditions’ (WWF, 2014)) that is protected, and secondly, the number of Alliance for Zero Extinction (AZE) sites which are fully, partially or not at all protected. AZE sites are sites where species evaluated to be Endangered or Critically Endangered under IUCN criteria are restricted to single remaining sites (AZE, 2014). Information on species lists and site location is freely available online9. The indicator of Management Effectiveness of Protected Areas cross analyses data from various management effectiveness assessments. The global indicator firstly considers the proportion of protected areas that have undergone assessments, and secondly the average scores for this.
Possible national indicators suggested by the CBD:
• Trends in extent of marine protected areas, coverage of key biodiversity areas and management effectiveness • Trends in protected area condition and/or management effectiveness including more equitable management • Trends in representative coverage of protected areas and other area-based approaches, including sites of particular
importance for biodiversity, and of terrestrial, marine and inland water systems • Trends in the connectivity of protected and other area-based approaches integrated into land- and sea-scapes • Trends in the delivery of ecosystem services and equitable benefits from protected areas
Table 7: Suggested Project Indicators for Aichi Biodiversity Target 11
Indicators: Data required: Possible data sources: Indicator-specific notes:
Extent of terrestrial/marine protected area coverage achieved with support from the project
Marine area protected
Terrestrial area protected
World Database on Protected Areas, WDPA10 (although data is fed from national level so project would be required to provide it anyway).
For projects establishing or designating new protected areas, an indicator of the extent of terrestrial/marine protected area coverage in kilometre2 (km2) or hectares would be appropriate in many cases. For projects operating across one or more entire countries, this could be also provided as a percentage of the country’s surface area for each country.
Percentage of areas identified as important for biodiversity/ecosystem services under protection as a consequence of the project
Project area identified as important for biodiversity/ecosystem services
Area protected
Many approaches exist to define areas of importance for biodiversity: Key Biodiversity Areas, Alliance for Zero Extinction sites, Ecologically and Biologically Significant Marine Areas, Critical Site Network for Waterbird Conservation, Important
For all projects aiming to establish new protected areas, the importance of the chosen area for biodiversity and ecosystem services should be a key consideration. The IKI biodiversity criteria project gives guidance on identifying areas of importance for biodiversity and ecosystem services:
9 http://www.zeroextinction.org/sitesspecies.htm 10 https://www.protectedplanet.net

50
Indicators: Data required: Possible data sources: Indicator-specific notes: Bird Areas. These could also be used as proxies for areas of importance for ecosystem services.
‘Areas that are important to biodiversity can include, but are not limited to: nationally defined biodiversity priorities (e.g. protected areas); internationally recognised areas including Key Biodiversity Areas; High Conservation Value areas; areas important for particular migratory, endangered and/or endemic species; and areas of natural forests (relevant for REDD+ projects). Use the ‘A-Z of Areas of biodiversity importance’11 to find out about different areas of biodiversity importance. Not all areas that are important for biodiversity will be currently under protection or have high species richness. Projects should use a definition which is relevant to the local context.’ (MANT et al., 2014:49). Care must also be taken when determining areas of importance for ecosystem services, as this will depend on whether the project is considering ‘importance’ at the local scale or at the global scale and the choice of ecosystem services. At the local scale, water or food provision may be the most important ecosystem service, whereas at the global scale, it might be carbon sequestration and climate regulation. A possible indicator could therefore be the area protected that is recognized as being of importance for biodiversity and ecosystem services. This could be calculated using an overlay of the designated protected area(s) with the areas identified as important for biodiversity and ecosystem services in the project context.
Improvements in ecological representativeness of protected areas achieved with support from the project as assessed by hectares of nationally underrepresented ecosystems newly protected
Ecosystems present in project area; degree of protection in project area in comparison to other
Amount of each ecosystem protected in relation to area of ecosystem at the
A number of data layers exist for different biogeographical regions: WWF Ecoregions12, Udvardy’s Biogeographic Provinces13, Marine Ecoregions of the World14, Conservation International Biodiversity Hotspots15. This indicator could also draw on
Projects establishing new protected areas should also ensure that these protected areas are ecologically representative. Percentage of different ecosystems present in the project area, protected at the national level, could be a useful measure for this. The project should aim to improve overall representativity of the country’s protected area system by identifying underrepresented ecosystems at the national level
11 http://www.biodiversitya-z.org/home 12 http://wwf.panda.org/about_our_earth/ecoregions/about/what_is_an_ecoregion/ 13 http://www.unep-wcmc.org/resources-and-data/udvardys-biogeographical-provinces 14 http://maps.tnc.org/gis_data.html 15 http://www.conservation.org/How/Pages/Hotspots.aspx

51
Indicators: Data required: Possible data sources: Indicator-specific notes: ecosystems at the national level.
national level
national-level protected area information from the WDPA.
and targeting these for protection. This could be calculated by overlaying a map of different ecosystem types in the project area (or country) with the protected area(s) to be designated in order to establish the percentage of each ecosystem in the project area covered by a protected area. This indicator does not address whether ecosystems of particular importance for species or for ecosystem services are well represented.
Changes in protected areas management effectiveness achieved with support from the project
Results of Management Effectiveness Assessments
IUCN World Commission on Protected Areas16; project-specific evaluations would be required for relevant protected areas.
Many projects seek to address the management effectiveness of protected areas. For these, management effectiveness of all protected areas involved should be routinely evaluated using recognized methodologies such as IUCN’s publication ‘Evaluating Effectiveness: A framework for assessing management effectiveness of protected areas’ (HOCKINGS et al., 2006) and The Rapid Assessment and Prioritisation of Protected Areas Management methodology (ERVIN, 2003). It should be ensured that the methodology used also takes into account the equity of protected area management.
Trends in the connectivity of protected areas (as measured by degree of habitat fragmentation in surrounding area, e.g. hectares of habitat in areas of important for connectivity in improved condition due to project activities; possibility of movement between protected areas and habitat fragments outside of species; isolation of protected areas from areas of similar habitat) as a consequence of project activities
Species dispersal potential
Isolation: Distance from Protected Area to nearest area of same ecosystem, presence/absence of connecting corridors.
Species dispersal potential and needs could be obtained from specific literature. Information on isolation of protected area and on habitat fragmentation could be obtained from land cover maps.
Measurements of connectivity are often complex and there are few widely accepted indicators of protected area connectivity. For some projects, particularly those aiming to improve connectivity for a particular species, species movement and dispersal could be modelled, and the potential for dispersal in the current landscape determined. For projects with a lesser focus on connectivity, the degree of isolation could be established for protected areas, either by evaluating the distance from the habitat/ecosystem within the protected area to the nearest fragment of this same habitat/ecosystem, or identifying the presence or absence of habitat corridors.
BOLD – suggested standard indicators
16 http://www.iucn.org/about/work/programmes/gpap_home/gpap_wcpa/

52
Contribution of Project Indicators to the Strategic Plan for Biodiversity 2011-2020:
Feasibility of having standard indicators across projects
It seems feasible that all projects targeting protected areas should report on the amount of area protected and/or the area under effective or improved management. Those designating new protected areas should also report on the area identified as important for biodiversity and ecosystem services under protection as a result of IKI projects. Standard indicators for ecological representativity and connectivity would prove more challenging, in particular due to issues of scale (see below).
Potential for aggregating the contribution of all IKI Focal Area IV projects to the Strategic Plan for Biodiversity 2011-2020
A number of the indicators above can be used to calculate cumulative impact:
• Area (terrestrial/marine) protected as a result of IKI projects or in the process of being designated as protected; • Area under improved management (and therefore improved protection) as a result of IKI projects; • Number of management effectiveness assessments carried out by IKI projects; • Area identified as important for biodiversity/ecosystem services under protection as a result of IKI projects.
Area protected could be simply provided by each project in hectares or km2 to be totalled, and would correspond directly with the global indicator. By ensuring any newly designated areas were submitted to the WDPA, the information would also support the production of the global indicator. Area under improved management could also be given as the total area of all protected areas covered by the project, in which management effectiveness was assessed as having improved. The number of management effectiveness assessments carried out would also correspond directly with the global indicator of the same name. To establish the area identified as important for biodiversity and ecosystem services under protection as a result of IKI projects, a number of recognised prioritization schemes could be used to identify these important areas, and the area of these placed under protection (or improved management, for those that are already protected) could then be totalled.
Cumulating the impact of IKI projects with regards to ecological representativeness of protected areas and on connectivity would prove more challenging. Ecological representativeness can be calculated at various different scales – from ecoregions to habitat types – which makes aggregation more complex as this would depend on the project scale. Ecological connectivity can be measured in a variety of ways, including through metrics of the isolation of the protected area from other similar habitat types, the presence/absence of ecological corridors, the likeliness of a hypothetical ‘typical’ species to be able to move from the area to another area of the same habitat type and more. For the contribution of IKI projects to ecological connectivity to be aggregated, projects would need to use a standardized indicator for connectivity. The simplest means of aggregating results would be to state the number or area of protected areas that meet a pre-determined threshold for being considered ‘connected’.

53
Potential for using the indicators/information in national reporting
Information on the area protected would contribute directly to national reporting. Any spatial data on the location, ecosystem types and species of the protected area(s) could also be useful at the national level to contribute to national spatial planning processes. If a national level indicator exists for management effectiveness, assessments for management effectiveness in the project protected area(s) should aim to use the same assessment methodology to ensure the results are comparable.

54
Aichi Biodiversity Target 14: By 2020, ecosystems that provide essential services, including services related to water, and contribute to health, livelihoods and well-being, are restored and safeguarded, taking into account the needs of women, indigenous and local communities, and the poor and vulnerable.
Components:
• Ecosystems providing essential services are restored • Ecosystems providing essential services are safeguarded • The needs of women, indigenous and local communities, and the poor and vulnerable are taken into account
Project-specific questions:
• Which ecosystems provide essential services? • Who are the beneficiaries of these services? • Who are ‘the vulnerable’ at the project site? • What is the definition of ‘safeguarded’ used by the project, e.g. protected from threat(s)?
Key questions:
• Are ecosystems providing essential services restored or undergoing restoration? • Are ecosystems providing essential services being safeguarded? • Are the needs of different groups being taken into account?
Global Indicators:
• Red List Index • Biodiversity for Food and Medicine Indicator • Health and Well-being of Communities Directly Dependent on Ecosystem Goods and Services • Nutrition Indicators for Biodiversity
This Aichi Biodiversity Target is relatively complex to measure at the global level. Of the three global indicators, the Red List Index does not give a full picture of progress towards the components of this Target. The Biodiversity for Food and Medicine Indicator combines a red list index for utilized species with an accessibility index, which looks at the relative affordability of wild-sourced products compared with generic/staple products. The Health and Well-Being of Communities Directly Dependent on Ecosystem Goods and Services Indicator uses infant mortality rates as a measure of health, and isolation from large towns as a proxy for dependency on ecosystems, and compares this with changes in the threat status of ecosystems which represents change in

55
ecosystem function. The Nutrition Indicators for Biodiversity represent a count of the number of foods for which nutritional value is reported in literature. These global indicators are less relevant to the project level, where more specific indicators will be appropriate.
Possible National Indicators:
• Population trends and extinction risk trends of species that provide ecosystem services • Trends in benefits that humans derive from selected ecosystem services • Trends in proportion of the population using improved water services • Trends in proportion of total freshwater resources used
Table 8: Suggested Project Indicators for Aichi Biodiversity Target 14
Indicators: Data required: Possible data sources: Indicator-specific notes:
Area of different ecosystem types undergoing restoration/having been restored and/or safeguarded as a consequence of project activities
Area of different ecosystem types undergoing restoration
Area of different ecosystem types having been restored (as a percentage of degraded area)
Data sources to support information on project area undergoing restoration include WWF Ecoregions17, land cover/use maps such as Global Land Cover 200018, and Globiom19.
For projects focusing on the first component of the Target, to restore ecosystems providing essential services, it is important to have a common understanding of the definition of restoration. The Society for Ecological Restoration (2004) define ecosystem restoration as the process of assisting the recovery of an ecosystem that has been degraded, damaged or destroyed. An initial indicator would be the area restored, and also the number of people benefiting from services provided by restored ecosystems and the value of these services. Equally for projects focusing on the second component of the Target, the number of people benefiting from services provided by safeguarded ecosystems and the value of these services would be a useful measure. Quantifying benefits derived from identified ecosystem services within and outside project area can be challenging but in some cases could be achieved through socio-economic surveys.
Number of people benefiting from services (subcategorised by
Area in which services provided by
Populations in area
Ecosystem services mapping tools, such as
17 Op.cit footnote 12 18 http://bioval.jrc.ec.europa.eu/products/glc2000/products.php 19 http://www.globiom.org/

56
Indicators: Data required: Possible data sources: Indicator-specific notes: type, e.g. provisioning, regulatory, cultural) provided by safeguarded/restored (subcategories for degree of restoration: e.g. partial, full restoration) ecosystems as a consequence of project activities
restored ecosystems are delivered
ARtificial Intelligence for Ecosystem Services (ARIES)20 and Toolkit for Ecosystem Service Site-based Assessment (TESSA)21, could help to map the provision of the ecosystem service(s) in question. Demographic data could be obtained from government agencies or statistical institutes to calculate the number of people benefiting from the service.
Trends in income/well-being of people whose livelihoods depend directly on ecosystems within project area as a consequence of project activities
Populations in project area whose livelihoods depend on ecosystem services (that the project aims to protect)
Income/wellbeing of identified populations
Ecosystem services mapping tools, such as ARIES and TESSA, could help to map the provision of the ecosystem service(s) on which local populations’ livelihoods depend. Demographic and income data could be obtained from government agencies or statistical institutes to calculate the number of people benefiting from the service.
Trends in income and well-being have many confounding factors and therefore a project’s ability to address attribution may depend on project size, available funds, etc.
Trends in stock of identified ecosystem services within and outside project area (e.g. products that can be harvested at sustainable levels, levels of carbon storage and sequestration) as a consequence of project activities
Primary benefits derived from ecosystem services in project area/outside
Trends in these benefits
Various tools are available to support mapping ecosystem services – ARIES, Co$ting Nature22, Integrated Valuation of Ecosystem Services and Trade-offs (InVEST)23, TESSA.
20 http://www.ariesonline.org/ 21 http://www.birdlife.org/datazone/info/estoolkit 22 http://www.policysupport.org/costingnature 23 http://www.naturalcapitalproject.org/InVEST.html

57
Indicators: Data required: Possible data sources: Indicator-specific notes:
Value of services provided by safeguarded/restored ecosystems supported by project (disaggregated by beneficiaries, subcategories would be required for beneficiaries: e.g. local farmers, or agricultural sector)
Value of services provided by safeguarded ecosystems (disaggregated by beneficiaries)
Value of services provided by restored ecosystems (disaggregated by beneficiaries)
Tools available to support ecosystem service mapping: Integrated Valuation of Ecosystem Services and Trade-offs (InVEST)
Methods of valuing ecosystem services are still evolving and are often highly complex, meaning they may be beyond the scope or capabilities of many projects. The value should be disaggregated by beneficiary.
BOLD – suggested standard indicators
General notes on the ‘Suggested Project Indicators’ above:
This Target poses challenges to identifying standard indicators given the huge diversity of services provided by ecosystems and the many different, often relatively novel, means of measuring the provision of these services.
The definitions of ‘restoration’/ ‘restored’ and ‘safeguarded’ will need to be determined in order to encourage meaningful results, reporting and aggregation. For example, for the term ‘safeguarded’ there may need to be an indication of the level of protection that is required. Restoration could be defined as:
‘...process of assisting the recovery of an ecosystem that has been degraded, damaged or destroyed...An ecosystem has recovered – and is restored - when it contains sufficient biotic and abiotic resources to continue its development without further assistance or subsidy. It will sustain itself structurally and functionally. It will demonstrate resilience to normal ranges of environmental stress and disturbance. It will interact with contiguous ecosystems in terms of biotic and abiotic flows and cultural interactions.’ (SER, 2004).
For projects contributing to this Target, if specific ecosystem services are not identified in the project objectives, the first step will be to identify the essential ecosystem services provided by, or within, the project area, as appropriate. If specific ecosystem services are identified in the project objectives, this could provide the opportunity to identify other essential services in order to ensure no negative impacts to these are a result of project activities, and to measure any potential positive impacts on other ecosystem services that may arise from project activities.
A second key activity is to identify the beneficiaries of these ecosystem services, bearing in mind that they may not be within the project area – for example, for a project safeguarding a watershed, the beneficiaries may be many miles downstream.
Contribution of Project Indicators to the Strategic Plan for Biodiversity 2011-2020:

58
Feasibility of having standard indicators across projects
It seems that the feasibility for some of the indicators to be common across all projects to which they are relevant is quite high. A number of the indicators would have to be adapted to project context – for example population trends of species that provide ecosystem services would of course depend on the species relevant to the project area. Not all indicators would be relevant to all projects. The indicator that would vary the most across projects would be the trends in benefits derived from identified ecosystem services, as these benefits could take many forms, all of which would be measured in different ways, and would have different reaches within and outside of the project area.
Potential for aggregating the contribution of all IKI Focal Area IV projects to the Strategic Plan for Biodiversity 2011-2020
Calculating the cumulative contribution of projects falling under this Target – or even under just one component of the Target – is very difficult due to the diversity of ecosystems, and of services, that could be addressed by projects. Some options for communicating the cumulative contribution of IKI projects to the Strategic Plan for Biodiversity 2011-2020 could include:
• Area undergoing restoration/having been restored through IKI projects; • Number of people benefiting from essential services provided by restored and safeguarded ecosystems as a result of IKI
projects; • Value of services provided by ecosystems safeguarded and restored by IKI projects (disaggregated by beneficiaries).
Potential for using the indicators/information in national reporting
For projects operating at the national (or multi-national) level, the opportunities for contributing to national reporting are much greater than those at the sub-national or site level. Again, indicators, including data collection and calculation, must be developed in coordination with relevant national agencies if these are to meaningfully contribute to national reporting. Overall, the potential for using the indicators or information in national reporting will wholly depend on the indicators developed or under development at the national level.

59
Aichi Biodiversity Target 15: By 2020, ecosystem resilience and the contribution of biodiversity to carbon stocks have been enhanced, through conservation and restoration, including restoration of at least 15 per cent of degraded ecosystems, thereby contributing to climate change mitigation and adaptation and to combating desertification.
Components:
• Ecosystem resilience is enhanced through conservation and restoration • The contribution of biodiversity to carbon stocks through conservation and restoration is enhanced • Restoration of at least 15 per cent of degraded ecosystems • Contributing to climate change mitigation and adaptation and to combating desertification
Project-specific questions:
• How does biodiversity contribute to carbon stocks in the project area? • Which ecosystems in the project area are degraded? • Where is desertification occurring?
Key Questions:
• What are the trends in ecosystem resilience? • What is the contribution of biodiversity to carbon stocks? • How much of the identified degraded ecosystems have been restored? • How have measures taken impacted on climate change mitigation, adaptation and desertification?
Global Indicators:
There are currently no global indicators tracking progress towards Aichi Biodiversity Target 15
Possible National Indicators proposed by CBD:
• Status and trends in extent and condition of ecosystems that provide carbon storage • Population trends of forest-dependent species in forests under restoration • Trends in area of degraded ecosystems restored or being restored • Trends in proportion of degraded/threatened habitats • Trends in primary productivity

60
• Trends in proportion of land affected by desertification
Table 9: Suggested Project Indicators for Aichi Biodiversity Target 15
Indicators: Data required: Possible data sources: Indicator-specific notes:
Status and trends in extent and condition of ecosystems that provide high carbon storage as a consequence of project activities
Ecosystems within project area providing high carbon storage
Extent of these ecosystems
Condition of these ecosystems
Data on ecosystem type and extent could be extracted from land cover maps such as Global Land Cover 200024, from tools such as Global Forest Watch25, and from remotely sensed data. Information on condition is likely to require on-the-ground surveys. Past surveys may be available for baselines. REDD+ and national greenhouse gas inventory initiatives are collecting/developing similar information and should therefore be first contact points for such data.
A number of ecosystems provide carbon storage, including peatland, tropical forest, seagrass beds, mangroves and many more. However, the level of carbon stored can vary greatly not only between the different broad ecosystem types, but between different conditions of the same ecosystem type. Consequently the total area of habitats that provide carbon storage may be of limited use. Nonetheless, establishing the total carbon stored can be complex due to the above variables and could be beyond the scope and resources of projects, in which case indicators of habitat extent for those habitats that provide carbon storage could be an appropriate proxy.
Trends in carbon stored as a consequence of project activities
Extent of ecosystems providing carbon storage
Level of carbon stored by different habitats
Data on ecosystem type, extent and condition could be extracted from land cover maps such as Global Land Cover 2000, from tools such as Global Forest Watch, and from remotely sensed data. Carbon storage could then be calculated from this data.
Trends in proportion and area of degraded habitats as a consequence of project activities
Area of ecosystems considered degraded
Area of ecosystems considered degraded and under restoration
Remotely sensed data can give near-real time information on habitat condition and degradation.
A definition of ecosystem degradation is also complex. Means of measurement of degradation will depend primarily on the ecosystem type and may involve the use of appropriate indicator species - i.e. species that are known to be particularly sensitive to degradation. In many cases, surrogates are used as indicators of
Trends in proportion and area of degraded ecosystems (that provide services important for climate change adaptation e.g. hydrological regulation) restored or
Area of ecosystems considered degraded
Area of ecosystems considered degraded and under restoration
Area of ecosystems previously considered degraded that is now
Land cover maps derived from remote sensing could provide information on ecosystem degradation. As restoration is a long process, it is unlikely that this will be evident from remotely sensed data within the project lifespan. Therefore, the project should determine the area that
24 Op.cit footnote 18 25 http://www.globalforestwatch.org/

61
Indicators: Data required: Possible data sources: Indicator-specific notes: under restoration as a consequence of project activities
restored has been restored or is undergoing restoration as a consequence of project activities.
degradation, such as erosion or urbanization.
Trends in proportion of land affected by desertification as a consequence of project activities
Total area of project land
Area of land affected by desertification
Remotely sensed data on habitat condition and extent.
This indicator is unlikely to provide information that can be easily attributed to a single project over a typical lifetime of an IKI project, but might be useful where there is a possibility of continued monitoring after the project ends.
Trends in adaptive capacity to climate change impacts (subcategories of adaptive capacity include: area of ecosystem providing essential services for adaptation made more resilient to degradation; area covered by improved governance system that allows adaptive management of natural resources)
Area of ecosystems considered degraded Governance system area
Area of ecosystems considered degraded and under restoration Flexibility of governance system to make decisions on natural resources management/use during times of shock
Area of ecosystems previously considered degraded that is now restored
Land cover maps derived from remote sensing could provide information on ecosystem degradation. As restoration is a long process, it is unlikely that this will be evident from remotely sensed data within the project lifespan. Therefore, the project should determine the area that has been restored or is undergoing restoration as a consequence of project activities. Surveys of those involved in governance system and those who use natural resources to note the consequences of governance system decisions, including responsiveness to extreme events.
Measuring whether a project impacts on climate change adaptation whilst/after building ecosystem resilience is challenging. There are many parameters that influence sensitivity and adaptive capacity to climate change impacts26.
BOLD – suggested standard indicators
26 For useful examples see: Alliance Development Works, UNU-EHS, and The Nature Conservancy, World Risk Report 2012 https://www.ehs.unu.edu/file/get/10487.pdf; Africa Climate Change Resilience Alliance Local Adaptive Capacity Framework http://policy-practice.oxfam.org.uk/~/media/Files/policy_and_practice/climate_change_drr/accra/accra_local_adaptive_capacity_framework.ashx

62
General notes on the ‘Suggested Project Indicators’ above:
The above indicators do not explicitly address ecosystem resilience27. This is a difficult concept to measure and there are various ideas in the literature about what constitutes resilience and how it should best be measured. A number of illustrative examples of indicators that could be used to assess ecosystem resilience are given in a report by EPPLE AND DUNNING (2013). These include, among others, indicators of structural and species diversity, existing degradation, site location in relation to species range margins and anthropogenic pressures. Therefore, the proposed indicator on ecosystem degradation could also be used as a measure of ecosystem resilience. Depending on a project’s capacity and the available data, it may be possible to develop further indicators of ecosystem resilience.
Contribution of Project Indicators to the Strategic Plan for Biodiversity 2011-2020:
Feasibility of having standard indicators across projects
Of the projects identified as contributing to Aichi Biodiversity Target 15, very few do so as a primary objective. Those that do contribute to this Target focus on protecting ecosystems important for carbon, increasing carbon storage and understanding and monitoring carbon sinks. Therefore only the first two suggested indicators would be relevant – the status and trends in extent and condition of habitats that provide carbon storage and the trends in carbon stored. This makes it difficult to assess if having standard indicators across projects is realistic, although it seems feasible that the indicators suggested be widely appropriate for all projects.
Measures of ecosystem resilience, in particular, are likely to vary widely across projects due to the variation in the effect that different factors have on resilience. A literature review by Epple and Dunning (2013) showed that the correlation between ecosystem resilience and factors such as ‘naturalness’, state of degradation and disturbance history, fragmentation and biodiversity varies greatly depending on the situation.
Potential for aggregating the contribution of all IKI Focal Area IV projects to the Strategic Plan for Biodiversity 2011-2020
• Area of habitat providing carbon storage across IKI projects • Area of habitat providing carbon storage due to IKI projects • Carbon stored within areas covered by IKI projects • Area of degraded ecosystems across IKI projects • Area of degraded ecosystems restored or under restoration across IKI projects • Area affected by desertification across IKI projects
27 Broadly defined as the ecosystem's ability to repair itself following disturbance (WESTMAN, 1978).

63
Assessing the cumulative contribution to the Strategic Plan for Biodiversity 2011-2020 is difficult, given the complexity of defining standard indicators in the first place. Consequently, for the most part, measures of the total areas of ecosystems that provide ecosystem services may be the most appropriate way of assessing cumulative contribution. If feasible, the total carbon stored within areas covered by IKI projects – and potentially the increase in carbon stored resulting from IKI projects – would be a useful measure.
Potential for using the indicators/information in national reporting
The indicators produced could be useful for national reporting, particularly the simpler measures of extent of ecosystems providing carbon storage, extent of degraded ecosystems under restoration etc. which would be easy to aggregate. For projects operating at a national scale, there will again be more opportunity to feed into national reporting and to fill any existing gaps in information or indicators. It is important that projects use any existing definitions used at the national level to define degraded and threatened habitats and land affected by desertification.

64
Aichi Biodiversity Target 17: By 2015 each Party has developed, adopted as a policy instrument, and has commenced implementing an effective, participatory and updated national biodiversity strategy and action plan.
Components:
• Develop or update the NBSAP • Adopt the NBSAP as a policy instrument
Project-specific questions:
• What is participatory in the national context?
Key Questions:
• Is the country's NBSAP updated? • Has the NBSAP been adopted as a policy instrument? • Has the NBSAP been incorporated or referenced in other biodiversity-relevant sectors, policies and plans? • Has implementation of the NBSAP started? • Are there monitoring results that indicate that the NBSAP implementation is having the desired impacts?
Global Indicators:
• Status of NBSAPs
This indicator measures how many CBD Parties have developed and revised their NBSAPs in line with Article 6 of the Convention and the Strategic Plan for Biodiversity 2011-2020. Parties are classified in four groups:
• Parties whose post-2010 NBSAP takes the Strategic Plan for Biodiversity 2011-2020 into account and have been developed or revised prior to 2010.
• Parties whose post 2010 NBSAP does not take the Strategic Plan for Biodiversity 2011-2020 into account and have been developed or revised post-2010, but are not in line with the Strategic Plan for Biodiversity 2011-2020.
• Parties who have not yet submitted a post-2010 NBSAP. • Parties who have never submitted an NBSAP.

65
Possible national indicators proposed by CBD:
• Trends in implementation of NBSAPs, including development, comprehensiveness, adoption and implementation
Table 10: Suggested Project Indicators for Aichi Biodiversity Target 17
Indicators: Data required: Possible data sources: Indicator-specific notes:
Status of NBSAPs (in project countries) that have been supported by the project
NBSAPs revised NBSAPs adopted
CBD website (NBSAPs page)28
Quality of NBSAPs as confirmed by peer-review (when available)
Peer-review report CBD website (NBSAPs page)29; NBSAP Forum website30
Participation in NBSAP revision as a consequence of project activities
Proportion of relevant stakeholder groups involved in revision process
Number of stakeholder consultations held
CBD website (NBSAPs page)31 – information might be referenced within the NBSAP
Projects supporting NBSAP revision in one or more countries could take many forms, and range in scales. Where appropriate, these projects should ensure that the revision process is fully participatory, involving different stakeholder groups in order that they have ownership of the actions prescribed, and that they can contribute their knowledge, expertise and priorities. The CBD identifies five major stakeholder groups (CBD SECRETARIAT, 2012): - Government ministries (including from different levels of
government, sectoral ministries, and ministries responsible for education and social affairs)
- Scientific community - NGOs - Private sector - Indigenous and local communities Public participation can be represented on a spectrum, with varying levels of involvement and contribution, and these should be considered when defining participation: - Informing – Provide the public with balanced and
objective information to assist them in understanding
28 http://www.cbd.int/nbsap/ 29 Ibid. 30 http://nbsapforum.net/uploads/peer_review_framework.pdf 31 Op.cit footnote 28

66
Indicators: Data required: Possible data sources: Indicator-specific notes: the problem, alternatives, opportunities, and/or solutions;
- Consulting – Obtain public feedback on analysis, alternatives, and/or decisions;
- Engaging – Work directly with the public throughout the process to ensure that public concerns and aspirations are consistently understood and considered;
- Collaborating – Partner with the public in each aspect of the decision including the development of alternatives and the identification of the preferred solution;
- Empowering – Place final decision-making authority in the hands of citizens.
Therefore, recording participation in the NBSAP revision by different stakeholder groups at different levels could prove useful.
Alignment of NBSAP with Strategic Plan for Biodiversity 2011-2020 (including national targets and indicators) as a consequence of project activities
NBSAP contains references to Strategic Plan for Biodiversity 2011-2020
NBSAP contains national targets and indicators
Information could be sourced from the CBD NBSAPs page32 by reviewing NBSAPs
The revised or updated NBSAPs should also, as per COP Decision X/2, be in line with the framework provided by the Strategic Plan for Biodiversity 2011-2020 and include national targets and indicators to monitor progress towards these targets. These national targets should make use of the Strategic Plan for Biodiversity 2011-2020 and its Aichi Biodiversity Targets as a flexible framework. Therefore, a means of determining if the NBSAP is aligned with the Strategic Plan for Biodiversity 2011-2020 could be the inclusion of national targets and indicators and reference to the Aichi Biodiversity Targets and Strategic Goals of the Strategic Plan for Biodiversity 2011-2020.
Progress in implementation of NBSAP as a consequence of project activities
Actions due to be completed by date of assessment
Actions completed as planned
Information on the action plans of the NBSAP could be sourced from the CBD NBSAPs page33. This would then need to be followed up with in-country to assess progress in the action plan.
Measurement of implementation of NBSAPs is more of a challenge, and could be based around the country’s achievement of relevant milestones and completion of specified actions by the date given in the Action Plan.
32 Ibid. 33 Ibid.

67
Indicators: Data required: Possible data sources: Indicator-specific notes:
Budget allocation for NBSAP implementation
Ministries and agencies financing NBSAP implementation
Amount of funding allocated by each for NBSAP implementation
Review of ministerial budget
BOLD – suggested standard indicators
General notes on the ‘Suggested Project Indicators’ above:
Indicators suggested for projects contributing to Aichi Biodiversity Target 2 could also contribute to Aichi Biodiversity Target 17, as 17 calls for NBSAPs to be used as a tool for mainstreaming biodiversity across sectoral and cross-sectoral policies and plans.
Contribution of Project Indicators to the Strategic Plan for Biodiversity 2011-2020:
Feasibility of having standard indicators across projects
Aichi Biodiversity Target 17 is relatively uniform in terms of scope and scale, and therefore it should be relatively feasible to have standard indicators across projects, which can then be aggregated to assess contribution to the Strategic Plan for Biodiversity 2011-2020. These indicators are unlikely to be of great use for national reporting unless more detailed indicators of NBSAP implementation are developed.
Potential for aggregating the contribution of all IKI Focal Area IV projects to the Strategic Plan for Biodiversity 2011-2020
• Number of NBSAPs for which the revision process has been supported by IKI projects • Number of NBSAPs for which implementation is being supported by IKI projects • Number of NBSAPs supported by IKI projects which are aligned with the Strategic Plan for Biodiversity 2011-2020 • Number of NBSAPs supported by IKI projects which have been revised through a participatory process • Number of NBSAPs supported by IKI projects which have been implemented in accordance with their Action Plan to date
These figures could simply be totalled in order to communicate the contribution of IKI projects. Inherently, projects contributing to this Target will be working at a national or multi-national scale, eliminating some of the complexities caused by aggregating previous indicators.

68
Potential for using the indicators/information in national reporting
The revision and implementation of the NBSAP forms an integral part of national reporting, as national reports to the CBD as Part II of National Reports relates to the implementation of the NBSAP. Predominantly, indicators that will be used in this section will be those of implementation of actions included in the NBSAP. It is unlikely that this level of detail would be appropriate for project reporting, but an indicator summarizing the progress to date with implementing the action plan and adherence to timeframes could be of use to both project reporting and national reporting.

69
Aichi Biodiversity Target 20: By 2020, at the latest, the mobilization of financial resources for effectively implementing the Strategic Plan for Biodiversity 2011-2020 from all sources and in accordance with the consolidated and agreed process in the Strategy for Resource Mobilization should increase substantially from the current levels. This target will be subject to changes contingent to resources needs assessments to be developed and reported by Parties.
Components:
• Resources from all sources should be considered • Resources should increase substantially from the current levels • Resources should be in accordance with the consolidated and agreed process in the Strategy for Resource Mobilization
Project-specific questions:
• What are the main sources of biodiversity financing linked to the project?
Key questions:
• What amount of resources is being provided or leveraged? • What financial resources will be required to implement the Strategic Plan for Biodiversity 2011-2020 in the project
country(ies)? • Are resources in accordance with the consolidated and agreed process in the Strategy for Resource Mobilisation?
Global Indicators:
• Official development assistance in support of the convention
This indicator measures aid contributions via the Development Assistance Committee (DAC), a principal body of the OECD. Annual reporting takes place and donors are requested to indicate for each activity whether or not it targets one or more of the three Rio Conventions, including the CBD, through ‘Rio markers’. For an activity to be labelled with the ‘Rio marker for biodiversity’ it must promote one of the three objectives of the CBD. Donors are also asked to report on the sectoral breakdown of activities (for example, forestry, agriculture). The indicator can be disaggregated for the 27 DAC member countries and 30 multilateral organisations. Recipient data is not limited to DAC members and can be disaggregated for regions and nations.

70
Possible National Indicators suggested by the CBD:
The CBD refers to the list of 15 resource mobilization indicators adopted in Decision X/3 of COP 10:
(1) Aggregated financial flows, in the amount and where relevant percentage, of biodiversity-related funding, per annum, for achieving the Convention’s three objectives, in a manner that avoids double counting.
(2) Number of countries that have:
(a) Assessed values of biodiversity, in accordance with the Convention; (b) Identified and reported funding needs, gaps and priorities; (c) Developed national financial plans for biodiversity; (d) Been provided with the necessary funding and capacity-building to undertake the above activities;
(3) Amount of domestic financial support, per annum, in respect of those domestic activities which are intended to achieve the objectives of this Convention;
(4) Amount of funding provided through the Global Environment Facility and allocated to biodiversity focal area;
(5) Level of CBD and Parties’ support to other financial institutions that promote replication and scaling-up of relevant successful financial mechanisms and instruments;
(6) Number of international financing institutions, United Nations organizations, funds and programmes, and the development agencies that report to the Development Assistance Committee of Organisation for Economic Co-operation and Development (OECD/DAC), with biodiversity and associated ecosystem services as a cross-cutting policy;
(7) Number of Parties that integrate considerations on biological diversity and its associated ecosystem services in development plans, strategies and budgets;
(8) Number of South-South cooperation initiatives conducted by developing country Parties and those that may be supported by other Parties and relevant partners, as a complement to necessary North-South cooperation;
(9) Amount and number of South-South and North-South technical cooperation and capacity-building initiatives that support biodiversity;
(10) Number of global initiatives that heighten awareness on the need for resource mobilization for biodiversity;
(11) Amount of financial resources from all sources from developed countries to developing countries to contribute to achieving the Convention’s objectives;
(12) Amount of financial resources from all sources from developed countries to developing countries towards the implementation of the Strategic Plan for Biodiversity 2011-2020;

71
(13) Resources mobilized from the removal, reform or phase-out of incentives, including subsidies, harmful to biodiversity, which could be used for the promotion of positive incentives, including but not limited to innovative financial mechanisms, that are consistent and in harmony with the Convention and other international obligations, taking into account national social and economic conditions;
(14) Number of initiatives, and respective amounts, supplementary to the financial mechanism established under Article 21, that engage Parties and relevant organizations in new and innovative financial mechanisms, which consider intrinsic values and all other values of biodiversity, in accordance with the objectives of the Convention and the Nagoya Protocol on Access to Genetic Resources and the Fair and Equitable Sharing of the Benefits Arising out of Their Utilization;
(15) Number of access and benefit-sharing initiatives and mechanisms, consistent with the Convention and, when in effect, with the Nagoya Protocol on Access to Genetic Resources and the Fair and Equitable Sharing of the Benefits Arising out of Their Utilization, including awareness-raising, that enhance resource mobilization;
Of the above indicators, those in italics are those deemed most relevant to IKI Focal Area IV projects either individually or in total, and may serve as useful bases for project indicators or for communicating the cumulative contribution of IKI Focal Area IV projects to the Strategic Plan for Biodiversity 2011-2020.
Table 11: Suggested Project Indicators for Aichi Biodiversity Target 20
Indicators: Data required: Possible data sources: Indicator-specific notes:
Number of resource mobilization strategies developed as a consequence of project activities
Number of resource mobilization strategies developed in project countries
CBD NBSAPs page34 – if resource mobilisation strategy is submitted as part of NBSAP
A primary means of contribution to Target 20 is by supporting the development of a resource mobilization strategy, or of a specific sustainable funding mechanism. Sustainable funding mechanisms may be aimed at the project level (e.g. for the management of a protected area or network of protected areas). The IKI-funded Biofin project has developed a scorecard to assess the financial sustainability of protected areas, which could be a requirement either for all projects targeting protected areas, or for those specifically aiming to develop sustainable financing mechanisms for protected areas.
Amount of sustainable financing secured at the national and/or local level
Amount of sustainable financing secured for national/local use
Budget allocations made for biodiversity including in other sectoral policies
Amount of external funding leveraged through project activities
Expenditure review
BOLD – suggested standard indicators
34 Ibid.

72
General notes on the ‘Suggested Project Indicators’ above:
The indicators suggested for projects contributing to Aichi Biodiversity Targets 2 and 3 could also contribute to Aichi Biodiversity Target 20 (and to the CBD’s 15 resource mobilisation indicators):
Aichi Biodiversity Target 2:
• Number of countries that, through the support of IKI projects, have assessed the values of biodiversity – contributes to Resource Mobilisation Indicator 2a
• Number of countries that, through the support of IKI projects, integrate considerations on biological diversity and its associated ecosystem services in development plans, strategies and budgets – contributes to Resource Mobilisation Indicator 7
In addition, total budget allocation for biodiversity within sectoral policies could be identified through a sectoral review.
Aichi Biodiversity Target 3:
• Resources mobilized from the removal, reform or phase-out of incentives, including subsidies, harmful to biodiversity – contributes to Resource Mobilisation Indicator 13
Contribution of Project Indicators to the Strategic Plan for Biodiversity 2011-2020:
Feasibility of having standard indicators across projects
Most projects identified as contributing to Target 20 are programmes for allocating funding to other projects, suggesting that a primary standard indicator would be relatively feasible. Other projects aim to create sustainable financing mechanisms for a protected area network, which would necessitate a very different type of indicator. Therefore it seems that standard indicators would be feasible so long as these are differentiated by the broad aims or type of the project.
Potential for aggregating the contribution of all IKI Focal Area IV projects to the Strategic Plan for Biodiversity 2011-2020
The indicators below are numbered in brackets as per their corresponding resource mobilization indicator above.
• Total financial flows from BMUB to support IKI projects (1; 11) • Number of countries that, through the support of IKI projects, have identified and reported funding needs, gaps and priorities
(2d) • Number of countries that, through the support of IKI projects, have developed national financial plans for biodiversity (2c)

73
• Number of countries that received capacity building and funding through the support of IKI projects to identify and report funding needs gaps and priorities, develop national financial plans, and undertake assessments of the values of biodiversity (2d)
• Number of initiatives and value of innovative financial mechanisms that consider intrinsic values and all other values of biodiversity (14)
It may also be appropriate to include in the first of the above indicators the financial flows to projects through global projects supported by IKI such as Lifeweb.
Potential for using the indicators/information in national reporting
• Total funding allocated to other projects by IKI projects designed to act as funding mechanisms • Number of resource mobilization strategies developed • Amount of sustainable financing secured at the project level • Amount of sustainable financing secured at the national level
The indicator of the amount of sustainable financing secured at the national level is most relevant to national reporting and should be useful. The amount of sustainable financing secured at the project level may also be relevant for national reporting but must be communicated in an appropriate way.

74
5 Recommendations for impact monitoring in IKI biodiversity projects
As mentioned earlier in this report, impact monitoring, such as monitoring IKI Focal Area IV project contribution to the Aichi Biodiversity Targets of the Strategic Plan for Biodiversity 2011-2020, is a valuable component of project and/or programme implementation. It can support the development of interventions that will achieve programme objectives, adaptive management of projects, institutional learning and the development of best practice.
This study has identified several challenges which need to be addressed in order for a system for monitoring the impacts of IKI Focal Area IV projects in relation to the targets of the Strategic Plan for Biodiversity 2011-2020 to be successful (see section 3). However, it has also identified potential ways of addressing these challenges, along with recommendations on procedural issues relating to options for such an impact monitoring system. These recommendations cover how to:
• Take account of the diversity of IKI Focal Area IV project scopes and the broad range of Aichi Biodiversity Targets;
• Assess impact in relation to both quality and quantity; • Address attribution of impacts; • Facilitate contributions of projects to national reporting; • Allow further development of monitoring plans after submission of project proposals; • Facilitate continued monitoring of impacts after the end of projects; and • Establishing a consistent and comparable monitoring system across all IKI Focal Areas.
Taking account of the diversity of project scopes and the broad range of the Aichi Biodiversity Targets
The variety of activities and approaches used in IKI projects means that defining a compulsory set of standard indicators, which all projects would be required to use in their monitoring systems in order to enable a cumulative assessment of contribution to the Strategic Plan for Biodiversity 2011-2020, does not seem realistic or appropriate. A solution could be to give projects the flexibility to identify, and only monitor the standard indicators for, those Aichi Biodiversity Targets (or components of Aichi Biodiversity Targets) that are most directly relevant to their primary objectives, as reflected in the project’s Theory of Change. The identification of such relevant Targets and components should therefore take place at an early stage of the proposal-writing process. For example, if a project is aiming for integration with the national development strategy that is under review, as part of contributing to Target 2 on mainstreaming, but not with the poverty reduction strategy because this is not up for review, they would only need to address the indicator related to the former. Projects could also be given the possibility to deviate from using the standard indicators, on the condition that a strong justification is provided when submitting the monitoring plan. Projects could then be given flexibility in determining how they would monitor contribution to other Aichi Biodiversity Targets where applicable.
This solution requires the identification of a set of standard impact indicators for the components of every Aichi Biodiversity Target that BMUB wishes to include in their monitoring and reporting. The list of indicators identified in section 4 of this study (in bold) for the Aichi Biodiversity Targets currently considered as priorities for IKI could provide a good starting point for this purpose. For example, all projects contributing to progress towards Aichi Biodiversity Target 11 could be asked to provide the

75
surface area newly protected or the surface area under improved management (as relevant). Providing detailed indicator specifications (for example, on the data format required) will also be needed in order to help enable aggregation across the wide-range of project types. Specifically, for some indicators, while figures expressed as a percentage of the project area may be useful at the project level, data should be provided to IKI as actual numbers to allow aggregation.
An additional challenge related to the broad range of IKI projects is that it may be difficult to define measurement units for all indicators in a way that is comparable between projects operating in different socio-economic, political or environmental settings, or in implementing different types of activities. One approach to resolving this problem would be to define subcategories for those indicators that are likely to mean different things in different contexts, to ensure that only comparable values are provided, enabling aggregation. For example, for indicators that relate to the provision of ecosystem services, a list of ecosystem services could be provided, together with the unit of measurement to be used.
If projects are given the flexibility to deviate from using the standard indicators, where a strong justification can be provided, providing suggestions for further indicators (perhaps including some of those not presented as possible standard indicators in section 4 above) could be a useful resource for projects to draw upon. Furthermore, such a list may enable projects to identify suitable indicators for Aichi Biodiversity Targets that are not a priority for them, thereby providing an additional source of information to BMUB.
For those Aichi Biodiversity Targets and their components where it has not yet been possible to identify suitable standard indicators that meet all relevant criteria, projects could be asked to develop their own indicators, using the full list of possible indicators as a starting point. Plans and reports of IKI projects addressing these Targets could be reviewed after 2-3 years in order to note indicators that have been successfully monitored. These indicators could then be adopted as standard indicators.
The aggregation of information from across multiple projects can be supported by applying appropriate software such as Sciforma or Miradi Share.
Assessing impact in relation to both quality and quantity
Concerns have been raised about the risk that an overemphasis on quantitative measures could lead to project proponents and/or evaluators favouring certain types of projects and activities over others, which could come at the expense of project quality. This could compromise the effectiveness of IKI as a catalyst for progress towards the Aichi Biodiversity Targets. For example, projects focusing on initiating long-term change, or trialling innovative approaches that could later be up-scaled, might be at a disadvantage due to not being able to produce large measurable impacts within the project lifetime. Also, project managers might be tempted to go for ‘low-hanging fruit’, for example, by implementing low-intensity interventions covering larger areas, involving higher numbers of participants or activities that are easier to measure, rather than aiming for the most appropriate scale of interventions in the project context.
To reduce these risks, BMUB could make it clear that projects will be assessed against their own objectives with regard to the Aichi Biodiversity Targets. It could also communicate that selection of comparatively low quantitative targets will not be interpreted negatively if a good reason is provided.

76
Examples of reasons could include: if the project aims to develop innovative and replicable solutions to a complex problem; or if low indicator values are to be expected due to geographic or political/administrative characteristics of the project host country/countries. Finally, requiring projects to provide indicator values together with a qualitative narrative could help to ensure that BMUB can assess the full achievements of IKI beyond immediate, measurable, quantitative impacts. The narrative could be required to describe what has been achieved during the project lifetime related to the Strategic Plan for Biodiversity 2011-2020, highlight additional impacts expected in the long-term, and acknowledge any caveats in the monitoring results.
Similarly, when reporting on the cumulative contribution of IKI to implementation of the Strategic Plan for Biodiversity 2011-2020 and to biodiversity conservation more generally, including both quantitative reporting of indicator values along with a qualitative description can help ensure the full impact and contribution is presented. A suggested format could include the following points:
• Total funding from IKI to projects; • A selection of best practice examples of project results, outputs and outcomes under each
Target; • Key statistics, possibly for each Target, to provide an overview; • Clear acknowledgement of any caveats regarding issues with aggregating data or potential
double counting due to the fact that several collaborators contributed to an observed impact.
Addressing attribution of impacts
Ensuring that communications on project or IKI-wide impacts are accurate in accounting for the attribution of impact will strengthen understanding of how the project, and IKI as a whole, has contributed to the Aichi Biodiversity Targets. Particularly for projects working on larger scales, or on issues that are normally addressed in conjunction with other actors, quantitatively attributing what proportion of the change is due to the actions of one project over another is challenging and may not be practical. For example, progress towards Aichi Biodiversity Target 2 (the integration of biodiversity into national and local strategies and plans) could be measured through monitoring the trend in the number of relevant national strategies that address biodiversity and ecosystem service values. However, it will normally be difficult to assess how much a single project has contributed to this trend, unless direct references are included in the plans or programmes (something that is perhaps unlikely, especially for larger countries or higher-level strategies). Generally, attribution will be better understood if projects provide a thorough assessment of possible confounding factors and interaction with other actors at the time of submitting the project proposal, and if they keep track of these during the project lifetime.
Several options for addressing attribution have been identified and should be considered by BMUB:
1. Projects could be asked to provide a qualitative assessment of the degree to which observed changes are due to the project, for example, by using categories such as ‘would not have happened without the project’, ‘was strongly supported by the project’, ‘received some support from the project’ or ‘happened for reasons outside the project’), which could be supported by a short narrative. IKI-wide aggregation of impact could then be differentiated based on these categories. In order to not disincentivise collaboration within such a system, it may be important to highlight the benefits of collaborative approaches and clarify that IKI supports collaboration even though this may

77
mean a change cannot be attributed to one project alone. This could be achieved through IKI reports having a dedicated section on ‘collaboration’.
2. BMUB could assess the degree to which projects have contributed to observed changes based on information supplied by projects, including how the project anticipates it will achieve the desired impact, interactions with other actors and possible confounding factors, in order to make assessments more comparable. The aggregation of indicators would then be undertaken depending on the degree of contribution, as described above in option 1.
3. An explicit decision could be made not to attempt any assessment of the degree to which IKI contributed to observed changes, but to record all changes within the projects’ area of influence, and communicate the indicator values accordingly (i.e. stating that no assumptions about attribution are made).
Facilitating contributions of projects to national reporting
Where project data and indicators can contribute to monitoring of NBSAPs, there can be significant benefits to national reporting to the CBD. Therefore, BMUB could encourage project teams to consult with the relevant CBD National Focal Point to determine the current status of NBSAP revision and national target and indicator development.
If national level indicators have not yet been developed, projects should establish whether they are planned and are likely to have overlapping data requirements with the project monitoring. In this case, project teams should work closely with the CBD National Focal Point to ensure that, where feasible and appropriate, data collection efforts are complementary, contributing to, or drawing from, the national process. If national level indicators have been developed, and one or more is directly relevant to the project, the project should determine if any data collection efforts are ongoing or planned that the project could contribute to or draw from.
However, there are likely to be limits on the degree to which project monitoring can contribute to national-level indicators. For instance, many projects are covering only parts of one or more countries, not the whole of a national territory. Also, countries may choose not to develop national targets, and therefore indicators, for every Aichi Biodiversity Target. Therefore, project monitoring may not be relevant if the project focus does not coincide with the national Aichi Biodiversity Target priorities.
Allowing further development of monitoring plans after submission of project proposals
There are a number of possible reasons why it may become desirable to adjust monitoring concepts after submission of a project proposal. For example, baseline data is often necessary in order to fully define an indicator, but for some projects collection of relevant information can take a significant amount of time. BMUB could therefore consider accepting monitoring plans where indicators are not fully defined, provided that the proposal demonstrates a good understanding of the relevant issues, and that a full monitoring plan, including baselines, will be developed within a specified timeframe. However, it will be necessary to ensure that the level of ambition for the monitoring plan is sufficiently clear, to avoid the risk that project managers try to minimize the monitoring effort required once the proposal has been approved. Another option would be to apply a similar model to the Global Environmental Facility of scoping grants to develop monitoring and evaluation frameworks, including baselines.

78
Additionally, allowing projects to adapt and review their monitoring plan during the course of the project lifespan enables change in project activities to be taken into account, including if they contribute to more Aichi Biodiversity Targets than originally planned. Projects may be hesitant to produce too ambitious a Theory of Change at the outset so that they do not fail to achieve it. Providing projects with a simplified format for reporting additional project achievements may be needed, as if projects are forced to fulfil an extensive standardised monitoring plan for any additional impacts that they would like to report on, over and above what is contained in their monitoring concept, they may choose not to do so.
Changes in monitoring may also be needed as, in some cases, additional information might become available during project implementation that could shift the original baselines used by the projects. Furthermore, such additional information may influence the assessment of which indicators and monitoring parameters (for example, timescale) are most suitable. For example, a project aiming to improve fisheries sustainability may identify all target and bycatch species during the project proposal development. During the project implementation, it may become clear that additional species are in the area. Therefore, projects should adapt their monitoring plan, as appropriate, to include indicators of populations of the additional species. If any of these newly identified species are considered locally or globally threatened, the project may need to consider additional indicators, such as the presence/absence of species recovery plans. The project may equally discover that destructive fishing practices are used in the project area that were not reported, and that it is essential to address these practices in order to achieve the project objectives. In this case, it may be appropriate to include an indicator of destructive fishing practices in the project area.
The discovery of additional information could place projects in a difficult situation with regard to their monitoring and reporting obligations, especially if the new information decreases the numerical performance of the project as demonstrated by indicators. This could lead to projects avoiding the disclosure of additional information and continuing to use original monitoring plans that may not appropriately reveal the impact of the project. BMUB should consider clarifying that improvements to the knowledge base will be counted as a positive project result even when this leads to a re-evaluation of overall project performance.
Facilitating continued monitoring of impacts after the end of projects
The impacts of projects are likely to (and should) extend beyond the project lifespan, especially for Aichi Biodiversity Target components related to ecosystem restoration or to enhancing ecosystem resilience. Long-term monitoring to capture such impacts will require sufficient resources. Options to support such monitoring beyond the project lifespan include:
1. Projects could be required to identify long-term monitoring needs and proposed ways to address them during project development (for example, at the project concept note stage), and ensure that necessary activities are included in the project budget.
2. BMUB could create a separate fund for longer-term monitoring and evaluation that projects could apply for during their implementation.
3. BMUB could identify funding to review all, or a selection of, IKI projects 10 years after the project end date, and to collect relevant information on project impacts.

79
Another possibility for improving long-term monitoring is to encourage project proponents to link with national monitoring and reporting efforts, and involve national and local institutions or organisations in monitoring activities during the project period. In the case of projects that are focused on the establishment of programmes or funds to support CBD implementation, requiring these to develop or identify appropriate arrangements to monitor the biodiversity impacts of future activities supported by the programme or fund would also support the development of long-term monitoring. The information collected from these monitoring arrangements could be channelled to IKI if applicable.
BMUB could choose to request that projects set aside a 3-month phase at the end of the project for work on final impact monitoring. However, in reality there may be a high risk that project activities would encroach on the time allocated for such a phase, limiting its overall contribution to monitoring. In addition, BMUB could set an obligatory percentage of IKI project budgets that should be spent on monitoring.
Establishing a consistent and comparable monitoring system across all IKI Focal Areas
Considering all of the factors outlined in this report will help in developing a successful impact monitoring system for IKI Focal Area IV. However, given that the activities undertaken by projects in IKI Focal Areas II, III and IV (adaptation, including ecosystem-based adaptation, conserving natural carbon sinks with a focus on reducing emissions from deforestation and forest degradation, and conserving biological diversity) are likely to share many of the same characteristics, consideration of coherence with regard to monitoring and reporting requirements is important. One key issue is ensuring that Focal Area IV projects have the same stringent monitoring requirements with regard to co-costs, in order to ensure that the project does not have any indirect or unintended negative effects. This issue will likely be addressed by the BMUB social and environmental safeguards policy currently under development, which may provide a process for how IKI projects will be assessed for maximisation of positive impacts and minimisation/avoidance of negative impacts across all four Focal Areas. In relation to the biodiversity impact monitoring options outlined in this study, it would also be desirable for contributions to the Strategic Plan for Biodiversity 2011-2020 of relevant projects in Focal Areas II and III to be recorded, and for comparable indicators and scope in monitoring to be required across all ecosystem-based project activities. For example, ecosystem-based adaptation projects could be asked to report on their contribution to the Aichi Biodiversity Targets on enhancing ecosystem resilience and/or restoring ecosystems that provide essential services, and ecosystem-based mitigation projects could report on the Target on maintaining ecosystem carbon stocks.

80
6 References
AZE. 2014. ‘AZE Overview’. Alliance for Zero Extinction. Available at: http://www.zeroextinction.org/overviewofaze.htm Accessed 01/05/2014
BIODIVERSITY INDICATORS PARTNERSHIP. 2011. Guidance for National Biodiversity Indicator Development and Use. UNEP World Conservation Monitoring Centre, Cambridge, UK; 40pp.
CENTRE FOR THEORY OF CHANGE. 2014. ‘What is Theory of Change?’ Centre for Theory of Change. Available at: http://www.theoryofchange.org/what-is-theory-of-change/ Accessed 15/05/2014.
EPPLE, C., DUNNING, E. 2013. Ecosystem resilience to climate change: What is it and how can it be addressed in the context of climate change adaptation? Working document for the Mountain EbA Project. Revised draft February 2013. UNEP World Conservation Monitoring Centre, Cambridge.
ERVIN, J. 2003. WWF: Rapid Assessment and Prioritisation of Protected Area Management (RAPPAM) Methodology. WWF. Gland, Switzerland.
HOCKINGS, M., STOLTON, S., LEVERINGTON, F., DUDLEY, N. & COURRAU, J. 2006. Evaluating Effectiveness: A framework for assessing management effectiveness of protected areas. Second edition. IUCN, Gland, Switzerland and Cambridge, UK.
IKI (International Climate Initiative). 2014. ‘The International Climate Initiative’. German Federal Ministry for the Environment, Nature Conservation, Building, and Nuclear Safety. Available at http://www.international-climate-initiative.com/en/ Accessed 01/04/2014.
MANT, R., MUNROE, R., WORONEICKI, S., VÄÄNÄNEN, E., KAPOS, V., HEATH, M., GROßHEIM, C., KÜMPER-SCHLAKE, L. 2014. Using criteria to strengthen biodiversity considerations: Recommendations for the International Climate Initiative (IKI), UNEP World Conservation Monitoring Centre, Cambridge, UK. http://www.unep-wcmc.org/resources-and-data/biodiversity-criteria-in-iki
SECRETARIAT OF THE CONVENTION ON BIOLOGICAL DIVERSITY. No date. Quick Guides to the Aichi Biodiversity Targets: Aichi Target 3 – Incentives. Secretariat of the Convention on Biological Diversity. Reformed. Available at: https://www.cbd.int/doc/strategic-plan/targets/T3-quick-guide-en.pdf Accessed 01/04/2014
SECRETARIAT OF THE CONVENTION ON BIOLOGICAL DIVERSITY. 2012. NBSAP training modules, Version 2 – Module B-5. Ensuring Inclusive Societal Engagement in the Development, Implementation and Updating of NBSAPs. Montreal, July 2012 (revised).
SOCIETY FOR ECOLOGICAL RESTORATION INTERNATIONAL SCIENCE & POLICY WORKING GROUP. 2004. The SER International Primer on Ecological Restoration. www.ser.org & Tucson: Society for Ecological Restoration International.
STEPHENSON, P.J., O’CONNOR, S. 2014. A Case Study of Conservation Monitoring Related to Aichi Targets: Experiences and lessons from WWF. WWF International, Gland, Switzerland.

81
WESTMAN, W. 1978. Measuring the Inertia and Resilience of Ecosystems Bioscience, Vol. 28, No. 11, pp.705-710
WWF. 2014. ‘What is an ecoregion?’ Available at: http://wwf.panda.org/about_our_earth/ecoregions/about/what_is_an_ecoregion/ Accessed 01/05/2014

82
7 Annexes
7.1 Annex A: List of projects having a primary biodiversity focus and reason to address the Strategic Plan for Biodiversity 2011-2020
Country/ Region Project code Title Implementing Agency (where known)
1 Indonesia 11_IV+_001_IDN_K_Leuser Ökosystem Protection of climate and biodiversity in the Leuser Ecosystem, Sumatra
2 Indonesia 11_IV+_002_IDN_G_Biodiversität und Klimawandel
Biodiversity and climate change GIZ
3 Indonesia 11_IV+_003_IDN_A_Marine Protected Areas Lesser Sunda
Developing a resilient and effectively managed network of Marine Protected Areas in the Lesser Sunda Ecoregion.
TNC
4 Malaysia, Philippines, Indonesia
11_IV+_004_Asia_G_Sulu Sulawesi Marine Ecoregion
Implementation of a trilateral action plan for the Sulu-Sulawesi Marine Ecoregion
GIZ
5 Brazil 11_IV+_005_BRA_G_SNUC Consolidating the Brazilian National System of Conservation Units – SNUC
GIZ
6 Brazil 11_IV+_006_BRA_G_Biodiversitätsschutz_unternehmerisches Handeln
Integration of climate and biodiversity protection in business
GIZ
7 India 11_IV+_007_IND_G_Wetland Coastal and Marine Protected Areas
Participatory Management for Sustainable Use and Conservation of Wetland, Coastal and Marine of Protected Areas
GIZ
8 Mexico 11_IV+_008_MEX_G_Meeresschutzgebiete Protection and sustainable use of coastal and marine biodiversity in the Gulf of California
GIZ
9 Philippines 11_IV+_009_PHL_G_Protected Area Management Enhancement
Protected Area Management Enhancement in the Philippines
GIZ
10 Peru 11_IV+_010_PER_A_Manu Biosphere Reserve
Forest protection and restoration in the Manu Biosphere Reserve
FZS
11 Global 11_IV+_011_Global_A_Life Web Life Web
Lifeweb – Partnerships for financing biodiversity CBD

83
12 Antigua, Barbuda, Dominica, Grenada, St. Lucia, St. Vincent, The Grenadines
12_IV+_012_ Caribbean_A_ECMCC Climate-Resilient Eastern Caribbean Marine Conservation Corridor (ECMCC)
TNC
13 Brazil 12_IV+_013_ BRA_K_Mata Atlantica III Protection of climate and biodiversity in the Mata Atlantica
GIZ
14 Brazil 12_IV+_013_ BRA_G_Mata Atlantica III Monitoring climate-relevant biodiversity in protected areas
GIZ
15 Brazil, India, Mexico, Vietnam
12_IV+_014_ Global_G_Methodeninventar Biodiversität
ValuES: Methods for mainstreaming of biodiversity in international cooperation
GIZ
16 Fiji, Kiribati, Solomon, Islands Tonga, Tuvalu, Vanuatu
12_IV+_015_ Pacific_G_Meeres- und Küstenbiodiversitätsmanagement
Marine and coastal biodiversity management in Pacific island states and atolls
GIZ
17 Mexico 12_IV+_016_MEX_G_Finanzierungsinstrumente
Valuation of Mexico's Protected Areas Climate and Ecosystem Services: a Tool for Innovative Climate Change and Biodiversity Financing
GIZ
18 Peru 12_IV+_017_PER_G_Biodiversitätsschutz Co-Management
Conservation and sustainable use of biodiversity through Co-Management in the Amazon region
GIZ
19 Indonesia 12_IV+_018_IDN_K_Naturschutzkonzessionen Skizze 103_IV_12
Forest conservation through Ecosystem Restoration Concessions in Indonesia
20 Global 12_IV+_019_Global_G_Blue Solutions Skizze 061_IV_12
Blue Solutions – Implementing the CBD Strategic Plan in the field of marine and coastal biodiversity
GIZ
21 Colombia 12_IV+_020_COL_G_Nationalparksystem Skizze 030_IV_12
Strengthening the system of protect areas for the protection of climate and biodiversity
GIZ
22 Global 12_IV+_026_M_UNDP_Biofin Biofin – Building Transformative Policy and Financing Frameworks to Increase Investment in Biodiversity Management
UNDP

84
23 Colombia, Zambia, Tanzania, Vietnam
13_IV+_021_Global_A_Governing Biodiversity Governing the integration of development planning, climate change adaptation and biodiversity conservation through legal and participatory mechanisms at national and local scales
24 Brazil, Ecuador, Colombia, Peru
13_IV+_022_Lateinamerika_A_Protected Areas and Climate Change Adaptation
Building resilience of the Amazon Biome: Protected Areas as an integrated part of climate change adaptation
WWF
25 Ethiopia 13_IV+_028_ETH_A_Kaffeewälder, Skizze: 266_IV_13
Biodiversity and climate change: Community-based concepts for the conservation, management and development of areas of origin of wild coffee
NABU
26 Indonesia, Federated States of Micronesia, Philippines
13_IV+_031_Asien_A_pride campaigns, Skizze: 185_IV_13
Scaling up innovative, community-based protection of coastal biodiversity in Indonesia, Philippines, and Pacific
RARE
27 Global 13_IV+_039_Global_M_ICCAs support Support to indigenous peoples’ and community conserved areas and territories (ICCAs) through the GEF Small Grants Programme (SGP) as a contribution to the achievement of Targets 11, 14 and 18 of the CBD Aichi 2020 framework
UNDP
28 Global 13_IV+_040_Global_A_Global Nature Global Nature Global Nature Fund
29 Benin, Togo
13_IV+_029_Afrika_G_Biosphärenreservat Mono, Skizze 102_IV_13
Transboundary biosphere reserve Adjame-Mono GIZ
30 Namibia 13_IV+_030_NAM_G_Umsetzung Biodiversitätsstrategie, Skizze: 108_IV_13
Resource mobilization for the implementation of the updated biodiversity strategy in Namibia
GIZ
31 Philippines 13_IV+_032_PHL_G_Waldschutz Panay Forest and climate protection in Panay (additional funds for current project)
GIZ
32 Costa Rica 13_IV+_035_CRI_G_PNCB Implementation of the national biocorridor programme (PNCB) in the context of the national biodiversity strategy in Costa Rica
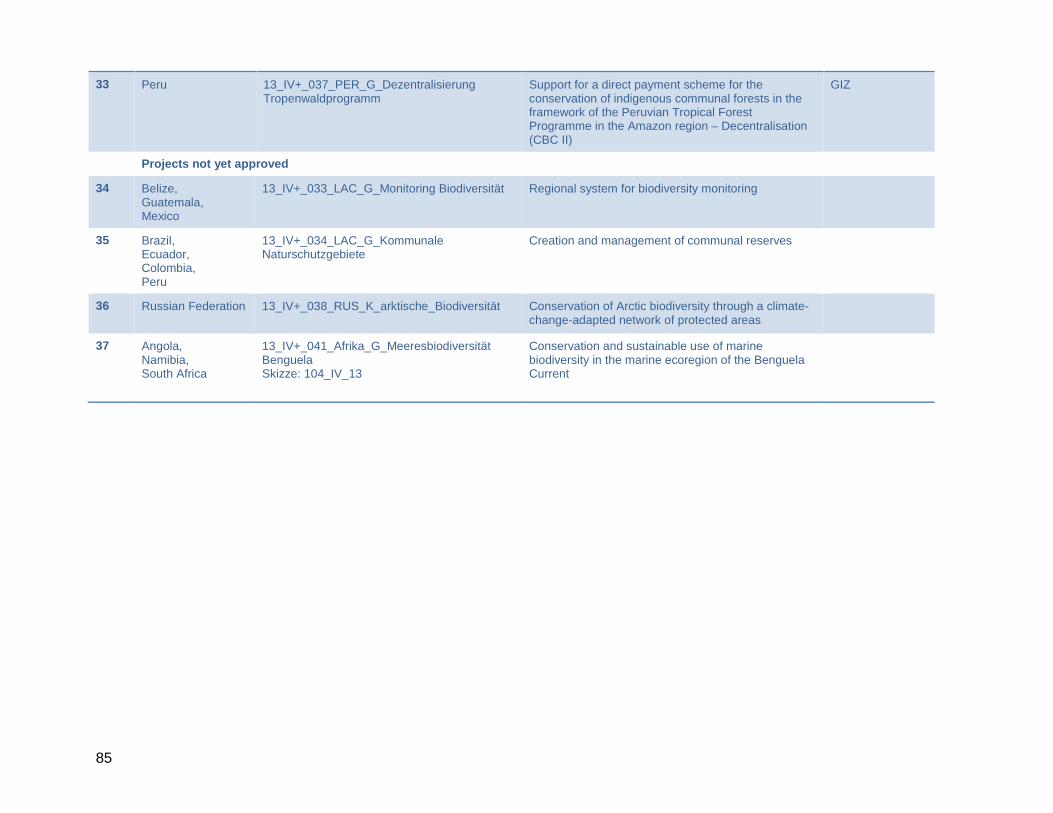
85
33 Peru 13_IV+_037_PER_G_Dezentralisierung Tropenwaldprogramm
Support for a direct payment scheme for the conservation of indigenous communal forests in the framework of the Peruvian Tropical Forest Programme in the Amazon region – Decentralisation (CBC II)
GIZ
Projects not yet approved
34 Belize, Guatemala, Mexico
13_IV+_033_LAC_G_Monitoring Biodiversität Regional system for biodiversity monitoring
35 Brazil, Ecuador, Colombia, Peru
13_IV+_034_LAC_G_Kommunale Naturschutzgebiete
Creation and management of communal reserves
36 Russian Federation 13_IV+_038_RUS_K_arktische_Biodiversität Conservation of Arctic biodiversity through a climate-change-adapted network of protected areas
37 Angola, Namibia, South Africa
13_IV+_041_Afrika_G_Meeresbiodiversität Benguela Skizze: 104_IV_13
Conservation and sustainable use of marine biodiversity in the marine ecoregion of the Benguela Current

86
7.2 Annex B: Spreadsheet of potential indicators for each Aichi Biodiversity Target, including those currently not considered IKI priorities (see attached file)
7.3 Annex C: Workshop report (see attached file)