monitoring the performance of a construction sediment · pdf file424 monitoring a construction...
TRANSCRIPT
Pyatt, L. and J. Li. 2006. "Monitoring the Performance of a Construction Sediment Pond." Journal of Water Management Modeling R225-18. doi: 10.14796/JWMM.R225-18.© CHI 2006 www.chijournal.org ISSN: 2292-6062 (Formerly in Intelligent Modeling of Urban Water Systems. ISBN: 0-9736716-2-9)
423
18 Monitoring the Performance of a
Construction Sediment Pond
Lindsay Pyatt and James Li
Construction sites are significant water pollution sources in urban watersheds. In cooperation with the Government of Canada’s Great Lakes Sustainability Fund (GLSF), Town of Richmond Hill (RH), Toronto and Regions Conservation Authority (TRCA), Department of Fisheries and Oceans (DFO), Ontario Ministry of Environment (MOE), National Water Research Institute (NWRI), a Ryerson University’s research team monitored a sediment control pond in the Town of Richmond Hill in 2002. The objectives of the monitoring study are to (i) characterize runoff entering and leaving the sediment control pond during the construction phase; and (ii) evaluate the sediment removal efficiency of the pond. The pond experienced high removal rates for suspended solids during the monitoring period. However, suspended solids exiting the pond during some events were high which might cause downstream fishery impact. This study has demonstrated that strictly erosion and sediment control requirements are necessary for construction sites to prevent downstream water quality impacts.
18.1 Introduction
Historically, it has been demonstrated that virtually all activities engaged on land result in some degree of impact on water systems (Conservation
424 Monitoring a Construction Sediment Pond
Ontario, 2001). For example, construction sites are considered significant sources of sediment loads into rivers and streams (MOE & TRCA, 1992; Clarifica, 2001; Harbor, 1999). It is well documented that excessive sediment loads entering natural watercourses impairs downstream habitats (Kerr, 1995; Lee & Jones, 1984; Nighman & Harbor, 1995; Fennessey & Jarret, 1994; Bhaduri et al, 1995; Greb & Bannerman, 1997; Millen et al, 1997; Wu, 1989; MOE, 2000; Greenland Inc. & TRCA, 2000; Clarifica, 2001; Whipple, 1979; Waneilista and Yousef, 1993; Zarull et al, 1999). Both the Ontario Ministry of the Environment (MOE), and the Toronto and Regions Conservation Authority (TRCA) have stated that soil erosion at construction sites are a major cause of the degradation of rivers and streams in urban areas. According to these government agencies, tons of sediment from construction activities is entering Ontario watercourses each year (MOE & TRCA, 1992). This, coupled with ineffective erosion and sediment control measures, is responsible for the degradation of water quality and fish habitats, the reduction in navigation in waterways, and increase in flooding (MOE & MTRCA, 1992; Roesner, 1999; Clarifica, 2001). According to the Ontario Ministry of Municipal Affairs and Housing, Ontario will continue to grow, with an increase in 2.5 million new residents by the year 2015 (MAH, 2002). Thus, excessive sediment loads generated from construction sites will continue to threaten significant portions of watercourses in Ontario.
Temporary sedimentation basins are commonly used in Toronto, and many other jurisdictions, to reduce receiving water impacts associated with runoff sediment from construction sites (Millen et al, 1997; Schueler & Lugbill, 1990; MOE, 2000; Greenland Inc. & TRCA, 2001; Fennessey & Jarret, 1994; Bhaduri et al, 1995). These sediment control ponds are constructed according to specific design criteria that aim to trap sediments within the pond thereby reducing impacts at receiving waters (Nighman & Harbour, 1995; Millen et al, 1997; Papa et al, 1999). In 1989, the MNR implemented a sizing criteria of sediment control ponds in Ontario based on a storage of 125 m3/ha and a detention time of 24 h in a dry pond setting (Clarifica, 2001). MOE produced the Storm Water Management Practices Planning and Design Manual (SWMPP) in 1994 and guidelines (2003) that include design criteria for stormwater management ponds in developed areas. Subsequently, the TRCA recommended that both sediment control ponds during construction phase and stormwater quality control ponds after construction phase be sized in accordance to the MOE guidelines and a permanent pool be established to improve pollutant trapping efficiency (Clarifica, 2001). It was believed that the sizing criteria and permanent pool requirement for the stormwater quality pond would provide higher removal

Monitoring a Construction Sediment Pond 425
efficiencies than the MNR design criteria for sediment control ponds. However, in 2001 the TRCA produced the Urban Construction Sediment Control Study that stated the design criteria were ineffective in controlling runoff from urban construction sites (Greenland Inc. & TRCA, 2001). It is estimated that during construction, when soils are fully or partially exposed, rates of erosion can increase up to 40,000 times that of undeveloped lands or forests (Clarifica, 2001; Harbor, 1999). These erosion rates, coupled with inefficient erosion and sediment control (ESC) practices, may violate regulatory requirements of the Federal Fisheries Act that prohibits any harmful alteration, disruption, or destruction of fish habitat (Clarifica, 2001).
In the past decade, there have been several efforts, including the TRCA study, to address the issue of ineffective ESC measures. In 2002, the TRCA commissioned Clarifica Inc. to produce a report titled Investigation to develop an improved Sizing Approach for Construction Sediment Control Facilities. The report discussed the impacts of sediment releases to the environment, and presented a modeling framework to simulate ESC within construction sites. Within the same time period, TRCA commissioned Clarifica Inc. to develop a model by-law for municipalities within the TRCA jurisdiction to improve ESC measures from urban construction activities, and an implementation procedure for the new/revised by-law.
The ultimate goal for these efforts is to improve ESC measures by enhancing our knowledge on erosion processes and its impacts, improving sizing criteria for construction sediment ponds, and developing a simplified analytical tool for sizing SWM facilities. It is hoped that these efforts will result in the technology transfer to the appropriate municipal authorities. In order to reach this goal, a monitoring program was needed to evaluate the performance of a sediment control pond. There are very few research works on field performance evaluation of construction sediment ponds (Schuller & Lugbill, 1990; Oscanyon, 1975; Bhaduri et al, 1995 Nighman & Harbour, 1995). Moreover, the implementation of the MOE criteria for construction sediment ponds has become a common practice in the Toronto area. However, construction sediment ponds designed using these criteria have not been evaluated using field monitoring programs (Clarifica, 2001). Thus, there is a need to evaluate these sediment pond design criteria.
Monitoring construction sediment ponds can be difficult. The Metropolitan Washington Council of Governments in Maryland monitored the performance of sediment control measures commonly used within their jurisdiction (Schueler & Lugbill, 1990). The study remarked how monitoring and site constraints made it difficult and sometimes impossible to collect data in the changing environment typical of construction sites
426 Monitoring a Construction Sediment Pond
(Schueler & Lugbill, 1990). It also showed that monitoring could be difficult due to the extreme variability in suspended sediment concentrations entering the sediment controls (Schueler & Lugbill, 1990). Thus, a greater understanding is needed for monitoring these variable and complex sites.
To evaluate the performance of a construction sediment pond designed using the MOE criteria, Ryerson University in cooperation with MOE, National Water Research Institute (NWRI), TRCA, Department of Fisheries and Oceans (DFO), Great Lakes Sustainability Fund (GSLF) and the Town of Richmond Hill conducted a field monitoring study in 2002. This chapter discusses the monitoring methodology and presents the monitoring results.
18.2 Site Description
A construction sediment pond was monitored in the Town of Richmond Hill, Ontario by the Ryerson’s research team in 2002. The sediment control pond was designed using the MOE criteria, including the establishment of a permanent pool.
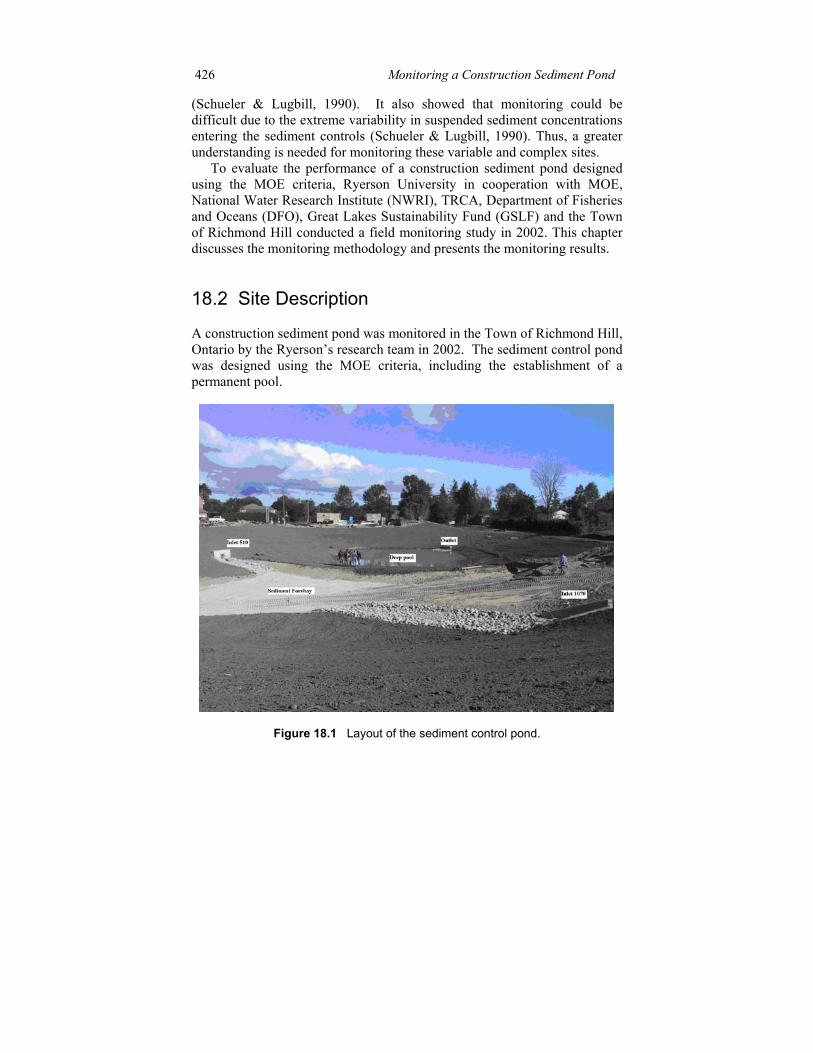
Figure 18.1 Layout of the sediment control pond.
Monitoring a Construction Sediment Pond 427
The sediment control pond released stormwater runoff, which eventually discharged into Lake Wilcox downstream. There were two inlets servicing a total drainage areas of 15.1 ha (Figure 18.1).
According to the design engineer, the pond was designed with water quality criteria of 24 h detention of the runoff from a 25mm short duration storm (Sabourin Kimble & Associates Ltd., 2000). Water quantity controls included 2 through 100 y post- to pre-development flows to a maximum outflow equalled to the capacity of a downstream roadside ditch (Sabourin Kimble & Associates Ltd., 2000). The permanent pool volume was calculated using the MOE criteria assuming a Level 1 fisheries habitat classification (Sabourin Kimble & Associates Ltd., 2000). The pond is equipped with a sediment forebay, where it is anticipated that the bulk of the coarse sediments will initially settle. To distinguish between the two inlets (Figure 18.1), the inlet located in the southwest end of the pond is referred to as ‘Inlet 1070’ (the diameter of the pipe is 1070 mm) while the second inlet, located on the opposite side is referred to as ‘Inlet 510’ (the diameter of the pipe is 510 mm).
18.3 Monitoring Objectives
In the 1994 MOE SWMPP guidelines, the design criteria regarding sedimentation, have raised several questions. For example, the SWMPP guidelines target sediment removal efficiencies are referred to urbanized stormwater runoff, not construction site runoff (Table 4.1 in SWMPP, 1994). In addition, particle size distribution and settling velocities (Table 3.3 in SWMPP, 1994) used to calculate the sizing of sediment forebays are also developed for urbanized stormwater runoff. It is not known whether construction sediment ponds designed using these criteria will be able to meet water quality objectives designed to protect downstream habitats. To address this issue, the objectives of the field monitoring study are to:
• monitor stormwater runoff entering and exiting thepond,
• estimate the sediment removal efficiency, and• identify the particle size distribution of sediment.
Water quality samples were collected at the field, processed and analyzed at the MOE laboratory for the parameters listed in Table 18.1. Furthermore, a tipping bucket rain gauge operated by the Town of Richmond Hill at a nearby municipal building was used to collect rainfall data.

428 Monitoring a Construction Sediment Pond
18.4 Materials and Methods
The study objectives were met through the use of wet weather water quality sampling equipment. To collect representative event data, flow measurements should be performed on the whole runoff event entering and leaving the pond (Pettersson, 1998). The challenge was to collect representative water quality samples throughout the event using a fixed number of water sampling bottles. The monitoring equipment included water quality samplers, flow loggers, and area velocity sensors. Three monitoring stations were set up at the Richmond Hill site: one at each of the inlets; one at the outlet. Each station was set up to collect water quantity data and water quality samples. The equipment and their use at the Richmond Hill study site, and the methods used to implement the monitoring program follow.
18.4.1 Water Quality Samples
Three ISCO 6712 portable samplers were installed at the two inlets and one outlet of the pond. ISCO samplers have enough memory to store five sampling programs and the sampled data such as timing of samples can be viewed through the sampler display on the controlled units. (ISCO, 1993).
Table 18.1 Water quality analysis.
PARAMETERS
Conductivity PH Turbidity Particle Size Distribution COD Alkalinity Total Solids, Suspended Solids, Dissolved Solids Nitrogen: Ammonia+ammonium, Nitrite, Nitrate+nitrite, TKN Phosphorous: Phosphate, Total phosphorous Metals: Aluminum, Arsenic, Barium, Berylium, Calcium, Cadmium, Cobalt, Chromium, Copper, Iron, Magnesium, Manganese, Molybdenum, Nickel, Lead, Selenium, Strontium, Titanium, Vanadium, Zinc
The samplers were set up to account for the variability in constituent concentration throughout the course of the runoff event. They were programmed to collect 1 discrete sample per bottle (a maximum of 24 bottles) at five-minute intervals, over a period of 120 min. It is important to
Monitoring a Construction Sediment Pond 429
recognize that the sampling period may not match the runoff event duration. As a result, the water samples may or may not be representative of the water quality characteristics of the runoff events. Each bottle could collect up to 1L of water sample. The samplers were equipped with discrete bottle or composite bottle kits. For each rainfall event, half of each discrete water sample was extracted for the analysis of total suspended solids (TSS) and the remaining half was combined with other discrete samples to form a composite sample. Composite samples were analyzed for all parameters outlined in Table 18.1.
18.4.2 Flow Measurements
Flow data at the two inlets and the outlet were collected through the use of area velocity sensors and flow loggers. Based on the Doppler effect, an area velocity sensor directly detects the average velocity of a stream as flow moves up or downstream (ISCO, 1993). It contains a differential pressure transducer that senses the hydrostatic pressure produced by the water above the sensor (ISCO, 1993). In addition, it can also be programmed to trigger an automatic water sampler when there is an increase in water level or flow. At the Richmond Hill study site, three ISCO area velocity sensors (termed as A/V probes) were used to measure flow velocities at the two inlets and the one outlet of the pond. They were also programmed to trigger the water sampling based on an increase in the pond level. Three 4150 Flow Loggers, manufactured by ISCO Inc., (ISCO, 1993) were used to store the measure flows. The FLOWLINK3, ISCO’s flow-data management software was used to program and download data from the flow loggers. Downloaded data were converted to Excel for interpretation and analysis.
18.4.3 Location of Monitoring Equipment
The location of a monitoring station depends on the type of data to be monitored. For example, the total runoff entering a pond can be monitored either at the upstream maintenance chambers (i.e. manholes) of the inlet sewers or at the inlet sewer outfalls. However, it was observed that a large bulkhead was positioned upstream of inlet 1070 to the Richmond Hill pond. While the bulkhead did obstruct the inlet flow, it was a characteristic of a typical construction sediment pond in Richmond Hill. An AV probe located upstream of the bulkhead could easily be flooded with backflow during a storm event or buried by accumulating sediment. Alternatively, an AV
430 Monitoring a Construction Sediment Pond
probe located immediate after the bulkhead, would be subject to a splashing “waterfall”-like condition resulting in incorrect measurements. For this study, the AV probe was located further downstream of the bulkhead where the flow was smooth and close to the inlet sewer outfall and pond interface. This was determined to be the best location for characterizing the inlet flow (ISCO,1997b).
Equipment flooding was a concern in the Richmond Hill study. As stated previously, the pond was monitored during the construction phase of local housing developments where bulkheads were installed upstream of the inlets to limit the discharge of sediment to the pond. As a result, the runoff passed through a pool between the sewer maintenance chamber and the bulkhead before entering the pond. While flooding of the local street did not occur, the bulkhead could backup enough water to surpass the engineered level of the maintenance chamber (i.e. over the chamber shelf). This eliminated the possibility of placing the monitoring equipment underground in the chamber. In addition, fluctuating pond levels during an event raised concerns on placing the monitoring equipment along the edge of the pond. As a result, the monitoring equipment was located just above the engineered 100 year-storm waterline. Several metres of intake line and an AV probe extension cable were used to compensate for the long distance.
All three monitoring stations were positioned above ground in reinforced huts. Each hut was secured to the ground by several 4 ft t-bar posts, driven into the ground, and attached to the hut. Other methods can be used to anchor a monitoring station, depending on site characteristics and materials present that may hinder or be used as an advantage in securing a monitoring station. For example, materials such as the concrete structures, large rocks, and packed soils, will make post-driving a challenging task.
It is also important to consider the hydraulic head between the water sampler and the location of the intake sieve. For example, the maximum height an ISCO 6712 auto sampler can be positioned and still draw samples is 8.5m (28ft). The distance between sampling points and samplers can affect sampler performance by under/over filling bottles even with programmed adjustments (i.e. hydraulic head, intake line length)(ISCO, 1997a; ISCO, 2000).
18.4.4 Rainfall Measurement
A tipping bucket rain gauge has been set up since 1996 on the roof of a municipal building located about one kilometer from the site by TQI Thompson Flow Investigation Ltd. on behalf of the Town of Richmond Hill.
Monitoring a Construction Sediment Pond 431
Runoff data collected at the site were correlated with the rainfall data measured at the municipal building.
18.4.5 Security
All equipment should be installed with thought of vandalism. In order to prevent this, each monitoring station requires security and protection to all equipment. At the Richmond Hill site, security measures included, reinforcement of the monitoring huts with corner brackets and cross braces, attachment of the hut directly to a solid object (i.e. concrete footing or fence post), anchorage of the huts to the ground, locks for doors or lids, and protective PVC piping for intake lines and cables. If applicable, natural vegetation (i.e. low lying shrubs) can be used as a façade to hide the presence of the samplers. If a rain gauge is used as a triggering mechanism for the samplers, the gauge should be located high above the ground (i.e. roof top) or out in the middle of the pond.
18.4.6 Equipment Installation
The Richmond Hill study experienced several installation and programming issues. In order to protect both the intake lines and the AV probe cable, PVC pipings were used to thread the cables through. The pipings can be buried or attached to the cement of the culvert. Additionally, the pipings also protected the lines and cables from damage caused by animals and environmental exposure. By keeping the line exposure to a minimum, no equipment cables or sampling lines were severed or split during the monitoring period.
The position of the AV probe in an inlet pipe should be located in an area that is flat and has no obstructions. For instance, spaces that occur between fitted culverts can cause irregular flow (i.e. riffle water or white capped water). In this case, a probe positioned immediately downstream of this kind of riffled water can cause irregularities in level measurements (ISCO, 1997b).
A stainless steel culvert ring can be used to attach the probe and intake to the inlet sewer pipe, but in some cases introduces error into the measurements. For example, space between the culvert and the bottom of the ring can cause water to flow above and below the ring. If the flow has a high velocity, the ring starts to vibrate, similar to a hydrofoil. The vibration can cause discrepancies in level measurements up to several millimeters.

432 Monitoring a Construction Sediment Pond
The Richmond Hill study did not use a culvert ring, but simply attached the probe and intake directly to the culvert using metal strapping. It should be noted that any type of strapping should be positioned at the back of the AV probe in order to avoid blocking the Doppler signal (ISCO, 1997b).
18.4.7 Sampling Program and Procedures
During the first few events, the sampling program may have to be adjusted. in a trial and error period. Programming attributes such as the hydraulic head, length of line, pump rates, and purging cycles can be determined during installation. However, some programming features are difficult to determine until several events have occurred and the data is reviewed.
In the Richmond Hill study, flow proportionate sampling was originally requested. However, after an event, the pond experienced a slow drawdown time causing backflow into the two inlet pipes resulting in pooling and reverse flow measurements. The water samplers were not triggered properly to collect samples under the programming conditions. As a result, the sampler was subsequently set to trigger based on an increase in level and paced to collect every five minutes. The logged flow data (at five-minute intervals) and the samples could then be calculated to reflect flow proportioning.
Depending on site characteristics, a sample program set to collect at time-weighted samples at five-minute intervals (120 min total) should be monitored carefully. The Richmond Hill study experienced runoff peaks within the 120 min of sampling, enabling the analysis to be representative of the first flush. In addition, there was little or no baseflow at the inlets discharging into the pond and dilution was not a concern.
18.5 Results and Discussion
The monitoring program at the Richmond Hill sediment control pond commenced at the beginning of August 2002. Throughout the fall season, ending at the end of October, six events were collected. Tables 18.2 and 18.3 show the quantity and quality characteristics of the influent and effluent at the sediment control pond.
The runoff coefficients of the site are found to be similar to those typically found in low-density residential development. However, the hydraulic detention time and average drawdown time are much shorter than
Monitoring a Construction Sediment Pond 433
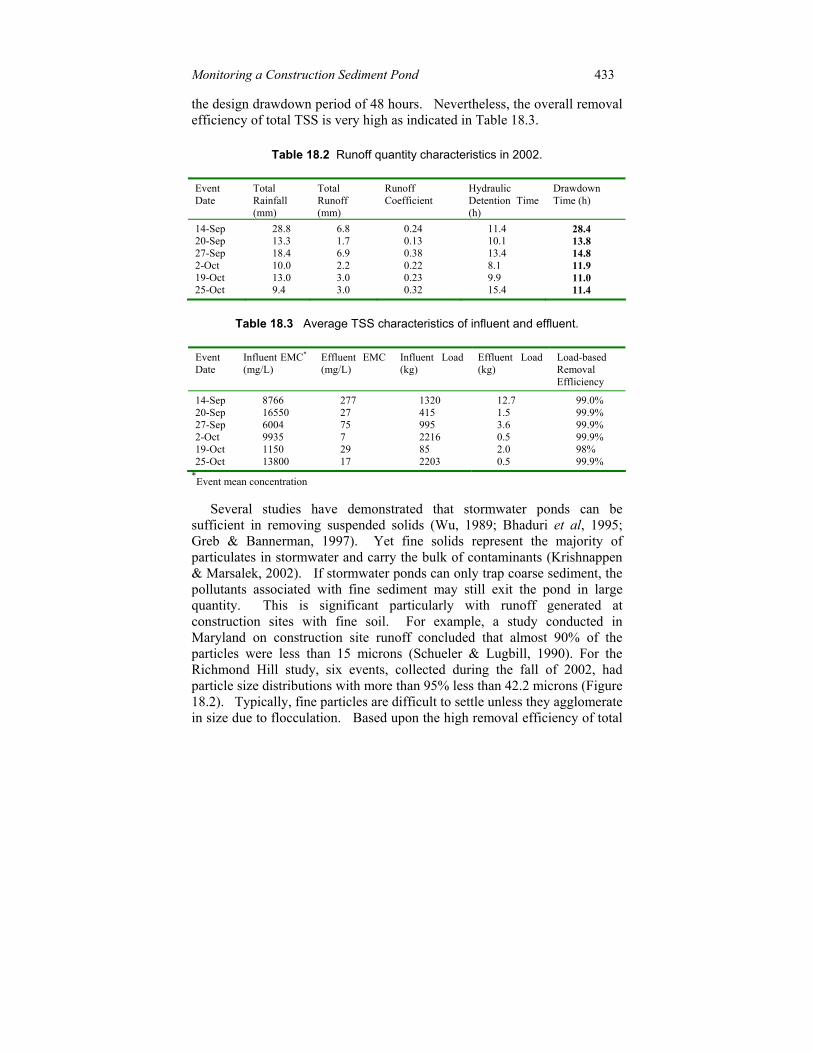
the design drawdown period of 48 hours. Nevertheless, the overall removal efficiency of total TSS is very high as indicated in Table 18.3.
Table 18.2 Runoff quantity characteristics in 2002.
Event Date
Total Rainfall (mm)
Total Runoff (mm)
Runoff Coefficient
Hydraulic Detention Time (h)
Drawdown Time (h)
14-Sep 28.8 6.8 0.24 11.4 28.4 20-Sep 13.3 1.7 0.13 10.1 13.8 27-Sep 18.4 6.9 0.38 13.4 14.8 2-Oct 10.0 2.2 0.22 8.1 11.9 19-Oct 13.0 3.0 0.23 9.9 11.0 25-Oct 9.4 3.0 0.32 15.4 11.4
Table 18.3 Average TSS characteristics of influent and effluent.
Event Date
Influent EMC* (mg/L)
Effluent EMC (mg/L)
Influent Load (kg)
Effluent Load (kg)
Load-based Removal Effliciency
14-Sep 8766 277 1320 12.7 99.0%20-Sep 16550 27 415 1.5 99.9% 27-Sep 6004 75 995 3.6 99.9% 2-Oct 9935 7 2216 0.5 99.9%19-Oct 1150 29 85 2.0 98% 25-Oct 13800 17 2203 0.5 99.9%
*Event mean concentration
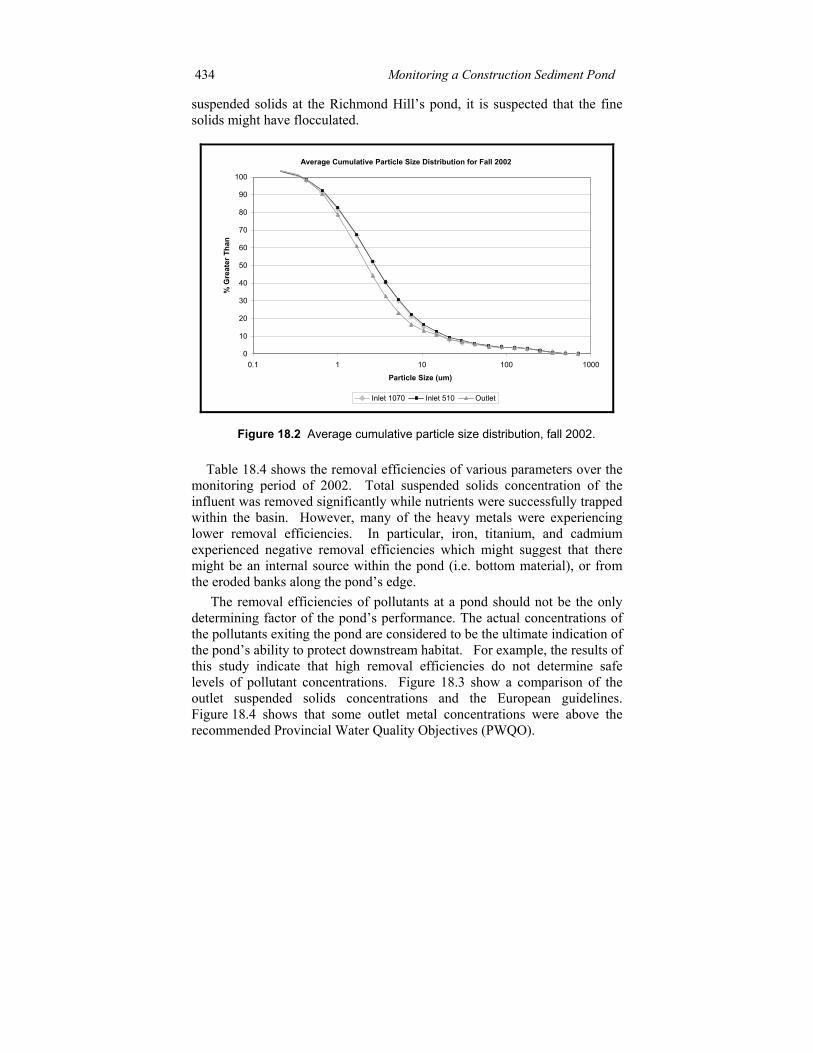
Several studies have demonstrated that stormwater ponds can be sufficient in removing suspended solids (Wu, 1989; Bhaduri et al, 1995; Greb & Bannerman, 1997). Yet fine solids represent the majority of particulates in stormwater and carry the bulk of contaminants (Krishnappen & Marsalek, 2002). If stormwater ponds can only trap coarse sediment, the pollutants associated with fine sediment may still exit the pond in large quantity. This is significant particularly with runoff generated at construction sites with fine soil. For example, a study conducted in Maryland on construction site runoff concluded that almost 90% of the particles were less than 15 microns (Schueler & Lugbill, 1990). For the Richmond Hill study, six events, collected during the fall of 2002, had particle size distributions with more than 95% less than 42.2 microns (Figure 18.2). Typically, fine particles are difficult to settle unless they agglomerate in size due to flocculation. Based upon the high removal efficiency of total
434 Monitoring a Construction Sediment Pond
suspended solids at the Richmond Hill’s pond, it is suspected that the fine solids might have flocculated.
Average Cumulative Particle Size Distribution for Fall 2002
0
10
20
30
40
50
60
70
80
90
100
0.1 1 10 100 1000
Particle Size (um)
% G
reat
er T
han
Inlet 1070 Inlet 510 Outlet
Figure 18.2 Average cumulative particle size distribution, fall 2002.
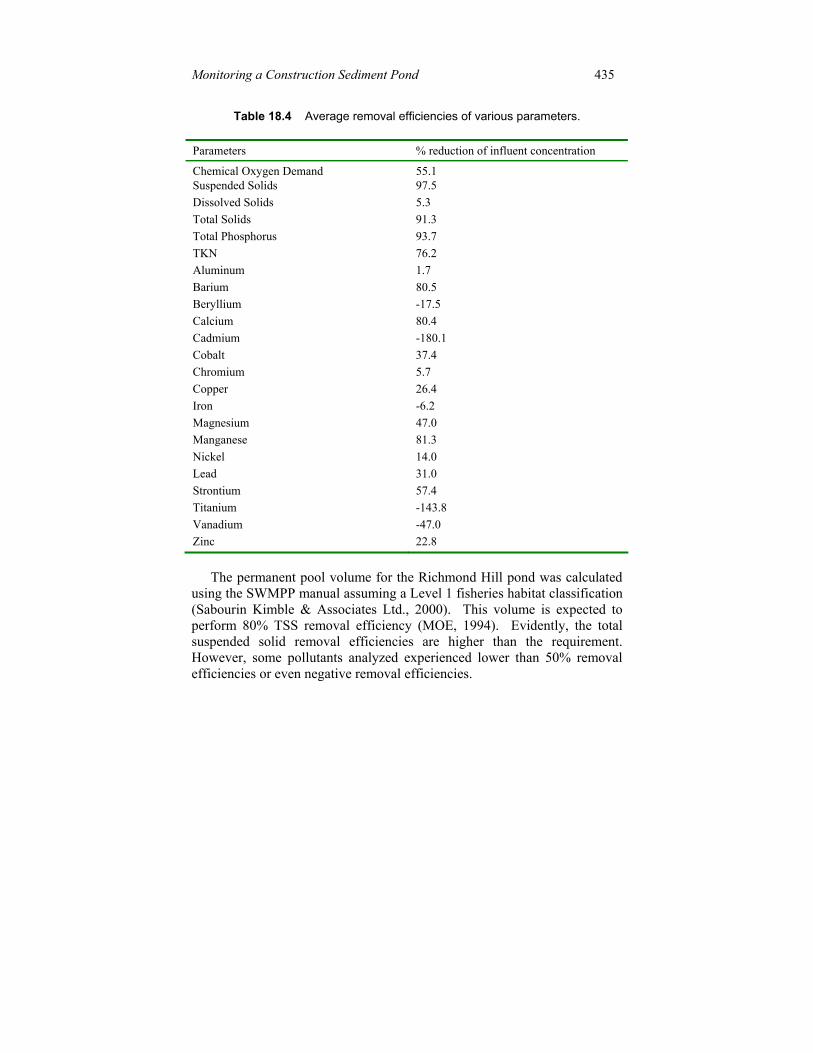
Table 18.4 shows the removal efficiencies of various parameters over the monitoring period of 2002. Total suspended solids concentration of the influent was removed significantly while nutrients were successfully trapped within the basin. However, many of the heavy metals were experiencing lower removal efficiencies. In particular, iron, titanium, and cadmium experienced negative removal efficiencies which might suggest that there might be an internal source within the pond (i.e. bottom material), or from the eroded banks along the pond’s edge.
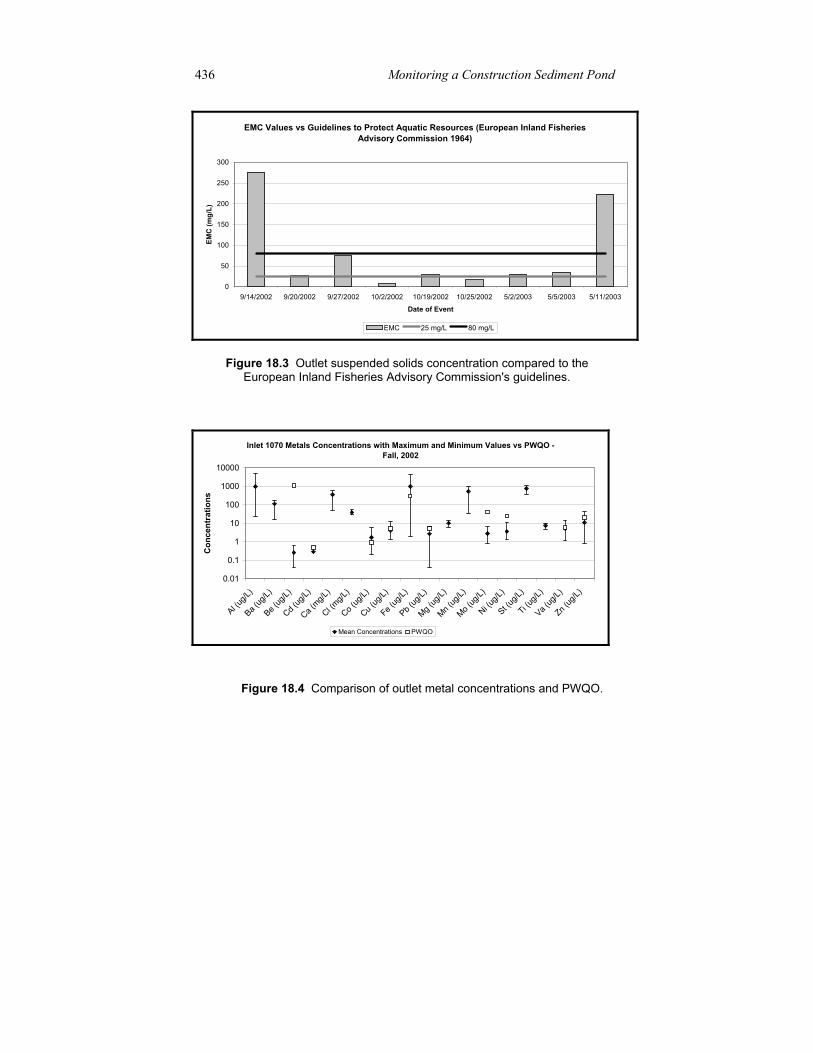
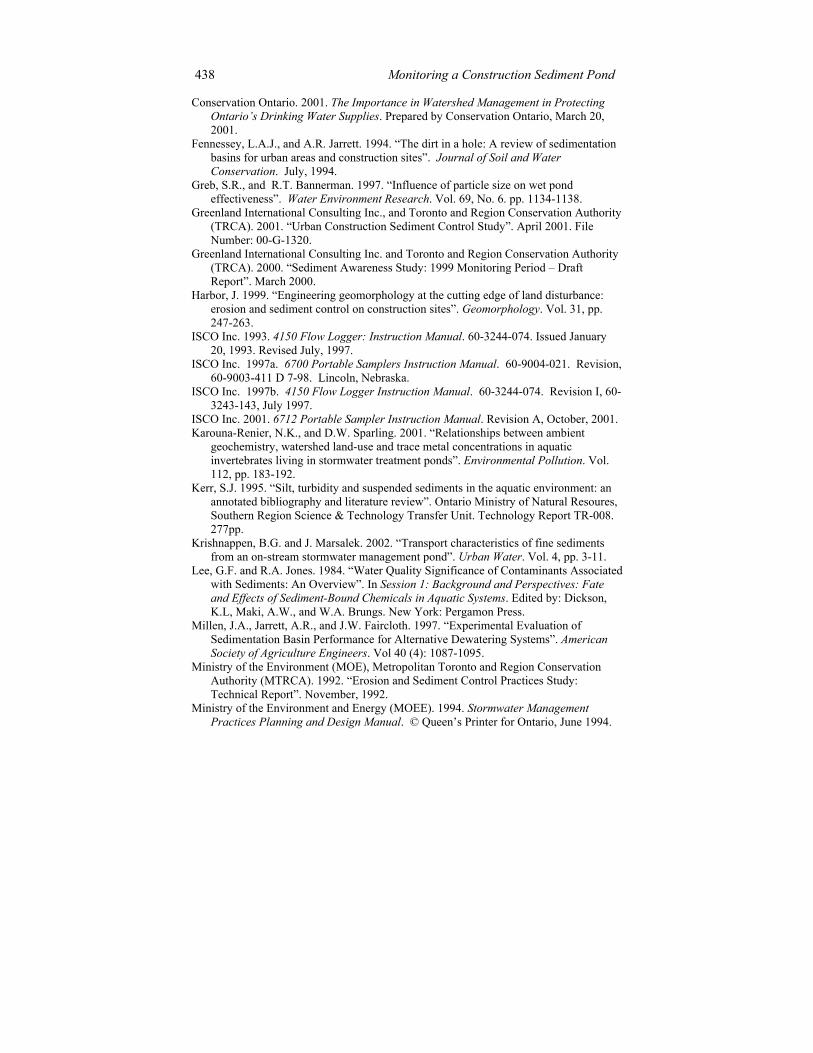
The removal efficiencies of pollutants at a pond should not be the only determining factor of the pond’s performance. The actual concentrations of the pollutants exiting the pond are considered to be the ultimate indication of the pond’s ability to protect downstream habitat. For example, the results of this study indicate that high removal efficiencies do not determine safe levels of pollutant concentrations. Figure 18.3 show a comparison of the outlet suspended solids concentrations and the European guidelines. Figure 18.4 shows that some outlet metal concentrations were above the recommended Provincial Water Quality Objectives (PWQO).
Monitoring a Construction Sediment Pond 435
Table 18.4 Average removal efficiencies of various parameters.
Parameters % reduction of influent concentration
Chemical Oxygen Demand 55.1 Suspended Solids 97.5 Dissolved Solids 5.3 Total Solids 91.3 Total Phosphorus 93.7 TKN 76.2Aluminum 1.7Barium 80.5Beryllium -17.5Calcium 80.4Cadmium -180.1Cobalt 37.4Chromium 5.7Copper 26.4Iron -6.2Magnesium 47.0Manganese 81.3Nickel 14.0Lead 31.0Strontium 57.4Titanium -143.8Vanadium -47.0Zinc 22.8
The permanent pool volume for the Richmond Hill pond was calculated using the SWMPP manual assuming a Level 1 fisheries habitat classification (Sabourin Kimble & Associates Ltd., 2000). This volume is expected to perform 80% TSS removal efficiency (MOE, 1994). Evidently, the total suspended solid removal efficiencies are higher than the requirement. However, some pollutants analyzed experienced lower than 50% removal efficiencies or even negative removal efficiencies.
436 Monitoring a Construction Sediment Pond
EMC Values vs Guidelines to Protect Aquatic Resources (European Inland Fisheries Advisory Commission 1964)
0
50
100
150
200
250
300
9/14/2002 9/20/2002 9/27/2002 10/2/2002 10/19/2002 10/25/2002 5/2/2003 5/5/2003 5/11/2003
Date of Event
EMC
(mg/
L)
EMC 25 mg/L 80 mg/L
Figure 18.3 Outlet suspended solids concentration compared to the European Inland Fisheries Advisory Commission's guidelines.
Inlet 1070 Metals Concentrations with Maximum and Minimum Values vs PWQO - Fall, 2002
0.01
0.1
1
10
100
1000
10000
Al (ug/L
)
Ba (ug
/L)
Be (ug
/L)
Cd (ug
/L)
Ca (mg/L
)
Cl (mg/L
)
Co (ug
/L)
Cu (ug
/L)
Fe (ug
/L)
Pb (ug
/L)
Mg (ug
/L)
Mn (ug
/L)
Mo (ug
/L)
Ni (ug/L
)
St (ug/L
)
Ti (ug/L
)
Va (ug
/L)
Zn (ug
/L)
Con
cent
ratio
ns
Mean Concentrations PWQO
Figure 18.4 Comparison of outlet metal concentrations and PWQO.

Monitoring a Construction Sediment Pond 437
18.6 Conclusions
Based on the study results, the following conclusion are drawn: 1. Stormwater management ponds in Toronto and surrounding regions
are commonly converted into sediment control ponds duringconstruction stage. However, there is not sufficient knowledge onthe sediment control performance.
2. This field study has demonstrated that the location of equipmentand sampling strategy are very important for stormwater fieldmonitoring programs.
3. The sediment control pond in Richmond Hill was found to achievehigh removal efficiency of suspended solids.
4. The particle sizes of sediment entering the pond were very fine,making them difficult to settle unless some flocculation occurred.
5. Both the removal efficiency and the effluent concentration shouldbe considered as performance measures for sediment control ponds.
Acknowledgment
This research study could not have been completed without the generous support of the following organizations:
• Government of Canada’s Great Lakes Sustainability Fund;• Ontario Ministry of the Environment;• Toronto and Region Conservation Authority;• The Town of Richmond Hill;• The Department of Fisheries and Oceans;• National Water Research Institute; and• Natural Science and Engineering Research Council.
References Bhaduri, B.L., Harbor, J.M., and P.A. Maurice. 1995. “Chemical Trap Efficiency of a
Construction Site Storm-Water Retention Basin”. Physical Geography. Vol. 16, No. 5, pp. 389-401.
Clarifica Inc. 2001. “Investigation to Develop an Improved Sizing Approach for Construction Sediment Control Facilities”. Prepared for: Department of Fisheries and Oceans Canada. March 2001.
438 Monitoring a Construction Sediment Pond
Conservation Ontario. 2001. The Importance in Watershed Management in Protecting Ontario’s Drinking Water Supplies. Prepared by Conservation Ontario, March 20, 2001.
Fennessey, L.A.J., and A.R. Jarrett. 1994. “The dirt in a hole: A review of sedimentation basins for urban areas and construction sites”. Journal of Soil and Water Conservation. July, 1994.
Greb, S.R., and R.T. Bannerman. 1997. “Influence of particle size on wet pond effectiveness”. Water Environment Research. Vol. 69, No. 6. pp. 1134-1138.
Greenland International Consulting Inc., and Toronto and Region Conservation Authority (TRCA). 2001. “Urban Construction Sediment Control Study”. April 2001. File Number: 00-G-1320.
Greenland International Consulting Inc. and Toronto and Region Conservation Authority (TRCA). 2000. “Sediment Awareness Study: 1999 Monitoring Period – Draft Report”. March 2000.
Harbor, J. 1999. “Engineering geomorphology at the cutting edge of land disturbance: erosion and sediment control on construction sites”. Geomorphology. Vol. 31, pp. 247-263.
ISCO Inc. 1993. 4150 Flow Logger: Instruction Manual. 60-3244-074. Issued January 20, 1993. Revised July, 1997.
ISCO Inc. 1997a. 6700 Portable Samplers Instruction Manual. 60-9004-021. Revision, 60-9003-411 D 7-98. Lincoln, Nebraska.
ISCO Inc. 1997b. 4150 Flow Logger Instruction Manual. 60-3244-074. Revision I, 60-3243-143, July 1997.
ISCO Inc. 2001. 6712 Portable Sampler Instruction Manual. Revision A, October, 2001. Karouna-Renier, N.K., and D.W. Sparling. 2001. “Relationships between ambient
geochemistry, watershed land-use and trace metal concentrations in aquatic invertebrates living in stormwater treatment ponds”. Environmental Pollution. Vol. 112, pp. 183-192.
Kerr, S.J. 1995. “Silt, turbidity and suspended sediments in the aquatic environment: an annotated bibliography and literature review”. Ontario Ministry of Natural Resoures, Southern Region Science & Technology Transfer Unit. Technology Report TR-008. 277pp.
Krishnappen, B.G. and J. Marsalek. 2002. “Transport characteristics of fine sediments from an on-stream stormwater management pond”. Urban Water. Vol. 4, pp. 3-11.
Lee, G.F. and R.A. Jones. 1984. “Water Quality Significance of Contaminants Associated with Sediments: An Overview”. In Session 1: Background and Perspectives: Fate and Effects of Sediment-Bound Chemicals in Aquatic Systems. Edited by: Dickson, K.L, Maki, A.W., and W.A. Brungs. New York: Pergamon Press.
Millen, J.A., Jarrett, A.R., and J.W. Faircloth. 1997. “Experimental Evaluation of Sedimentation Basin Performance for Alternative Dewatering Systems”. American Society of Agriculture Engineers. Vol 40 (4): 1087-1095.
Ministry of the Environment (MOE), Metropolitan Toronto and Region Conservation Authority (MTRCA). 1992. “Erosion and Sediment Control Practices Study: Technical Report”. November, 1992.
Ministry of the Environment and Energy (MOEE). 1994. Stormwater Management Practices Planning and Design Manual. © Queen’s Printer for Ontario, June 1994.
Monitoring a Construction Sediment Pond 439
Ministry of Municipal Affairs and Housing (MAH). 2002. ‘Our Vision’. Ontario Smartgrowth. Internet: http://www.smartgrowth.gov.on.ca
Nighman, D.M, and J.M. Harbor. 1995. “Trap Efficiency of a Stormwater Basin with and without Baffles”. Journal of Soil and Water Conservation (In Review).
Oscanyan, P.C. 1975. “Design of Sediment Basins for Construction Sites”. In National Symposium on Urban Hydrology and Sediment Control. University of Kentucky, Lexington, KY., July 28-31, 1975.
Papa, F., Adams, B.J., and Y.Guo. 1999. “Detention time selection for stormwater quality control ponds”. Canadian Journal of Civil Engineering. Vol. 26, pp. 72-82.
Pettersson, T.J. 1998. “Water Quality Improvement in a Small Stormwater Detention Pond”. Water Science and Technology. Vol. 38, No.10, pp.115-122.
Roesner, L.A. 1999. “Urban Runoff Pollution – Summary Thoughts – The State-of-Practice Today and for the 21st Century”. Water Science and Technology. Vol. 39, No. 12, pp. 353 – 360.
Schueler, T.R., and J. Lugbill. 1990. “Performance of Current Sediment Control Measures at Maryland Construction Sites – Final Report”. Prepared for: Sediment and Stormwater Administration, Maryland Department of the Environment. Prepared by: Metropolitan Washington Council of Governments, and the Occoquan Watershed Monitoring Laboratory.
Striegl, R.G. 1987. “Suspended Sediment and Metals Removal from Urban Runoff by a Small Lake”. Water Resources Bulletin: American Water Resources Association. Vol. 23, No. 6, pp. 985-996.
Waneilista, M.P., and Y.A. Yousef. 1993. Stormwater Management. New York: John Wiley & Sons Inc. © 1993
Whipple, W. 1979. “Dual Purpose Detention Basins”. Journal of the Water Resources Planning and Management Division. September, 1979. pp. 403-412.
Wu, J.S. 1989. Evaluation of Detention Basin Performance in the Piedmont Region of North Carolina. Department of Civil Engineering, University of North Caroling at Charlotte. July, 1989.
Zarull, M.A, Hartig, J.H., and L. Maynard. 1999. “Ecological Benefits of Contaminated Sediment Remediation in the Great Lakes Basin”. Prepared by: Great Lakes Sediment Priority Action Committee. August, 1999.

440 Monitoring a Construction Sediment Pond