monitoring the performance of centrifugal pump under
TRANSCRIPT

Journal of Applied Fluid Mechanics, Vol. 12, No. 2, pp. 445-459, 2019.
Available online at www.jafmonline.net, ISSN 1735-3572, EISSN 1735-3645.
DOI: 10.29252/jafm.12.02.29303
Monitoring the Performance of Centrifugal Pump under
Single-Phase and Cavitation Condition: A CFD Analysis
of the Number of Impeller Blades
A. Ramadhan Al-Obaidi
Department of Mechanical Engineering, Faculty of Engineering, Mustansiriyah University, Baghdad, Iraq
†Corresponding Author Email: [email protected]
(Received June 23, 2018; accepted September 2, 2018)
ĄBSTRACT
In this current study, the transient numerical calculations using CFD are carried out under different number of
impeller blades for the flow field within a centrifugal pump under single-phase and cavitation condition. Both
qualitative and quantitative analyses have been carried out on all of these results in order to better understand
the flow structure within a centrifugal pump under both single-phase and cavitation. Also, the investigation
using different number of impeller blades relating to the static pressure, velocity magnitude and vapour
volume fraction variations have been analysed. Fluctuations pressure in both time and frequency domains at
the impeller and volute of the pump also investigated. As a result, the pressure and velocity were gradually
increased from inlet to outlet of the pump. Pressure at the impeller outlet was higher than the pressure at other
parts due to high interaction between impeller and volute tongue region. The distribution of volume fraction
first occurs at the inlet eye of impeller. Furthermore, the cavitation increases as the number of impeller blades
and flow rate increase. The length of the cavity was increased when low pressure at the inlet impeller (eye)
decreased at Z=5 blades cavitation was affected highly at the suction of impeller compared to other number of
blades particularly at high flow rate.
Keywords: Centrifugal pump; Single-Phase; Cavitation; Number of impeller blades; Pressure variations;
Velocity variations.
NOMENCLATURE
BEP Best Efficiency Point
Di inlet impeller diameter
Do outlet impeller diameter
H head
NPSH Net Positive Section Head
N1 number of vapour bubbles
Q Flow rate
𝑅𝐵 bubbles radius
𝑅𝑐 mass transfer rate
𝜌 fluid density
𝜌𝑣 vapour fluid density
𝜌𝑣 liquid fluid density
1. INTRODUCTION
Centrifugal pumps are widely used in domestic and
industry applications the reasons behind that are their
high efficiency, a wide range of applications, ease of
maintenance and operation. The performance of the
pump is measured via different standard quantities
such as head, flow rate and pump rotational speed.
The flow rate and head parameter are the most
significant parameters in centrifugal pumps (Yunus
and Cimbala, 2006). The flow field within
centrifugal pump has been investigated by many
researchers using CFD for example, the work done
by Kim et al. (2012) where authors studied the effect
of outlet angle of blades on performance of the
centrifugal pump. The investigation was carried out
under using 60 m head, 600 rpm rotating speed. The
results indicated that the head increases as the outlet
angle of a blade increases. In addition, efficiency
decreased approximately by 0.3%. In a different
study, Sidhesware and Hebbal (2013) investigated a
hydraulic design of a metallic centrifugal pump
volute. The authors carried out the flow simulation of
a pump under different flow rates. Authors found
that the pump performance (head) decreases as the
flow rate increases. In addition, the pressure
distribution over the suction and pressure side of
blades were found to be non-uniform. Rajendran and
Purushothaman (2012)

A. Ramadhan Al-Obaidi / JAFM, Vol. 12, No. 2, pp. 445-459, 2019.
446
conducted a numerical investigation to analyses the
flow structure in the impeller of a centrifugal
pump. The pump has six blades, inlet and outlet
impeller diameters of 150 mm, 280 mm. The
results showed that the pressure difference from the
pressure side to the suction side of the impeller
blade increases from the leading edge to trailing
edge. The minimum static pressure inside the
impeller was located at the leading edge of the
blades on the suction side. Later, the effects of
centrifugal pumps’ geometrical parameters
investigated on pump performance was studied by
Patel et al. (2013). They investigated the effect of
impeller blades outlet angle on the performance of
pump under different specific speeds. Their study
has shown that the pump performance increased
with the increase in the outlet blade angle. In the
literature, many researchers have attempted to
investigate occurrence of cavitation in centrifugal
pumps using various approaches such as numerical
and experimental. One of these studies done by
Koné et al. (2011) where authors attempted to
detect the centrifugal pump cavitation
experimentally using visual observation through
the use of a high-speed camera. Through observing
visual indication of cavitation, they found that the
inception of cavitation appears before the
performance of the pump starts to decrease in terms
of head and efficiency. Furthermore, when the flow
rates and temperatures have increased the
cavitation is increased as well. Another
investigation carried out by Abbas (2010) who
investigated cavitation within the centrifugal pump
numerically. The results have shown that the
formation of bubbles occurs in a lower pressure
area due to the high velocity of the fluid. In
addition, the cavitation happens on the surface of
the blades at the leading edge. Li et al. (2017)
studied the effect of different blade widths at the
outlet, which are 11, 13 and 16mm on the pump
performance and in predicting cavitation in the
pump. Their results showed that as the outlet blade
width increases, the pump performance gradually
increases. Moreover, when the outlet blade width
increases, the low static pressure region at the
impeller eye also increases. Their result also shows
that when the outlet blade width increases,
cavitation also increases with the 11mm outlet
blade width showing the best performance with
little cavitation. Li et al. (2013) conducted another
study where a numerical investigation has been
carried out regarding the effect of impeller leading
edge on cavitation within the centrifugal pump. In
their study, they used the k-ω SST turbulence
model under transient conditions. The results have
shown that the pump performance drop was due to
the generation of the vortex flow in the rear area of
the cavity. The accuracy of the prediction for the
flow regimes has been estimated to be within 5%.
Chakraborty et al. (2011) numerically studied
effects of differences blade number on performance
of the pump. In this study, the pump has a design
speed of 4000 rpm with various of number of
blades. They used steady state simulation and
moving reference frame was applied. The results
have shown that the head and static pressure of the
pump increase with the of blade number increases.
Korkmaz, et. al. (2017) investigated the effects of
different blade number and on performance of the
deep well pump. In this work, different number of
blades were used (z=5, 6, and 7). As a result, the
highest performance and efficiency was at the Best
Efficiency Point (BEP) of all the impellers was at
z=6. Ismail et al. (2016) modelled the pump as
turbine under different number of impeller blade
using CFD. The investigation was done using
centrifugal pump with the impeller diameter of 214
mm the number of the blade was varied from 5 to 8
whereas other pump geometric parameters were
kept constant. The numerical results shown that the
best performance and efficiency was occurred at
seven blades at efficiency of 76.24%. Attempted
have been made by researchers to investigate the
effect of various parameters and operation
conditions on performance of the centrifugal pump.
After review of the literature, the following can be
noted; most of the above investigations which were
conducted at constant geometrical parameters of
pumps and under limited operation conditions.
Also, these studies are severely limited and lacked
the local flow field transient analysis under
different combinations of geometrical parameters
of the pump for different operating conditions (with
and without cavitation conditions). For instance,
the local and global interrelations among pressure,
velocity, vapour volume fraction distributions, and
pressure fluctuations in time and frequency
domains Moreover, there was a necessary for better
understanding of the flow structure within the
centrifugal pump as well as the effect of geometric
and operational conditions on detection and
diagnosis of cavitation within the pump.
2. EXPERIMENTAL SETUP FOR THE
CENTRIFUGAL PUMP
Figure 1 depicts the different parts for the flow loop
system of the centrifugal pump. The pump can
supply water to the tank with a maximum pressure
of about 10 bar. The selected flow loop system was
re-circulatory and included a plastic water tank,
PVC clear pipes and PVC connections components.
The inlet pipe diameter of the pump was 2 inches.
In addition, the outlet pipe diameter of the pump
used was 1.25 inches. The tank was made of plastic
with dimensions of 95×90×110cm. All pipes were
transparent pipes, the reason behind that is to permit
observation when the cavitation occurs.
2.1. Centrifugal Pump
Figure 2 depicts the centrifugal pump that was
applied in this experimental work. The made of the
applied pump is the F32/200AH series standardised
centrifugal pump from Pedrollo Company. This
type of pump consists of a single stage and closed
type impeller. It is powered by a 4 kW, 5.5 HP, 3-
phase driven motor. The current is 8.9 A and
voltage ranges between 380 to 400 V. Design
parameters for this pump are flow rate of up to 380
(l/min), head of about 46m at the designed flow
rate, five impeller blades and design rotational
speed of 2900 rpm.

A. Ramadhan Al-Obaidi / JAFM, Vol. 12, No. 2, pp. 445-459, 2019.
447
1-Water tank 6- Discharge valve
2-Suction valve 7- Water flow meter
3-Suction pressure transducer 8- Hopper
4-Centrifugal pump 9- Data acquisition system
5-Discharge pressure transducer 10- PC
Fig. 1. Components of Experimental setup for
flow loop system.
Fig. 2. Centrifugal pump type F32/200AH.
3. NUMERICAL SIMULATION USING
CFD TECHNIQUE
Currently, CFD analysis technique is being widely
used in turbomachines industry for analysing and
designing of artefacts such as turbines, compressors
and various kinds of pumps. In addition, using CFD
code to analyse the flow field within a centrifugal
pump enables designers to have quantitative and
qualitative information about likely operational
behaviour of such systems. The results from
numerical simulation can provide reasonably
accurate information regarding to the behaviour of
fluid flow in the pump. It can also be used to
determine pump performance as well as to predict
cavitation at the early stage. Using numerical and
experimental techniques can provide detailed and
effective results.
3.1. Brief Description of the Numerical
Simulation Methodology for the Centrifugal
Pump using CFD
The flow field within the centrifugal pump,
particularly in the blade passages and volute, has an
important effect on the performance of the pump.
However, carrying out experiments to measure this
flow field can be difficult Kim et al. (2012).
Therefore, CFD code can be used for this purpose
because it is a useful and powerful tool to study and
analyse the behaviour of the flow inside the pump
(Rajendran et al. 2012 and Wee 2011) In the
present study, numerical simulation methodology
was used for the centrifugal pump under single-
phase and cavitation conditions. This brief
methodology includes four main stages as
illustrated in Fig. 3. The first stage consists of
preparation of the geometry of pump parts. The
second stage includes creating the meshing for each
part. The third important stage in this methodology
is solver setup. This stage includes providing types
of domain properties, selecting the turbulence
model, boundary conditions, mesh interfaces
between different parts, convergence controls and
numerical schemes. The final stage is to select
effective parameters to monitor in the pump and
then run the simulation to calculate the results, as
well as collect the stored data during the post
processor stage for analysing. The results can be
validated with the experimental data.
Fig. 1. Numerical methodology for the
centrifugal pump using CFD code.
3.2. Pump Geometry
A numerical model of a pump in the present study
was simulated with five impeller blades; the impeller
was designed as a rotating part while the other parts
of the geometry such as volute, inlet and outlet pipes
were stationary as shown in Fig. 4. All specifications
of the centrifugal pump used in this investigation are
summarised in Table 1. To simulate and mimic the
3-D centrifugal pump model in a real-world scenario,
the numerical model was used same specifications,
dimensions, and geometrical parameters
corresponding to the experimental model
(F32/200AH from Pedrollo Company) in order to
conduct, compare, and validate the numerical results
with experimental results.

A. Ramadhan Al-Obaidi / JAFM, Vol. 12, No. 2, pp. 445-459, 2019.
448
Table 1 Specifications of the centrifugal pump
Parameter Value
Inlet diameter of the impeller (Di) 30mm
Outlet diameter of the impeller (Do) 215mm
Pump rotational speed (N) 2755 rpm
Number of blades (Z) 5
Thickness of blade 4mm
Impeller type Backward type
Length of the inlet pipe 1m
Length of the outlet pipe 1m
Inlet blade angle 17.09o
Outlet blade angle 17.28o
Fig. 4. Geometry of the centrifugal pump model.
3.3. Meshing of the Flow Domain
The flow domain needs to be spatially discretised
into a number of small parts, each one called a mesh
element, so that the fluid flow governing equations
can be solved on them. This study uses an
unstructured tetrahedral meshing within the flow
domain because of excessive mixing and irregular
geometric profile of the impeller and volute
geometry. Moreover, in order to accurately capture
the near-wall effects on the fluid flow, a dense mesh
is generated in the near-wall regions of the flow
domain. A mesh size of 1.6 mm was specified for
the impeller and the volute regions, while a mesh
size of 3.5 mm was used for the inlet and outlet
sections. Mesh independence tests were carried out
to find the optimal mesh sizing for accurate
prediction of fluid flow within the domain. The
mesh elements within the impeller and the volute
are shown in Fig. 5.
3.4. Solving Settings in CFD Code for
the Centrifugal Pump
Following sections provide the solver settings
details that were used in this study.
The Physical Models Selection
For the flow diagnostics, a pressure-based solver
was selected due to the fact that the density of
working fluid is water, remains constant. In
addition, to obtain more accurate results from the
numerical simulation a transient solver was chosen
for the flow diagnostics of the pump. In order to
provide accurate simulation results, it is essential to
choose the turbulence model suitable for the
simulation calculation as the flow fields within a
centrifugal pump under different operation
conditions are highly turbulent and unsteady. Due
to the complex separation and recirculation during
the transient flow process, a reliable turbulence
model selection is significant to simulate the
performances more accurately. Therefore, in this
study, the SST k-ω model was used in order to
provide accurate results inside the centrifugal pump.
The important reason behind selecting the SST k-ω
model is due to this model being capable of
capturing the extreme pressure gradients and the
wake regions. In addition, this model can detect the
variations in the flow parameters within a pump
with reasonable accuracy.
(a) (b)
Fig. 5. (a) Mesh of the centrifugal pump (b)
Mesh in the impeller.
Boundary Conditions under Single-Phase
Conditions
In this study, sliding mesh was used to simulate the
pump under single-phase conditions. The boundary
conditions for the single-phase flow simulation are
set at the inlet with different velocities. The inlet
velocity ranges from 0.85 to 3.1m/s, and outlet
boundary condition is set as the outflow (Hua 2013
and Park 2013). The experimental data for the
centrifugal pump was obtained in the lab, which
was analysed in order to develop a performance
prediction model for the pump.
3.5. Solver Setting for the Single-Phase
Conditions
The solver settings are necessary to precisely
predict the behaviour of liquid flow in the flow
domain. In the current study, for the single-phase
flow the SIMPLE (Semi-Implicit Method for
Pressure-Linked Equations) algorithm for pressure–
velocity coupling was used. Due to the use of such
algorithm provides faster converges as well as it
more accurate for flows within and around different
geometries (Fluent, 2009). SIMPLE algorithm
implements the velocity and pressure corrections to
attain the pressure field and the mass conservation.
The momentum equations are recorded based on the

A. Ramadhan Al-Obaidi / JAFM, Vol. 12, No. 2, pp. 445-459, 2019.
449
pressure gradient collected from the previous
iteration or an initial guess of pressure distribution
profile to achieve velocity profile. If the initial
pressure distribution does not satisfy the continuity
equation, pressure and velocities are corrected until
they satisfy the continuity equation (Fluent, 2009).
A Green–Gauss Node based approach was adopted
to compute the gradients. This approach solves a
constrained minimisation problem to restructure the
exact values of a linear function at a node from
surrounding cell–centred values on arbitrary
unstructured meshes while preserving a second-
order spatial accuracy.
3.6. Interaction Between the Impeller
and Volute
The flow field within a centrifugal pump is highly
complicated the relative rotation between volute
and impeller causes unstable flow and hence leads
to the generation of more pressure fluctuations
and increased level of noise and vibration. As a
result, that leads to a decrease in a pump life due
to fatigue which in-turn affects the pump
performance (Bois, 2006). However, the
knowledge regarding analysis of transient
pressure fluctuations in both time and frequency
domains due to interactions between the impeller
and volute under different operating conditions
and various geometrical parameters are still not
conclusive and need more investigation.
Therefore, to achieve this knowledge in this
study, numerical technique by CFD code was
used in order to study the effect of interactions.
In order to investigate the occurrence of cavitation
within the centrifugal pump, it is necessary to
calculate the performance under single-phase first
and then taking these results as the basis for the
initial conditions of cavitation calculation.
Therefore, a detailed discussion of suitable solver
settings and boundary conditions is presented in this
next section under cavitation conditions.
4. CAVITATION MODEL IN THE
CENTRIFUGAL PUMP
Information regarding cavitation model is provided
in this section as it was used in CFD code. Such
cavitation model is useful to simulate and mimic
cavitation influences in two-phase flows when a
mixture model is employed (ANSYS, 2013).
4.1. Cavitation Model
Characteristics of the two-phase cavitation model
are:
The cavitation model under investigation
includes merely two phases and these phases
are liquid-water and water-vapour.
The model takes into consideration bubble
formation (evaporation) and the collapse of
bubbles (condensation) (ANSYS, 2013).
Schnerr and Sauer Model
The Schnerr-Sauer model is used to predict
cavitation flow in many applications such as
propellers, hydrofoils, and pumps, and it can be
used in the centrifugal pump in order to detect
cavitation where the Schnerr-Sauer model is
defined as Liu et al. (2013):
𝑅𝑐 = 3𝜌𝑣𝜌𝑙∝𝑣
𝜌
(1−∝𝑣)
𝑅𝐵 √
2 𝑝𝑣−𝑃
3𝑝𝑙 𝑃 < 𝑃𝑣 (1)
𝑅𝑐 = 3𝜌𝑣𝜌𝑙∝𝑣
𝜌
(1−∝𝑣)
𝑅𝐵 √
2 𝑝𝑣−𝑃
3𝑝𝑙 𝑃 > 𝑃𝑣 (2)
Where, 𝑅𝑐 is the mass transfer rate, 𝜌, 𝜌𝑣 and 𝜌l are
denoted the fluid density, vapour and liquid fluid
density respectively. ∝v represents the vapour
volume fraction. 𝑝𝑣, 𝑝𝑙 are represented vapour and
liquid pressures. 𝑅𝐵 represents bubbles radius
which can be calculated by using the equation:
𝑅𝐵 = [3∝𝑣
4𝜋𝑁1(1−∝𝑣)]
13⁄ (3)
Where, N1 is the number of vapour bubbles per unit
volume of fluid.
4.2. Solver Settings and Boundary
Conditions for the Cavitation Model
In this study, the simulation was conducted using
the Coupled algorithm for the pressure-velocity
coupling and the following schemes are utilised:
The coupled solver is chosen in order to solve the
momentum equations that could lead to faster
convergence and a more robust calculation (Li and
Terwisga, 2011). The coupled solver is used to
simulate the cavitation flows especially in rotating
machineries such as pumps, turbines impellers and
inducers. In order to correct the pressure between
iterations, the PRESTO (PREssure STaggering
Option) scheme is utilized (Riglin, 2012). The
PRESTO can be used when the flows have highly
swirling, including steep pressure gradients and the
flow domains have curved boundaries such as
pumps, fans, and turbines (Settings, 2006). For
momentum, density, turbulent dissipation rate and
turbulent kinetic energy, second order upwind
schemes were used as the second order upwind
provides a more accurate calculation compared to
the first order upwind. In this study, the boundary
condition for cavitation condition were velocity at
the inlet and static pressure at the outlet Guo et al.
(2012).
5. Analysis of the Flow Field and
Performance of the Centrifugal
Pump using Transient Numerical
Approach
To analyse the effect of interaction between impeller
and volute, numerical simulations were conducted
that take into account various locations of the
impeller blades relative to the volute tongue region
using sliding mesh technique. Details regarding to all
numerical results for the centrifugal pump, model
reliability including mesh independence test, time
independence test, and validation will be represented
in the next sub sections.

A. Ramadhan Al-Obaidi / JAFM, Vol. 12, No. 2, pp. 445-459, 2019.
450
5.1. Mesh Independence Test
Testing the mesh independence is important
because meshing can lead to less or more accurate
outcomes. In this study, three meshes consisting of
1.25 million, 2.5 million, and 5 million mesh
elements were selected as displayed in Table 2. The
outcomes of these three cases showed that the
change in the head predicted within the centrifugal
pump is less than 3.14% amongst the three meshes
under consideration.
Table 2 Results of mesh independence of the
centrifugal pump
No. No. of elements Head
(m)
1 1.25 million 37.53
2 2.5 million 38.75
3 5 million 38.84
5.2. Time Steps Independence Test
Time step independence can lead to less or more
accurate outcomes of the Computational Fluid
Dynamics. This study includes the usage of three
different time steps. The outcomes of time steps are
summarised in the Table 3 shows that the variance
in the head within the centrifugal pump is less than
1.11% between the three-time steps under
consideration. Therefore, the time step with
3.0248*10-4sec was selected for further analysis.
Table 3 Results of Time step independence of the
pump
No. Time steps Head
(s) (m)
1 6.04960*10-5 38.01
2 1.81488*10-4 38.44
3 3.02480*10-4 38.75
5.3. Validation
The validation of the outcomes is considered as one
of the most significant steps when conducting
numerical studies. In other words, it means that the
results gained from the numerical simulations are
compared with experimental findings to verify
accurately that the numerical model symbolises the
physical model of the actual system. Thus, the
entire geometric, flow and solver-related parameters
and variables become vital in validation studies. In
the present study, the experimental data for the
centrifugal pump was provided by experimental
investigations to validate the model used in the
CFD. Figure 6 depicts the variation in (a) head, (b)
power and (c) efficiency for both numerical and
experimental results. It can be seen that there is a
good agreement between CFD and the experimental
results in this figure. From previous analysis, it can
be seen that both results match closely with each
other and this agreement confirms that the CFD
results are reasonable. It can be concluded from the
above findings that the numerical analysis is
reasonably well validated.
(a)
(b)
(c)
Fig. 6. Validation of the numerical and
experimental (a) head, (b) power and (c)
efficiency of the pump.
Figure 7 depicts the relationship between the
head of the pump and NPSH. The net positive
suction head represents the difference between
the liquid’s absolute pressure in the system and
the vapour pressure of the liquid at a given
temperature. It shows the head drop of the pump
under flow rate of 300 (l/min) corresponding to
points A, B, C, D, E, F and G. In this figure, the
curve of head-NPSH can be divided into three
parts. The first part shows when the NPSH is
equal to between 6.89m and 9m, an inception of
cavitation occurs in this region. The second part
displays the occurrence of the development of
cavitation when the NPSH is equal to 5.87m
corresponding to head drop of about 4.36%. The

A. Ramadhan Al-Obaidi / JAFM, Vol. 12, No. 2, pp. 445-459, 2019.
451
third and final part illustrates the full
development of cavitation when the NPSH is
equal to 3.83 m with a head drop of 10.84%.
Furthermore, when the NPSH decreases, the
cavitation on the suction side of the pump begins
to develop.
Fig. 7. NPSH for the cavitation characteristics
prediction curve of the pump.
To analyse the effect of the number of impeller
blades on the performance of the pump under
single-phase and cavitation conditions, three
different number of impeller blades 3, 4, and 5 have
been selected for the analysis purpose. The next
section represents the results obtained from the
calculation of the different number of impeller
blades. In this study, two types of numerical
simulation were carried out to investigate the
characteristics of the pump performance and
visualise the flow field within a centrifugal pump.
The first category was a numerical simulation under
single-phase operating conditions. The second was
to simulate cavitation under different operating
conditions.
5.4. Analyses of Inner Flow in Single-
Phase Condition (Pressure and Velocity
Variations)
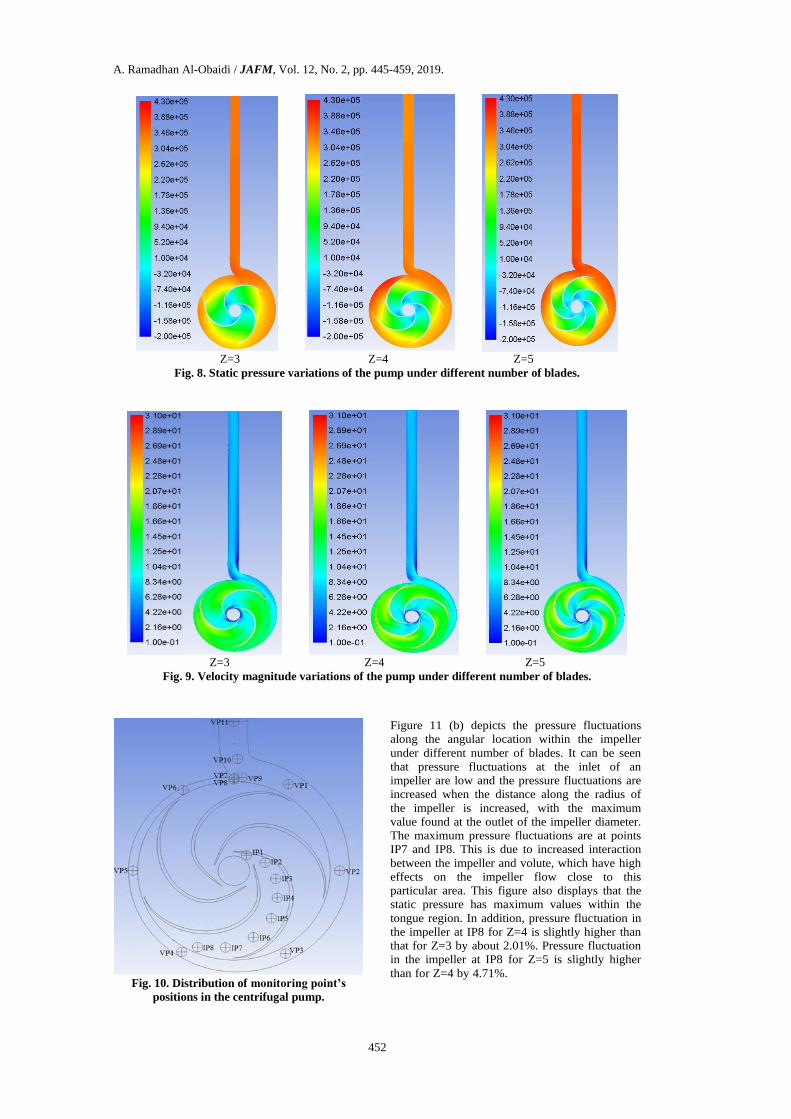
Figure 8 depicts the static pressure variations
within the centrifugal pump corresponding to
operating conditions were flow rate of 300
(l/min), inlet and outlet impeller diameters of 35
mm and 220 mm and N=2755 rpm and Z=3, 4,
and 5 blades. It can be noticed that the pressure is
increased gradually from the inlet to the outlet of
the impeller. Under these operating conditions,
the static pressure of the blade’s pressure surface
is higher than the suction surface. The lower
pressure inside the impeller is positioned at the
suction surface of the blade. The high-pressure
region for Z=4 is higher than for Z=3 by 6.7%,
and for Z=5 is higher than Z=4 by about 3.57%.
Based on the above analysis, it can be seen that
when the number of impeller blades increase the
static pressure also increases.
On further analysing for the flow structure within
the centrifugal pump, Fig. 9 depicts the velocity
magnitude variations at the middle section of the
pump. It can be seen that the velocity increases
from inlet to exit of the impeller at the design
flow rate through the passages between the
blades. In addition, it can be seen that the high-
velocity region for Z=4 is higher than for Z=3 by
4.65%. Furthermore, velocity for Z=5 is slightly
higher for Z=4 by 2.27%.
Many monitoring points are set in the volute and
impeller in order to analyse the pressure fluctuation
in the pump under different number of blades as
shown in the following section.
5.5. Analyses of Pressure Fluctuations
Characteristics in the Centrifugal Pump
The internal flow field in pumps are complex and
there are several reasons behind their complexity.
Firstly, it is due to the high interaction between
fluid and impeller blades as well as the
interaction between the rotor part (impeller) and
stationary part (volute) especially at volute
tongue region. Secondly, it is due to the effect of
turbulence and the complex unsteady effects
within the pump. Thirdly, the most important
reason is the occurrence of cavitation. For
Further, investigations for pressure fluctuations
analyses in the impeller and volute at different
monitoring points will be discussed in the next
section.
5.6. Monitoring Points on the Impeller
and Volute
Many monitoring points are set in the impeller
and volute of the pump to investigate and
develop comprehensive understanding of the
pressure fluctuations within the centrifugal pump
under various number of blades and different
operational conditions. For this purpose, there are
15 points that were marked in the volute,
including 6 points inside the volute, which are set
at every 60o, 3 points are set close to the tongue
region and in addition, 6 points are set at the
outlet of the volute, a further 8 points are set in
the impeller. The monitoring points for volute are
referred to as VP1 to VP12 and for impeller are
called IP1 to IP8. Figure 10Fig. 1 depicts the
distribution of the monitoring points within a
centrifugal pump.
6.7. Time Domain Analysis (TDA) in the
Pump
Figure 11 (a) depicts the pressure fluctuations for
12 monitoring points on the volute with a flow
rate of 300 (l/min), do=220 mm, di=35 mm,
N=2755 rpm and Z=3, 4, and 5 blades. It is
obvious that the pressure fluctuations at the
monitoring points are increased near or close to
the tongue region then decreased when they are
located far from the tongue area. In addition, the
highest-pressure fluctuations are at the area near
the tongue and in the outlet pipe of the volute
regions. The higher-pressure fluctuation in the
volute at for Z=4 is higher than that for Z=3 by
about 6.34%. Furthermore, the pressure
fluctuation in the volute at for Z=5 is slightly
higher than for Z=4 by 2.67%.
A. Ramadhan Al-Obaidi / JAFM, Vol. 12, No. 2, pp. 445-459, 2019.
452
Z=3 Z=4 Z=5
Fig. 8. Static pressure variations of the pump under different number of blades.
Z=3 Z=4 Z=5
Fig. 9. Velocity magnitude variations of the pump under different number of blades.
Fig. 10. Distribution of monitoring point’s
positions in the centrifugal pump.
Figure 11 (b) depicts the pressure fluctuations
along the angular location within the impeller
under different number of blades. It can be seen
that pressure fluctuations at the inlet of an
impeller are low and the pressure fluctuations are
increased when the distance along the radius of
the impeller is increased, with the maximum
value found at the outlet of the impeller diameter.
The maximum pressure fluctuations are at points
IP7 and IP8. This is due to increased interaction
between the impeller and volute, which have high
effects on the impeller flow close to this
particular area. This figure also displays that the
static pressure has maximum values within the
tongue region. In addition, pressure fluctuation in
the impeller at IP8 for Z=4 is slightly higher than
that for Z=3 by about 2.01%. Pressure fluctuation
in the impeller at IP8 for Z=5 is slightly higher
than for Z=4 by 4.71%.

A. Ramadhan Al-Obaidi / JAFM, Vol. 12, No. 2, pp. 445-459, 2019.
453
(a)Z=3 (a)Z=4
(a) Z=5 (b)Z=3
(b) Z=4 (b) Z=5
Fig. 11. (a) Pressure fluctuations around the volute and (b) at the impeller of the pump under different
number of blades.
5.7. Frequency Domain Analysis (FDA)
in the Pump
Figure 12 (a) depicts the amplitudes of pressure
fluctuations against frequencies for the 12
monitoring points around the volute for these cases
under consideration. It can be seen that in the volute
the maximum pressure fluctuation amplitude for all
monitoring points is at a Blade Passing Frequency
(BPF). However, the maximum pressure fluctuation
amplitudes were at monitoring points are VP6 and
VP9. The reason behind that is due to the location
of these points being near the tongue region. In
addition, at point PV4, the pressure fluctuation
amplitude reaches the lowest point due to its
location, far away from the volute tongue area. It
can be observed that the maximum pressure
fluctuation amplitude in the volute at points VP6 for
Z=4 was lower than for Z=3 by 45.25%, and for
Z=5 is lower than for Z=4 by 15.58%. This
happened due to the distance between blade to
blade for Z=3 was higher than Z=4. Hence, that
leads to the value of peak-to-peak of pressure
fluctuations for Z=3 being higher than Z=4 by
22.86%, and for Z=4 being higher than Z=5 by
23.15%.
Figure 12 (b) depicts obvious variations in the
amplitudes of pressure fluctuations with frequencies
for eight monitoring points at the impeller under
different number of blades. The first maximum
amplitude of pressure fluctuations for entire points

A. Ramadhan Al-Obaidi / JAFM, Vol. 12, No. 2, pp. 445-459, 2019.
454
(a)Z=3 (a)Z=4
(a) Z=5 (a) Z=3
(b) Z=4 (b) Z=5
Fig. 12. (a) Frequency spectra around the volute and (b) in the impeller under different number of
blades.
Table 4 Maximum amplitude of static pressure fluctuations under different number of blades
Z=3
Frequency Maximum amplitude of pressure fluctuations for 8 monitoring points at the impeller (kPa)
Hz IP1 IP2 IP3 IP4 IP5 IP6 IP7 IP8
45.92 3.80 8.33 8.33 13.84 18.19 25.00 33.81 42.19
Z=4
Hz IP1 IP2 IP3 IP4 IP5 IP6 IP7 IP8
45.92 2.87 11.42 13.10 14.71 17.07 21.05 26.70 32.83
Z=5
Hz IP1 IP2 IP3 IP4 IP5 IP6 IP7 IP8
47.23 2.28 11.53 12.67 13.28 14.55 19.60 19.60 28.96
is at rotational frequency (Rf). Table 4 summaries
the amplitudes of pressure fluctuation at (Rf) in the
impeller. It can be clearly seen that the amplitudes
of pressure fluctuations increase as the distance
along the radius of the impeller is increased. The
pressure fluctuation amplitudes in the impeller are

A. Ramadhan Al-Obaidi / JAFM, Vol. 12, No. 2, pp. 445-459, 2019.
455
Z=3 Z=4 Z=5
Fig. 13. Volume fraction distributions for the pump under different number of blades.
lower than in the volute. Additionally, it can be
observed that the maximum amplitude pressure
fluctuation on the impeller at point IP8 for Z=4 is
lower than that for Z=3 by around 22.20%, and the
maximum pressure fluctuation amplitude at the
impeller for Z=4 is higher than for Z=5 by
11.798%. This is because of the (max. pressure –
min. pressure) value for the peak-to-peak for Z=3 is
also higher than that for Z=4 and Z=5. Based on the
findings in this work, different investigations on the
global and local flow fields for static pressure and
fluctuations pressure in time and frequency domains
were carried out. Also, comparative investigations
to estimate the effects of various number of blades
under single-phase and cavitation at transient flow
conditions were carried out in order to better
understanding the effect of number of blades on all
of these parameters.
5.8. Analyses of Cavitation
Characteristics in the Impeller
Figure 13 depicts the transient simulation of
cavitation in the centrifugal pump having a flow
rate of 300 (l/min), do=220 mm, di=35 mm,
N=2755 rpm, and Z=3, 4, and 5 blades. It can be
seen that there is no cavitation in case Z=3, and the
vapour volume fractions zone within the impeller of
the pump for Z=4, and 5 models are slightly higher
than that of Z=3, due to these cases operate under
design flow rate of 300 (l/min).
For comparison purposes between the above
models, Figs. 14 (a) and (b) depict the instantaneous
head of the aforementioned cases under single-
phase and cavitation conditions. It can be clearly
seen that for the model that has Z=5, the average
head under single-phase and cavitation conditions
are considerably higher than for the other two
models Z=4 and Z=3 by 11.09% and 2.64%, and
under cavitation condition by 11.04% and 3.16%
respectively. In comparison, between the models
when Z=4 and Z=5, the maximum instantaneous
head for Z=5 is seen to be higher than that of Z=4.
The results showed that as the number of impeller
blades increases, the head of the centrifugal pump
increases. Table 5 summarises the boundary
conditions and NPSH values for different cavitation
cases under various number of blades and flow
rates.
Table 5 Boundary conditions and NPSH values
for different cavitation cases
Cases Boundary conditions
Q Z Inlet Outlet NPSH
(l/min) (-) Velocity
(m/s)
Pressure
(kPa)
(m)
300 3 2.546 314.276 4.82
330 3 2.801 308.824 4.32
350 3 2.970 270.417 4.18
300 4 2.546 327.965 5.24
330 4 2.801 311.309 4.87
350 4 2.970 284.313 4.32
300 5 2.546 352.555 5.72
330 5 2.801 333.012 5.52
350 5 2.970 304.796 4.87
(a)
(b)
Fig. 14. Instantaneous head variations of
centrifugal pump models having different
number of blades (Z) under (a) single-phase and
(b) cavitation conditions.

A. Ramadhan Al-Obaidi / JAFM, Vol. 12, No. 2, pp. 445-459, 2019.
456
From Figure 15 it can be seen that when the flow
rate, pump rotational speed, inlet and outlet impeller
diameters are kept constant and number of impeller
blades (Z) is increased, the average head of the
pump increases under both single-phase and
cavitation conditions. Also, there is a slight
difference between the head for both single-phase
and cavitation under different number of impeller
blades. The head for the single-phase is slightly
higher than the head for the cavitation condition by
1.02, 1.54, and 1.01% for when Z=3, 4, and 5
respectively. All of these cases under investigation
were conducted under design flow rate of
300(l/min) and the level and severity of cavitation
was found to be relatively small under this flow
rate. In addition, the results showed that as the
number of blades increases, the head of the pump
increases. The maximum performance of the
centrifugal pump corresponds with the optimum
value of the number of blades (Z), which in the
current study is five blades.
Further quantifying the performance of the pump,
Table 6 provides the statistical analysis results of
the instantaneous head such as the maximum,
minimum, average, and (max–min) amplitude under
single-phase and cavitation condition at different
number of blades.
Table 6 Statistical analysis results of the
instantaneous head under single-phase and
cavitation conditions at different number of
blades
Single-phase
Head Z=3 Z=4 Z=5
(m)
Average 34.31 37.57 38.59
Minimum 29.72 34.19 36.41
Maximum 37.44 39.94 40.21
Max - Min 7.72 5.75 3.79
Cavitation condition
Head Z=3 Z=4 Z=5
(m)
Average 33.96 36.99 38.20
Minimum 30.38 34.52 36.39
Maximum 36.69 38.91 39.71
Max - Min 6.309 4.392 3.315
Fig. 15. Effect of number of impeller blades on
performance of the centrifugal pump under
single-phase and cavitation conditions.
Under different number of impeller blades, the low-
pressure region occurs at the inlet eye of the
impeller, particularly at the suction side of blades
near the leading edges. Also, when the blade
number increases, it leads to the region of low-
pressure area increases, causing cavitation to
increase due to the decrease in the low-pressure
region at this particular area. Therefore, the number
of impeller blade has a high influence on the pump
characteristics and cavitation within the centrifugal
pump.
5.9. Detection of Cavitation under
Different Number of Impeller Blades and
Flow Rates
Figure 16 depicts the vapour volume fraction
variations under various flow rates namely 300,
330, and 350 (l/min). The number of impeller
blades that have been used are 3, 4, and 5, inlet
and outlet impeller diameters used are di=35 mm,
do=220 mm, and N=2775 rpm was the speed of
operation. The numerical results found that the
occurrence of cavitation changes with the number
of impeller blades and flow rates. It can be seen
that at 300 (l/min) flow rate, there was no
occurrence of cavitation at Z=3, but small
cavitation occurs when the number of impeller
blades goes up to Z=5. In addition, cavitation
initiates from the leading edge of the impeller and
the magnitude of the cavitation increases as the
number of impeller blades and flow rate increase.
In addition, the length of the cavity is increased
when low pressure at the inlet impeller (eye)
decreases. The possible reason behind that is due
to an increase in the number of impeller blades
and flow rate, leading to pressure at the eye of
impeller continually decreases. In addition, at Z=5
blades, cavitation was affected highly at the
suction of the impeller compared to the number of
blades at 4 and 3, especially at high flow rate.
Furthermore, based on the above analysis, the
numerical results showed that the number of
blades and flow rates have a high effect on
cavitation within a pump, particularly at the eye
of impeller region.
The numerical results showed that as the number of
impeller blade increases, static pressure also
increases, hence, the pump head increases. As well,
under different number of impeller blades, the low-
pressure region occurs at the inlet eye of the
impeller, particularly at the suction side of blades
near the leading edges. In addition, when the blade
number increases, it leads to the region of low-
pressure area increasing, causing cavitation to
increase due to the decrease in the low-pressure
region at this particular area. Therefore, the number
of impeller blade has a high influence on the pump
characteristics and cavitation in the pump.
6. CONCLUSION
Detailed flow diagnostics within the centrifugal
under single-phase and cavitation conditions and
effect of different impeller number of impeller
blades showed the following results:

A. Ramadhan Al-Obaidi / JAFM, Vol. 12, No. 2, pp. 445-459, 2019.
457
Q=300(l/min) Q=330(l/min) Q=350(l/min)
Z=3
Q=300(l/min) Q=330(l/min) Q=350(l/min)
Z=4
Q=300(l/min) Q=330(l/min) Q=350(l/min)
Z=5
Fig. 16. Volume fraction distributions for the centrifugal pump under different number of impeller
blades and flow rates.
1- The pressure gradually increases from inlet to
outlet impeller of the pump. Pressure at the
impeller outlet is higher than the pressure at
other parts of the impeller when the impeller
rotates close to the tongue region of the volute.
2- The velocity gradually increases from the inlet
to outlet impeller of the pump also. The high
velocity occurs at the outlet of the impeller
close to the tongue region.
3- The interaction between impeller and volute
tongue region is actually according to the
relative position of the impeller blades with
respect to tongue region.
4- There are two dominant frequencies, the
rotational frequency (Rf), and Blade Passing
Frequency (BPF) and their related harmonics.
5- The numerical results showed that the
distribution of volume fraction within a pump
first occurs at the inlet eye of the impeller close
to the leading blade.
6- The results show that as the number of impeller
blades increases, the occurrence of cavitation
increases.
7- CFD can be a useful tool to predict and
analyse the outcome characteristics and
performance of the centrifugal pump with
reasonable accuracy under single-phase and
cavitation conditions.

A. Ramadhan Al-Obaidi / JAFM, Vol. 12, No. 2, pp. 445-459, 2019.
458
8- The detailed investigations of cavitation
characteristics were presented in this study in
order to provide useful information and
guidance regarding the inception and
development of cavitation within the centrifugal
pump under different number of blades and
operation conditions.
ACKNOWLEDGEMENTS
The author would like to thank Mustansiriyah
University (HYPERLINK "http://www.
uomustansiriyah.edu.iq" www.uomustansiriyah.
edu.iq) Baghdad – Iraq for its support in the present
work. The author also would like to gratefully
acknowledge the University of Huddersfield (UK)
due to the pump geometry and numerical data were
carried out when the author was studied his PhD
degree in this University.
REFERENCES
Abbas, M. K. (2010). Cavitation in centrifugal
pumps. Diyala Journal of Engineering
Sciences, 170-180.
ANSYS (2013). ANSYS Fluent Theory Guide
Release 15.0. Published in the U.S.A.
Bois, G. (2006). Introduction to design and analysis
of high speed pumps. Ecole Nationale
Superieure D'arts Et Metiers Lille, France.
Chakraborty, S. and K. M. Pandey (2011).
Numerical Studies on Effects of Blade
Number Variationson Performance of
Centrifugal Pumps at 4000 RPM.
International Journal of Engineering and
Technology 3(4), 410.
Cui, B., C. Wang, Z. Zhu and Y. Jin (2013).
Influence of blade outlet angle on
performance of low-specific-speed centrifugal
pump. Journal of Thermal Science 22(2),
117-122..
Cui, B., D. Chen, C. Wang, Z. Zhu, Y. Jin and Y.
Jin (2013). Research on performance of
centrifugal pump with different-type open
impeller. Journal of Thermal Science 22(6),
586-591.
Fluent, A. (2009). 12.0 Theory Guide. Ansys Inc,
5(5). Certified to ISO 9001:2008.
Guo, X., Z. Zhu, B. Cui and Y. Li (2012). Analysis
of Cavitation Performance of Inducers in
Centrifugal pumps. INTECH.
Hua, T., L. Yi and Z. Yu-Liang (2013). Numerical
analysis of a prototype centrifugal pump
delivering solid-liquid two-phase flow.
Journal of Applied Sciences 13, 3416-3420.
Ismail, M. A. I., A. K. Othman, H. Zen and M. S.
Misran (2016). CFD Modelling of pump as
turbine with various number of blade for
microhydro system. Journal of Applied
Science & Process Engineering 3(1).
Kim, J. H., K. T. Oh, K. B. Pyun, C. K. Kim, Y. S.
Choi and J. Y. Yoon (2012). Design
optimization of a centrifugal pump impeller
and volute using computational fluid
dynamics. IOP Conference Series: Earth and
Environmental Science (Vol. 15, No. 3,
032025). IOP Publishing.
Koné, W. M., B. Dro, K. Yao and K. Kamanzi
(2011). Detection of Cavitation in Centrifugal
Pumps. Australian Journal of Basic and
Applied Sciences 5(11), 1260-1267.
Korkmaz, E., M. Gölcü and C. Kurbanoğlu (2017).
Effects of blade discharge angle, blade
number and splitter blade length on deep well
pump performance. Journal of Applied Fluid
Mechanics 10(2), 529-540.
Li, W., X. Zhao, W. Li, W. Shi, L. Ji and L. Zhou
(2017). Numerical Prediction and
Performance Experiment in an Engine
Cooling Water Pump with Different Blade
Outlet Widths. Mathematical Problems in
Engineering.
Li, X., S. Yuan, Z. Pan, J. Yuan and Y. Fu (2013).
Numerical simulation of leading edge
cavitation within the whole flow passage of a
centrifugal pump. Science China
Technological Sciences 56(9), 2156-2162.
Li, Z. and T. Terwisga (2011). On the capability of
multiphase RANS codes to predict cavitation
erosion. In Second International Symposium
on Marine Propulsors.
Liu, H. L., D. X. Liu, Y. Wang, X. F. Wu and J.
Wang (2013). Application of modified κ-ω
model to predicting cavitating flow in
centrifugal pump. Water Science and
Engineering 6(3), 331-339.
Park, K. (2013). Optimal design of a micro vertical
axis wind turbine for sustainable urban
environment. Doctoral dissertation, University
of Huddersfield, UK.
Patel, M. G. and A. V. Doshi (2013). Effect of
impeller blade exit angle on the performance
of centrifugal pump. Int J. Emerging
Technology and Advanced Engineering 3(1),
91-99.
Rajendran, S. and D. K. Purushothaman (2012).
Analysis of a centrifugal pump impeller using
ANSYS-CFX. International Journal of
Engineering Research & Technology 1(3).
Riglin, J. D. (2012). Cavitation Study of a
Microhydro Turbine. Theses and
Dissertations. Paper 1134. Lehigh University,
USA.
Settings, S. (2006). Introductory FLUENT training
v 6.3 Fluent User Services Center, ANSYS.
Inc. Proprietary. Fluent User Services Center.
Sidhesware, R. and O. D. Hebbal (2013). Validation
Of Hydraulic Design Of A Metallic Volute
Centrifugal Pump. International Journal of
Engineering Research & Technology 2.

A. Ramadhan Al-Obaidi / JAFM, Vol. 12, No. 2, pp. 445-459, 2019.
459
Wee, C. K. (2011). Unsteady Flow in Centrifugal
Pump at Design and Off-Design Conditions
(Doctoral dissertation). National University of
Singapore, Singapore.
Yunus, A. C., and J. M. Cimbala (2006). Fluid
mechanics fundamentals and applications.
International Edition, McGraw Hill
Publication, 185201. 1221 Avenue of the
Americas, New York, NY 10020, USA.