monitoring the presence of herbicides and metabolites … talk 1 luigi... · monitoring the...
TRANSCRIPT
Monitoring the presence of herbicides and metabolites used in maize farming in spring water using LC-QQQ/LC-QTOF
Luigi Lucini Università Cattolica del Sacro Cuore Institute of Environmental and Agricultural Chemistry Piacenza, ITALY
Environmental / Food MS Meeting - Bristol, UK, 21-23 September 2011
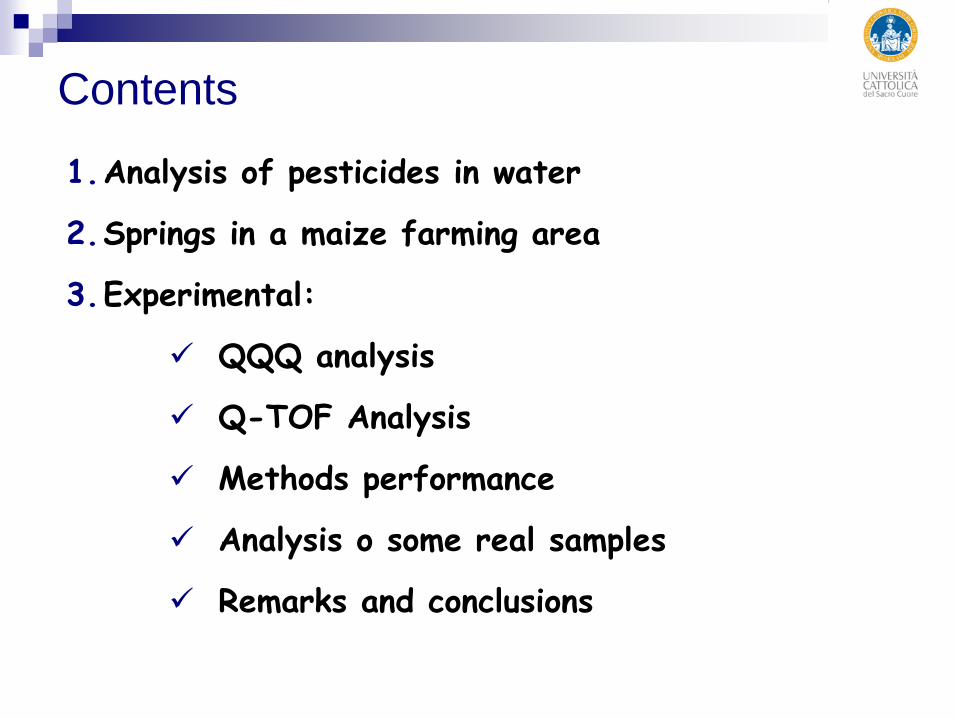
Contents
1.Analysis of pesticides in water
2.Springs in a maize farming area
3.Experimental:
QQQ analysis
Q-TOF Analysis
Methods performance
Analysis o some real samples
Remarks and conclusions
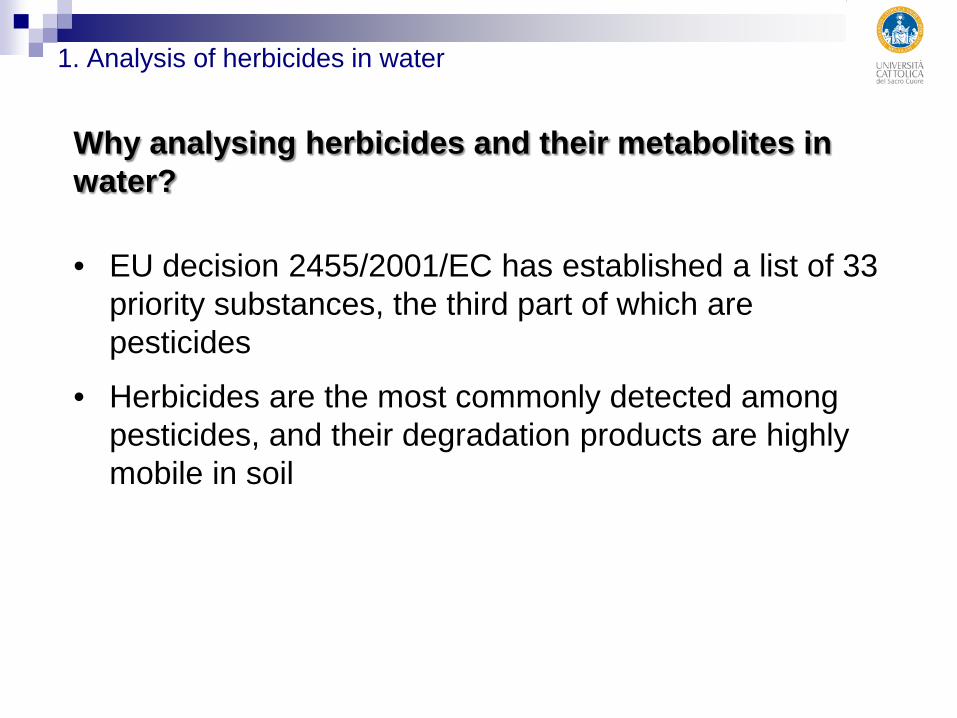
1. Analysis of herbicides in water
Why analysing herbicides and their metabolites in water?
• EU decision 2455/2001/EC has established a list of 33 priority substances, the third part of which are pesticides
• Herbicides are the most commonly detected among pesticides, and their degradation products are highly mobile in soil
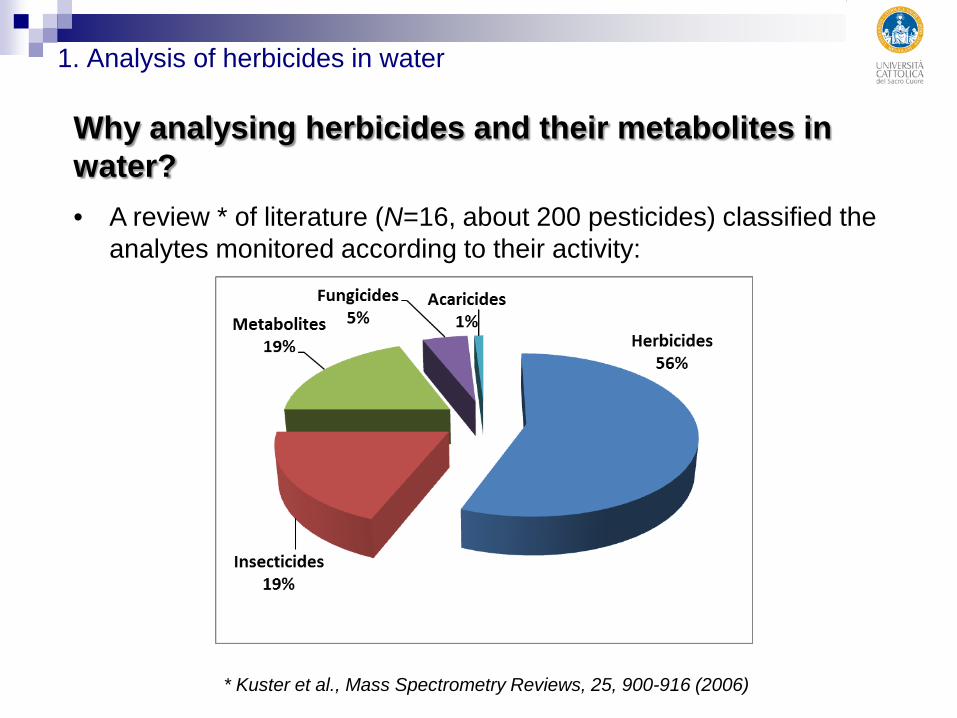
1. Analysis of herbicides in water
Why analysing herbicides and their metabolites in water? • A review * of literature (N=16, about 200 pesticides) classified the
analytes monitored according to their activity:
* Kuster et al., Mass Spectrometry Reviews, 25, 900-916 (2006)
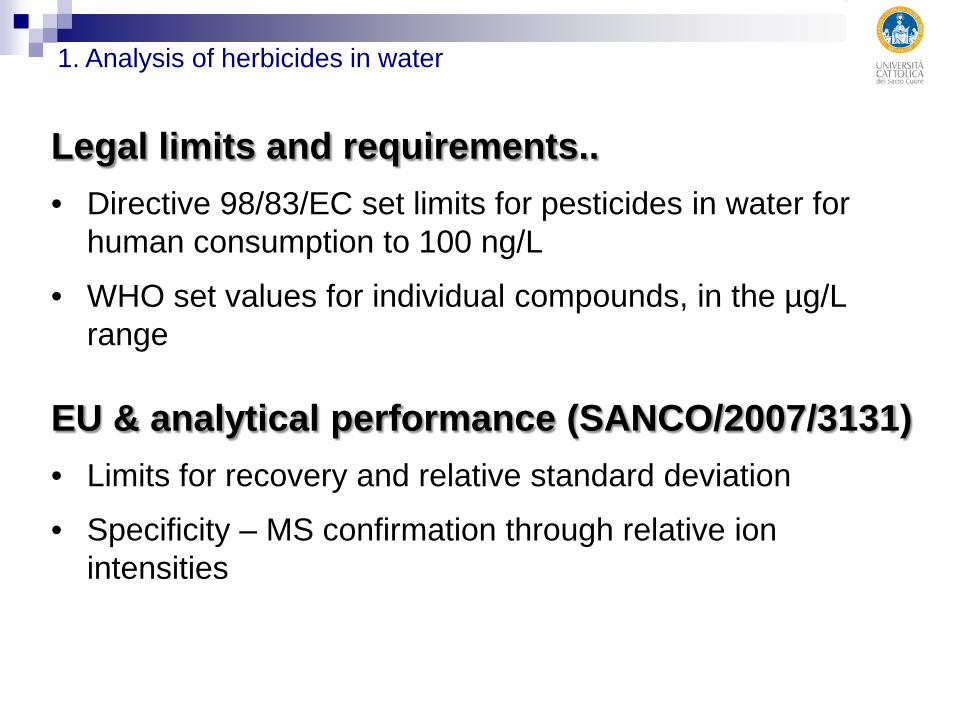
Legal limits and requirements.. • Directive 98/83/EC set limits for pesticides in water for
human consumption to 100 ng/L
• WHO set values for individual compounds, in the µg/L range
1. Analysis of herbicides in water
EU & analytical performance (SANCO/2007/3131) • Limits for recovery and relative standard deviation
• Specificity – MS confirmation through relative ion intensities
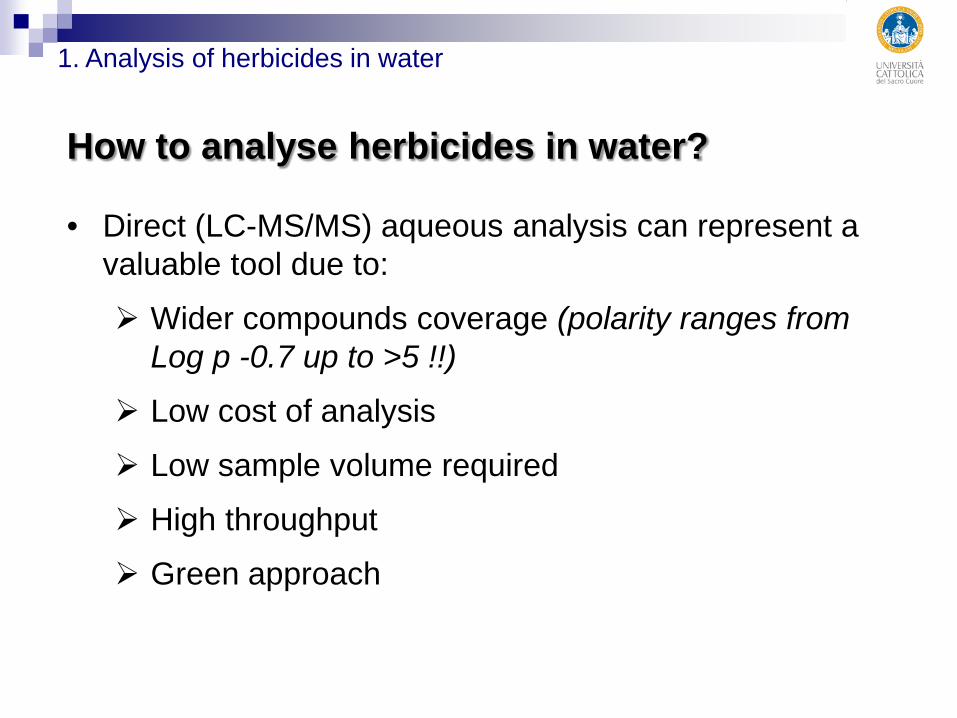
How to analyse herbicides in water?
• Direct (LC-MS/MS) aqueous analysis can represent a valuable tool due to:
Wider compounds coverage (polarity ranges from Log p -0.7 up to >5 !!)
Low cost of analysis
Low sample volume required
High throughput
Green approach
1. Analysis of herbicides in water
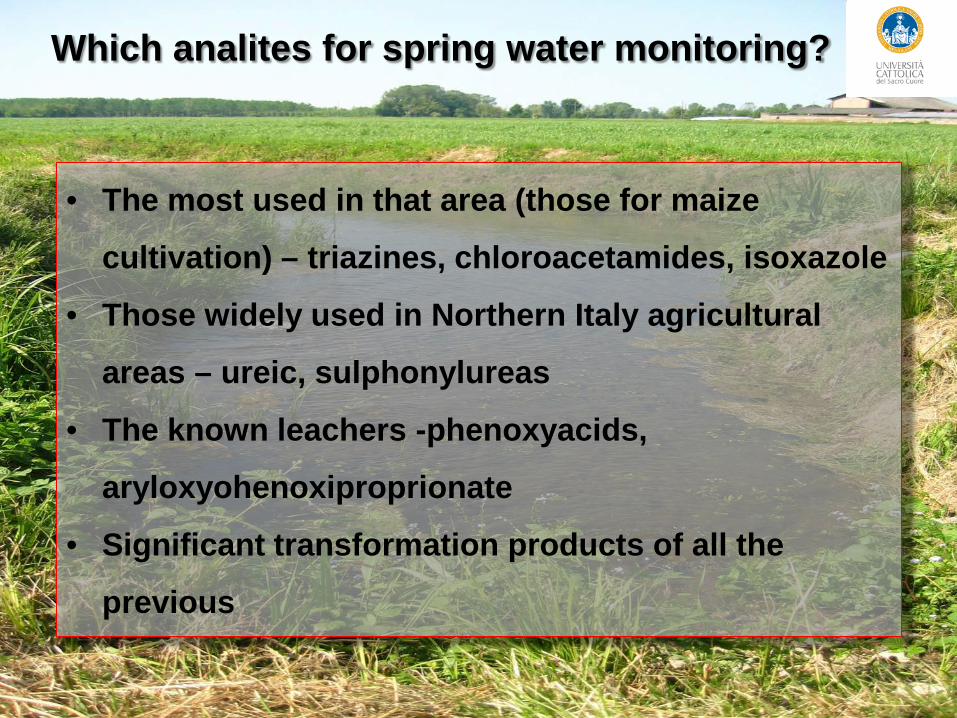
Which analites for spring water monitoring?
• The most used in that area (those for maize
cultivation) – triazines, chloroacetamides, isoxazole
• Those widely used in Northern Italy agricultural
areas – ureic, sulphonylureas
• The known leachers -phenoxyacids,
aryloxyohenoxiproprionate
• Significant transformation products of all the
previous
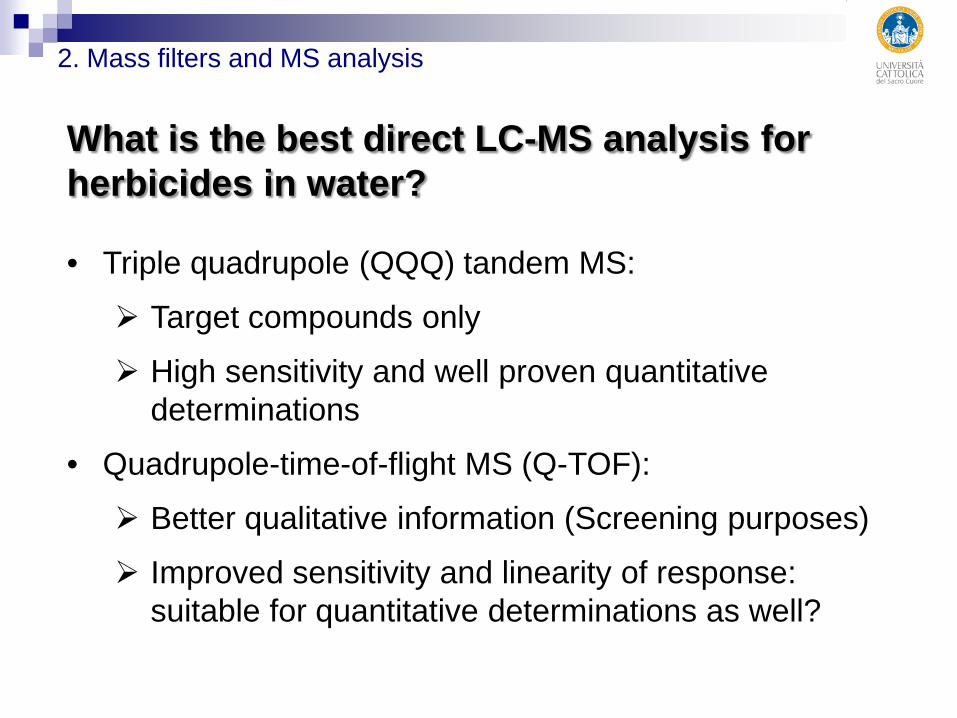
What is the best direct LC-MS analysis for herbicides in water?
• Triple quadrupole (QQQ) tandem MS:
Target compounds only
High sensitivity and well proven quantitative determinations
• Quadrupole-time-of-flight MS (Q-TOF):
Better qualitative information (Screening purposes)
Improved sensitivity and linearity of response: suitable for quantitative determinations as well?
2. Mass filters and MS analysis
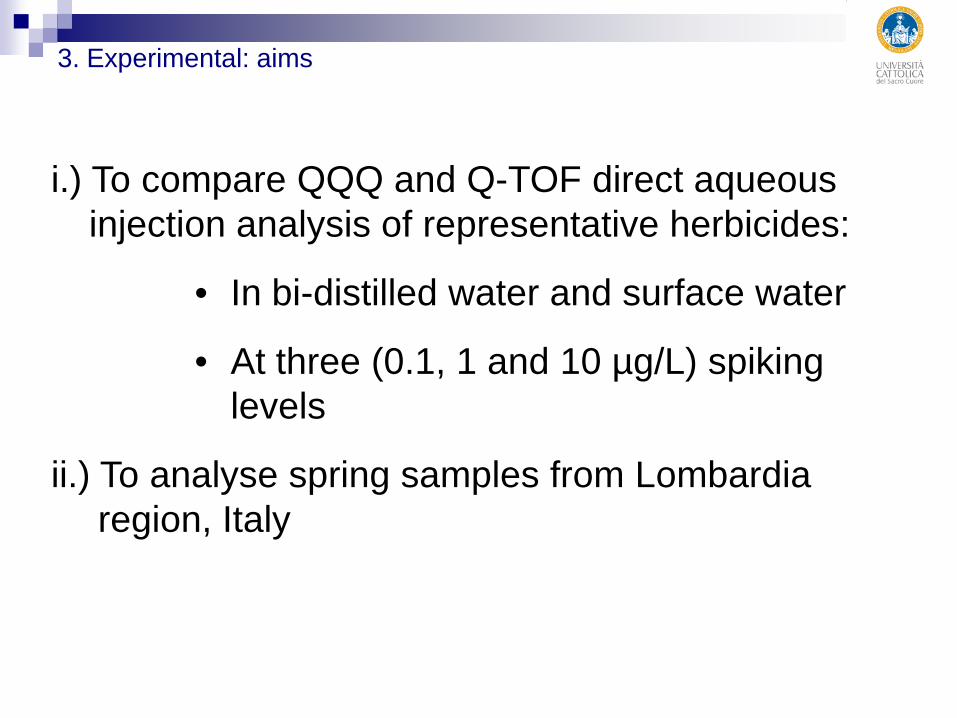
3. Experimental: aims
i.) To compare QQQ and Q-TOF direct aqueous injection analysis of representative herbicides:
• In bi-distilled water and surface water
• At three (0.1, 1 and 10 µg/L) spiking levels
ii.) To analyse spring samples from Lombardia region, Italy
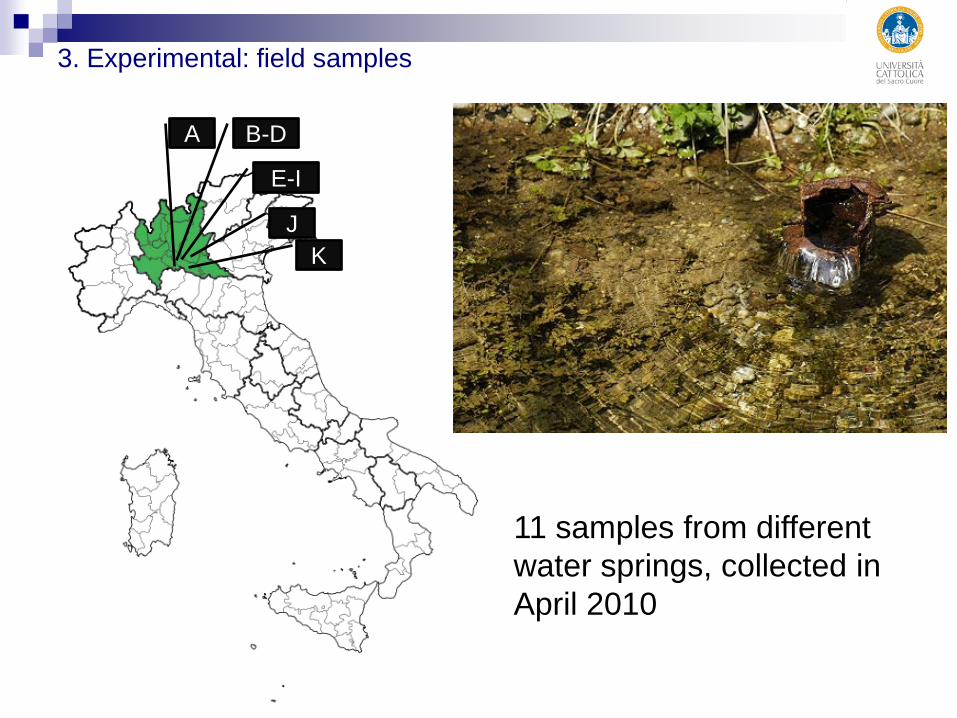
3. Experimental: field samples
E-I
B-D A
J K
11 samples from different water springs, collected in April 2010
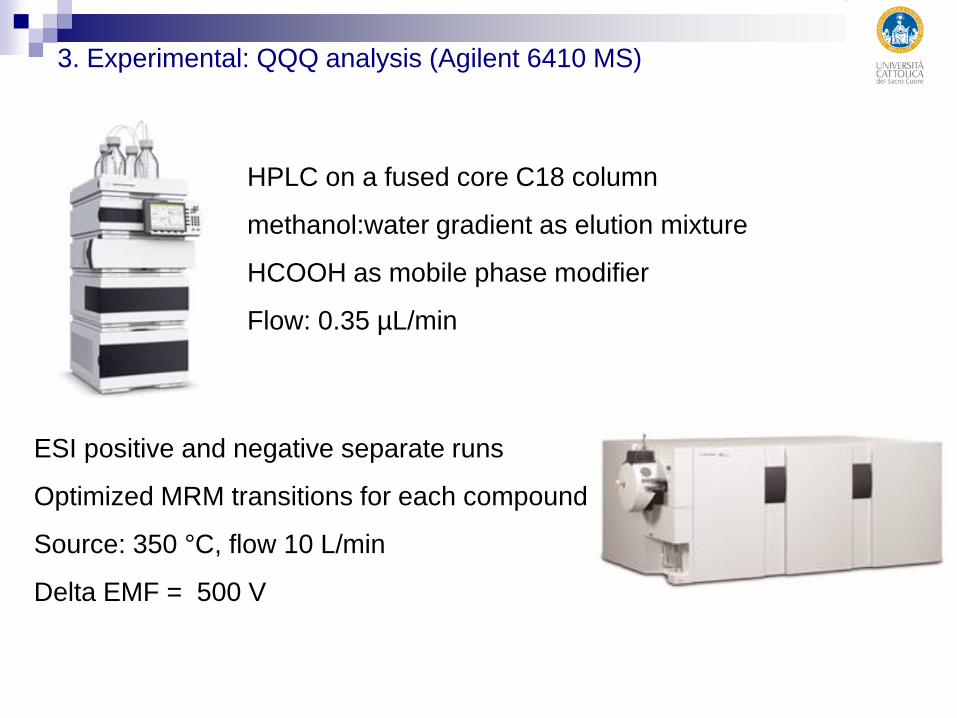
3. Experimental: QQQ analysis (Agilent 6410 MS)
HPLC on a fused core C18 column
methanol:water gradient as elution mixture
HCOOH as mobile phase modifier
Flow: 0.35 µL/min
ESI positive and negative separate runs
Optimized MRM transitions for each compound
Source: 350 °C, flow 10 L/min
Delta EMF = 500 V
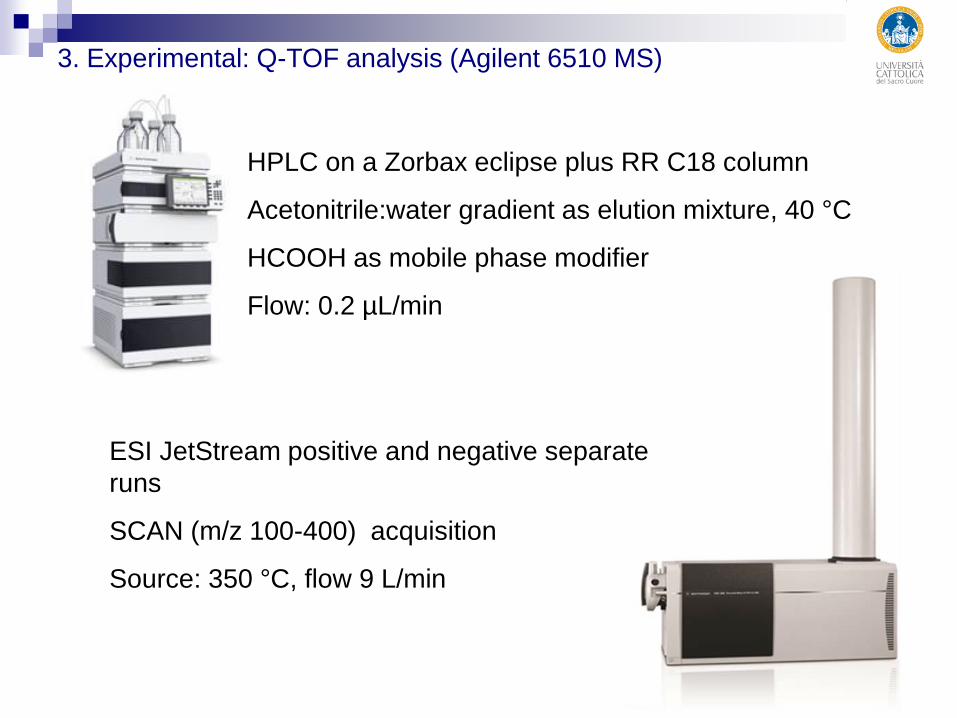
3. Experimental: Q-TOF analysis (Agilent 6510 MS)
HPLC on a Zorbax eclipse plus RR C18 column
Acetonitrile:water gradient as elution mixture, 40 °C
HCOOH as mobile phase modifier
Flow: 0.2 µL/min
ESI JetStream positive and negative separate runs
SCAN (m/z 100-400) acquisition
Source: 350 °C, flow 9 L/min
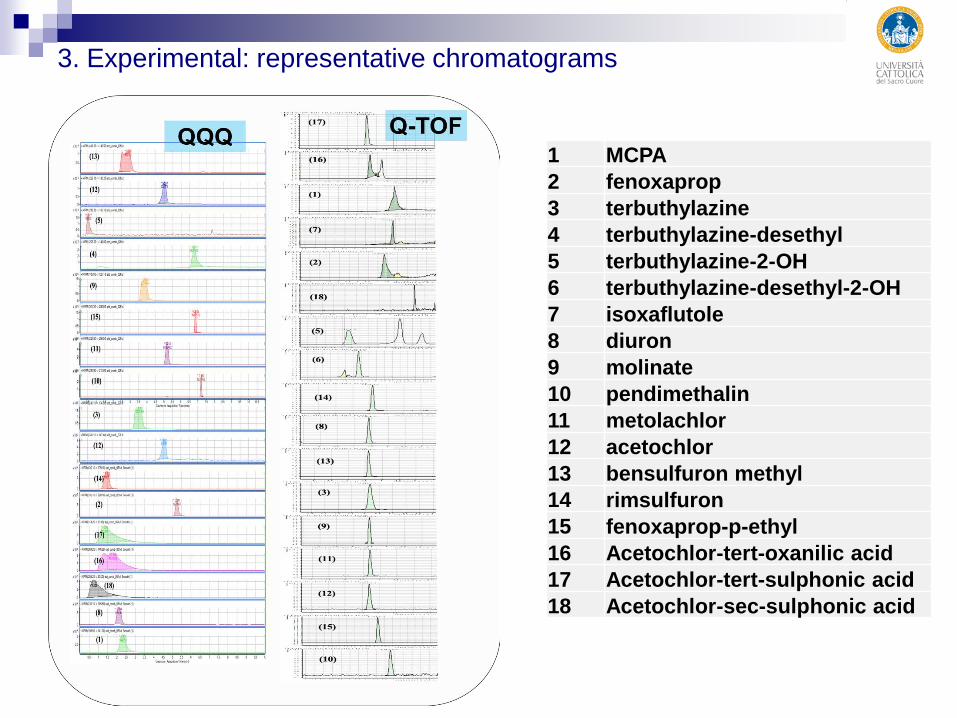
3. Experimental: representative chromatograms
1 MCPA 2 fenoxaprop 3 terbuthylazine 4 terbuthylazine-desethyl 5 terbuthylazine-2-OH 6 terbuthylazine-desethyl-2-OH 7 isoxaflutole 8 diuron 9 molinate 10 pendimethalin 11 metolachlor 12 acetochlor 13 bensulfuron methyl 14 rimsulfuron 15 fenoxaprop-p-ethyl 16 Acetochlor-tert-oxanilic acid 17 Acetochlor-tert-sulphonic acid 18 Acetochlor-sec-sulphonic acid
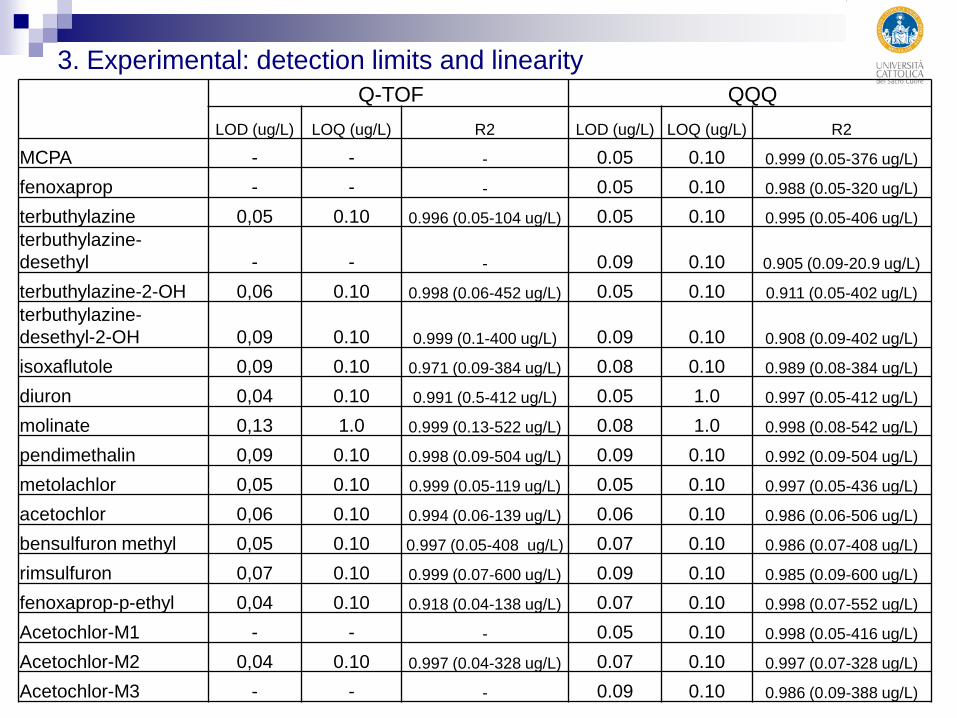
3. Experimental: detection limits and linearity Q-TOF QQQ
LOD (ug/L) LOQ (ug/L) R2 LOD (ug/L) LOQ (ug/L) R2
MCPA - - - 0.05 0.10 0.999 (0.05-376 ug/L)
fenoxaprop - - - 0.05 0.10 0.988 (0.05-320 ug/L)
terbuthylazine 0,05 0.10 0.996 (0.05-104 ug/L) 0.05 0.10 0.995 (0.05-406 ug/L) terbuthylazine-desethyl - - - 0.09 0.10 0.905 (0.09-20.9 ug/L)
terbuthylazine-2-OH 0,06 0.10 0.998 (0.06-452 ug/L) 0.05 0.10 0.911 (0.05-402 ug/L) terbuthylazine-desethyl-2-OH 0,09 0.10 0.999 (0.1-400 ug/L) 0.09 0.10 0.908 (0.09-402 ug/L)
isoxaflutole 0,09 0.10 0.971 (0.09-384 ug/L) 0.08 0.10 0.989 (0.08-384 ug/L)
diuron 0,04 0.10 0.991 (0.5-412 ug/L) 0.05 1.0 0.997 (0.05-412 ug/L)
molinate 0,13 1.0 0.999 (0.13-522 ug/L) 0.08 1.0 0.998 (0.08-542 ug/L)
pendimethalin 0,09 0.10 0.998 (0.09-504 ug/L) 0.09 0.10 0.992 (0.09-504 ug/L)
metolachlor 0,05 0.10 0.999 (0.05-119 ug/L) 0.05 0.10 0.997 (0.05-436 ug/L)
acetochlor 0,06 0.10 0.994 (0.06-139 ug/L) 0.06 0.10 0.986 (0.06-506 ug/L)
bensulfuron methyl 0,05 0.10 0.997 (0.05-408 ug/L) 0.07 0.10 0.986 (0.07-408 ug/L)
rimsulfuron 0,07 0.10 0.999 (0.07-600 ug/L) 0.09 0.10 0.985 (0.09-600 ug/L)
fenoxaprop-p-ethyl 0,04 0.10 0.918 (0.04-138 ug/L) 0.07 0.10 0.998 (0.07-552 ug/L)
Acetochlor-M1 - - - 0.05 0.10 0.998 (0.05-416 ug/L)
Acetochlor-M2 0,04 0.10 0.997 (0.04-328 ug/L) 0.07 0.10 0.997 (0.07-328 ug/L)
Acetochlor-M3 - - - 0.09 0.10 0.986 (0.09-388 ug/L)
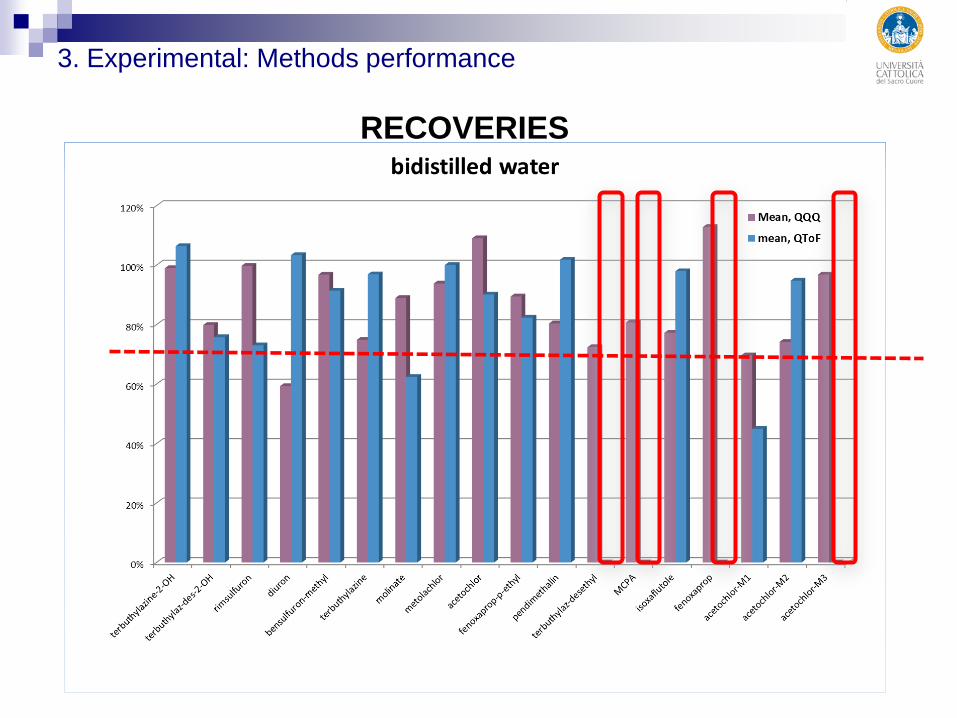
3. Experimental: Methods performance
RECOVERIES
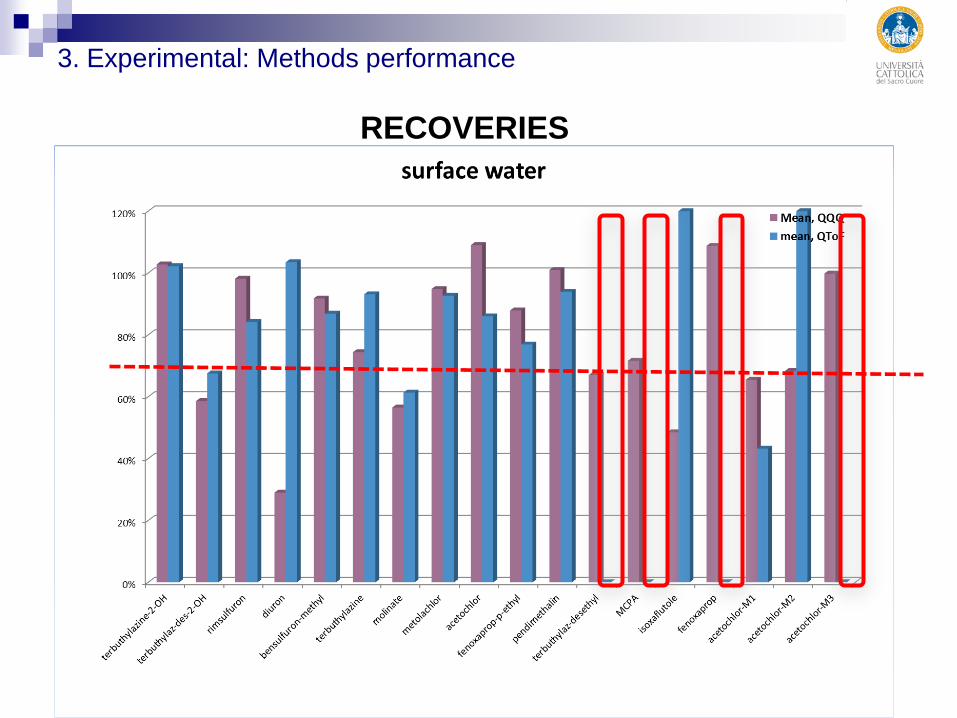
3. Experimental: Methods performance
RECOVERIES
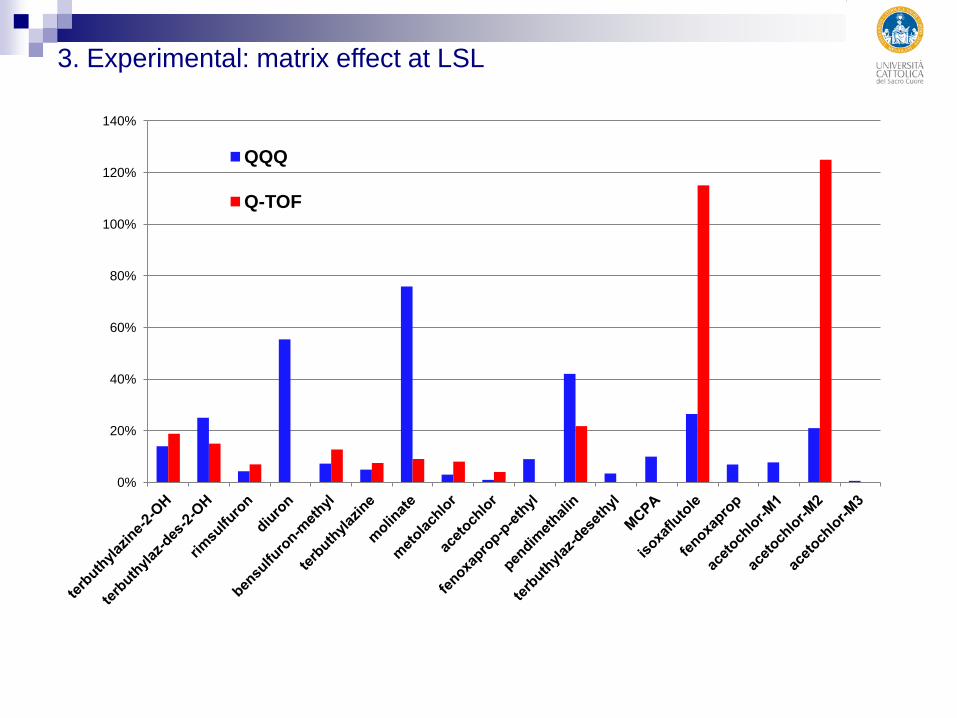
3. Experimental: matrix effect at LSL
0%
20%
40%
60%
80%
100%
120%
140%
QQQ
Q-TOF
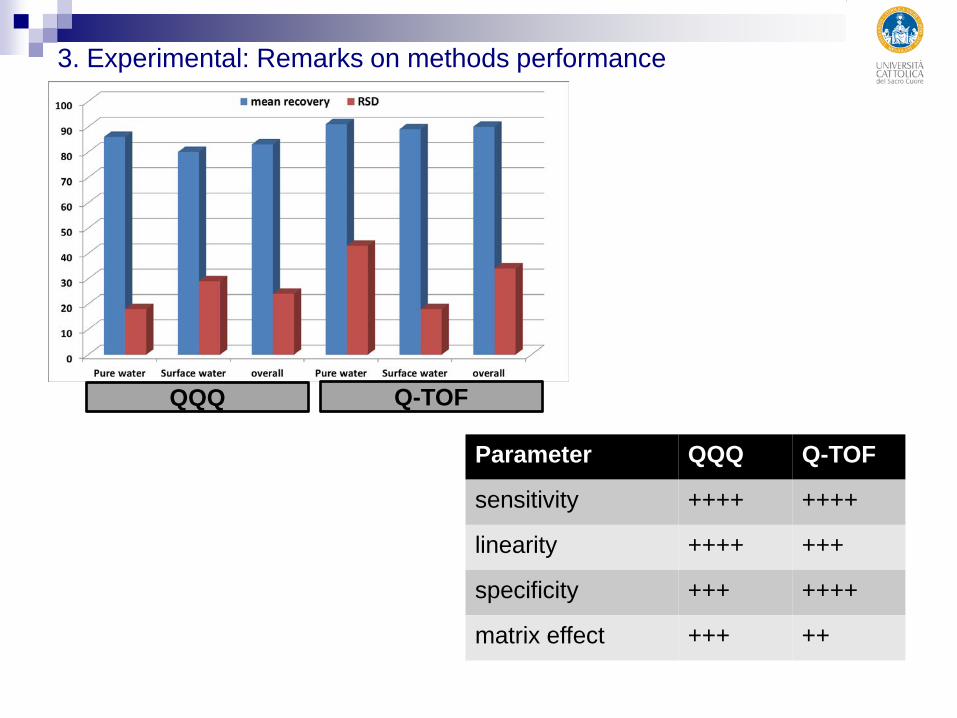
3. Experimental: Remarks on methods performance
QQQ Q-TOF
Parameter QQQ Q-TOF
sensitivity ++++ ++++
linearity ++++ +++
specificity +++ ++++
matrix effect +++ ++
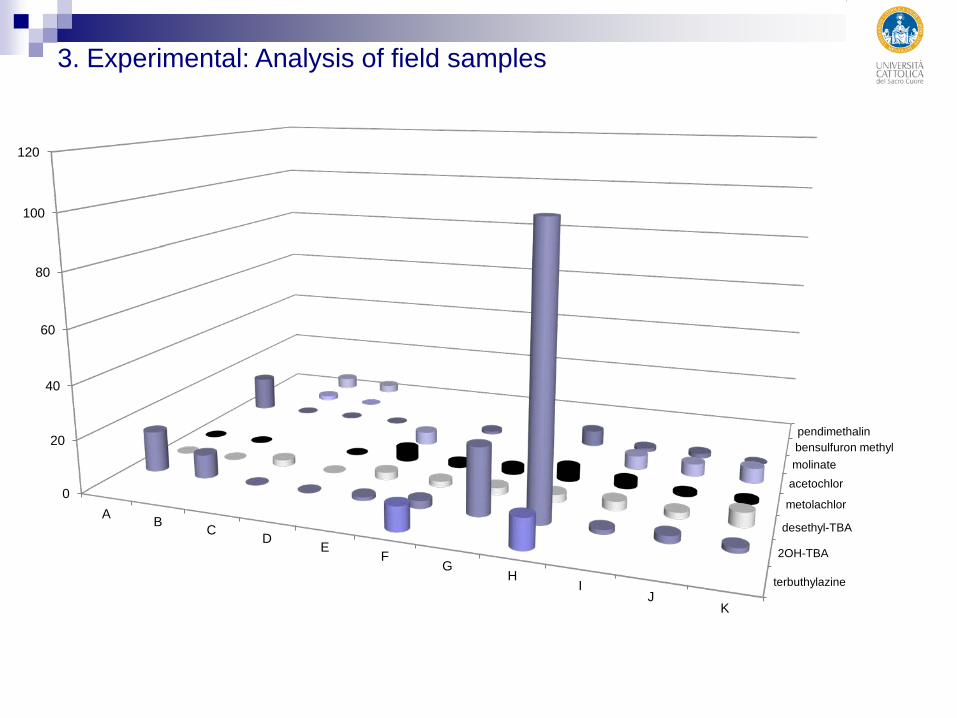
3. Experimental: Analysis of field samples
terbuthylazine
2OH-TBA
desethyl-TBA
metolachlor
acetochlor molinate bensulfuron methyl pendimethalin
0
20
40
60
80
100
120
A B C D E F
G H
I J
K
Conclusions (1 – MS analysis)
1. QQQ tandem MS has been confirmed to be a powerful quantitative analysis
2.Q-TOF has become a very interesting approach, often providing strong quantitative information as well
3.The direct aqueous injection of water samples, when supported by tandem MS, can let the analysis of a broad range of herbicides and their transformation products
Conclusions (2 – herbicides residues)
1. triazine herbicides and their metabolites are very often detected in springs from maize cultivation areas
2.Acetamide and thiocarbamate herbicides are commonly detected as well
3.When specific monitoring programmes are to be implemented, it might be useful to accurately select the target compounds
Special thanks to:
Nicola Cimino
Roberto Pellegrino, University of Perugia