monitoring trail conditions: new methodological … · tation, soil, wildlife and water resources....
TRANSCRIPT

Visitor impact monitoring is also anintegral component of evaluating carryingcapacity, which is defined under the NPSVisitor Experience and Resource Pro-tection (VERP) framework (Manning et al.1995; NPS 1997) as the type and level ofvisitor use a park can accommodate whilesustaining resource and social conditionsthat complement the purposes of the parkand its management objectives. The VERPframework specifies desired resource andsocial conditions and incorporates indica-tors and standards of quality that quantifyimpact acceptability and impairment.
Visitor impact monitoring is an essentialcomponent for periodic evaluations of cur-rent conditions to compare against stan-dards or to evaluate the success of manage-ment actions. Visitor impact monitoring isalso a component of the NPS Vital SignsMonitoring Program, which seeks to moni-tor selected biophysical indicators that rep-resent the health or condition of park natu-ral resources. Visitor use is frequently a pri-mary “agent of change” affecting park vege-tation, soil, wildlife and water resources.
This paper aims to highlight selectedexamples of current research on addressing
The George Wright Forum36
Monitoring Trail Conditions: New Methodological Considerations
Jeffrey L. Marion, Yu-Fai Leung, and Sanjay K. Nepal
IntroductionTHE U.S. NATIONAL PARK SERVICE (NPS) ACCOMMODATES NEARLY 300 MILLION VISITORS
per year, visitation that has the potential to produce negative effects on fragile natural andcultural resources. The policy guidance from the NPS Management Policies recognizes thelegitimacy of providing opportunities for public enjoyment of parks while acknowledgingthe need for managers to “seek ways to avoid, or to minimize to the greatest degree practica-ble, adverse impacts on park resources and values” (NPS 2001). Thus, relative to visitor use,park managers must evaluate the types and extents of resource impacts associated with recre-ational activities, and determine to what extent they are unacceptable and constitute impair-ment. Visitor impact monitoring programs can assist managers in making objective evalua-tions of impact acceptability and impairment and in selecting effective impact managementpractices by providing quantitative documentation of the types and extent of recreation-related impacts on natural resources. Monitoring programs are explicitly authorized inSection 4.1 of the Management Policies:
Natural systems in the national park system, and the human influences upon them, will bemonitored to detect change. The Service will use the results of monitoring and research tounderstand the detected change and to develop appropriate management actions.

methodological challenges associated withthe development of trail assessment andmonitoring procedures as applied to formaland informal trails. The discussion is by nomeans a representation of all importantissues; rather, it reflects the major chal-lenges faced in recent visitor impact studiesin which the authors were involved.
Trail impacts and monitoring methodsOne activity that virtually every park
visitor engages in is walking on trails. Evenlight traffic can remove protective layers ofvegetation cover and organic litter from for-mal or informal “visitor-created” trails(Cole 2004). Trampling can alter theappearance and composition of trailsidevegetation by reducing vegetation heightand favoring trampling-resistant species(Cole 1995). Visitors and livestock canintroduce and transport non-native plantspecies along trail corridors, some of whichmay out-compete undisturbed native vege-tation and migrate away from trails (Tyserand Worley 1992). Visitor traffic can alsocompact soils, widen trails, exacerbateproblems with muddiness, and acceleratesoil erosion (Leung and Marion 2000). Soilerosion, unlike most other forms of trailimpact, is critical because it is not self-limit-ing. For example, soil loss on 328 mi of sur-veyed trails in Great Smoky MountainsNational Park exceeded 1 ft below the esti-mated post-construction tread surface at734 locations (14.6 mi; 4.5%), and exceed-ed 2 ft at 100 locations (2.51 mi; 1.1%)(Marion 1994).
Trail impact assessments and monitor-ing seek to describe resource conditionsand impacts for the purpose of document-ing trends in trail conditions, investigatingrelationships with influential factors, andevaluating current conditions in light of
management standards of quality or the effi-cacy of corrective actions. A variety ofassessment and monitoring methods havebeen developed for formal trails and aredescribed in the literature, as reviewed andcompared by Cole (1983) and Leung andMarion (2000). These methods may beclassified into two main groups based onmonitoring approaches (Leung and Marion2000). Sampling-based approaches employeither systematic point sampling, wheretread assessments are conducted at a fixedinterval along a trail (Cole 1983, 1991), orby stratified point sampling, where sam-pling varies in accordance with various stra-ta such as level of use or vegetation type(Hall and Kuss 1989). Alternately, census-based approaches employ either sectionalevaluations, where a trail is divided into sec-tions with assessments made for each sec-tion (Bratton et al. 1979), or problem cen-sus evaluations, where continuous assess-ments record every occurrence of prede-fined impact problems (Cole 1983; Marion1994; Leung and Marion 1999a). Moreelaborate and time-consuming methods foraccurately characterizing soil loss (Leonardand Whitney 1977) and vegetation changes(Hall and Kuss 1989) have also been devel-oped.
Relatively less attention has been paidto assessing and monitoring informal visi-tor-created trails (often also referred to as“social trails”). Most previous monitoringstudies on informal trails have focused ontheir proliferation in the park landscaperather than resource conditions or treadconditions. Three main monitoringapproaches have been developed specifical-ly for informal trails. Some past visitorimpact studies had informal trails includedas an indicator, with the level of prolifera-tion assessed by tallying the occurrence of
Visitor Impact Monitoring
Volume 23 • Number 2 (2006) 37

informal trail segments extending from for-mal trail networks or recreation sites(Marion 1994; Leung et al. 2002). Alterna-tively, the entire social trail network of apark or selected portions of a park can beinventoried and mapped (Cole et al. 1997;Leung et al. 2002). Most of these studieshave also incorporated condition-class rat-ings to the assessments. Finally, very fewstudies have actually monitored social trailnetworks more than one time to enable atemporal evaluation (Yosemite NationalPark 2005). Due to the extensive nature ofsome informal trail networks, the efficiencyof field assessments is a particular concern.The advent of geospatial techniques seemsto provide potential solutions to this chal-lenge, though such technologies benefitmonitoring of formal trails as well.
Sampling-based or census-based?Given the diverse array of trail condi-
tion assessment methods, an importantconsideration is selection between a sam-pling-based or census-based approach. Incontrast to many other forms of monitoring,a sampling method may not necessarilyconfer a substantial savings in assessmenttime as most methods require hiking all ornearly all of the selected trails. For example,two leading methods, systematic point sam-pling and problem census, each require sur-veyors to hike the entire trail, but trails ingood condition would require fewer stopsto document trail impacts so the problemcensus method would be more efficient.Marion and Leung (2001) evaluated bothmethods on a common segment of theAppalachian Trail in Great Smoky Moun-tains National Park. They concluded thatthe point sampling method provides moreaccurate and precise measures of trail char-
acteristics that are continuous (e.g., widthor depth) or frequent (e.g., exposed soil).The problem census method is a preferredapproach for monitoring trail characteris-tics that can be easily defined (e.g., exces-sive erosion) or are infrequent, particularlywhen information on the location and linealextent of specific trail impact problems isneeded. However, measurements for thismethod sometimes require judgments thatmay be subjective regarding where theimpact problems begin and end (e.g., whereexcessive muddiness or erosion > 6 in be-gins and ends).
Condition classesCondition-class systems are commonly
used in visitor impact monitoring (Leungand Marion 2000). Until recently, applica-tions of such systems were largely restrictedto parks in North America and Aus-tralia/New Zealand. The third author devel-oped a set of four qualitative trail conditionclasses (Table 1) and applied them to 55 miof high-use tourist trails in Sagarmatha(Mount Everest) National Park, Nepal(Nepal 2003). The descriptive statementsemployed in defining the condition classeswere based on findings from prior applica-tion of several measurement-based traildegradation procedures. Results indicatedthat there were 69 Class I segments (7.7 mitotal), 58 Class II segments (6.2 mi), 16Class III segments (2.1 mi), and 65 ClassIV segments (7.2 mi). The remaining 32miles of trails did not exhibit any degrada-tion so no condition class was appliedthere. A principal advantage of this methodis its ease of application and simplicity inpresenting the findings. However, judg-ments involved in distinguishing betweenthe classes introduce subjectivity, and,
Visitor Impact Monitoring
The George Wright Forum38

Table 1. Qualitative trail condition classes.
Visitor Impact Monitoring
Volume 23 • Number 2 (2006) 39

because class definitions can employ sever-al forms of trail degradation, interpretationof the findings can be difficult.
Monitoring vegetation changes alongtrails
Assessing vegetation changes, includ-ing changes in vegetation cover and compo-sition, is a growing concern, particularly asthey relate to the introduction and spread ofnon-native plants. Two factors make thiswork more challenging, however: (1) thelack of availability of field staff with plantidentification skills, and (2) the largeamount of time required to perform plantsampling methods along with identificationand cover estimation. Nepal and Way (inpress) experimented with a permanent tran-sect survey with quadrat sampling of trail-side vegetation along two trails in MountRobson Provincial Park, Canada. Employ-ing systematic sampling with a randomstart, transects were located every 1,320 ftalong the trails with a 3.3x3.3-ft trailsidequadrat established perpendicularly to thetrail border, with another “control” quadratestablished 19.3 ft off-trail. Both quadratswere placed along the extended trail tran-sect line, which was georeferenced with aglobal positioning system (GPS) andmarked by tagging the closest mature tree.
Plants within each quadrat were identi-fied to the species level where possible andassessed for cover to enable subsequentanalyses of differences in relative cover,species richness and dissimilarity, and thepresence and cover of non-native species.Comparisons of plants found in the trailsideand control quadrats also permit evalua-tions of how differences in morphologicalcharacteristics can affect a plant’s resistanceto trampling damage, as well as enablingclassification of plants relative to the trail-
side disturbance regime (increasers anddecreasers).
Monitoring soil erosionSoil erosion along trails is perhaps the
most significant form of trail degradation(Figure 1). Ecologically, soil loss from trailscould be considered a significant “irre-versible” form of impact since most of thesoil is transported off trail treads where itcannot be retrieved and replaced. Theeroded soils may smoothen adjacentground vegetation, or enter water bodieswhere it can remain suspended or settle outon rock or gravel substrates and harmaquatic life. The resulting rutted trails thenintercept and transport greater volumes ofwater, accelerating further soil erosion andaltering natural patterns of water runoff.Even in the absence of further use, the lossof organic litter and topsoil and exposure ofroots and rocks can greatly retard the natu-ral recovery of vegetation. From a visitor’sperspective, eroded treads are more difficultand potentially unsafe to use and they areaesthetically displeasing (Figure 2). Theseissues also have substantial significancegiven the important role played by trails as atransportation network and the substantialtime visitors spend on trails in backcountryenvironments.
Unfortunately, obtaining accurate, pre-cise, and efficient measures of soil erosionalong trails is perhaps the most challengingof all trail condition assessments. Scientistshave developed and refined numerousmethods for assessing soil erosion alongtrails. These methods include qualitativecondition-class assessments, proxy rapidassessment measures (e.g., maximum inci-sion measures), and several variations ofmethods that measure the cross-sectionalarea of trail ruts. Other methods include a
Visitor Impact Monitoring
The George Wright Forum40

performing a census of severely eroded oractively eroding segments, and taking stereophotography. Leung and Marion (2000)and Cole (1983) provide more comprehen-sive reviews of trail impact monitoringmethods, with citations.
This section provides a review of recentadvances in direct measurements of soilerosion on trails, specifically the maximumincision and cross-sectional area methods.Soil erosion measurements have generallybeen applied at sample points located atfixed intervals along a trail, typically with arandomized start to ensure that any pointalong a trail has the potential to be assessed.Selecting an appropriate sampling intervalhas been an arbitrary process and intervalsreported in the literature have ranged from150 ft to 1,650 ft (Cole 1983). Leung andMarion (1999b) examined the influence ofsampling interval on the accuracy of esti-
mates for four trail impact indicators,including tread incision. Their researchprovides guidance for selecting a samplinginterval, revealing that an interval up to 325ft yields an excellent level of estimate accu-racy for the lineal extent of these impactindicators, with intervals of up to 1,650 ftacceptable when greater efficiency is need-ed.
Trail maximum incision measures aretaken at each trail sample point from a linetransect established perpendicularly to thetrail tread to the lowest point on the trailtread. A perennial problem that affects boththe accuracy and precision (reliability) oftrail incision measures are differing deter-minations of the appropriate upper datumto measure to. The principal goal of soilerosion measures on trails is to assess onlypost-construction soil loss that is related torecreational uses. This is generally a
Visitor Impact Monitoring
Volume 23 • Number 2 (2006) 41
Figure 1 (left). Trail erosion at Assategue Island National Seashore. Photo courtesy of Yu-Fai Leung.Figure 2 (right). Eroded trails, such as these among historic earthworks at Colonial National Historical Park, are aesthetically dis-pleasing to many people. Photo courtesy of Yu-Fai Leung.

straightforward process for trails in flat ter-rain (Figure 3a). Such trails are generally“walked in” or involve minimal removal oforganic layers. However, one problem thatcan lead to possible measurement errorsand erroneous data is when a recreationaltrail follows a former primitive road align-ment where substantial soil loss is evidentfrom either initial construction (often withheavy machinery) or historic erosion thatpredates recreational uses (Figure 3b).While many studies have employed maxi-mum incision measures, few have specifiedhow these measures were taken and noneappear to have addressed this particularproblem. In response, Farrell and Marion(2002) developed and applied two maxi-mum incision measures:
1. Maximum incision, post-construction(MIP): the maximum incision of thetrail tread along a transect establishedperpendicularly to the trail at the sam-pling point, from the original land sur-face to the lowest substrate surface.
2. Maximum incision, current tread(MIC): the maximum incision of thetrail tread along a transect establishedperpendicularly to the trail at the sam-pling point, from a line stretchedbetween stakes placed at the currenttrail boundaries to the lowest substratesurface.
When applied to trails in flatter terrain,both measures assume no construction-related soil loss. MIP measures are moretime-consuming on trails with substantialamounts of historic soil erosion (Figure 3b).For example, our experience in nationalparks has found trails with MIP measures ofover 8 ft, often with 20- to 30-year-old treesgrowing from the eroded trailsides. It is dif-ficult to take accurate maximum incision
measures in such situations, and includinghistoric erosion that is not recreation-relat-ed is counter to the principal goal of moni-toring. When historic erosion is evident, wesuggest that the MIC measure provides amore accurate and efficient assessment ofon-going recreation-related erosion and is amore managerially relevant indicator.
The application and subsequent inter-pretation of maximum incision measuresbecomes more challenging for trails locatedin steeper terrain that required side-hillconstruction techniques (Figure 3d). Side-hill trails are constructed by excavating soiland moving it down slope to create a gentlyout-sloped trail tread. Measuring recre-ation-related soil loss on these trailsrequires an estimation of the upper datumto measure to—the post-construction treadsurface. Differing determinations of thisdatum can again introduce considerablemeasurement error. Published trail soil ero-sion assessment methods suggest that previ-ous studies may have ignored this dilemmaas well. Farrell and Marion (2002) alsodeveloped procedures and diagrams(Figure 3d–f ) for side-hill trails, includingsituations where trails follow old primitiveroads with substantial amounts of historicerosion. This guidance directs field staff toestimate the post-construction tread surfacethrough examination of local features,including tree roots, rocks, and trail edgesin the vicinity of transects, and a 3% outs-lope of the post-construction tread. Mostagency guidance calls for a 5% outslope, sothese procedures provide a somewhat con-servative estimate of soil loss. Guidance onwhen to ignore the presence of berms(Figure 3e–f ) comprising soil and organiclitter along the lower trail edge is alsoincluded, as berms grow in height overtime.
Visitor Impact Monitoring
The George Wright Forum42

These adaptations were applied in astudy of hiking trails in Torres del PaineNational Park, Chile, with results indicatingsubstantial differences in the two soil lossmeasures. MIC averaged 0.4 in. for low-usetrails to 1.2 in. for high-use trails, while MIPaveraged 3.1 in. on low-use trails and 5.9 in.on high-use trails (Farrell and Marion2002). Furthermore, MIC measuresremained substantially smaller regardless oftrail position. Average MIC values were 0.8in on trails in flatter valley-bottom positionsand 1.2 in. in steeper mid-slope positions,while MIP values averaged 3.9 in. and 5.5in. respectively. These findings emphasizethe importance of providing more explicit
guidance, including written procedures anddiagrams, to guide maximum incision mea-surements.
Current research by the lead author isfocusing on the further development ofcross-sectional area (CSA) procedures,building on the work described above.CSA assessment methods are applied totransects oriented perpendicularly to trailtreads at sample points as previouslydescribed for the maximum incision meas-ures. Many vertical measurements are takenalong the transect line across the width ofthe trail to provide an accurate estimate ofthe area of soil loss in a plane extendingfrom the transect line to the tread surface.
Visitor Impact Monitoring
Volume 23 • Number 2 (2006) 43
Figure 3. Diagrams illustrating the application of maximum incision measurements for trails in flat vs. slopingterrain. Source: Farrell and Marion 2002.

The vertical measurements can be taken at afixed interval or at variable intervals basedon changes in the microtopography of thetread surface (see Figure 4 in Manning etal., this volume). Recent research conduct-ed at Zion National Park (not reportedhere) compared the fixed and variablemethods and will provide guidance on theselection of a fixed interval distance. Anadded advantage of CSA procedures is theability to extrapolate findings to provideestimates of aggregate soil loss for an entiretrail.
Monitoring visitor-created informaltrails
So far the discussion of trail assessmentand monitoring methods has focused onformal or established trails. However, visi-tor-created informal trails present a differ-ent set of challenges to management andmonitoring (Leung et al. 2002). Since in-formal trails are not planned and construct-ed, they are usually poorly located withrespect to terrain, and they receive little orno maintenance. These factors substantiallyincrease their potential for degradation incomparison with formal trails. The prolifer-ation of informal trails may increase habitatfragmentation and can directly threaten sen-sitive habitats when crossed or accessed byunplanned trails. From a social perspectivea web of informal trails create a visuallyscarred landscape and may lead to safetyand liability concerns. Due to their ecologi-cal and social significance, informal trailsare a common indicator selected in differentimplementations of NPS’s VERP planningframework (Bacon et al., this volume; Man-ning et al. 2005) as well as in the agency’sVital Signs monitoring program (Monz andLeung, this volume).
Monitoring can provide timely infor-
mation on the extent, distribution, and con-dition of informal trail segments. Suchinformation can serve as a warning sign ofresource degradation and habitat intrusionand can trigger management actions if stan-dards established to specify minimumacceptable conditions are exceeded. Somemajor monitoring questions related to infor-mal trails include:
• What are the alternative indicator mea-sures and monitoring techniques?
• Are there efficient methods to monitorinformal trails without field mappingthem all?
• How do the methods compare withrespect to accuracy, precision/consis-tency, and efficiency?
As mentioned earlier, there are threegeneral approaches to informal trail moni-toring, with increasing levels of complexityand field time requirements. Major devel-opments are currently occurring with therapid advancement of geospatial technolo-gies, such as geographic information sys-tems (GIS), global positioning systems(GPS), and digital spatial data. These tech-nologies are particularly relevant to infor-mal trail monitoring because of their dis-persed spatial distribution. The followingdiscussion focuses primarily on examples ofrecent applications of geospatial technolo-gies for monitoring informal trail networks.
GPS mapping. In a recent study of vis-itor carrying capacity in Boston HarborIslands National Recreation Area, informaltrails were selected as a resource-basedindicator (Leung and Meyer 2004; Man-ning et al. 2005). The park consists of 34units (islands and peninsulas) that received262,000 visits in 2002. Georges, Grape,and Peddocks Islands and World’s EndPeninsula are popular destinations within
Visitor Impact Monitoring
The George Wright Forum44

the park. A professional-grade handheldTrimble GPS unit was used to map informaltrails on all park units that have discernablesigns of visitor use. Each informal trail seg-ment was mapped and its condition ratedusing a four-point condition-class system(Leung et al 2002). Based on the GPS data,three alternative indicator measures werederived, including total length of informaltrails, density of informal trails (length/unitarea), and spatial proximity of informaltrails to sensitive resources. Results showthat World’s End had about 76,000 ft ofinformal trails (total length measure) or 277ft/acre (density measure), both of which arethe highest among all units (Figure 4).
Other islands with a significant presence ofinformal trails include Georges (9,329 ft)and Peddocks (7,049 ft), though the largersize of Peddocks Island resulted in a lowerdensity value (33.5 ft/acre). In contrast,some small islands, such as Raccoon (3.6acres) and Langlee (5.2 acres) Islands, hadlow total lengths of informal trails but theirdensity values were quite high (204 and
169 ft/acre, respectively). These resultshave aided the park in selecting the pre-ferred indicator measure (density of infor-mal trails) and establishing associated stan-dards.
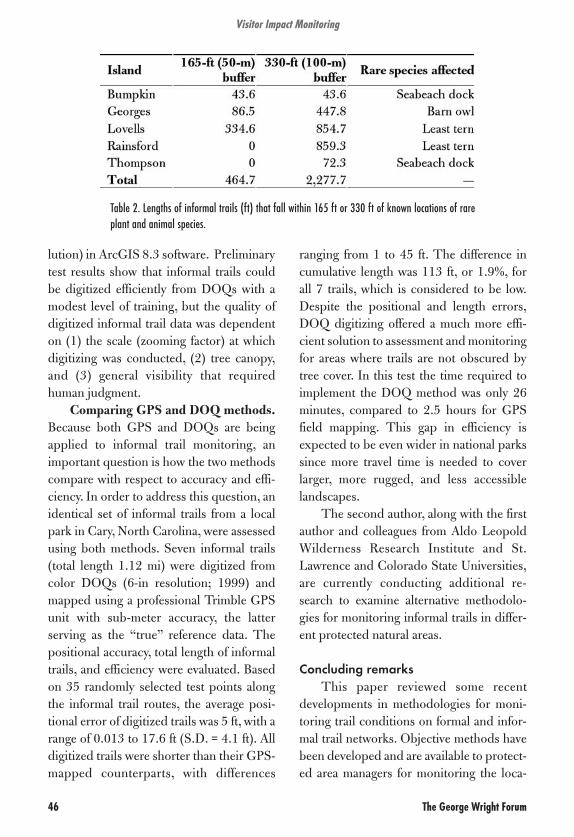
When the informal trails data layer wasintegrated with other layers, such as loca-tions of rare plant and animal species, prox-imity-based indicator measures can bederived that are indicative of visitor tram-pling disturbance within sensitive resourceareas. Two proximity levels, 165 ft (50 m)and 330 ft (100 m) from rare species loca-tions, were applied in the Boston HarborIslands study (Table 2). Results show thatthe barn owl, least tern, and seabeach dock
rare species may be threatenedby visitor use on Bumpkin,Georges, and Lovells Islands.
Digital orthophotography.The increasing availability ofhigh-quality remotely sensedspatial data can aid in increasingthe coverage and efficiency ofmonitoring informal trail net-works. One type of spatial datathat is particularly promising isdigital orthophoto quadrangles(DOQs), which are computer-generated images of aerial pho-tographs that combine theimage characteristics of a high-resolution photograph with thegeometric qualities of a map.
DOQs are georectified and georeferencedand can therefore be integrated with otherGIS data layers.
The procedures involved in extractinginformal trail data from the DOQs werepilot-tested in the Yorktown area ofColonial National Historic Park. Heads-upor on-screen digitizing of informal trails wasperformed on infrared DOQs (0.5-m reso-
Visitor Impact Monitoring
Volume 23 • Number 2 (2006) 45
Figure 4. Formal and informal trail networks in World’s End Peninsula, BostonHarbor Islands National Recreation Area.
lution) in ArcGIS 8.3 software. Preliminarytest results show that informal trails couldbe digitized efficiently from DOQs with amodest level of training, but the quality ofdigitized informal trail data was dependenton (1) the scale (zooming factor) at whichdigitizing was conducted, (2) tree canopy,and (3) general visibility that requiredhuman judgment.
Comparing GPS and DOQ methods.Because both GPS and DOQs are beingapplied to informal trail monitoring, animportant question is how the two methodscompare with respect to accuracy and effi-ciency. In order to address this question, anidentical set of informal trails from a localpark in Cary, North Carolina, were assessedusing both methods. Seven informal trails(total length 1.12 mi) were digitized fromcolor DOQs (6-in resolution; 1999) andmapped using a professional Trimble GPSunit with sub-meter accuracy, the latterserving as the “true” reference data. Thepositional accuracy, total length of informaltrails, and efficiency were evaluated. Basedon 35 randomly selected test points alongthe informal trail routes, the average posi-tional error of digitized trails was 5 ft, with arange of 0.013 to 17.6 ft (S.D. = 4.1 ft). Alldigitized trails were shorter than their GPS-mapped counterparts, with differences
ranging from 1 to 45 ft. The difference incumulative length was 113 ft, or 1.9%, forall 7 trails, which is considered to be low.Despite the positional and length errors,DOQ digitizing offered a much more effi-cient solution to assessment and monitoringfor areas where trails are not obscured bytree cover. In this test the time required toimplement the DOQ method was only 26minutes, compared to 2.5 hours for GPSfield mapping. This gap in efficiency isexpected to be even wider in national parkssince more travel time is needed to coverlarger, more rugged, and less accessiblelandscapes.
The second author, along with the firstauthor and colleagues from Aldo LeopoldWilderness Research Institute and St.Lawrence and Colorado State Universities,are currently conducting additional re-search to examine alternative methodolo-gies for monitoring informal trails in differ-ent protected natural areas.
Concluding remarksThis paper reviewed some recent
developments in methodologies for moni-toring trail conditions on formal and infor-mal trail networks. Objective methods havebeen developed and are available to protect-ed area managers for monitoring the loca-
Visitor Impact Monitoring
The George Wright Forum46
Table 2. Lengths of informal trails (ft) that fall within 165 ft or 330 ft of known locations of rareplant and animal species.

tion, extent, and condition of trails. Thesetools are being refined and implementedmore efficiently with the help of advancinggeospatial technologies. However, there aretrade-offs between the efficiency and accu-racy and richness of alternative data collec-tion methods. For example, geospatialmethods are of little benefit for assessingtread conditions (e.g., erosion or muddi-ness) along trails but appear to be superiorin monitoring changes in the lineal extent ofinformal trail networks in situations wherethey are visible from airplanes or satellites.The choice of monitoring methods andindicators is based on information needsand staffing and equipment availability.The development and use of standardizedmethods is also encouraged so that moni-toring results can be compared and evaluat-ed in a regional context.
Several trends are evident from our dis-cussion. There are increasing applicationsof trail monitoring internationally inresponse to growing ecotourism visitationin global protected areas. Many of theseareas do not possess the same level of finan-cial and human resources, so streamlined orefficient procedures may be a necessary
choice. Condition-class rating systems canbe an attractive low-cost solution. Secondly,soil erosion is a key indicator in trail condi-tion monitoring, and research efforts willcontinue to focus on this indicator toincrease its accuracy, precision, and effi-ciency. Thirdly, geospatial technologies arebecoming an essential tool in trail monitor-ing, though its potential is still beingexplored. The utility of low-cost GPS unitsneeds to be further explored since they aremore accessible to protected area managersand park volunteers.
Other methodological considerationsthat may be important for further examina-tion include the increasing engagement ofpark volunteers, conservation organiza-tions, and student groups in monitoringand its implications on the quality of data.Monitoring methods may need to be devel-oped with an acceptable level of robustnessso inter-rater variability is reduced whenmultiple volunteers with different back-grounds are involved. Further research willlikely result in more effective trail impactindicator measures that benefit both VERPand Vital Sign monitoring programs inNPS.
Visitor Impact Monitoring
Volume 23 • Number 2 (2006) 47
AcknowledgmentsThe second author would like to express thanks for Nigel Shaw (NPS GIS specialist),
and North Carolina State University graduate students Mike Naber, Lee Steider, and MikeSmith for their GIS and field assistance.
ReferencesBratton, S.P., M.G. Hickler, and J.H. Graves. 1979. Trail erosion patterns in Great Smoky
Mountains National Park. Environmental Management 3, 431–445.Cole, D.N. 1983. Assessing and Monitoring Backcountry Trail Conditions. Research Paper
INT-303. Ogden, Utah: U.S. Department of Agriculture–Forest Service, IntermountainResearch Station.
———. 1991. Changes on Trails in the Selway-Bitterroot Wilderness, Montana, 1978–1989.Research Paper INT-212. Ogden, Utah: U.S. Department of Agriculture–ForestService, Intermountain Research Station.
———. 1995. Experimental trampling of vegetation. I. Relationship between tramplingintensity and vegetation response. Journal of Applied Ecology 32, 203–214.
———. 2004. Impacts of hiking and camping on soils and vegetation: a review. In Environ-mental Impacts of Ecotourism. R. Buckley, ed. Wallingford, U.K.: CABI Publishing,41–60.
Cole, D.N., A.E. Watson, T.E. Hall, and D.R. Spildie. 1997. High-Use Destinations in Wil-derness: Social and Biophysical Impacts, Visitor Responses, and Management Options.Research Paper INT-RP-496. Ogden, Utah: U.S. Department of Agriculture–ForestService, Intermountain Research Station.
Farrell, T.A., and J.L. Marion. 2002. Trail impacts and trail impact management related toecotourism visitation at Torres del Paine National Park, Chile. Leisure/Loisir: Journalof the Canadian Association for Leisure Studies 26:1/2, 31–59.
Hall, C.N., and F.R. Kuss. 1989. Vegetation alteration along trails in Shenandoah NationalPark, Virginia. Biological Conservation 48, 211–227.
Leonard, R.E., and A.M. Whitney. 1977. Trail Transect: A Method for Documenting TrailChanges. Research Paper NE-389. Upper Darby, Pa.: U.S. Department of Agriculture–Forest Service, Northeastern Forest Experiment Station.
Leung, Y.-F., and J.L. Marion. 1999a. Assessing trail conditions in protected areas: An appli-cation of a problem-assessment method in Great Smoky Mountains National Park,USA. Environmental Conservation 26, 270–279.
———. 1999b. The influence of sampling interval on the accuracy of trail impact assessment.Landscape and Urban Planning 43, 167–179.
———. 2000. Recreation impacts and management in wilderness: A state-of-knowledgereview. In Proceedings: Wilderness Science in a Time of Change; Volume 5: WildernessEcosystems, Threats, and Management. D.N. Cole, S.F. McCool, W.T. Borrie, and J.O’Loughlin, comps. Proceedings RMRS-P-15-Vol-5. Ogden, Utah: U.S. Departmentof Agriculture–Forest Service, Intermountain Research Station, 23–48.
Leung, Y.-F., and K. Meyer. 2004. Boston Harbor Islands Carrying Capacity Study: ResourceComponent Final Report. Raleigh: North Carolina State University Department ofParks, Recreation, and Tourism Management.
Leung, Y.-F., N. Shaw, K. Johnson, and R. Duhaime. 2002. More than a database: IntegratingGIS data with the Boston Harbor Islands carrying capacity study. The George WrightForum 19:1 69–78.
Manning, R.E., Y.-F. Leung, and M. Budruk. 2005. Research to support management of vis-itor carrying capacity on Boston Harbor Islands. Northeastern Naturalist 12:SI-3,201–220.
Manning, R., D. Lime, M. Hof, and W. Freimund. 1995. The Visitor Experience andResource Protection (VERP) process: The application of carrying capacity to ArchesNational Park. The George Wright Forum 12:3, 41–55.
Marion, J.L. 1994. An Assessment of Trail Conditions in Great Smoky Mountains NationalPark. Research/Resources Management Report. Atlanta, Ga.: National Park Service,Southeast Region.
Marion, J.L., and Y.-F. Leung. 2001. Trail resource impacts and an examination of alterna-
Visitor Impact Monitoring
The George Wright Forum48

tive assessment techniques. Journal of Park and Recreation Administration 19:3,17–37.
NPS [National Park Service]. 1997. VERP: Visitor Experience and Resource ProtectionFramework—A Handbook for Planners and Managers. Denver: NPS Denver ServiceCenter.
———. 2001. Management Policies. Washington, D.C.: National Park Service.Nepal, S.K. 2003. Trail impacts in Sagarmatha (Mt. Everest) National Park, Nepal: A logis-
tic regression analysis. Environmental Management 32, 312–321.Nepal, S.K., and P. Way. In press. Comparison of vegetation conditions along two backcoun-
try trails in Mount Robson Provincial Park, British Columbia, Canada. Journal ofEnvironmental Management.
Tyser, R.W., and C.A. Christopher. 1992. Alien flora in grasslands adjacent to road and trailcorridors in Glacier National Park, Montana (U.S.A.). Conservation Biology 6:2,253–262.
Yosemite National Park. 2005. Merced River Monitoring 2005 Annual Report: User CapacityManagement Program for the Merced Wild and Scenic River Corridor. El Portal, Calif.:National Park Service, Yosemite National Park.
Jeffrey Marion, U.S. Geological Survey, Patuxent Wildlife Research Center, Virginia Tech,Department of Forestry (0324), Blacksburg, Virginia 24061; [email protected].
Yu-Fai Leung, North Carolina State University, Department of Parks Recreation & TourismManagement, 5107 Jordan Hall, Raleigh, North Carolina 27695-7106; [email protected]
Visitor Impact Monitoring
Volume 23 • Number 2 (2006) 49