monitoring, verification and evaluation unit · pdf filemonitoring, verification and...
TRANSCRIPT

MONITORING, VERIFICATION AND EVALUATION UNITAGRICULTURAL POLICY REFORM PROGRAM
Sponsored by: Government of Egypt, Ministry of Agriculture and Land Reclamation
United States Agency for International Development/CairoOffice of Economic Growth, Agricultural Policy Division
Prime Contractor:Abt Associates Inc.
Subcontractors:Environmental Quality International, Management Systems International
USAID Contract No. 263-C-00-97-00003-00
Project Office: 15th Floor, 7 Nadi El Seid Street, Dokki, CairoTelephones: (202) 337-03 57, 337-05 92, 337-03 78 Fax: (202) 336-2009
MVE UNITAPRP
ASSESSMENT OF
1997 EGYPT
INTEGRATED
HOUSEHOLD
SURVEY DATA
FOR USE IN
CONSTRUCTING
A PRODUCER-LEVEL
BASELINE
Stephan J. GoetzAbt Associates
December, 1999
Impact AssessmentReport No. 8

TABLE OF CONTENTS
LIST OF TABLES . . . . . . . . . . . . . . . . . . . . . . . . . . . . . . . . . . . . . . . . . . . . . . . . . . . . . . . . . . ii
EXECUTIVE SUMMARY . . . . . . . . . . . . . . . . . . . . . . . . . . . . . . . . . . . . . . . . . . . . . . . . . . iv
1. INTRODUCTION . . . . . . . . . . . . . . . . . . . . . . . . . . . . . . . . . . . . . . . . . . . . . . . . . . . . . . . . 1
2. ANALYSIS OF DATA . . . . . . . . . . . . . . . . . . . . . . . . . . . . . . . . . . . . . . . . . . . . . . . . . . . . 22.1 Frequency Counts for Crops Grown by Farmers Surveyed . . . . . . . . . . . . . . . 22.2 Raw Household-Level Production and Sales Data, All Crops . . . . . . . . . . . . . 2
2.3.1 Producer-Level Prices (averaged at the PSU-Level) . . . . . . . . . . . . . . 72.3.2 Retail Prices and Marketing Margins . . . . . . . . . . . . . . . . . . . . . . . . . 8
2.4 Average Land Area Allocated to Primary Crops, All Farms . . . . . . . . . . . . . 122.5 Productivity Data for Primary Crops: Crop Yields . . . . . . . . . . . . . . . . . . . . 122.6 Input Expenditures . . . . . . . . . . . . . . . . . . . . . . . . . . . . . . . . . . . . . . . . . . . . . 13
2.6.1 Expenditures per Household . . . . . . . . . . . . . . . . . . . . . . . . . . . . . . . 132.6.2 Expenditures per Crop . . . . . . . . . . . . . . . . . . . . . . . . . . . . . . . . . . . . 152.6.3 Hired Labor Expenditures and Family Labor Use . . . . . . . . . . . . . . . 18
2.7 Miscellaneous Agricultural Expenditures and Revenues . . . . . . . . . . . . . . . . 192.8 Ownership of Agricultural Implements . . . . . . . . . . . . . . . . . . . . . . . . . . . . . 192.10 Input Marketing Characteristics (for Major Crops) . . . . . . . . . . . . . . . . . . . . 19
2.10.1 Improved Seed Varieties . . . . . . . . . . . . . . . . . . . . . . . . . . . . . . . . . . 212.10.2 Purchased Seeds and Young Plants . . . . . . . . . . . . . . . . . . . . . . . . . . 222.10.3 Fertilizer . . . . . . . . . . . . . . . . . . . . . . . . . . . . . . . . . . . . . . . . . . . . . . . 252.10.4 Insecticides . . . . . . . . . . . . . . . . . . . . . . . . . . . . . . . . . . . . . . . . . . . . . 28
2.11 Output Marketing Characteristics: Major Crops . . . . . . . . . . . . . . . . . . . . . . 31
3. FINDINGS AND CONCLUSIONS . . . . . . . . . . . . . . . . . . . . . . . . . . . . . . . . . . . . . . . . . 323.1 Creating a Baseline of General Producer-Level Statistics . . . . . . . . . . . . . . . 32
3.1.1 Input Use and Expenditures . . . . . . . . . . . . . . . . . . . . . . . . . . . . . . . . 323.1.2 Yield Data . . . . . . . . . . . . . . . . . . . . . . . . . . . . . . . . . . . . . . . . . . . . . 333.1.3 Output, Revenues and Marketing . . . . . . . . . . . . . . . . . . . . . . . . . . . . 34
3.2 Estimating Elasticities from Profit Functions for Use in a Multi-Market Model. . . . . . . . . . . . . . . . . . . . . . . . . . . . . . . . . . . . . . . . . . . . . . . . . . . . . . . . . . . . 34
3.3 Generating Total Factor Productivity and Input-Output Estimates . . . . . . . . 353.3.1 Total Factor Productivity . . . . . . . . . . . . . . . . . . . . . . . . . . . . . . . . . . 353.3.2 Input-Output Coefficients for the EASM . . . . . . . . . . . . . . . . . . . . . . 35
REFERENCES . . . . . . . . . . . . . . . . . . . . . . . . . . . . . . . . . . . . . . . . . . . . . . . . . . . . . . . . . . . 37
ANNEX . . . . . . . . . . . . . . . . . . . . . . . . . . . . . . . . . . . . . . . . . . . . . . . . . . . . . . . . . . . . . . . . . 38

ii
LIST OF TABLES
Table 2.1: Crops Produced by Farmers (Frequency Counts) . . . . . . . . . . . . . . . . . . . . . . . . . . 3Table 2.2: Berseem Production, Sales and Farm Prices, All Households . . . . . . . . . . . . . . . . 4Table 2.3: Berseem Production, Sales and Price Data, Selling Households Only . . . . . . . . . . 4Table 2.4: Raw Household-Level Production Data
. . . . . . . . . . . . . . . . . . . . . . . . . . . . . . . . . . . . . . . . . . . . . . . . . . . . . . . . . . . . . . . . . . . 5Table 2.5: Raw Household-Level Sales Data . . . . . . . . . . . . . . . . . . . . . . . . . . . . . . . . . . . . . 6Table 2.6: Percent of Crop Production Sold by Selling Households . . . . . . . . . . . . . . . . . . . . 7Table 2.7: Percent of Producing Households Selling Each Crop, and Mean Quantity Sold . . 7Table 2.8: PSU-Level Price Data, all Crops . . . . . . . . . . . . . . . . . . . . . . . . . . . . . . . . . . . . . . 9Table 2.9: Illustration of Sparseness of Producer Price Data Across PSUs . . . . . . . . . . . . . . 10Table 2.10: Average Land Area Allocated to Primary Crops, All Farms, . . . . . . . . . . . . . . . 12Table 2.11: Land Productivity Data, Primary Crops . . . . . . . . . . . . . . . . . . . . . . . . . . . . . . . 13Table 2.12: Seed Expenditures per Household . . . . . . . . . . . . . . . . . . . . . . . . . . . . . . . . . . . 13Table 2.13: Fertilizer Expenditures per Household . . . . . . . . . . . . . . . . . . . . . . . . . . . . . . . . 13Table 2.14: Insecticide Expenditures per Household . . . . . . . . . . . . . . . . . . . . . . . . . . . . . . . 13Table 2.15: Expenditures on Casual Labor per Household, by Season . . . . . . . . . . . . . . . . . 14Table 2.16: Expenditures on Permanent Workers per Household, . . . . . . . . . . . . . . . . . . . . 14Table 2.17: Household Seed Expenditures, by Crop . . . . . . . . . . . . . . . . . . . . . . . . . . . . . . . 15Table 2.18: Household Fertilizer Expenditures, by Crop . . . . . . . . . . . . . . . . . . . . . . . . . . . 16Table 2.19: Household Insecticide Expenditures, by Crop . . . . . . . . . . . . . . . . . . . . . . . . . . 17Table 2.20: Household Expenditures on Hired Labor, By Task and Season . . . . . . . . . . . . . 18Table 2.21: Household Labor Allocated to Different Tasks, in Mandays, by Season . . . . . . 18Table 2.22: Miscellaneous Agricultural Expenditures and Revenues . . . . . . . . . . . . . . . . . . 19Table 2.23: Value and Number of Pieces of Equipment Owned by Farmers . . . . . . . . . . . . 20Table 2.24: Miscellaneous Household-Level Financial Statistics . . . . . . . . . . . . . . . . . . . . . 20Table 2.25: Productivity of Farm Households: Four different definitions . . . . . . . . . . . . . . . 21Table 2-26: Crop by Use of Improved Seed Variety, by Crop . . . . . . . . . . . . . . . . . . . . . . . . 21Table 2.27: Purchased Seeds/Young Plants Last Agric. Year, by Crop . . . . . . . . . . . . . . . . 22Table 2.28: Where Were Purchased Seed/Young Plants Obtained, by Crop . . . . . . . . . . . . . 22Table 2.29: Obtain Seeds/Young Plants on Credit, by Crop . . . . . . . . . . . . . . . . . . . . . . . . . 23Table 2.30: Source of Credit for Seeds/Young Plants, by Crop . . . . . . . . . . . . . . . . . . . . . . 23Table 2.31: Obtained Seeds/Young Plants Needed, by Crop . . . . . . . . . . . . . . . . . . . . . . . . . 24Table 2.32: Why Not Obtain Needed Seeds/Young Plants, by Crop . . . . . . . . . . . . . . . . . . 24Table 2.33: Purchased Fertilizers Last Agricultural Year, by Crop . . . . . . . . . . . . . . . . . . . . 25Table 2.34: Source of Fertilizer, by Crop . . . . . . . . . . . . . . . . . . . . . . . . . . . . . . . . . . . . . . . 25Table 2.35: Purchase Fertilizer on Credit, by Crop . . . . . . . . . . . . . . . . . . . . . . . . . . . . . . . . 26Table 2.36: Source of Credit, by crop . . . . . . . . . . . . . . . . . . . . . . . . . . . . . . . . . . . . . . . . . . 26Table 2.37: Obtained Fertilizers Needed, by Crop . . . . . . . . . . . . . . . . . . . . . . . . . . . . . . . . 27Table 2.38: Why Not Obtain Needed Fertilizer, by Crop . . . . . . . . . . . . . . . . . . . . . . . . . . . 27Table 2.39: Purchased Insecticides Last Agricultural Year, by Crop . . . . . . . . . . . . . . . . . . 28Table 2.40: Where Were Insecticides Obtained, by Crop . . . . . . . . . . . . . . . . . . . . . . . . . . . 28Table 2.41: Insecticides Obtained on Credit, by Crop . . . . . . . . . . . . . . . . . . . . . . . . . . . . . . 29Table 2.42: Source of Credit, by Crop . . . . . . . . . . . . . . . . . . . . . . . . . . . . . . . . . . . . . . . . . . 29Table 2.43: Obtained Insecticides Needed, by Crop . . . . . . . . . . . . . . . . . . . . . . . . . . . . . . . 30

iii
Table 2.44: Why Not Obtain Needed Insecticide, by Crop . . . . . . . . . . . . . . . . . . . . . . . . . . 30Table 2.45: Person It Was Sold to, by Crop . . . . . . . . . . . . . . . . . . . . . . . . . . . . . . . . . . . . . . 31Table 2.46: Where It Was Sold, by Crop . . . . . . . . . . . . . . . . . . . . . . . . . . . . . . . . . . . . . . . . 31Table 3.1: Household Expenditures on Selected Inputs, by Major Crop . . . . . . . . . . . . . . . . 32Table 3.2: Expenditures on Various Inputs . . . . . . . . . . . . . . . . . . . . . . . . . . . . . . . . . . . . . . 33Table 3.3: Descriptive Statistics for Yields of Major Crops . . . . . . . . . . . . . . . . . . . . . . . . . 33Table 3.4: Total Factor Productivity of Farms, by Farm Size, 1995-96 . . . . . . . . . . . . . . . . 35

EXECUTIVE SUMMARY
This executive summary provides recommendations about the usefulness for MVE of theproducer component of MALR/FSR’s Egypt Integrated Household Survey data inconstructing a pre-APRP baseline estimate of farmer behavior and characteristics. Therecommendations pertain to the following three specific questions:
C To what extent can the EIHS results be used by MVE to create a baseline of generaldescriptive farm-level statistics covering the pre-APRP period?
C Is it possible to estimate econometrically the elasticities needed to construct theproducer core component of a Multi-Market Model, which would in turn be used forcomprehensive impact assessment purposes?
C Can the EIHS data be used to conduct total factor productivity analyses and tocalculate input-output coefficients for use in the EASM?
Each of these questions is answered in turn below.
Descriptive Statistics. The EIHS results provide useful general descriptive statistics aboutfarmers’ characteristics and their behavior under pre-Reform conditions. These generalstatistics include purchased input use and expenditure patterns by household or crop (forpurchased seeds or young plants, fertilizer and insecticides), and input marketingcharacteristics including where the inputs were bought; whether they were obtained on creditand, if so, from which source; and whether the desired (“needed”) quantity of input wasobtained and, if not, why not. Identifying sources of inputs and use of credit is important forpre- and post-Reform comparison purposes. Since most farmers reported that they hadreceived the “desired” quantity of inputs, the EIHS results will be less useful for identifyingpre-Reform constraints to expanded use of purchased inputs (the most common constraintlisted for fertilizer and insecticide was “input was not available,” followed by “no money”and “no credit”). Data are also available on mandays of family and non-family labor used bytask, but not by crop.
On the output side, useful baseline data include crop mix grown (land allocation), quantitiesproduced of different crops, yields per feddan, and crop sales. The latter variable can becalculated both in terms of the percent of producers selling the various crops, and the quantitysold (either in total or as a percent of output). Information is available on where and to whomeach major crop was sold. This is valuable for monitoring changes in the relative importanceof different market participants as the reform progresses. In addition, the total value of salesand total quantity sold of the different crops are available. From this a producer (farm-gate)price or unit value can be calculated for the crops. However, price data are not available forall Primary Sampling Units (PSUs) for all crops, because transactions did not occur in allPSUs.
Preliminary analyses reveal that producer price data can be used together with thecommunity-level retail price data to construct rudimentary marketing margins for variouscommodities in different regions of Egypt. These include producer prices (average of 0.74LE/kg) vs. consumer prices of rice (average of 1.40 LE/kg); producer prices of wheat (0.70

v
LE/kg) vs. prices of 72% wheat flour (1.41 LE/kg); or the producer price of fava beans andthe retail price of a processed dish such as ful.
In addition, the producer data from the EIHS provide useful descriptive information onmiscellaneous agricultural expenditures and revenues of farmers, ownership of agriculturalequipment and various farm financial statistics, including total revenues, costs and profits. Although it is important to recognize the limitations of any field survey, this information canprovide qualitative indications about changes in the economic well-being and wealthpositions of farmers over time. Furthermore, this information can be used to monitorqualitative changes in the distribution of assets (such as land), farm income and productivityamong farm families.
Supply Elasticities. Attempts to estimate supply elasticities of major crops for use in aMulti-Market Model have so far met with little success. To a large extent this is due to thelimited variation inherent in cross-sectional price data, and the fact that producer prices aresimply not observed in a number of regions of Egypt (PSUs) because of a lack oftransactions. In the case of maize and sorghum, the sparsity of price data appears to be in partdue to specialization: regions which grow maize tend not to grow sorghum and vice versa,and zero sales (and production) of rice were reported in numerous PSUs (185-224). In thiscontext, prices from the community-level questionnaire are not useful because they are moreproperly treated as retail prices incorporating trader, transportation and processing margins,and not as farm-gate prices.
The limitations of cross-sectional price data in regression analyses are well-recognized in theliterature, and efforts have been made to more fully exploit the information (variability)contained in farm-level data sets. A method proposed by Angus Deaton for estimatingdemand elasticities exploits the fact that survey data are usually collected in clusters.Different households in a cluster have access to the same market where, in principle, auniform price prevails at a given point in time. In the EIHS, PSUs represent such clusters,and Deaton’s method could conceivably be applied to estimate improved supply elasticitiesfrom the EIHS producer data. It is also recognized in the literature (e.g., Sadoulet and deJanvry, p. 67) that an accurate accounting of household-level transaction costs will lead togreater variability in actual prices received than that captured in recorded market prices.
MVE should consider exploring the use of these alternative and relatively new methods toobtain improved supply elasticity estimates from the EIHS data set. Such an effort could takeup to ten days, or more. Of course, there is no guarantee that the resulting estimates would besuperior to earlier estimates, but a small chance nevertheless exists.
A few other unexplored possibilities remain for estimating producer supply elasticities fromthe EIHS. One option is to merge maize and sorghum and treat them as homogenouscommodities. On the survey instrument, crop code 03 is listed as “Maize” while code 04 islisted as “Maize (Sorgho),” so it is not clear how the enumerators distinguished between thetwo crops. Merging these crops would reduce some of the multi-collinearity among prices inthe estimation of a profit function. Another option is to restrict the estimation to those PSU’swhere a full complement of producer prices is available (for each of the major crops). Thiswould more accurately capture producer responsiveness to the competing opportunities
vi
offered by the complete set of major crops. For example, institutional or other barriers mayexist to growing specific crops in certain regions (PSUs), so that it would be unrealistic tospecify a Multi-Market Model containing all crop choices (i.e., non-zero elasticities) for thoseregions. A third consideration is that household fixed factors such as educational attainmentof the head have not yet been incorporated into the regressions. Last, in view of the abovecomment about household-specific transaction costs, survey information revealing where andto whom the crop was sold needs to be taken into consideration in estimating a profitfunction.
To address the important question of farmer efficiency, MVE should also consider estimatinga cost function using the producer data. For the pre-Reform era, a behavioral assumption ofcost-minimization as opposed to profit maximization is not unrealistic. From this costfunction it would, under certain assumptions, also be possible to recover parameters of theproduction function available to farmers. This option requires that reasonable input price dataare available from the community questionnaire. It should be stressed once more that none ofthese options is guaranteed to produce results that can be used by MVE, but another 10-20days of effort spent on the data along these lines (including Deaton’s method and theintroduction of transaction costs) at least has the potential to yield useful results or provideadditional insights into farmer behavior that would not be obvious from descriptive summarystatistics.
Total Factor Productivity Estimates. Total factor productivity estimates were obtainedfrom the EIHS data. They were calculated both for the average farm and for farms stratifiedby the amount of land cultivated. These are average productivity measures, reflecting thecontribution of each input used in production to the value of total farm output. Productivityestimates for the pre-Reform period provide a useful baseline against which correspondingestimates can be compared at a future date.
Data for labor and equipment use are not broken out by crop, and only expenditures onpurchased inputs (and not quantities) are available. Consequently, results of the EIHS are notuseful for constructing detailed input-output coefficients for different crops and inputs thatcould be used in the EASM.

1The 1997 Egypt Integrated Household Survey (EIHS) was undertaken by the International Food Policy
Research Institute in collaboration with the United States Agency for International Development (USAID ), the
Ministry of Agriculture and Land Reclamation of the Government of Egypt and the Ministry of Trade and
Supply of the Government of Egypt. The EIHS survey was funded under USAID Grant No. 263-G-00-96-
00030-00.
1. INTRODUCTION
Data from the producer component of MALR/FSR’s 1997 Egypt Integrated HouseholdSurvey1 of 556 farmers were analyzed during the months of May-July, 1998 with the goals of:
C determining to what extent the survey results could be used by MVE to create abaseline of general descriptive farmer-level statistics covering the pre-APRP period(ca. 1996-97);
C estimating econometrically the elasticities needed for the producer core component ofa Multi-Market Model which MVE may develop for comprehensive impactassessment purposes; and
C assessing the EIHS data for their potential usefulness in conducting total factorproductivity analyses, as well as in providing input and output data that can be used inthe Egypt Agricultural Sector Model (EASM).
To meet these three goals, all input and output variables had to be aggregated first from thesub-household level–i.e., crop, plot, family member, equipment or task level–to thehousehold level. In addition, variables such as land and labor hiring had to be aggregatedover four growing seasons of winter, summer, Nili and annual (for perennial crops). Use ofthe data sets also required converting the diverse units of measures used in Egypt for weightsand area into kilograms and feddans. Subsequently, the different component files had to bemerged at the household level.
The amount of crop detail reported here and in Annex 1 depends on the variable beinganalyzed; in some cases information is presented on all 39 crops grown (e.g., output inkilograms); in other cases, information is provided only for the major crops of rice, wheat,maize, sorghum, fava beans, sugarcane, winter and summer vegetables, cotton and clover(e.g., yields in kilograms per feddan). All SPSS syntax files used in this assessment areattached as Annex 2 of this document.

2
2. ANALYSIS OF DATA
2.1 Frequency Counts for Crops Grown by Farmers Surveyed
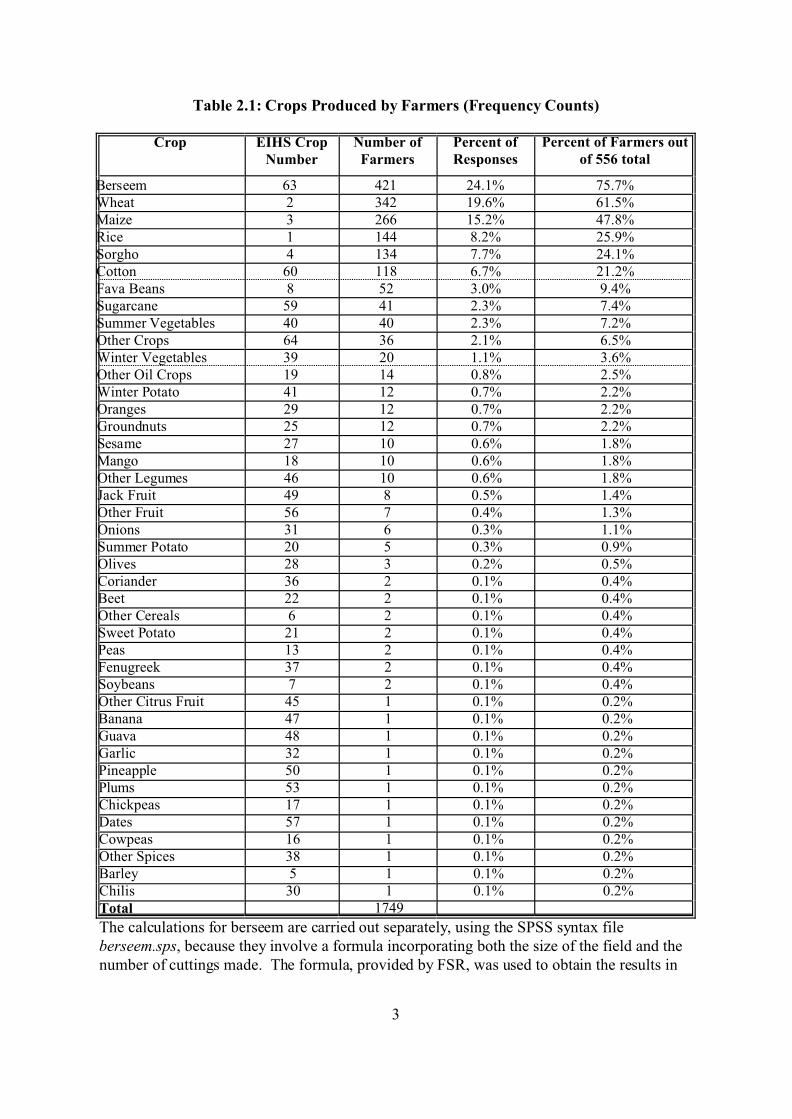
The following table shows the distribution of crops grown by farmers surveyed in the 1997round of the Egypt Integrated Household Surveys. This represents a snapshot of the averagecrop mix grown by the “typical” farmer that year.
Berseem is the most widely-grown crop (by three out of four farmers), followed by wheat(61%) and maize (48% of all farmers). Rice was grown by one out of four farmers in thesurvey year. In the remainder of this paper, crops grown by at least 10% of the farmers arereferred to as “major crops,” while crops grown by fewer than 3% of the farmers are definedas “minor” crops. The remaining crops (fava beans, sugarcane and summer/wintervegetables), together with “major crops,” are referred to as “primary” crops.
Results in Table 2.1 are based on a frequency count of the variable pn (crop number) fromdata file s12b*.sav. In some cases, production of a given crop was recorded more than oncefor the same household. Specifically, in households 13519, 19016 and 19020 berseemproduction is recorded twice; in households 12713, 19515 and 21008 wheat production isrecorded twice; in household 12713 maize production is recorded twice and in household19515 it is recorded three times; in household 17113 rice production is recorded twice.
The frequency counts in Table 2.1 are corrected for multiple product entries for crops up toand including “Other Oil Crops.” The number 556 represents the unique number ofhousehold ID codes encountered for those respondents reporting that they had “cultivated anyland” (variable s12bq01).
2.2 Raw Household-Level Production and Sales Data, All Crops
Tables 2.2 and 2.3 contain the production and sales of each crop, in kilograms, averagedacross all farm households surveyed; berseem production and sales are calculated separately,and reported below (Tables 2.2 and 2.3). The SPSS syntax file Conv2kg2.sps is used togenerate Tables 2 and 3. Since the break variable in the aggregation step is the household IDcode (hid), and the aggregation function used is a summation, the household level data files(e.g., prodn1hh.sav) contain the total of each crop produced within a household, even if thesame crop appears more than once in a given household.
Rates of conversion of the different crops from non-metric units (ardeb, dariba, etc.) wereobtained from the FSR Unit, and are based on information contained in Ministry ofAgriculture and Land Reclamation, SEA Agricultural Statistics Abstract, Fifth Issue,November 1997, and CAPMAS, Statistical Yearbook, June 1997.
3
Table 2.1: Crops Produced by Farmers (Frequency Counts)
Crop EIHS CropNumber
Number ofFarmers
Percent ofResponses
Percent of Farmers outof 556 total
Berseem 63 421 24.1% 75.7%Wheat 2 342 19.6% 61.5%Maize 3 266 15.2% 47.8%Rice 1 144 8.2% 25.9%Sorgho 4 134 7.7% 24.1%Cotton 60 118 6.7% 21.2%Fava Beans 8 52 3.0% 9.4%Sugarcane 59 41 2.3% 7.4%Summer Vegetables 40 40 2.3% 7.2%Other Crops 64 36 2.1% 6.5%Winter Vegetables 39 20 1.1% 3.6%Other Oil Crops 19 14 0.8% 2.5%Winter Potato 41 12 0.7% 2.2%Oranges 29 12 0.7% 2.2%Groundnuts 25 12 0.7% 2.2%Sesame 27 10 0.6% 1.8%Mango 18 10 0.6% 1.8%Other Legumes 46 10 0.6% 1.8%Jack Fruit 49 8 0.5% 1.4%Other Fruit 56 7 0.4% 1.3%Onions 31 6 0.3% 1.1%Summer Potato 20 5 0.3% 0.9%Olives 28 3 0.2% 0.5%Coriander 36 2 0.1% 0.4%Beet 22 2 0.1% 0.4%Other Cereals 6 2 0.1% 0.4%Sweet Potato 21 2 0.1% 0.4%Peas 13 2 0.1% 0.4%Fenugreek 37 2 0.1% 0.4%Soybeans 7 2 0.1% 0.4%Other Citrus Fruit 45 1 0.1% 0.2%Banana 47 1 0.1% 0.2%Guava 48 1 0.1% 0.2%Garlic 32 1 0.1% 0.2%Pineapple 50 1 0.1% 0.2%Plums 53 1 0.1% 0.2%Chickpeas 17 1 0.1% 0.2%Dates 57 1 0.1% 0.2%Cowpeas 16 1 0.1% 0.2%Other Spices 38 1 0.1% 0.2%Barley 5 1 0.1% 0.2%Chilis 30 1 0.1% 0.2%Total 1749
The calculations for berseem are carried out separately, using the SPSS syntax fileberseem.sps, because they involve a formula incorporating both the size of the field and thenumber of cuttings made. The formula, provided by FSR, was used to obtain the results in

4
Tables 2.2 and 2.3 below. Berseem sales are calculated separately as the percent ofproduction sold, multiplied by the quantity produced (in kilograms).
Table 2.2: Berseem Production, Sales and Farm Prices, All Households
N Minimum Maximum Mean Std. Deviation Production (kgs) 565 0 206625 14964.02 21274.0 Percent sold (%) 256 .00 10.00 .51 .78 Price (LE/kilogram) 166 .00 .76 7.90E-02 .1005
Table 2.3: Berseem Production, Sales and Price Data, Selling Households Only
N Minimum Maximum Mean Std. Deviation Production (kgs) 165 1188 206625 24469.6 25733.8 Percent sold (%) 165 .03 10.00 .77 .85 Value of sales (LE) 165 60.00 6000.00 884.6 850.5 Price (LE/kilogram) 165 .01 .76 7.95E-02 .1006 The formula for calculating berseem production is as follows (obtained from Dr. Bahloul of FSR):
(((9.5mt/fd/24qt/fd)*1000kg/mt)*(x fd/cut*24qt/fd))*y cuts = output in kgs,
where mt=metric tons, fd=feddan, kg=kilograms, x=area cultivated in feddans, cut=number of cuttings of
berseem (hasha), and y=the number of cuts. The number of cuts is calculated by dividing the value of variable
s12bq04b (interpreted as the number of cuts multiplied by the area in quirat) for crop number 63 (berseem) and
unit of quantity harvested code 15 (quirat/hasha) by the total area cultivated to berseem (in quirat), which is
calculated from the landholding data file (s12a1mv2.sav). The figure 9.5 mt/fd per cutting is an Egypt-wide
estimate for berseem production. In principle, berseem is cut between 1 and 5 times per year.
Tables 2.6 and 2.7 provide additional details about crop sales, for the subsets of householdsselling the crop indicated. Table 2.6 shows the average percent of production (measured inkilograms) of each crop sold. This percentage ranges from a low value of 53.1% for rice tohigh values of 97.2% each for cotton and sugar.
Table 2.7 shows the percent of the producers of the different crops who have sold all or partof their output of each crop. Clover is the crop that is the least likely to be sold by producers.Also shown is the average amount of each crop sold, measured in kilograms.

Table 2.4: Raw Household-Level Production Data(kg)
CropN Minimum Maximum Mean Std. Deviation
RICE 555 .00 70875 1063.7 4127.9 WHEAT 555 .00 22500 985.5 1687.4 MAIZE 555 .00 13860 711.3 1382.3 SORGO 555 .00 21000 346.7 1232.1 BARLEY 555 .00 360 .650 15.3 SOYBEANS 555 .00 750 2.1 36.1 FAVA BEANS 555 .00 9300 120.9 648.4 PEAS 555 .00 0 .0000 .0000 COWPEAS 555 .00 410 .740 17.4 CHICKPEAS 555 .00 225 .405 9.55 OTHER LEGUMES 555 .00 2000 12.3 136.6 Winter POTATO 555 .00 30000 160.4 1688.0 Summer POTATO 555 .00 18500 47.2 803.7 Sweet POTATO 555 .00 4000 8.3 171.6 BEETS 555 .00 60000 178.4 3035.1 GROUNDNUT 555 .00 10875 66.4 706.6 SESAME 555 .00 480 4.8 38.6 OLIVE 555 .00 1000 2.9 46.1 OTHER OILS 555 .00 3000 24.0 205.5 CHILIES 555 .00 2000 3.6 84.9 ONIONS 555 .00 11000 48.7 655.0 GARLIC 555 .00 3000 5.4 127.3 CORIANDER 555 .00 10000 34.2 570.6 FENUGREEK 555 .00 116 .349 5.93 OTHER SPICE 555 .00 500 .901 21.2 Winter VEGETABLE 555 .00 12000 131.6 1012.0 Summer VEGETABLE 555 .00 3500 60.9 353.9 ORANGE 555 .00 15000 55.9 717.3 MANGO 555 .00 2000 12.7 131.5 BANANA 555 .00 2500 4.5 106.1 GUAVA 555 .00 0 .0000 .0000 JACKFRUIT 555 .00 7000 50.5 535.0 PLUMS 555 .00 300 .541 12.7 OTHER FRUIT 555 .00 4600 20.1 245.7 DATES 555 .00 250 .45 10.6 SUGARCANE 555 .00 150000 2458.6 12655.2 COTTON 555 .00 6300 198.6 569.6 CLOVER 555 .00 48000 101.2 2054.5 OTHER CROP 555 .00 4000 19.8 243.6 Note: This and the following tables were generated with the SPSS job CONV2kg2.sps
Includes all households, regardless of whether they grow the crop listed.

6
Table 2.5: Raw Household-Level Sales Data(kg)Crop N Minimum Maximum Mean Std. Deviation RICE 555 .00 32000.00 438.70 1873.57 WHEAT 555 .00 22500.00 463.20 1368.20 MAIZE 555 .00 8820.00 280.50 793.03 SORGHO 555 .00 9800.00 154.25 669.03 BARLEY 555 .00 .00 0.00 0.00 SOYBEANS 555 .00 750.00 2.07 36.05 FAVA BEANS 555 .00 9300.00 106.82 608.34 PEAS 555 .00 .00 0.00 0.00 COWPEA 555 .00 400.00 0.72 16.98 CHICKPEAS 555 .00 225.00 0.41 9.55 OTHER LEGUME 555 .00 2000.00 12.25 136.23 Winter POTATO 555 .00 24000.00 127.03 1267.69 Summer POTATO 555 .00 18500.00 45.95 801.71 Sweet POTATO 555 .00 4000.00 8.11 171.07 BEETS 555 .00 60000.00 178.38 3035.10 GROUNDNUT 555 .00 10875.00 66.28 706.53 SESAME 555 .00 480.00 4.11 35.50 OLIVE 555 .00 250.00 1.15 16.11 OTHER OILS 555 .00 3000.00 22.16 190.58 CHILIES 555 .00 1900.00 3.42 80.65 ONIONS 555 .00 18000.00 60.36 881.24 GARLIC 555 .00 3000.00 5.41 127.34 CORIANDER 555 .00 10000.00 34.23 570.56 FENUGREEK 555 .00 116.25 0.35 5.93 OTHER SPICES 555 .00 250.00 0.45 10.61 Winter VEGETABLE 555 .00 12000.00 120.88 935.80 Summer VEGETABLE 555 .00 3500.00 56.14 341.48 ORANGE 555 .00 15000.00 54.59 714.64 MANGO 555 .00 1750.00 9.28 101.21 BANANA 555 .00 2500.00 4.50 106.12 GUAVA 555 .00 .00 0.00 0.00 JACKFRUIT 555 .00 7000.00 45.05 487.89 PLUMS 555 .00 300.00 0.54 12.73 OTHER FRUIT 555 .00 1150.00 5.23 62.15 DATES 555 .00 .00 0.00 0.00 SUGARCANE 555 .00 150000.00 2445.95 12560.10 COTTON 555 .00 6300.00 182.61 550.86 CLOVER 555 .00 131.25 0.34 6.08 OTHER CROP 555 .00 4000.00 21.12 245.85 Includes all households, regardless of whether they produced or sold the crop listed.

7
Table 2.6: Percent of Crop Production Sold by Selling Households*
Crop N Minimum MaximumMean(%)
Std. Deviation
RICE 103 .05 1.00 0.531 0.225 WHEAT 195 .07 1.67 0.593 0.239 MAIZE 129 .07 1.00 0.616 0.266 SORGHO 76 .20 1.11 0.684 0.221 FAVA BEANS 45 .40 1.00 0.881 0.151 Winter VEGETABLES 15 .50 1.00 0.920 0.173 Summer VEGETABLES 27 .10 1.00 0.896 0.226 SUGAR 39 .50 2.00 0.972 0.228 COTTON 113 .33 1.00 0.972 0.118 CLOVER 167 .03 1.20 0.686 0.276 *Includes percentages in excess of 100% which may represent sales out of
carry-over stocks, or re-sales of products purchased from other farmers.
The percentage for berseem (clover) was tr immed to below 200%.
Table 2.7: Percent of Producing Households Selling Each Crop, and Mean QuantitySold
(kg)
Crop Producers
selling (% of total)
N Minimum MaximumMean kgssold per
household
StandardDeviation
RICE 72.2% 104 200 32000 2341 3793 WHEAT 57.3% 196 150 22500 1312 2049 MAIZE 48.5% 129 140 8820 1207 1263 SORGHO 56.7% 76 140 9800 1126 1482 FAVA BEANS 86.5% 45 194 9300 1318 1740 Winter VEGETABLES 75.0% 15 200 12000 4473 3715 Summer VEGETABLES 67.5% 27 40 3500 1154 1081 SUGAR 97.6% 40 5000 150000 33938 33835 COTTON 95.8% 113 79 6300 897 924 CLOVER 39.2% 165 792 118750 15547 17547
2.3 Raw PSU-Level Price Data, All Crops
2.3.1 Producer-Level Prices (averaged at the PSU-Level)
Table 2.8 contains prices for crops in LE/kilogram at the level of Primary Sampling Units(berseem prices are calculated separately, see above). These prices are calculated from theproduction data file (s12b*), which also contains information on quantities sold as well as thevalue of the sale. Sales may have occurred at the farm-gate, at a market, or elsewhere.Table 2.9 reports producer prices of major crops for each PSU in which they are available. This illustrates the relative sparsity of farm-level price data in many regions of Egypt.
8
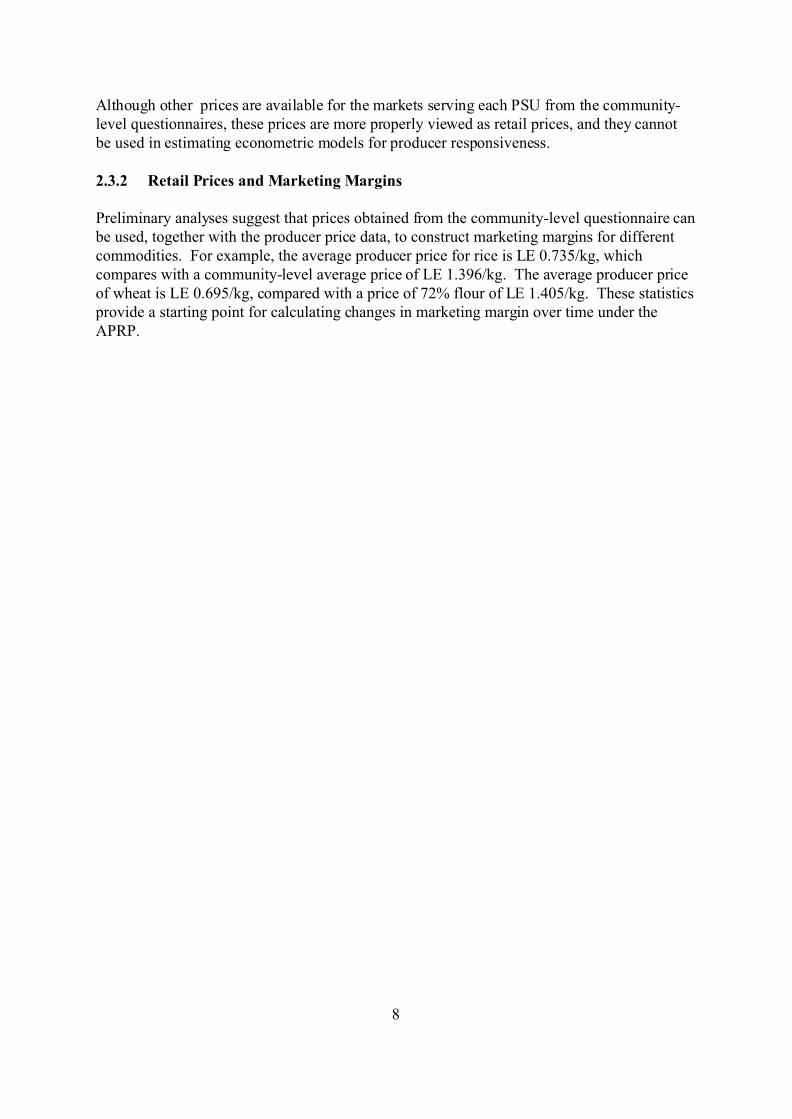
Although other prices are available for the markets serving each PSU from the community-level questionnaires, these prices are more properly viewed as retail prices, and they cannotbe used in estimating econometric models for producer responsiveness.
2.3.2 Retail Prices and Marketing Margins
Preliminary analyses suggest that prices obtained from the community-level questionnaire canbe used, together with the producer price data, to construct marketing margins for differentcommodities. For example, the average producer price for rice is LE 0.735/kg, whichcompares with a community-level average price of LE 1.396/kg. The average producer priceof wheat is LE 0.695/kg, compared with a price of 72% flour of LE 1.405/kg. These statisticsprovide a starting point for calculating changes in marketing margin over time under theAPRP.

9
Table 2.8: PSU-Level Price Data, all Crops(LE/kilogram)
Crop N Minimum MaximumMean price
in LE/kgStandardDeviation
RICE 24 .40 .85 0.735 0.095 WHEAT 56 .57 1.00 0.696 0.102 MAIZE 41 .39 .98 0.695 0.130 SORGHO 27 .57 1.29 0.796 0.167 BARLEY 0 SOYBEANS 2 .87 .88 0.871 0.006 FAVA BEANS 19 .52 1.50 1.128 0.297 PEAS 0 COWPEAS 1 2.50 2.50 2.500 . CHICKPEAS 1 1.56 1.56 1.556 . OTHER LEGUME 4 .55 350.00 88.338 174.443 Winter POTATO 5 .29 .67 0.481 0.132 Summer POTATO 2 .28 .60 0.438 0.230 Sweet POTATO 2 .35 .80 0.575 0.318 BEETS 1 .08 .08 0.083 . GROUNDNUT 6 1.00 1.67 1.323 0.230 SESAME 8 1.58 3.33 2.629 0.511 OLIVES 1 1.40 1.40 1.400 . OTHER OILS 5 .60 1.05 0.930 0.186 CHILIES 1 1.00 1.00 1.000 . ONIONS 3 .20 .25 0.218 0.032 GARLIC 1 .10 .10 0.100 . CORIANDER 2 .12 .18 0.150 0.042 FENUGREEK 2 1.03 1.03 1.032 0.000 OTHER SPICES 1 2.00 2.00 2.000 . Winter VEGETABLE 10 .12 1.00 0.502 0.305 Summer VEGETABLE 13 .33 10.00 2.355 2.913 ORANGE 3 .30 .73 0.512 0.214 MANGO 2 2.25 2.50 2.375 0.177 BANANA 1 .90 .90 0.900 . GUAVA 0 JACK FRUIT 1 .75 .75 0.745 . PLUMS 1 .75 .75 0.750 . OTHER FRUITS 1 1.40 1.40 1.400 . DATES 0 SUGARCANE 9 .05 .10 0.086 0.019 COTTON 37 2.33 3.84 3.041 0.319 CLOVER 1 2.24 2.24 2.241 . OTHER CROPS 4 .90 6.25 2.444 2.546

10
Table 2.9: Illustration of Sparseness of Producer Price Data Across PSUs(LE/Kilogram)
PSU RICE WHEAT MAIZE SORGO COTTON BERSEEM
121 0.79 0.58
123 0.80 0.63
125 0.72 0.65 3.17 0.03
127 0.65 0.58 0.57 3.17
129 0.69 0.57 0.61 3.09
130 0.72 0.62 1.29 3.17 0.07
131 0.78 0.69 0.64
132 0.80 0.65 0.62
133 0.74 0.04
134 0.80 0.67 0.71 0.00
135 0.67 0.71 3.37 0.08
136 0.77 0.64 3.17 0.02
137 0.69 0.67
138 0.82 0.64 0.71 3.33 0.03
139 0.78 0.75 0.98 3.37 0.04
141
146 0.60 0.67 0.05
147 0.75 0.67 0.19
150 0.79 0.63 0.74 3.17 0.05
151 0.63 0.73 0.05
152 0.67
153 3.17 0.05
154 0.79 0.61 3.11 0.05
155 0.61 0.73 0.05
158 0.40 0.62 0.66 2.54 0.05
159 3.17
160 0.60 0.57 3.05 0.04
161 0.67 0.39 3.17 0.06
162 0.17
163 0.64 0.70 3.16
164 0.62 0.47 0.63
165 3.17
167 0.78
168 0.77 0.63 0.57 0.67 0.05
169 0.03
170 0.79 0.67 0.50 3.65 0.04
171 0.85 0.67 0.57 0.64 3.84 0.04
172 0.67 1.14

PSU RICE WHEAT MAIZE SORGO COTTON BERSEEM
11
177
182 1.00 0.06
184
185 0.06
186 0.83 0.06
187 0.64 0.06
188 0.66 0.71 3.00 0.04
189 0.60 0.86 0.05
190 0.60 0.78 2.69 0.02
191 0.71 0.71 3.06 0.07
192 0.76 0.75 3.37 0.06
193 0.64 0.68 0.72 3.38 0.05
194 0.70 0.67 0.89 3.27 0.06
195 0.67 0.06
197 0.67 0.57
198 0.67 0.62 0.06
199 0.62 0.55 2.79 0.05
200 0.59 0.58 2.33 0.05
201 0.75 0.60
202 0.68 0.66 0.59 0.06
203 0.67 0.61 0.06
204 1.00 0.71 2.95 0.08
205 0.70 0.73 2.86
206 0.90 0.73 0.75 2.79
207 1.00 0.86 2.86
208 0.05
209 0.69 0.71 2.79 0.05
210 0.79 2.67 0.04
211 0.82 0.80 0.85 2.54 0.07
212 0.73 0.77 2.62 0.07
213 0.70 0.71 2.73 0.11
214 0.71 0.81 0.89 0.10
215 0.86 2.73 0.08
216 0.81 0.93 0.92 0.08
220 1.00 0.95 0.86 0.06
221
222 0.69 0.71 0.71 0.13
223 0.92 0.96 0.96 0.07
224 0.78 0.71 0.71 0.11
226

12
2.4 Average Land Area Allocated to Primary Crops, All Farms
Table 2.10 shows the average allocation of land to different crops by the typical farmer in thesurvey year. The SPSS syntax filed used to generate this table is cropland.sps.
Table 2.10: Average Land Area Allocated to Primary Crops, All Farms,(Feddans)
Crop N Minimum MaximumMean
feddans/hhStd. Deviation
RICE 564 .00 23.50 0.43 1.56 WHEAT 564 .00 20.00 0.88 1.90 MAIZE 564 .00 20.00 0.55 1.35 SORGHO 564 .00 18.04 0.37 1.31 FAVA BEANS 564 .00 21.50 0.22 1.54 SUGAR 564 .00 6.00 0.09 0.43 Winter VEGETABLE 564 .00 72.25 0.23 3.21 Summer VEGETABLE 564 .00 18.04 0.12 0.87 COTTON 564 .00 20.00 0.40 1.56 CLOVER 564 .00 24.08 1.12 2.55
2.5 Productivity Data for Primary Crops: Crop Yields
Land productivity measures are reported in Table 2.11 in the form of kilograms per feddan. Outliers were removed before the mean yield was calculated, using the following cut-offrules. At the lower end of the frequency table (i.e., for small numbers), a value was dropped ifit was 60% or less of the following (next higher) value. For example, in the case of wheat,the four lowest values were 66.5, 74.7, 87.5 and 150 kgs per feddan. 87.5 is 58% of 150, sovalues below 150 were dropped before the mean was calculated. At the upper end of thedistribution, a value was dropped if it exceeded the preceding value by at least 50%. Forexample, in the case of wheat production, the three largest values were 4,680, 10,800 and11,700 kgs/feddan. In this case, the two largest values were trimmed from the distribution toarrive at the mean reported in Table 2.11. The maximum number of values dropped for anycrop from either end of the distribution is three.
Results in Table 2.11 are based on merged production and area files, which were generated inother SPSS jobs. The SPSS syntax file used to generate this table (except for the median andstandard error) is yield.sps. This file contains the statements used for cleaning the yield dataand also contains code for generating means for each crop that have not been trimmed. Missing values in the production data file were filled in using the yield data (for example, incases where a positive amount was reported for production of a crop but no correspondingland value was reported).

13
Table 2.11: Land Productivity Data, Primary Crops(kgs/feddan)
Crop NMinimu
mMaximu
m
Median yield in
kilogram/feddan
Mean yield in
kilogram/feddan
Std.Deviation
StandardError
RICE 135 630.0 7,200.0 2,580 2,537.7 1,184.6 102.0WHEAT 331 150.0 4,680.0 1,440 1,525.2 781.4 43.0MAIZE 235 280.0 5,040.0 1,400 1,603.3 831.3 54.2SORGHO 129 373.3 6,720.0 1,344 1,476.6 848.9 74.7FAVA BEANS 47 155.0 2,380.8 839 899.3 475.5 69.4SUGARCANE 37 11,000.0 50,000.0 35,143 34,533.6 10,304.5 1,694.0Winter VEGETABLE 11 714.3 6,000.0 1,630 2,379.4 1,788.4 539.2SummerVEGETABLE
26 133.3 5,333.3 600 1,302.9 1,427.6 280.0
COTTON 116 236.3 2,362.5 787 804.0 345.8 32.1CLOVER 398 659.7 91,200.0 19,000 22,036.1 14,658.0 732.9Note: these are trimmed means (see text).
2.6 Input Expenditures
Table 2.12 through 2.16 show average total expenditures per household on various purchasedinputs. Only households actually reporting purchases of the input are included in thecalculation. Tables 2.17 through 2.19 show expenditures on the various inputs by crop, whileTables 2.20 and 2.21 report data on hired labor use by task.
2.6.1 Expenditures per Household
Table 2.12: Seed Expenditures per HouseholdLE
N Minimum Maximum Mean Std. Deviation SEEDPLXP 517 5.00 4930.00 218.2572 403.3356 Valid N 517
Table 2.13: Fertilizer Expenditures per HouseholdLE
N Minimum Maximum Mean Std. Deviation FERTILXP 535 7.50 7280.00 351.4400 501.7353 Valid N 535
Table 2.14: Insecticide Expenditures per HouseholdLE
N Minimum Maximum Mean Std. Deviation INSECTXP 324 1.00 4345.00 171.5868 340.2984 Valid N 324

14
Table 2.15: Expenditures on Casual Labor per Household, by SeasonLE
N Minimum Maximum Mean Std. Deviation WINTERLX 373 .00 1169.00 107.6930 146.5413 SUMMERLX 373 .00 3480.00 155.3043 299.8458 PERENLX 373 .00 840.00 30.2869 102.1190 NiliLX 373 .00 480.00 7.7265 45.2707 Total 373 .00 3740.00 301.0107 403.4988 Valid N 373
Table 2.16: Expenditures on Permanent Workers per Household,LE
N Minimum Maximum Mean Std. Deviation Expenditure 9 .00 23860.00 3820.8889 7619.7012 Number 13 1.00 20.00 2.7692 5.2465 LE/worker 9 .00 2400.00 1076.1111 834.4801 Valid N 9
15
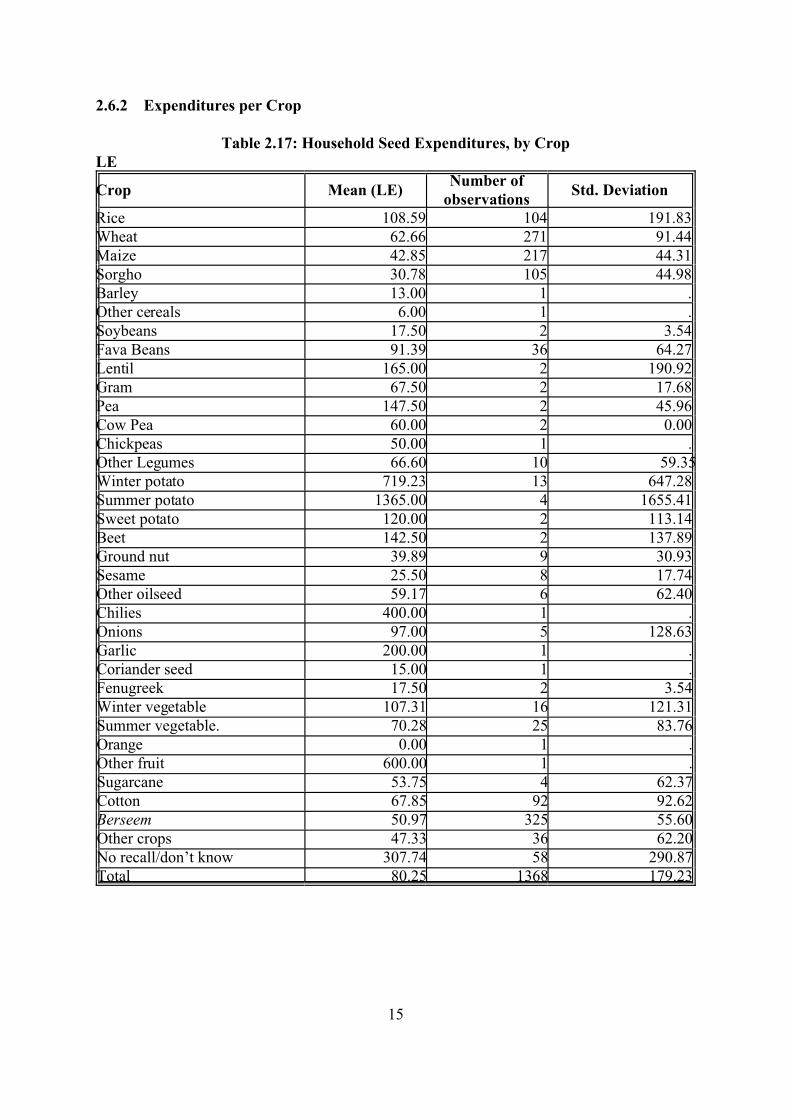
2.6.2 Expenditures per Crop
Table 2.17: Household Seed Expenditures, by CropLE
Crop Mean (LE)Number of
observationsStd. Deviation
Rice 108.59 104 191.83 Wheat 62.66 271 91.44 Maize 42.85 217 44.31 Sorgho 30.78 105 44.98 Barley 13.00 1 . Other cereals 6.00 1 . Soybeans 17.50 2 3.54 Fava Beans 91.39 36 64.27 Lentil 165.00 2 190.92 Gram 67.50 2 17.68 Pea 147.50 2 45.96 Cow Pea 60.00 2 0.00 Chickpeas 50.00 1 . Other Legumes 66.60 10 59.35Winter potato 719.23 13 647.28 Summer potato 1365.00 4 1655.41 Sweet potato 120.00 2 113.14 Beet 142.50 2 137.89 Ground nut 39.89 9 30.93 Sesame 25.50 8 17.74 Other oilseed 59.17 6 62.40 Chilies 400.00 1 . Onions 97.00 5 128.63 Garlic 200.00 1 . Coriander seed 15.00 1 . Fenugreek 17.50 2 3.54 Winter vegetable 107.31 16 121.31 Summer vegetable. 70.28 25 83.76 Orange 0.00 1 . Other fruit 600.00 1 . Sugarcane 53.75 4 62.37 Cotton 67.85 92 92.62 Berseem 50.97 325 55.60 Other crops 47.33 36 62.20 No recall/don’t know 307.74 58 290.87 Total 80.25 1368 179.23

16
Table 2.18: Household Fertilizer Expenditures, by CropLE
Crop Mean (LE)Number of
observationsStd. Deviation
Rice 109.45 90 88.54 Wheat 91.65 207 106.76 Maize 116.62 169 100.25 Sorgho 114.37 79 115.08 Barley 21.00 1 . Other cereals 30.00 2 21.21 Soybeans 50.50 2 6.36 Fava Beans 79.02 30 89.62 Lentil 26.00 1 . Gram 80.00 1 . Pea 200.00 1 . Cow Pea 69.00 2 55.15 Chickpeas 27.00 1 . Other Legumes 106.75 8 81.47 Winter potato 154.29 7 90.57 Summer potato 142.50 2 152.03 Sweet potato 60.00 2 42.43 Beet 637.50 2 654.07 Ground nut 68.17 6 43.94 Sesame 106.90 5 59.65 Other oilseed 72.75 4 97.14 Chilies 60.00 1 . Onions 183.00 2 250.32 Garlic 240.00 1 . Fenugreek 15.00 1 . Winter vegetable 141.42 12 108.98 Summer vegetable 149.79 14 178.90 Orange. 555.33 3 353.59 Mango 107.00 5 69.79 Banana 400.00 1 . Guava 30.00 1 . Jack fruit 248.00 5 186.60 Other fruit 76.67 3 98.66 Sugarcane 319.71 35 252.20 Cotton 125.22 65 183.63 Berseem 54.11 235 69.26 Other crops 224.43 14 514.32 No recall/don’t know 446.31 86 507.24 Total 133.44 1106 216.09

17
Table 2.19: Household Insecticide Expenditures, by CropLE
Crop Mean (LE)Number of
observationsStd. Deviation
Rice 79.77 73 163.50 Wheat 36.17 89 48.03 Maize 28.63 31 20.13 Sorgho 29.77 30 16.44 Other cereals 350.00 1 . Fava Beans 62.91 29 79.39 Gram 300.00 1 . Pea 15.00 1 . Cow Pea 20.00 1 . Chickpeas 20.00 1 . Other Legumes 80.78 9 61.10 Winter potato 42.50 6 28.94 Summer potato 236.67 3 317.86 Sweet potato 37.50 2 31.82 Beet 220.00 2 254.56 Ground nut 33.40 5 22.86 Sesame 30.00 2 0.00 Chilies 100.00 1 . Onions 95.00 2 35.36 Garlic 100.00 1 . Winter vegetable 138.29 7 99.10 Summer vegetable 74.71 17 76.66 Orange. 142.00 8 115.58 Other citrus 60.00 1 . Mango 110.00 4 77.89 Guava 85.00 1 . Jack fruit 623.75 8 519.61 Other fruit 30.00 1 . Cotton 158.80 82 223.31 Linen 70.00 1 . Berseem 62.38 21 118.45 Other crops 276.25 4 321.85 No recall/don’t know 222.65 57 351.66 Total 106.28 502 204.06
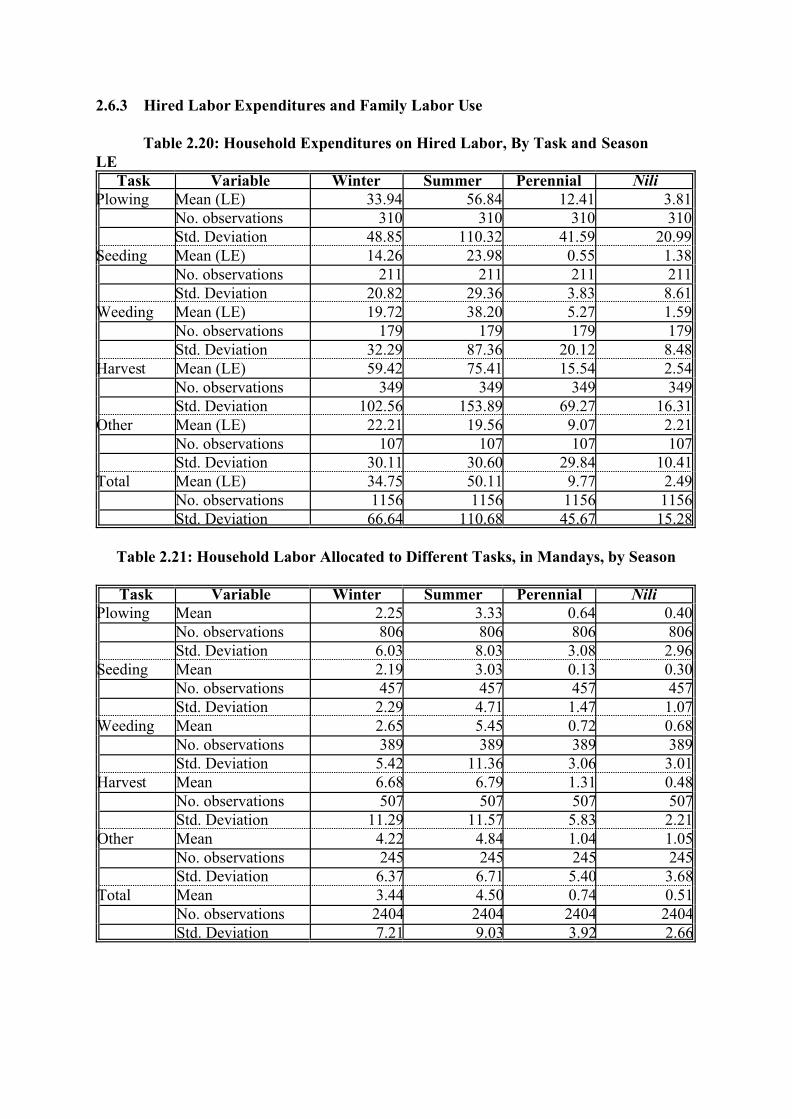
2.6.3 Hired Labor Expenditures and Family Labor Use
Table 2.20: Household Expenditures on Hired Labor, By Task and SeasonLE
Task Variable Winter Summer Perennial NiliPlowing Mean (LE) 33.94 56.84 12.41 3.81 No. observations 310 310 310 310 Std. Deviation 48.85 110.32 41.59 20.99 Seeding Mean (LE) 14.26 23.98 0.55 1.38 No. observations 211 211 211 211 Std. Deviation 20.82 29.36 3.83 8.61 Weeding Mean (LE) 19.72 38.20 5.27 1.59 No. observations 179 179 179 179 Std. Deviation 32.29 87.36 20.12 8.48 Harvest Mean (LE) 59.42 75.41 15.54 2.54 No. observations 349 349 349 349 Std. Deviation 102.56 153.89 69.27 16.31 Other Mean (LE) 22.21 19.56 9.07 2.21 No. observations 107 107 107 107 Std. Deviation 30.11 30.60 29.84 10.41 Total Mean (LE) 34.75 50.11 9.77 2.49 No. observations 1156 1156 1156 1156 Std. Deviation 66.64 110.68 45.67 15.28
Table 2.21: Household Labor Allocated to Different Tasks, in Mandays, by Season
Task Variable Winter Summer Perennial Nili Plowing Mean 2.25 3.33 0.64 0.40 No. observations 806 806 806 806 Std. Deviation 6.03 8.03 3.08 2.96 Seeding Mean 2.19 3.03 0.13 0.30 No. observations 457 457 457 457 Std. Deviation 2.29 4.71 1.47 1.07 Weeding Mean 2.65 5.45 0.72 0.68 No. observations 389 389 389 389 Std. Deviation 5.42 11.36 3.06 3.01 Harvest Mean 6.68 6.79 1.31 0.48 No. observations 507 507 507 507 Std. Deviation 11.29 11.57 5.83 2.21 Other Mean 4.22 4.84 1.04 1.05 No. observations 245 245 245 245 Std. Deviation 6.37 6.71 5.40 3.68 Total Mean 3.44 4.50 0.74 0.51 No. observations 2404 2404 2404 2404 Std. Deviation 7.21 9.03 3.92 2.66

19
2.7 Miscellaneous Agricultural Expenditures and Revenues
The EIHS also included questions relating to miscellaneous agricultural expenditures incurredand revenues received by farmers. These additional financial flows, not directly related toown-crop production, are reported in Table 2.22. The averages reported include allhouseholds, regardless of whether they actually received the revenue listed or incurred theexpense shown.
Table 2.22: Miscellaneous Agricultural Expenditures and RevenuesLEItem N Minimum Maximum Mean Std. Dev.Irrigation /Maintenance Char 564 0 4000 203.28 332.98 Transp cost of crops to market 564 .00 1800 27.02 113.25 Transp cost of inputs 564 0 200 7.14 17.52 Sacks & other cont cost 564 .00 1000 15.03 78.29 Storage Facility 564 0 50 0.18 2.59 Improvement on Land or Farm 564 .00 4000 16.55 183.63 Repair &Maintenance of Equip 564 0 4000 35.12 209.78 Draft Animal Rent 564 0 200 3.21 15.87 Tractor Rent 564 .00 1500 100.90 145.57 Thresher Rent 564 .00 1000 56.06 91.63 Rent of other Machinery 564 0 2000 8.30 88.59 Other Miscellaneous Expenditure 564 0 500 10.05 47.85 Sales of Crop By-Products 564 0 1520 85.98 195.85 Revenue from Draft Animal 564 0 750 1.77 32.73 Revenue from Tractor 564 0 10000 40.51 515.30 Revenue from Thresher 564 0 4500 11.01 194.59 Revenue from Other Machinery 564 0 3000 9.08 132.16 Revenue from Misc. Activities 564 0 3000 8.72 129.72
2.8 Ownership of Agricultural Implements
Table 2.23 shows both the average value of the implement listed by those owning theimplement, and the average number of pieces owned by households. Only households able toreport a value for the implement listed are included in the calculations.
2.9 Household Financial Statistics
Table 2.25 shows productivity measures calculated using different definitions of costsincurred by farmers.
2.10 Input Marketing Characteristics (for Major Crops)
Results of a qualitative analysis of input and output marketing data are reported in thissection. Data presented are frequency counts using cross-tabulations involving major cropsand various characteristics related to the inputs used in producing these crops.

20
These questions are of the following nature: First, did the farmer buy the input in question. Second, if so, where was it purchased? Third, was it obtained on credit, and fourth,
Table 2.23: Value and Number of Pieces of Equipment Owned by FarmersLEItem N Minimum Maximum Mean Std. Deviation Value of Implement in LE Tractor 14 3700.00 70000.00 26550.00 18947.41 Plow 27 50.00 1200.00 221.56 277.97 Cart 99 50.00 2800.00 378.28 336.84 Thresher 4 99.00 7500.00 5399.75 3541.69 Trolley 11 150.00 4500.00 2559.09 1532.45 Waterpump 153 99.00 12000.00 1306.84 1276.53 Generator 3 250.00 2000.00 841.67 1003.22 Storage Bin 14 .00 10000.00 2180.57 2961.83 Insecticide pump 29 6.00 3000.00 259.00 640.62 Number of pieces Tractor 16 .20 1.00 0.92 0.23 Plow 28 .20 2.00 1.01 0.25 Cart 99 .50 2.00 1.00 0.12 Thresher 4 1.00 1.00 1.00 0.00 Trolley 11 .20 1.00 0.93 0.24 Waterpump 153 .10 9.00 0.99 0.72 Generator 3 .10 1.00 0.43 0.49 Storage Bin 16 1.00 2.00 1.13 0.34 Insecticide pump 31 .50 2.00 1.00 0.22 Valid N (listwise) 0
Table 2.24: Miscellaneous Household-Level Financial StatisticsLE
N Minimum Maximum Mean Std. Dev.Feddans per hh 551 .08 28.00 1.77 3.00 Value of land/feddan 502 .00 219096.77 46333.27 28474.81 Value of land/hh 551 990.00 704000.00 65238.75 79837.20 Gross revenue (profit) 551 150.00 114409.27 5145.03 8610.75 Misc. ag. revenues 551 .00 23700.00 300.11 1551.63 Misc. ag. expenditures 551 .00 5400.00 417.38 572.62 All expenses 543 35.00 45565.00 1333.85 2436.04 Revenue per feddan 551 96.77 120960.00 3884.56 8530.84 Total revenue/hh 551 155.00 115059.27 5445.14 9331.78 Profits-1. definition* 543 -1060.71 114065.27 4127.87 8108.39 Family labor expenses 551 .00 3295.50 253.61 346.68 Cost of land 551 191.67 64400.00 4075.70 6908.18 Cost of capital 551 .00 14155.00 254.25 1204.75 Profits-2. definition* 543 -1060.71 113987.27 3873.68 8054.01 Valid N (listwise) 495 *See the definitions of profits and productivity used in the following table.

21
Table 2.25: Productivity of Farm Households: Four different definitions
Definition N Minimum Maximum Mean Std. Deviation PRODUCTX 546 .54 115.75 5.2021 7.7525 PRODUCTY 546 .50 107.33 3.9063 6.3163 PRODUCTZ 546 .04 34.12 1.1381 2.2024 PRODCTXX 546 .04 34.12 1.1159 2.2040 Valid N (listwise) 546 Definitions used:x=total revenue/(variable costs except for family labor)y=total revenue/(variable costs plus family labor)z=total revenue/(variable costs plus family labor plus land cost)xx=total revenue/(variable costs plus family labor plus land cost plus equipment) what was the source of the credit? Fifth, was the desired amount of the input obtained andsixth, if not, why not? For example, Table 2-28 presents answers to the question, “for each ofthe crops you produced (and for which you purchased the input listed), where was the inputspurchased”?
In Table 2-28, the column for “Coop” shows the number of times this sources was listed forpurchased seed or young plants for the different crops (e.g., 76 farmers responded receivingrice seed or young plants from a co-op, compared with 183 farmers in the case of wheat, and91 in the case of maize). Reading across each row shows the relative importance of thedifferent sources listed for seeds or young plants for the crop in question. For example,61.8% of the farmers buying seeds or young plants received them from a co-op, 4.9%received them from another farmer, 12.2% received them from a dealer, etc.
2.10.1 Improved Seed Varieties
Table 2-26: Crop by Use of Improved Seed Variety, by Crop
Use Improved Variety of Seeds? Total na No Yes
Crop Rice Count 26 119 145 % within 17.9% 82.1% 100.0% Wheat Count 99 246 345 % within 28.7% 71.3% 100.0% Maize Count 2 136 131 269 % within .7% 50.6% 48.7% 100.0% Sorgho Count 1 73 60 134 % within .7% 54.5% 44.8% 100.0% Cotton Count 18 100 118 % within 15.3% 84.7% 100.0% Berseem Count 2 350 72 424 % within .5% 82.5% 17.0% 100.0% Total Count 5 702 728 1435 % within .3% 48.9% 50.7% 100.0% n.a.=no answer/not applicable.

22
2.10.2 Purchased Seeds and Young Plants
Table 2.27: Purchased Seeds/Young Plants Last Agric. Year, by Crop
Prchs Seeds/Yng Plants LastAgricultural Year?
No* Yes TotalRice Count 15 129 129 % within Crop Number 100.0% 100.0% Wheat Count 27 315 315 % within Crop Number 100.0% 100.0% Maize Count 33 233 233 % within Crop Number 100.0% 100.0% Sorgho Count 3 131 131 % within Crop Number 100.0% 100.0% Cotton Count 3 115 115 % within Crop Number 100.0% 100.0% Berseem Count 50 371 371 % within Crop Number 100.0% 100.0% Total Count 1294 1294
% within Crop Number 100.0% 100.0% *calculated by subtracting the number answering “yes” from the total number of producers of each crop.
Table 2.28: Where Were Purchased Seed/Young Plants Obtained, by Crop
Where Were They Obtained? Total Crop Coop Farmers Dealer VlgBank Landlor
dOther
Rice Count 76 6 15 14 6 6 123 % within 61.8% 4.9% 12.2% 11.4% 4.9% 4.9% 100.0% Wheat Count 183 31 27 27 18 15 301 % within 60.8% 10.3% 9.0% 9.0% 6.0% 5.0% 100.0% Maize Count 91 35 59 6 21 19 231 % within 39.4% 15.2% 25.5% 2.6% 9.1% 8.2% 100.0% Sorgho Count 44 19 28 2 16 14 123 % within 35.8% 15.4% 22.8% 1.6% 13.0% 11.4% 100.0% Cotton Count 85 1 2 17 1 106 % within 80.2% .9% 1.9% 16.0% .9% 100.0% Berseem Count 35 87 204 1 25 6 358 % within 9.8% 24.3% 57.0% .3% 7.0% 1.7% 100.0% Total Count 514 179 335 67 87 60 1242 % within 41.4% 14.4% 27.0% 5.4% 7.0% 4.8% 100.0%

23
Table 2.29: Obtain Seeds/Young Plants on Credit, by Crop
Obtain Seeds/Young Plants onCredit?
Total
Crop Yes No Rice Count 18 107 125 % within 14.4% 85.6% 100.0% Wheat Count 51 259 310 % within 16.5% 83.5% 100.0% Maize Count 37 193 230 % within 16.1% 83.9% 100.0% Sorgho Count 10 121 131 % within 7.6% 92.4% 100.0% Cotton Count 27 87 114 % within 23.7% 76.3% 100.0% Berseem Count 50 315 365 % within 13.7% 86.3% 100.0% Total Count 193 1082 1275 % within 15.1% 84.9% 100.0%
Table 2.30: Source of Credit for Seeds/Young Plants, by Crop
Source of Credit? Total Crop Vlg bank Family Coop Dealers Landlord Rice Count 6 10 3 19 % within 31.6% 52.6% 15.8% 100.0% Wheat Count 15 29 6 1 51 % within 29.4% 56.9% 11.8% 2.0% 100.0% Maize Count 7 1 25 2 3 38 % within 18.4% 2.6% 65.8% 5.3% 7.9% 100.0% Sorgho Count 5 1 4 10 % within 50.0% 10.0% 40.0% 100.0% Cotton Count 9 18 1 28 % within 32.1% 64.3% 3.6% 100.0% Berseem Count 13 1 28 10 2 54 % within 24.1% 1.9% 51.9% 18.5% 3.7% 100.0% Total Count 55 2 111 26 6 200
% within 27.5% 1.0% 55.5% 13.0% 3.0% 100.0%

24
Table 2.31: Obtained Seeds/Young Plants Needed, by Crop
Crop Obtained Seeds/Young Plants Needed? Total Yes No
Rice Count 119 3 122 % within 97.5% 2.5% 100.0% Wheat Count 298 5 303 % within 98.3% 1.7% 100.0% Maize Count 223 2 225 % within 99.1% .9% 100.0% Sorgho Count 125 3 128 % within 97.7% 2.3% 100.0% Cotton Count 110 2 112 % within 98.2% 1.8% 100.0% Berseem Count 352 7 359 % within 98.1% 1.9% 100.0% Total Count 1227 22 1249 % within 98.2% 1.8% 100.0%
Table 2.32: Why Not Obtain Needed Seeds/Young Plants, by Crop
Crop Why Not Obtain NeededSeeds?
Total
“Other reason” Rice Count 1 1 % within 100.0% 100.0% Wheat Count 1 1 % within 100.0% 100.0% Cotton Count 2 2 % within 100.0% 100.0% Berseem Count 2 2 % within 100.0% 100.0% Total Count 6 6 % within 100.0% 100.0%

25
2.10.3 Fertilizer
Table 2.33: Purchased Fertilizers Last Agricultural Year, by Crop
Crop Purchased Fertilizers Last AgriculturalYear?
Total
Yes No* Rice Count 127 1 128 % within 99.2% .8% 100.0% Wheat Count 295 5 300 % within 98.3% 1.7% 100.0% Maize Count 229 1 230 % within 99.6% .4% 100.0% Sorgho Count 123 3 126 % within 97.6% 2.4% 100.0% Cotton Count 108 108 % within 100.0% 100.0% Berseem Count 337 3 340 % within 99.1% .9% 100.0% Total Count 1219 13 1232
% within 98.9% 1.1% 100.0% *This is incomplete; need to subtract “yes” response from the number growing each crop.
Table 2.34: Source of Fertilizer, by Crop
Where Was Fertilizer Obtained? Total Crop Coop Farmers Dealer Vlg
BankLandlor
dOther
Rice Count 59 37 23 2 121 % within 48.8% 30.6% 19.0% 1.7% 100.0% Wheat Count 138 87 50 2 277 % within 49.8% 31.4% 18.1% .7% 100.0% Maize Count 92 3 87 24 3 209 % within 44.0% 1.4% 41.6% 11.5% 1.4% 100.0% Sorgho Count 54 1 43 14 112 % within 48.2% .9% 38.4% 12.5% 100.0% Cotton Count 54 1 18 24 1 98 % within 55.1% 1.0% 18.4% 24.5% 1.0% 100.0% Berseem Count 118 4 140 30 4 1 297 % within 39.7% 1.3% 47.1% 10.1% 1.3% .3% 100.0% Total Count 515 9 412 165 12 1 1114 % within 46.2% .8% 37.0% 14.8% 1.1% .1% 100.0%
26
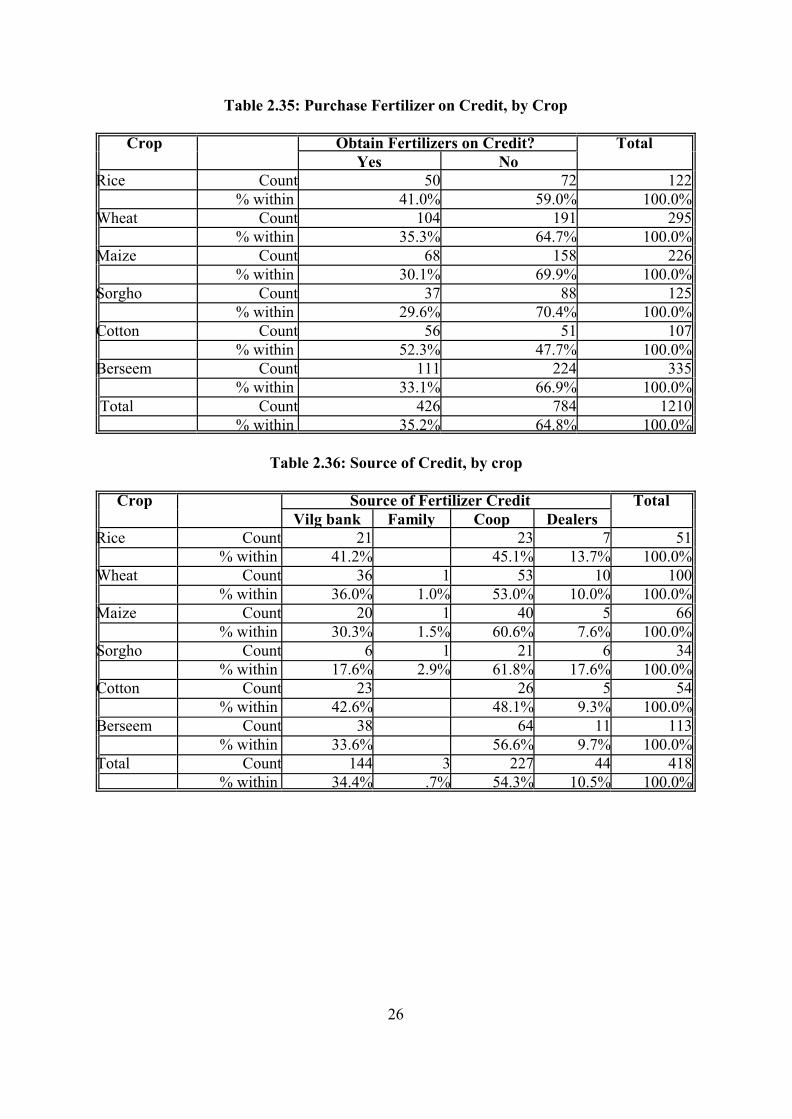
Table 2.35: Purchase Fertilizer on Credit, by Crop
Crop Obtain Fertilizers on Credit? Total Yes No
Rice Count 50 72 122 % within 41.0% 59.0% 100.0% Wheat Count 104 191 295 % within 35.3% 64.7% 100.0% Maize Count 68 158 226 % within 30.1% 69.9% 100.0% Sorgho Count 37 88 125 % within 29.6% 70.4% 100.0% Cotton Count 56 51 107 % within 52.3% 47.7% 100.0% Berseem Count 111 224 335 % within 33.1% 66.9% 100.0% Total Count 426 784 1210 % within 35.2% 64.8% 100.0%
Table 2.36: Source of Credit, by crop
Crop Source of Fertilizer Credit Total Vilg bank Family Coop Dealers
Rice Count 21 23 7 51 % within 41.2% 45.1% 13.7% 100.0% Wheat Count 36 1 53 10 100 % within 36.0% 1.0% 53.0% 10.0% 100.0% Maize Count 20 1 40 5 66 % within 30.3% 1.5% 60.6% 7.6% 100.0% Sorgho Count 6 1 21 6 34 % within 17.6% 2.9% 61.8% 17.6% 100.0% Cotton Count 23 26 5 54 % within 42.6% 48.1% 9.3% 100.0% Berseem Count 38 64 11 113 % within 33.6% 56.6% 9.7% 100.0% Total Count 144 3 227 44 418 % within 34.4% .7% 54.3% 10.5% 100.0%

27
Table 2.37: Obtained Fertilizers Needed, by Crop
Crop Obtained Fertilizers Needed? Total Yes No
Rice Count 117 3 120 % within 97.5% 2.5% 100.0% Wheat Count 282 11 293 % within 96.2% 3.8% 100.0% Maize Count 219 5 224 % within 97.8% 2.2% 100.0% Sorgho Count 117 8 125 % within 93.6% 6.4% 100.0% Cotton Count 103 3 106 % within 97.2% 2.8% 100.0% Berseem Count 320 11 331 % within 96.7% 3.3% 100.0% Total Count 1158 41 1199
% within 96.6% 3.4% 100.0%
Table 2.38: Why Not Obtain Needed Fertilizer, by Crop
Why Not Obtain Needed Fertilizer? Total Crop Not Avlbl No Money No Credit Other Rice Count 4 1 1 1 7 % within 57.1% 14.3% 14.3% 14.3% 100.0% Wheat Count 8 3 2 2 15 % within 53.3% 20.0% 13.3% 13.3% 100.0% Maize Count 4 1 2 1 8 % within 50.0% 12.5% 25.0% 12.5% 100.0% Sorgho Count 5 1 1 7 % within 71.4% 14.3% 14.3% 100.0% Cotton Count 5 1 1 7 % within 71.4% 14.3% 14.3% 100.0% Berseem Count 7 2 1 2 12 % within 58.3% 16.7% 8.3% 16.7% 100.0% Total Count 33 9 7 7 56 % within 58.9% 16.1% 12.5% 12.5% 100.0%

28
2.10.4 Insecticides
Table 2.39: Purchased Insecticides Last Agricultural Year, by Crop
Crop Purchased Insecticides Last AgriculturalYear?
Total
Yes No* Rice Count 91 1 92 % within 98.9% 1.1% 100.0% Wheat Count 112 2 114 % within 98.2% 1.8% 100.0% Maize Count 42 2 44 % within 95.5% 4.5% 100.0% Sorgho Count 45 45 % within 100.0% 100.0% Cotton Count 101 101 % within 100.0% 100.0% Berseem Count 41 2 43 % within 95.3% 4.7% 100.0% Total Count 432 7 439
% within 98.4% 1.6% 100.0% *Incomplete.
Table 2.40: Where Were Insecticides Obtained, by Crop
Where Were Insecticides Obtained? Total Crop Coop Farmers Dealer Vilg. Bank Landlord Rice Count 23 66 1 2 92 % within 25.0% 71.7% 1.1% 2.2% 100.0% Wheat Count 39 1 65 7 1 113 % within 34.5% .9% 57.5% 6.2% .9% 100.0% Maize Count 6 1 35 42 % within 14.3% 2.4% 83.3% 100.0% Sorgho Count 13 30 2 45 % within 28.9% 66.7% 4.4% 100.0% Cotton Count 50 42 8 1 101 % within 49.5% 41.6% 7.9% 1.0% 100.0% Berseem Count 5 28 33 % within 15.2% 84.8% 100.0% Total Count 136 2 266 18 4 426 % within 31.9% .5% 62.4% 4.2% .9% 100.0%

29
Table 2.41: Insecticides Obtained on Credit, by Crop
Crop Obtain Insecticides on Credit? Total Yes No
Rice Count 44 43 87 % within 50.6% 49.4% 100.0% Wheat Count 48 63 111 % within 43.2% 56.8% 100.0% Maize Count 11 32 43 % within 25.6% 74.4% 100.0% Sorgho Count 17 27 44 % within 38.6% 61.4% 100.0% Cotton Count 59 40 99 % within 59.6% 40.4% 100.0% Berseem Count 19 24 43 % within 44.2% 55.8% 100.0% Total Count 198 229 427
% within 46.4% 53.6% 100.0%
Table 2.42: Source of Credit, by Crop
Crop Source of Credit? Total Vlg bank Coop Dealers
Rice Count 6 15 25 46 % within 13.0% 32.6% 54.3% 100.0% Wheat Count 5 17 26 48 % within 10.4% 35.4% 54.2% 100.0% Maize Count 7 4 11 % within 63.6% 36.4% 100.0% Sorgho Count 1 2 14 17 % within 5.9% 11.8% 82.4% 100.0% Cotton Count 14 34 12 60 % within 23.3% 56.7% 20.0% 100.0% Berseem Count 1 3 16 20 % within 5.0% 15.0% 80.0% 100.0% Total Count 27 78 97 202
% within 13.4% 38.6% 48.0% 100.0%

30
Table 2.43: Obtained Insecticides Needed, by Crop
Crop Obtained Insecticides Needed? Total Yes No
Rice Count 85 3 88 % within 96.6% 3.4% 100.0% Wheat Count 108 4 112 % within 96.4% 3.6% 100.0% Maize Count 41 1 42 % within 97.6% 2.4% 100.0% Sorgho Count 43 2 45 % within 95.6% 4.4% 100.0% Cotton Count 95 4 99 % within 96.0% 4.0% 100.0% Berseem Count 41 1 42 % within 97.6% 2.4% 100.0% Tota Count 413 15 428
% within 96.5% 3.5% 100.0%
Table 2.44: Why Not Obtain Needed Insecticide, by Crop
Crop Why Not Obtain Needed Insecticide?
Total
Not Avlbl No Money No Credit Rice Count 2 2 % within 100.0% 100.0% Wheat Count 1 1 2 % within 50.0% 50.0% 100.0% Cotton Count 3 2 1 6 % within 50.0% 33.3% 16.7% 100.0% Total Count 6 3 1 10
% within 60.0% 30.0% 10.0% 100.0%

31
2.11 Output Marketing Characteristics: Major Crops
Table 2.45: Person It Was Sold to, by Crop
Who was it Sold to? Total Crop Not sold Farmers Gvrnment Other PrvtTrdr Rice Count 42 13 9 1 80 145 % within 29.0% 9.0% 6.2% .7% 55.2% 100.0% Wheat Count 151 19 24 2 149 345 % within 43.8% 5.5% 7.0% .6% 43.2% 100.0% Maize Count 136 38 3 3 89 269 % within 50.6% 14.1% 1.1% 1.1% 33.1% 100.0% Sorgho Count 58 3 1 72 134 % within 43.3% 2.2% .7% 53.7% 100.0% Cotton Count 5 1 105 1 6 118 % within 4.2% .8% 89.0% .8% 5.1% 100.0% Berseem Count 257 145 7 15 424 % within 60.6% 34.2% 1.7% 3.5% 100.0% Total Count 649 219 141 15 411 1435 % within 45.2% 15.3% 9.8% 1.0% 28.6% 100.0%
Table 2.46: Where It Was Sold, by Crop
Where was it Sold Total Crop na Farm Gvrnment Market Other
Rice Count 42 50 8 34 11 145 % within 29.0% 34.5% 5.5% 23.4% 7.6% 100.0% Wheat Count 151 70 21 84 19 345 % within 43.8% 20.3% 6.1% 24.3% 5.5% 100.0% Maize Count 138 50 3 66 12 269 % within 51.3% 18.6% 1.1% 24.5% 4.5% 100.0% Sorgho Count 58 25 46 5 134 % within 43.3% 18.7% 34.3% 3.7% 100.0% Cotton Count 6 6 100 3 3 118 % within 5.1% 5.1% 84.7% 2.5% 2.5% 100.0% Berseem Count 259 155 5 5 424 % within 61.1% 36.6% 1.2% 1.2% 100.0% Total Count 654 356 132 238 55 1435
% within 45.6% 24.8% 9.2% 16.6% 3.8% 100.0%

32
3. FINDINGS AND CONCLUSIONS
3.1 Creating a Baseline of General Producer-Level Statistics
3.1.1 Input Use and Expenditures
The EIHS contains information useful for establishing baselines for a number of variablesrelated to the use and marketing of inputs. This includes, by crop, whether or not animproved variety of seed was used, and household expenditures on seeds and young plants,fertilizer and insecticides. For the three latter variables, information is included on the sourceof the input (co-operative, farmer, trader, village bank, landlord or other), whether the inputswere purchased on credit, the source of the credit, whether the quantity of input desired wasobtained, and, if applicable, the reason why an insufficient quantity was obtained. Thisinformation can be compared with data collected in the post-Reform period to determine howbasic input market characteristics have changed over tine. Expenditures on these threepurchased inputs are presented by crop (Table 1) and aggregated to the household level(Table 2). Data are available on hiring of casual labor, by task, as well as hiring of permanentworkers. For casual labor this includes the payment per day per worker (in LE) as well as thenumber of man-days hired in each of the main seasons (winter, summer, Nili and forperennial crops).
Table 3.1: Household Expenditures on Selected Inputs, by Major Crop(LE)
CropSeed (LE)
Fertilizer (LE)
Insecticide(LE)
Rice 108.59 109.45 79.77Wheat 62.66 91.65 36.17Maize 42.85 116.62 28.63Sorgho 30.78 114.37 29.77Fava Beans 91.39 79.02 62.91Winter vegetable 107.31 141.42 138.29Summer vegetable. 70.28 149.72 74.71Cotton 67.85 125.22 158.80Berseem 50.97 54.11 62.38Source: Author’s calculations using EIHS data.Note: Hired labor allocations are available by task but not by crop.
Reasonably reliable estimates are also available for the value and number of agriculturalimplements owned by farmers (i.e., capital), and information on land use (including landrented out and in) is provided. After adding in data on family labor in man-days and otherexpenditures such as irrigation maintenance charges, marketing costs and custom work, andafter making assumptions about the annual opportunity cost of land, the rental rate of capitaland an opportunity cost for labor, total farm production expenses or costs are calculated foreach

33
Table 3.2: Expenditures on Various InputsLE/Household
Input Valid N Min. Max. Mean Std. Dev.Seed/Young plants 517 5 4930 218.26 403.34 Fertilizer 535 8 7280 351.44 501.74 Insecticide 324 1 4345 171.59 340.30 Casual Labor (total) 373 0 3740 301.01 403.50 Winter 373 0 1169 107.69 146.54 Summer 373 0 3480 155.30 299.85 Perennial 373 0 840 30.29 102.12 Nili 373 0 480 7.73 45.27 Permanent Workers 9 0 23860 3820.89 7619.70
Source: Author's calculations using EIHS data.
household (see Annex 1). Although the standard deviations associated with the various pointestimates (sample means) are large, they are within the range of what would be expected fromthis type of survey.
3.1.2 Yield Data
Relatively reasonable estimates of yield–a simple but common measure of productivity–werecalculated for each of the major crops surveyed in the EIHS. These yields can be used toestablish a pre-reform baseline. Again, the standard deviations for the point estimates arefairly large, but in an order of magnitude to be expected in this type of survey. In all casesexcept for summer vegetables the standard deviation is well below the sample mean; in anumber of cases it is less than one-half of the mean.
Table 3.3: Descriptive Statistics for Yields of Major Cropskg./Feddan
Crop N Minimum Maximum Mean Std. Error Std. Dev. Rice 135 630 7,200 2,538 102 1,185 Wheat 331 150 4,680 1,525 43 781 Maize 235 280 5,040 1,603 54 831 Sorghum 129 373 6,720 1,477 75 849 Fava Beans 47 155 2,381 899 69 475 Sugarcane 37 11,000 50,000 34,534 1,694 10,304 Winter vegetable 11 714 6,000 2,379 539 1,788 Summer vegetable 26 133 5,333 1,303 280 1,428 Cotton 116 236 2,363 804 32 346 Clover 400 660 91200 22036 733 14658 Source: Author’s calculations using EIHS; means are trimmed, as described in detail elsewhere.

34
3.1.3 Output, Revenues and Marketing
The EIHS data can be used to calculate the total value of crops produced by each farmhousehold, and the variability of the data is comparable to that of the input expenditure data. For each household, the value of production was estimated using either actual prices receivedby farmers for their products, or a PSU-level price estimate, or a national price estimate foreach crop. The revenue earned from the production of each crop (whether it was sold or not)was supplemented with miscellaneous agriculturally-related expenditures such as renting outof equipment or land to arrive at a gross revenue figure for each household. The pre-Reformbaseline data available from the EIHS include the number of farmers growing the differentcrops--i.e., the crop mix of the "average" farmer. This variable can be monitored over time todetermine how cropping patterns are changing in terms of land allocation decisions.
Data are available on the share of producing households participating in output markets foreach crop produced, and the percent of the quantity harvested that is sold. Information isavailable by major crop on the buyer of the product (farmers, government, private trader,other) and where the transaction took place. The farm-level transactions can be used toobtain a farm-gate price series which can be compared with market-level prices for thepurpose of constructing marketing margins. It is also possible to calculate the average pricereceived from each of the different buyers.
3.2 Estimating Elasticities from Profit Functions for Use in a Multi-Market Model
Numerous attempts were made to estimate a profit function by regressing farm profitsexclusive of fixed costs on prices of the six major crops and the fixed quantities of land andcapital. Prices were either those actually received by the household, or calculated PSU-levelprices, or average national prices, depending on the availability of the price. Functionalforms used included (1) a generalized Leontief, (2) a normalized quadratic and (3) a translogprofit function with appropriate restrictions; the latter could be fit only to data for the 95% ofhouseholds with a positive value for profit. No attempt has been made yet to estimate thesupply functions directly. The reason for this is that the estimation would be cumbersomesince virtually none of the households produce the entire complement of crops; thus all of thesupply functions would have a censored dependent variable.
Although some of the functions–especially the generalized Leontief–yielded reasonableparameter estimates when corrected for heteroscedasticity, none of the functions estimated todate has yielded supply elasticities which would be considered in the range of what is“normal”. A statistically significant test result for farm-level “profit inefficiency” wasobtained only in the case of the translog profit function, which despite the use of parameterrestrictions provided by economic theory suffered from having a large number of statisticallyinsignificant coefficients. For the other two functional forms, a preliminary test for profitinefficiency yielded residuals skewed in the wrong direction.
The adjusted R-square value for the translog profit function is a respectable 55.9%. To alarge extent the low significance levels of the estimated parameters for this function areexplained by the lack of independent variation in the price data (i.e., multi-collinearity). Thislack of variation is a direct consequence of the fact that national-level prices had to be used

35
frequently in the estimation since PSU-level prices for any given crop are available only incertain areas (from the producer data set), and household-level prices are available only inhouseholds selling output. Input prices were not included in this estimation activity becausethey have not yet been released by IFPRI.
Another consideration is that more realistic prices could be estimated for crops using villageclusters, unit prices and household characteristics which affect transaction costs. Includingother fixed factors in addition to land and capital, such as educational attainment of thehousehold head, may also improve the estimation of the profit function. Also, since inputprice data are available from the PSU-level questionnaire, the possibility of estimating a costfunction for farmers as an alternative to the profit function can be explored.
3.3 Generating Total Factor Productivity and Input-Output Estimates
3.3.1 Total Factor Productivity
Using the total revenue and cost data, an average total factor productivity was estimated foreach farm (Table 2). For the sample, and under the assumptions stated below, average TFP isestimated to be 1.116, so that each LE worth of inputs generates LE 1.116 worth of output--for an average annual rate of return of 11.6%. The smaller farms tend to have a higher totalfactor productivity than larger farmers. In fact, according to these estimates the medium-largeand large farmers are on average not covering all of their opportunity costs. As new databecome available at a later date, this productivity measure can be re-calculated using aDivisia index so that TFP levels can be compared through time.
Table 3.4: Total Factor Productivity of Farms, by Farm Size, 1995-96
Farms Size TFP
Farm Size (% of total) (feddan) Mean St. error
All farms 100.0 1.82 1.116 0.094
Small 42.8 0.47 1.234 0.165
Medium 30.8 1.27 1.100 0.200
Medium-large 20.9 2.66 0.973 0.037
Large 5.6 11.88 0.823 0.100Source: Calculated from EIHS data. Note: assumes family labor opportunity cost of LE 6.5 per man-day; a
rental rate of capital of 19% per annum; and a charge for land of LE 2,300 per feddan per year. TFP is
calculated as the sum of all farm revenues divided by the sum of all farm expenditures.
3.3.2 Input-Output Coefficients for the EASM
Using the EIHS producer data it is possible to calculate a crude productivity measure forindividual inputs such as seeds/young plants, fertilizer and insecticides in the form ofkilograms of output of different crops per LE of expenditure on the input. This is only an“average” productivity because the contribution of other factors of production (land, irrigationwater, capital, labor) is not accounted for. If one is, furthermore, willing to assume that the

36
PSU-level price of an input represents a realistic cost of the input to the farmer, thenestimates of quantities of inputs used could, in principle, be obtained.
Ideally, one would estimate individual production functions for each crop to measure theindependent and incremental contribution of each input to the production of any given crop. However, these production functions cannot be estimated directly for individual crops sincedata for labor and equipment use are not broken out by crop (in addition to the problem thatquantities applied would have to be deduced from PSU-level price data). One solution to thisconundrum is to allocate labor to different crops using fixed labor ratios per feddan and bycrop using data from experiment stations or other reports, but it is not clear that this willnecessarily lead to coefficients that are superior to those currently being used in the EASM. To summarize, farm profits or gross revenues can be expressed on a per feddan or per man-day of labor basis as a simple, single-factor productivity measure which does not take intoaccount the contribution of all the other inputs used in the production process (includingwater).

37
REFERENCES
Deaton, Angus. “Quality, Quantity, and Spatial Variation in Price,” American EconomicReview, vol. 78, No. 3, 1988, pp. 418-430.
Sadoulet, Elisabeth and Alain de Janvry. Quantitative Development Policy Analysis, TheJohn Hopkins University Press, Baltimore, 1995.

ANNEX
ANNOTATED SPSS SYNTAX FILES

A-1
TABLE OF CONTENTS
Overview . . . . . . . . . . . . . . . . . . . . . . . . . . . . . . . . . . . . . . . . . . . . . . . . . . . . . . . . . . . . . . . 2-2
1. Conv2kg2.sps: converts raw production/sales data to kilograms . . . . . . . . . . . . . . . . . . 2-5
2. Cropland.sps: calculates feddans allocated to major crops . . . . . . . . . . . . . . . . . . . . . 2-11
3. Berseem.sps: calculates berseem production/sales and price data . . . . . . . . . . . . . . . . 2-13
4. Yield.sps: calculates yield in kgs/feddan for major crops . . . . . . . . . . . . . . . . . . . . . . . 2-15
5. Profits2.sps: prepares production data for the purpose of calculating gross profits . . . 2-16
6. Inputs.sps: calculates input expenditures as the household level . . . . . . . . . . . . . . . . . 2-23
7. Inputs2.sps: calculates input expenditures by crop . . . . . . . . . . . . . . . . . . . . . . . . . . . . 2-31
8. Prfuprep.sps: prepares data for profit function and factor productivity analysis . . . . . 2-33
9. Prmkt.sps: provides various input/output marketing characteristics . . . . . . . . . . . . . . 2-36

A-2
OVERVIEW
The following SPSS syntax files work with the raw data files s12a1mv2.sav, s12b*.sav,and s12c*.sav, and from a sub-directory with the name “c:\ifpri6\”. The text can be saved as anASCII file and be run directly within SPSS. In order to ensure that all data files can be mergedproperly, it is necessary to convert the hid variable (household identifier) from a string to anumeric variable in those files where it is originally saved as a string. This needs to be donebefore running these syntax files (since they do not contain code for the required conversion).The conversion can be done by retrieving the file, using the /File /Open command, changing thevariable using /Data /Define Variable /Change Settings /Type to a numeric format, and thensaving the file again under /File Save using the same filename. The SPSS jobs should be run inthe following order to ensure that data files are available as they are needed by the syntax files:[3,1,2,4,5,6,7,8].
2. Conv2kg2.sps Converts raw production/sales data to kilograms.
Source file: c:\ifpri6\s12bnew2.sav (and brsmdata.sps).
The file converts crop production and sales data (except for berseem) from original unitsof weight to kilograms, using official (CAPMAS) conversion factors. After recoding missingvalues to zeros (indicating no production or sale of a particular crop) the crop production andsales data are then aggregated to the household level and saved as files prodn1hh.sav andsalen1hh.sav. The file also calculates prices per kilogram for each crop by dividing the valueof sales by the quantity sold (prices.sav). This file is aggregated to the PSU level and saved aspricepsu.sav. Detailed statistics are calculated for sales of the primary crops. Berseemproduction, sales and prices are calculated separately, as discussed below.
3. Cropland.sps Calculates feddans allocated to major crops.
Source file: c:\ifpri6\s12a1mv2.sav.
The file calculates the amount of land (using raw area data measured in quirat or feddans)allocated to each major crop (rice, wheat, maize, sorgo, favabeans, winter vegetables, summervegetables, sugarcane, cotton and berseem) in the different growing seasons, and aggregates thesenumbers to the household-level for the entire agricultural year in units of feddans. The resultingfile is crplndhh.sav. The file also calculates descriptive summary statistics for land allocatedto each major crop in feddan.
4. Berseem.sps Calculates berseem production data.
Source files: c:\ifpri6\s12bnew2.sav and s12a1mv2.sav.

A-3
This syntax file is designed to calculate total production of berseem at the household-levelin kilograms. Two source files are needed, with one providing information on the land areacultivated and the other containing information on the total amount of berseem harvested duringthe year, using multiple cuttings (hasha/quirat). The file also calculates kilograms of berseemsold: this is accomplished by dividing units of berseem sold by units of berseem produced andthen multiplying the resulting percentage by total production. Berseem prices are then calculatedby dividing the value of sales by the quantity sold. The resulting berseem data files arebrsmdata.sav and brsmonly.sav which is used to calculate berseem yields. The syntax filegenerates a number of warnings in the output window that are associated with divisions by zero;these can be ignored since missing production values are later recoded to zeros.
5. Yield.sps Calculates yield in kgs/feddan for major crops.
Source files: c:\ifpri6\prodn1hh.sav, crplndhh.sav and brsmonly.sav.Note: these two data files are created in previous SPSS jobs, which have to be run first.
This syntax file merges the production and land allocation data files for the major cropsto calculate yields in kgs/feddan. Trimmed means are also calculated for the yield data usingrules described in more detail in the preceding text. The data set produced is yielddat.sav.
6. Profits2.sav Prepares production data for the purpose of calculating gross profits.
Source files: c:\ifpri6\prodn1hh.sav, prices.sav and brprtmp3.sav (calculated here).
In the first steps of this syntax file, estimated production data are filled in for cases whereno unit weight conversion codes were available (in s12bnew2.sav and Conv2kg2.sps). Price dataare calculated for each household to attach a value or opportunity cost to the crops produced,regardless of whether the crop was sold. This is done in three steps: 1. The household’s ownsales price is used if one is available. 2. If no household-level price is used, the PSU-level priceis used. 3. If a PSU-level price is not available, the national average price for the crop in questionis used. Average prices within a commodity group (such as small grains) are used in cases whereno price is available for a crop (such as barley).
In subsequent steps, the output of each crop produced by the household is multiplied bythe price. The value of berseem production is merged in, and berseem prices are calculated inthe same manner as that described previously. These files are all merged together, and a grossprofit (revenue) from crop production activities is calculated. Corrections to gross profits aremade where supplemental information is available from the crop sales file (s12bnew2.sav.); forexample, in a number of cases, data are not available on the quantity sold (or the unit of thequantity), but a number is reported for the value of sales. This is used (with appropriate pro-rating according to the amount sold relative to the amount produced) to obtain a value of the cropproduced. The output from this syntax file is the data set profits3.sav.

A-4
7. Inputs.sps Calculates input expenditures at the household-level.
Source files: c:\ifpri6\s12c*.sav (*=1,2,3,4,5,6), s12dm.sav; s12em.sav.
This syntax file reads in the raw input expenditure files for purchases of seeds/youngplants, fertilizer, insecticides, casual labor and permanent workers, and aggregates theexpenditures to the household level. The five files are subsequently merged and missingexpenditures are recoded to zero. The resulting file is inpexp1.sav. In the following step, totalmandays of family labor in each of the four cropping periods (summer, winter, Nili andperennial) and for all agricultural tasks are calculated and then aggregated to the household-level(vlfamlab.sav). Miscellaneous agricultural revenues (varrev1.sav) and expenditures(varexp2.sav) are then calculated, and merged in along with the land use data set (landused.sav)covering all crops produced by the household.
8. Inputs2.sps Calculates input expenditures at the household-level by crop..
This syntax files works in a manner analogous to the previous syntax file. For familylabor, the number of mandays by task is calculated.
9. Prfuprep.sps Prepares data for profit function and factor productivity analysis
Source file: c:\ifpri6\profit1.sav, brprtmp2.sav and prointrm.sav.
This file sets up the variables needed for the regressions used to estimate the generalizedLeontief and normalized quadratic profit functions. The output file generated is profctn1.sav.
9. Prmkt.sps Provides various input/output marketing characteristics
Source files: c:\ifpri6\s12bnew2.sav, and s12c*.sav
This file prepares various cross tabs on input and output marketing characteristics forfarm households, using qualitative response data.

A-5
COMMENT filename is Conv2kg2.sps .
COMMENT This file converts weights to kilograms for production .COMMENT Data for berseem (code=63) are calculated separately .COMMENT Created June 10, 1998 . Verified July 9, 1998 .
GET FILE='c:\ifpri6\s12bnew2.sav'.EXECUTE .IF (pn = 1 & s12bq04a = 1) rice = s12bq04b * 1000 .IF (pn = 1 & s12bq04a = 3) rice = s12bq04b * 1 .IF (pn = 1 & s12bq04a = 11) rice = s12bq04b * 300 .IF (pn = 1 & s12bq04a = 13) rice = s12bq04b * 945 .IF (pn = 2 & s12bq04a = 11) wheat = s12bq04b * 150.IF (pn = 3 & s12bq04a = 11) maize = s12bq04b * 140 .IF (pn = 4 & s12bq04a = 1) sorgo = s12bq04b * 1000 .IF (pn = 4 & s12bq04a = 11) sorgo = s12bq04b * 140 .IF (pn = 5 & s12bq04a = 11) barley = s12bq04b * 120 .IF (pn = 7 & s12bq04a = 1) soybns = s12bq04b * 1000 .IF (pn = 8 & s12bq04a = 11) favbrd = s12bq04b * 155 .IF (pn = 13 & s12bq04a = 3) peas = s12bq04b * 1 .IF (pn = 16 & s12bq04a = 3) cowpea = s12bq04b * 1 .IF (pn = 17 & s12bq04a = 11) chkpea = s12bq04b * 150 .IF (pn = 18 & s12bq04a = 1) othleg = s12bq04b * 1000 .IF (pn = 18 & s12bq04a = 3) othleg = s12bq04b * 1 .IF (pn = 19 & s12bq04a = 1) wpotat = s12bq04b * 1000 .IF (pn = 20 & s12bq04a = 1) spotat = s12bq04b * 1000 .IF (pn = 21 & s12bq04a = 1) swtpot = s12bq04b * 1000 .IF (pn = 21 & s12bq04a = 3) swtpot = s12bq04b * 1 .IF (pn = 22 & s12bq04a = 1) beet = s12bq04b * 1000 .IF (pn = 25 & s12bq04a = 1) grndnt = s12bq04b * 1000 .IF (pn = 25 & s12bq04a = 11) grndnt = s12bq04b * 75 .IF (pn = 27 & s12bq04a = 11) sesame = s12bq04b * 120 .IF (pn = 28 & s12bq04a = 3) olive = s12bq04b * 1 .IF (pn = 29 & s12bq04a = 1) othoil = s12bq04b * 1000 .IF (pn = 30 & s12bq04a = 1) chilis = s12bq04b * 1000 .IF (pn = 31 & s12bq04a = 1) onions = s12bq04b * 1000 .IF (pn = 31 & s12bq04a = 11) onions = s12bq04b * 45 .IF (pn = 32 & s12bq04a = 1) garlic = s12bq04b * 1000 .IF (pn = 36 & s12bq04a = 1) corian = s12bq04b * 1000 .IF (pn = 37 & s12bq04a = 11) fenugk = s12bq04b * 155 .IF (pn = 38 & s12bq04a = 3) otspic = s12bq04b * 1 .IF (pn = 39 & s12bq04a = 1) wvgtbl = s12bq04b * 1000 .IF (pn = 39 & s12bq04a = 3) wvgtbl = s12bq04b .IF (pn = 40 & s12bq04a = 1) svgtbl = s12bq04b * 1000 .IF (pn = 40 & s12bq04a = 3) svgtbl = s12bq04b .IF (pn = 41 & s12bq04a = 1) orange = s12bq04b * 1000.IF (pn = 41 & s12bq04a = 3) orange = s12bq04b * 1.IF (pn = 46 & s12bq04a = 3) mango = s12bq04b * 1.IF (pn = 47 & s12bq04a = 1) banana = s12bq04b * 1000.IF (pn = 48 & s12bq04a = 3) guava = s12bq04b * 1.IF (pn = 49 & s12bq04a = 1) jackft = s12bq04b * 1000.IF (pn = 53 & s12bq04a = 3) plum = s12bq04b * 1.IF (pn = 56 & s12bq04a = 3) otfrut = s12bq04b * 1.IF (pn = 57 & s12bq04a = 3) dates = s12bq04b * 1.IF (pn = 59 & s12bq04a = 1) sugrcn = s12bq04b * 1000 .IF (pn = 60 & s12bq04a = 12) cotton = s12bq04b * 157.5 .IF (pn = 63 & s12bq04a = 1) clover = s12bq04b * 1000 .IF (pn = 63 & s12bq04a = 11) clover = s12bq04b * 175 .IF (pn = 64 & s12bq04a = 1) otcrop = s12bq04b * 1000 .IF (pn = 64 & s12bq04a = 3) otcrop = s12bq04b * 1 .EXECUTE . SAVE OUTFILE='c:\ifpri6\Prodnew2.sav'.
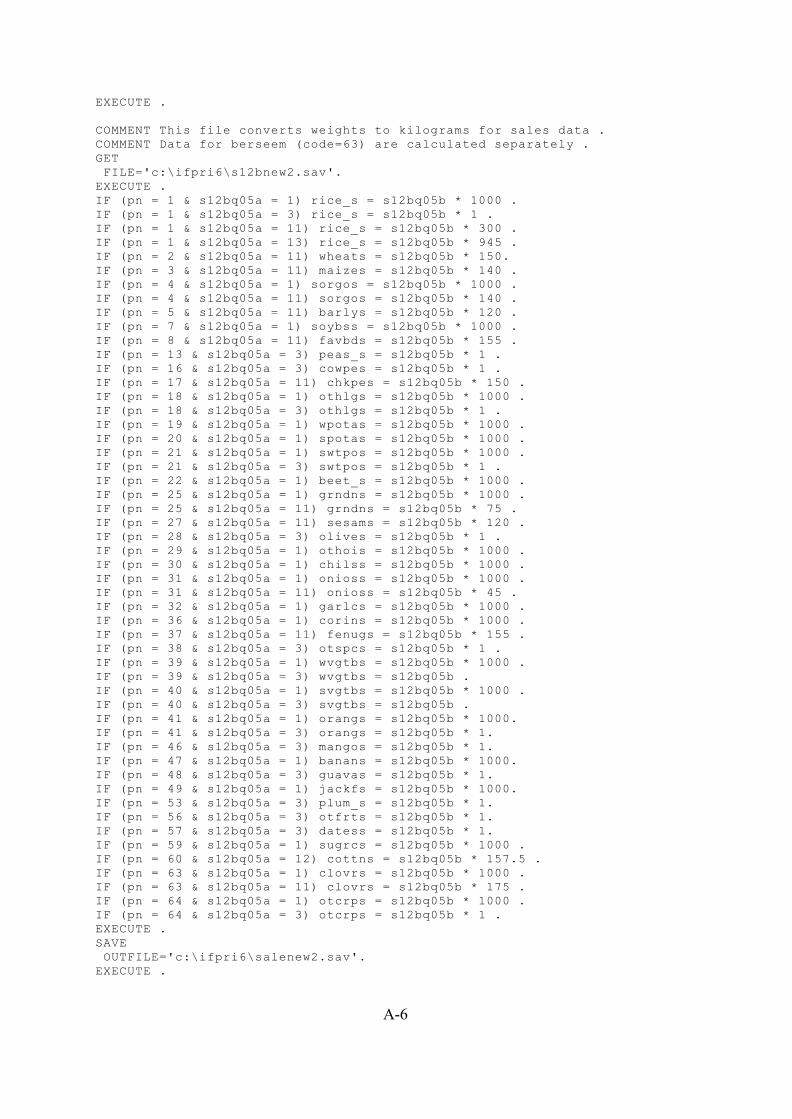
A-6
EXECUTE .
COMMENT This file converts weights to kilograms for sales data .COMMENT Data for berseem (code=63) are calculated separately .GET FILE='c:\ifpri6\s12bnew2.sav'.EXECUTE .IF (pn = 1 & s12bq05a = 1) rice_s = s12bq05b * 1000 .IF (pn = 1 & s12bq05a = 3) rice_s = s12bq05b * 1 .IF (pn = 1 & s12bq05a = 11) rice_s = s12bq05b * 300 .IF (pn = 1 & s12bq05a = 13) rice_s = s12bq05b * 945 .IF (pn = 2 & s12bq05a = 11) wheats = s12bq05b * 150.IF (pn = 3 & s12bq05a = 11) maizes = s12bq05b * 140 .IF (pn = 4 & s12bq05a = 1) sorgos = s12bq05b * 1000 .IF (pn = 4 & s12bq05a = 11) sorgos = s12bq05b * 140 .IF (pn = 5 & s12bq05a = 11) barlys = s12bq05b * 120 .IF (pn = 7 & s12bq05a = 1) soybss = s12bq05b * 1000 .IF (pn = 8 & s12bq05a = 11) favbds = s12bq05b * 155 .IF (pn = 13 & s12bq05a = 3) peas_s = s12bq05b * 1 .IF (pn = 16 & s12bq05a = 3) cowpes = s12bq05b * 1 .IF (pn = 17 & s12bq05a = 11) chkpes = s12bq05b * 150 .IF (pn = 18 & s12bq05a = 1) othlgs = s12bq05b * 1000 .IF (pn = 18 & s12bq05a = 3) othlgs = s12bq05b * 1 .IF (pn = 19 & s12bq05a = 1) wpotas = s12bq05b * 1000 .IF (pn = 20 & s12bq05a = 1) spotas = s12bq05b * 1000 .IF (pn = 21 & s12bq05a = 1) swtpos = s12bq05b * 1000 .IF (pn = 21 & s12bq05a = 3) swtpos = s12bq05b * 1 .IF (pn = 22 & s12bq05a = 1) beet_s = s12bq05b * 1000 .IF (pn = 25 & s12bq05a = 1) grndns = s12bq05b * 1000 .IF (pn = 25 & s12bq05a = 11) grndns = s12bq05b * 75 .IF (pn = 27 & s12bq05a = 11) sesams = s12bq05b * 120 .IF (pn = 28 & s12bq05a = 3) olives = s12bq05b * 1 .IF (pn = 29 & s12bq05a = 1) othois = s12bq05b * 1000 .IF (pn = 30 & s12bq05a = 1) chilss = s12bq05b * 1000 .IF (pn = 31 & s12bq05a = 1) onioss = s12bq05b * 1000 .IF (pn = 31 & s12bq05a = 11) onioss = s12bq05b * 45 .IF (pn = 32 & s12bq05a = 1) garlcs = s12bq05b * 1000 .IF (pn = 36 & s12bq05a = 1) corins = s12bq05b * 1000 .IF (pn = 37 & s12bq05a = 11) fenugs = s12bq05b * 155 .IF (pn = 38 & s12bq05a = 3) otspcs = s12bq05b * 1 .IF (pn = 39 & s12bq05a = 1) wvgtbs = s12bq05b * 1000 .IF (pn = 39 & s12bq05a = 3) wvgtbs = s12bq05b .IF (pn = 40 & s12bq05a = 1) svgtbs = s12bq05b * 1000 .IF (pn = 40 & s12bq05a = 3) svgtbs = s12bq05b .IF (pn = 41 & s12bq05a = 1) orangs = s12bq05b * 1000.IF (pn = 41 & s12bq05a = 3) orangs = s12bq05b * 1.IF (pn = 46 & s12bq05a = 3) mangos = s12bq05b * 1.IF (pn = 47 & s12bq05a = 1) banans = s12bq05b * 1000.IF (pn = 48 & s12bq05a = 3) guavas = s12bq05b * 1.IF (pn = 49 & s12bq05a = 1) jackfs = s12bq05b * 1000.IF (pn = 53 & s12bq05a = 3) plum_s = s12bq05b * 1.IF (pn = 56 & s12bq05a = 3) otfrts = s12bq05b * 1.IF (pn = 57 & s12bq05a = 3) datess = s12bq05b * 1.IF (pn = 59 & s12bq05a = 1) sugrcs = s12bq05b * 1000 .IF (pn = 60 & s12bq05a = 12) cottns = s12bq05b * 157.5 .IF (pn = 63 & s12bq05a = 1) clovrs = s12bq05b * 1000 .IF (pn = 63 & s12bq05a = 11) clovrs = s12bq05b * 175 .IF (pn = 64 & s12bq05a = 1) otcrps = s12bq05b * 1000 .IF (pn = 64 & s12bq05a = 3) otcrps = s12bq05b * 1 .EXECUTE . SAVE OUTFILE='c:\ifpri6\salenew2.sav'.EXECUTE .

A-7
COMMENT Calculation of unit crop prices from sales (LE per kg) .GET FILE='c:\ifpri6\salenew2.sav'.EXECUTE .if (pn = 1 & s12bq05c > 0) ricepx = s12bq05c/rice_s .if (pn = 2 & s12bq05c > 0) wheatpx = s12bq05c/wheats .if (pn = 3 & s12bq05c > 0) maizepx = s12bq05c/maizes .if (pn = 4 & s12bq05c > 0) sorgopx = s12bq05c/sorgos .if (pn = 5 & s12bq05c > 0) barlypx = s12bq05c/barlys .if (pn = 7 & s12bq05c > 0) soybspx = s12bq05c/soybss .if (pn = 8 & s12bq05c > 0) favabpx = s12bq05c/favbds .if (pn = 13 & s12bq05c > 0) peas_px = s12bq05c/peas_s .if (pn = 16 & s12bq05c > 0) cowpepx = s12bq05c/cowpes .if (pn = 17 & s12bq05c > 0) chkpepx = s12bq05c/chkpes .if (pn = 18 & s12bq05c > 0) othlgpx = s12bq05c/othlgs .if (pn = 19 & s12bq05c > 0) wpotapx = s12bq05c/wpotas .if (pn = 20 & s12bq05c > 0) spotapx = s12bq05c/spotas .if (pn = 21 & s12bq05c > 0) swtpopx = s12bq05c/swtpos .if (pn = 22 & s12bq05c > 0) beet_px = s12bq05c/beet_s .if (pn = 25 & s12bq05c > 0) grnutpx = s12bq05c/grndns .if (pn = 27 & s12bq05c > 0) sesampx = s12bq05c/sesams .if (pn = 28 & s12bq05c > 0) olivepx = s12bq05c/olives .if (pn = 29 & s12bq05c > 0) otoilpx = s12bq05c/othois .if (pn = 30 & s12bq05c > 0) chilspx = s12bq05c/chilss .if (pn = 31 & s12bq05c > 0) oniospx = s12bq05c/onioss .if (pn = 32 & s12bq05c > 0) garlcpx = s12bq05c/garlcs .if (pn = 36 & s12bq05c > 0) corinpx = s12bq05c/corins .if (pn = 37 & s12bq05c > 0) fenugpx = s12bq05c/fenugs .if (pn = 38 & s12bq05c > 0) otspcpx = s12bq05c/otspcs .if (pn = 39 & s12bq05c > 0) wvegepx = s12bq05c/wvgtbs .if (pn = 40 & s12bq05c > 0) svegepx = s12bq05c/svgtbs .if (pn = 41 & s12bq05c > 0) orangpx = s12bq05c/orangs .if (pn = 46 & s12bq05c > 0) mangopx = s12bq05c/mangos .if (pn = 47 & s12bq05c > 0) bananpx = s12bq05c/banans .if (pn = 48 & s12bq05c > 0) guavapx = s12bq05c/guavas .if (pn = 49 & s12bq05c > 0) jackfpx = s12bq05c/jackfs .if (pn = 53 & s12bq05c > 0) plum_px = s12bq05c/plum_s .if (pn = 56 & s12bq05c > 0) otfrtpx = s12bq05c/otfrts .if (pn = 57 & s12bq05c > 0) datespx = s12bq05c/datess .if (pn = 59 & s12bq05c > 0) sugarpx = s12bq05c/sugrcs .if (pn = 60 & s12bq05c > 0) cotonpx = s12bq05c/cottns .if (pn = 63 & s12bq05c > 0) clovrpx = s12bq05c/clovrs .if (pn = 64 & s12bq05c > 0) otcrppx = s12bq05c/otcrps .SAVE OUTFILE='c:\ifpri6\Prices.sav'.EXECUTE .
COMMENT Aggregate crop production amounts to the household level .GET FILE='c:\ifpri6\Prodnew2.sav'.AGGREGATE /OUTFILE='c:\ifpri6\prodn0hh.SAV' /BREAK=hid /ricep_1 = SUM(rice) /wheatp_1 = SUM(wheat) /maizep_1 = SUM(maize) /sorgop_1 = SUM(sorgo) /barlyp_1 = SUM(barley) /soybsp_1 = SUM(soybns) /favabp_1 = SUM(favbrd) /peas_p_1 = SUM(peas) /cowpep_1 = SUM(cowpea) /chkpep_1 = SUM(chkpea) /othlgp_1 = SUM(othleg) /wpotap_1 = SUM(wpotat) /spotap_1 = SUM(spotat) /swtpop_1 = SUM(swtpot) /beet_p_1 = SUM(beet) /grnutp_1 = SUM(grndnt) /sesamp_1 = SUM(sesame) /olivep_1 = SUM(olive) /otoilp_1 = SUM(othoil) /chilsp_1 = SUM(chilis) /oniosp_1 = SUM(onions) /garlcp_1 = SUM(garlic) /corinp_1 = SUM(corian) /fenugp_1 = SUM(fenugk) /otspcp_1 = SUM(otspic) /wvegep_1 = SUM(wvgtbl) /svegep_1 = SUM(svgtbl) /orangp_1 = SUM(orange) /mangop_1 = SUM(mango) /bananp_1 = SUM(banana) /guavap_1 = SUM(guava) /jackfp_1 = SUM(jackft) /plum_p_1 = SUM(plum) /otfrtp_1 = SUM(otfrut) /datesp_1 = SUM(dates) /sugarp_1 = SUM(sugrcn) /cotonp_1 = SUM(cotton) /clovrp_1 = SUM(clover) /otcrpp_1 = SUM(otcrop)

A-8
/N_BREAK=N.GET FILE='c:\ifpri6\prodn0hh.SAV' .RECODE ricep_1 wheatp_1 maizep_1 sorgop_1 barlyp_1 soybsp_1 favabp_1 peas_p_1 cowpep_1 chkpep_1 othlgp_1 wpotap_1 spotap_1 swtpop_1 beet_p_1 grnutp_1 sesamp_1 olivep_1 otoilp_1 chilsp_1 oniosp_1 garlcp_1 corinp_1 fenugp_1 otspcp_1 wvegep_1 svegep_1 orangp_1 mangop_1 bananp_1 guavap_1 jackfp_1 plum_p_1 otfrtp_1 datesp_1 sugarp_1 cotonp_1 clovrp_1 otcrpp_1 (sysmis=0) .SAVE OUTFILE='c:\ifpri6\prodn1hh.SAV' /COMPRESSED .GET FILE='c:\ifpri6\prodn1hh.SAV' .des var=ricep_1 wheatp_1 maizep_1 sorgop_1 barlyp_1 soybsp_1 favabp_1 peas_p_1 cowpep_1 chkpep_1 othlgp_1 wpotap_1 spotap_1 swtpop_1 beet_p_1 grnutp_1 sesamp_1 olivep_1 otoilp_1 chilsp_1 oniosp_1 garlcp_1 corinp_1 fenugp_1 otspcp_1 wvegep_1 svegep_1 orangp_1 mangop_1 bananp_1 guavap_1 jackfp_1 plum_p_1 otfrtp_1 datesp_1 sugarp_1 cotonp_1 clovrp_1 otcrpp_1 .EXECUTE .
COMMENT Aggregate sales to household level .GET FILE='c:\ifpri6\salenew2.sav'.AGGREGATE /OUTFILE='c:\ifpri6\salen0hh.SAV' /BREAK=hid /rices_1 = SUM(rice_s) /wheats_1 = SUM(wheats) /maizes_1 = SUM(maizes) /sorgos_1 = SUM(sorgos) /barlys_1 = SUM(barlys) /soybss_1 = SUM(soybss) /favabs_1 = SUM(favbds) /peas_s_1 = SUM(peas_s) /cowpes_1 = SUM(cowpes) /chkpes_1 = SUM(chkpes) /othlgs_1 = SUM(othlgs) /wpotas_1 = SUM(wpotas) /spotas_1 = SUM(spotas) /swtpos_1 = SUM(swtpos) /beet_s_1 = SUM(beet_s) /grnuts_1 = SUM(grndns) /sesams_1 = SUM(sesams) /olives_1 = SUM(olives) /otoils_1 = SUM(othois) /chilss_1 = SUM(chilss) /onioss_1 = SUM(onioss) /garlcs_1 = SUM(garlcs) /corins_1 = SUM(corins) /fenugs_1 = SUM(fenugs) /otspcs_1 = SUM(otspcs) /wveges_1 = SUM(wvgtbs) /sveges_1 = SUM(svgtbs) /orangs_1 = SUM(orangs) /mangos_1 = SUM(mangos) /banans_1 = SUM(banans) /guavas_1 = SUM(guavas) /jackfs_1 = SUM(jackfs) /plum_s_1 = SUM(plum_s) /otfrts_1 = SUM(otfrts) /datess_1 = SUM(datess) /sugars_1 = SUM(sugrcs) /cotons_1 = SUM(cottns) /clovrs_1 = SUM(clovrs) /otcrps_1 = SUM(otcrps) /N_BREAK=N.GET FILE='c:\ifpri6\salen0hh.SAV' .RECODE rices_1 wheats_1 maizes_1 sorgos_1 barlys_1 soybss_1 favabs_1 peas_s_1 cowpes_1 chkpes_1 othlgs_1 wpotas_1 spotas_1 swtpos_1 beet_s_1 grnuts_1 sesams_1 olives_1 otoils_1 chilss_1 onioss_1 garlcs_1 corins_1 fenugs_1 otspcs_1 wveges_1 sveges_1 orangs_1 mangos_1 banans_1 guavas_1 jackfs_1 plum_s_1 otfrts_1 datess_1 sugars_1 cotons_1 clovrs_1 otcrps_1 (sysmis=0) .SAVE OUTFILE='c:\ifpri6\salen1hh.SAV' /COMPRESSED .GET FILE='c:\ifpri6\salen1hh.SAV'.DESCRIPTIVES VARIABLES = rices_1 wheats_1 maizes_1 sorgos_1 barlys_1 soybss_1 favabs_1 peas_s_1 cowpes_1 chkpes_1 othlgs_1 wpotas_1 spotas_1 swtpos_1 beet_s_1 grnuts_1 sesams_1 olives_1 otoils_1 chilss_1 onioss_1 garlcs_1 corins_1 fenugs_1 otspcs_1 wveges_1 sveges_1 orangs_1 mangos_1 banans_1 guavas_1 jackfs_1 plum_s_1 otfrts_1 datess_1 sugars_1 cotons_1 clovrs_1 otcrps_1 /STATISTICS=MEAN STDDEV MIN MAX .EXECUTE .
COMMENT Aggregate prices to level of PSU .GET FILE='c:\ifpri6\prices.sav'.AGGREGATE /OUTFILE='c:\ifpri6\pricepsu.SAV' /BREAK=psu /p_rice = mean(ricepx) /p_whea = mean(wheatpx) /p_maiz = mean(maizepx) /p_sorg = mean(sorgopx) /p_barl = mean(barlypx) /p_soyb = mean(soybspx) /p_fava = mean(favabpx) /p_peas = mean(peas_px) /p_cowp = mean(cowpepx) /p_chkp = mean(chkpepx) /p_othl = mean(othlgpx) /p_wpot = mean(wpotapx) /p_spot = mean(spotapx) /p_swtp = mean(swtpopx) /p_beet = mean(beet_px) /p_grnu = mean(grnutpx) /p_sesa = mean(sesampx) /p_oliv = mean(olivepx) /p_otoi = mean(otoilpx) /p_chil = mean(chilspx) /p_onio = mean(oniospx)

A-9
/p_garl = mean(garlcpx) /p_cori = mean(corinpx) /p_fenu = mean(fenugpx) /p_otsp = mean(otspcpx) /p_wveg = mean(wvegepx) /p_sveg = mean(svegepx) /p_oran = mean(orangpx) /p_mang = mean(mangopx) /p_bana = mean(bananpx) /p_guav = mean(guavapx) /p_jack = mean(jackfpx) /p_plum = mean(plum_px) /p_otfr = mean(otfrtpx) /p_date = mean(datespx) /p_suga = mean(sugarpx) /p_coto = mean(cotonpx) /p_clov = mean(clovrpx) /p_otcr = mean(otcrppx) /N_BREAK=N.GET FILE='c:\ifpri6\pricepsu.sav'.DESCRIPTIVES VARIABLES = p_rice p_whea p_maiz p_sorg p_barl p_soyb p_fava p_peas p_cowp p_chkp p_othl p_wpot p_spot p_swtp p_beet p_grnu p_sesa p_oliv p_otoi p_chil p_onio p_garl p_cori p_fenu p_otsp p_wveg p_sveg p_oran p_mang p_bana p_guav p_jack p_plum p_otfr p_date p_suga p_coto p_clov p_otcr /STATISTICS=MEAN STDDEV MIN MAX .EXECUTE .
COMMENT Calculate sales statistics for primary crops .GET FILE='c:\ifpri6\prodn1hh.SAV' /keep hid ricep_1 wheatp_1 maizep_1 sorgop_1 favabp_1 wvegep_1 svegep_1 sugarp_1 cotonp_1 clovrp_1 .SAVE OUTFILE = 'c:\ifpri6\prodprim.sav' /compressed .GET FILE='c:\ifpri6\salen1hh.SAV' /keep hid rices_1 wheats_1 maizes_1 sorgos_1 favabs_1 wveges_1 sveges_1 sugars_1 cotons_1 clovrs_1 .SAVE OUTFILE = 'c:\ifpri6\saleprim.sav' /compressed .GET 'c:\ifpri6\saleprim.sav'.MATCH FILES /FILE=* /FILE='c:\ifpri6\prodprim.sav' /FILE='C:\ifpri6\brsmdata.sav' /by hid .COMPUTE sarice=rices_1/ricep_1 .COMPUTE sawheat=wheats_1/wheatp_1 .COMPUTE samaize=maizes_1/maizep_1 .COMPUTE sasorgo=sorgos_1/sorgop_1 .COMPUTE safavab=favabs_1/favabp_1 .COMPUTE sawveg=wveges_1/wvegep_1 .COMPUTE sasveg=sveges_1/svegep_1 .COMPUTE sasugar=sugars_1/sugarp_1 .COMPUTE sacoton=cotons_1/cotonp_1 .COMMENT COMPUTE saclover=clovrs_1/clovrp_1 .if sarice>0 srice=sarice.if sawheat>0 swheat=sawheat.if samaize>0 smaize=samaize.if sasorgo>0 ssorgo=sasorgo.if safavab>0 sfavab=safavab.if sawveg>0 swveg=sawveg.if sasveg>0 ssveg=sasveg.if sasugar>0 ssugar=sasugar.if sacoton>0 scoton=sacoton.if (bsalperc>0 and bsalperc<2) sclover=bsalperc.DESCRIPTIVES var = srice swheat smaize ssorgo sfavab swveg ssveg ssugar scoton sclover.
COMMENT calculate average sales per selling household .COMPUTE brsms_1=bsalperc*brsmkgs.if rices_1>0 ricesld=rices_1.if wheats_1>0 wheatsld=wheats_1.if maizes_1>0 maizesld=maizes_1.if sorgos_1>0 sorgosld=sorgos_1.if favabs_1>0 favabsld=favabs_1.if wveges_1>0 wvegsld=wveges_1.if sveges_1>0 svegsld=sveges_1.if sugars_1>0 sugarsld=sugars_1.if cotons_1>0 cotonsld=cotons_1.

A-10
if (brsms_1>0 and bsalperc<2) clovrsld=brsms_1.
DESCRIPTIVES var = ricesld wheatsld maizesld sorgosld favabsld wvegsld svegsld sugarsld cotonsld clovrsld .

A-11
COMMENT filename is cropland.sps .
COMMENT calculates crop areas in feddan for major crops.COMMENT created June 15 1998, version 1.0 . Verified July 9, 1998.COMMENT revised June 24 1998 to add winter and summer vegetables .
GET FILE='C:\ifpri6\s12a1mv2.sav'.COMPUTE fed2fed = s12aq02a .COMPUTE quir2ha = s12aq02b / 24 .RECODE fed2fed (SYSMIS=0) .RECODE quir2ha (SYSMIS=0) .COMPUTE feddan = quir2ha + fed2fed .EXECUTE .IF (s12aq09a = 1) rice1 = feddan .IF (s12aq10a = 1) rice2 = feddan .IF (s12aq10b = 1) rice3 = feddan .IF (s12aq11a = 1) rice4 = feddan .RECODE rice1 rice2 rice3 rice4 (sysmis=0) .COMPUTE rice_fed = rice1 + rice2 + rice3 + rice4 .EXECUTE .IF (s12aq09a = 2) wheat1 = feddan .IF (s12aq09b = 2) wheat2 = feddan .IF (s12aq09c = 2) wheat3 = feddan .IF (s12aq09d = 2) wheat4 = feddan .IF (s12aq10a = 2) wheat5 = feddan .IF (s12aq10b = 2) wheat6 = feddan .RECODE wheat1 wheat2 wheat3 wheat4 wheat5 wheat6 (sysmis=0) .COMPUTE wheatfed = wheat1 + wheat2 + wheat3 + wheat4 + wheat5 + wheat6 .EXECUTE .IF (s12aq10a = 3) maize1 = feddan .IF (s12aq10b = 3) maize2 = feddan .IF (s12aq10c = 3) maize3 = feddan .IF (s12aq11a = 3) maize4 = feddan .IF (s12aq12a = 3) maize5 = feddan .RECODE maize1 maize2 maize3 maize4 maize5 (sysmis=0) .COMPUTE maizefed = maize1 + maize2 + maize3 + maize4 + maize5 .EXECUTE. IF (s12aq10a = 4) sorgo1 = feddan .IF (s12aq10b = 4) sorgo2 = feddan .IF (s12aq10c = 4) sorgo3 = feddan .IF (s12aq11a = 4) sorgo4 = feddan .RECODE sorgo1 sorgo2 sorgo3 sorgo4 (sysmis=0) .COMPUTE sorgofed = sorgo1 + sorgo2 + sorgo3 + sorgo4 .EXECUTE.IF (s12aq09a = 8) favab1 = feddan .IF (s12aq09a = 12) favab1 = feddan .IF (s12aq09b = 8) favab2 = feddan .IF (s12aq09c = 8) favab3 = feddan .IF (s12aq10a = 8) favab4 = feddan .IF (s12aq11a = 8) favab5 = feddan .RECODE favab1 favab2 favab3 favab4 favab5 (sysmis=0) .COMPUTE favabfed = favab1 + favab2 + favab3 + favab4 + favab5 .EXECUTE.IF (s12aq09a=39) wveg1 = feddan.IF (s12aq09b=39) wveg2 = feddan.IF (s12aq09c=39) wveg3 = feddan.IF (s12aq10b=39) wveg4 = feddan.IF (s12aq11a=39) wveg5 = feddan.RECODE wveg1 wveg2 wveg3 wveg4 wveg5 (sysmis=0) .COMPUTE wvegtfed=wveg1+wveg2+wveg3+wveg4+wveg5 .EXECUTE.IF (s12aq09a=40) sveg1 = feddan.

A-12
IF (s12aq10a=40) sveg2 = feddan.IF (s12aq10b=40) sveg3 = feddan.IF (s12aq10c=40) sveg4 = feddan.IF (s12aq11a=40) sveg5 = feddan.RECODE sveg1 sveg2 sveg3 sveg4 sveg5 (sysmis=0) .COMPUTE svegtfed=sveg1+sveg2+sveg3+sveg4+sveg5 .EXECUTE.IF (s12aq11a = 59) sugar1 = feddan .IF (s12aq12a = 59) sugar2 = feddan .RECODE sugar1 sugar2 (sysmis=0) .COMPUTE sugarfed = sugar1 + sugar2 .EXECUTE.IF (s12aq10a = 60) coton1 = feddan .IF (s12aq10b = 60) coton2 = feddan .RECODE coton1 coton2 (sysmis=0) .COMPUTE cotonfed = coton1 + coton2 .EXECUTE.IF (s12aq09a = 63) berse1 = feddan .IF (s12aq09b = 63) berse2 = feddan .IF (s12aq09c = 63) berse3 = feddan .IF (s12aq09d = 63) berse4 = feddan .IF (s12aq10a = 63) berse5 = feddan .IF (s12aq11a = 63) berse6 = feddan .IF (s12aq12a = 63) berse7 = feddan .RECODE berse1 berse2 berse3 berse4 berse5 berse6 berse7 (sysmis = 0) .COMPUTE bersefed = berse1 + berse2 + berse3 + berse4 + berse5 + berse6 + berse7.EXECUTE .SAVE OUTFILE='C:\ifpri6\cropintr.sav' /COMPRESSED .AGGREGATE /OUTFILE='C:\ifpri6\crplndhh.sav' /BREAK=hid /rice_ld=SUM(rice_fed) /wheatld=SUM(wheatfed) /maizeld=SUM(maizefed) /sorgold=SUM(sorgofed) /favabld=SUM(favabfed) /sugarld=SUM(sugarfed) /cotonld=SUM(cotonfed) /berseld=SUM(bersefed) /wvegteld=SUM(wvegtfed) /svegteld=SUM(svegtfed) .GET FILE='C:\ifpri6\crplndhh.sav'.RECODE rice_ld wheatld maizeld sorgold favabld sugarld cotonld berseld wvegteldsvegteld (sysmis=0) .EXECUTE .DESCRIPTIVES VARIABLES=rice_ld wheatld maizeld sorgold favabld sugarld wvegteld svegteld cotonld berseld /statistics=mean stdev min max .

A-13
COMMENT filename is berseem.sps .
COMMENT purpose is to calculate berseem production in kilograms, area andyield .COMMENT created June 14 1998, version 1.0 ; verified: July 9, 1998.
COMMENT 1-calculate berseem production from s12bq04b for unit code 15 .COMMENT Also calculate berseem sales quantity and value.GET FILE='C:\ifpri6\S12bnew2.sav' .if (pn=63 and s12bq04a=15) bersm1=s12bq04b .if (pn=63 and s12bq04a=15) bersm2=s12bq04a .if (pn=63 and s12bq05a=15) bersale1=s12bq05b.if (pn=63) salval=s12bq05c .AGGREGATE /OUTFILE='C:\ifpri6\brsmprod.SAV' /BREAK=hid /bersm1_1 = SUM(bersm1) /unitcode=sum(bersm2) /bersa1=SUM(bersale1) /bersaval=SUM(salval) .
COMMENT 2-calculate berseem production for unit codes 1 and 11 .GET FILE='C:\ifpri6\S12bnew2.sav' .if (pn=63 and s12bq04a=1) bersm2=s12bq04b * 1000.if (pn=63 and s12bq04a=11) bersm2=s12bq04b * 175.if (pn=63 and s12bq05a=1) bersale2=s12bq05b * 1000.if (pn=63 and s12bq05a=11) bersale2=s12bq05b * 175.AGGREGATE /OUTFILE='C:\ifpri6\brsmprd2.SAV' /BREAK=hid /bersm2_1 = SUM(bersm2) /bersa2=SUM(bersale2).
COMMENT 3-calculate berseem area in feddan for unit code 15 .GET FILE='c:\ifpri6\s12a1mv2.sav'.COMMENT convert "hid" from a string to numeric variable if necessary. COMMENT FORMATS hid (F8) .COMPUTE fed2fed = s12aq02a .COMPUTE quir2ha = s12aq02b / 24 .RECODE fed2fed (SYSMIS=0) .RECODE quir2ha (SYSMIS=0) .COMPUTE feddan = quir2ha + fed2fed .IF (s12aq09a = 63) berse1 = feddan .IF (s12aq09b = 63) berse2 = feddan .IF (s12aq09c = 63) berse3 = feddan .IF (s12aq09d = 63) berse4 = feddan .IF (s12aq10a = 63) berse5 = feddan .IF (s12aq11a = 63) berse6 = feddan .IF (s12aq12a = 63) berse7 = feddan .RECODE berse1 berse2 berse3 berse4 berse5 berse6 berse7 (sysmis = 0) .COMPUTE bersefed = berse1+berse2+berse3+berse4+berse5+berse6+berse7.SAVE OUTFILE='c:\ifpri6\brsmlnd.sav' /COMPRESSED .AGGREGATE /OUTFILE='c:\ifpri6\brsmldhh.sav' /BREAK=hid /brsmarea=SUM(bersefed) .GET FILE='c:\ifpri6\brsmldhh.sav'.RECODE brsmarea (sysmis=0) .SAVE OUTFILE='C:\ifpri6\brsmldh2.sav' /COMPRESSED.
COMMENT 4-merge berseem area and production files .GET FILE='c:\ifpri6\brsmldh2.sav' .MATCH FILES /FILE=* /FILE='C:\ifpri6\brsmprod.sav' /IN=s02 /BY hid.VARIABLE LABELS s02 'Case source is C:\ifpri6\brsmprod.sav'.COMPUTE brsmqrat = brsmarea * 24 .RECODE bersm1_1 (SYSMIS=0) .COMPUTE nbrcuts = bersm1_1 / brsmqrat .COMPUTE bmkgtemp = (((9.5/24)*1000)*(brsmarea*24)) * nbrcuts .SAVE OUTFILE='C:\ifpri6\berseem.sav' /COMPRESSED.
COMMENT 5-add back berseem production from unit codes 1 and 11.

A-14
GET FILE='C:\IFPRI6\berseem.sav' .MATCH FILES /FILE=* /FILE='c:\ifpri6\brsmprd2.sav' /IN=s03 /BY hid.RECODE bmkgtemp bersm2_1 (sysmis=0).COMPUTE brsmkgs=bmkgtemp+bersm2_1 .COMPUTE brsmyld=brsmkgs/brsmarea .COMPUTE brsmyprc=brsmyld/nbrcuts .FORMATS brsmkgs brsmarea brsmyld brsmyprc (F8.0) brsmarea nbrcuts (F8.3) .SAVE OUTFILE='C:\ifpri6\berseemt.sav' /COMPRESSED.DESCRIPTIVES VARIABLES=brsmkgs brsmarea brsmyld brsmyprc nbrcuts /STATISTICS=MEAN STDDEV MIN MAX .
COMMENT 6-create separate berseem production file for subsequent merging .COMMENT in the yield.sps syntax file .SAVE OUTFILE='C:\ifpri6\brsmonly.sav' /COMPRESSED /KEEP hid brsmkgs .
COMMENT 7-calculate sales as a percent of production to obtain berseem price.GET FILE='C:\ifpri6\S12bnew2.sav' .if (pn=63) percsold=s12bq05b / s12bq04b.if (pn=63) bsalval=s12bq05c .AGGREGATE OUTFILE = 'c:\ifpri6\bersales.sav' /BREAK = hid /bsalperc = SUM(percsold) /bsalvalu = SUM(bsalval) .GET FILE='C:\ifpri6\brsmonly.sav' .MATCH FILES /FILE = * /FILE='C:\ifpri6\bersales.sav' /BY hid .COMPUTE berprice = (bsalvalu)/(bsalperc*brsmkgs) .DESCRIPTIVES VARIABLES=brsmkgs bsalperc berprice /STATISTICS=MEAN STDDEV MIN MAX .SAVE OUTFILE='C:\ifpri6\brsmdata.sav' /COMPRESSED .
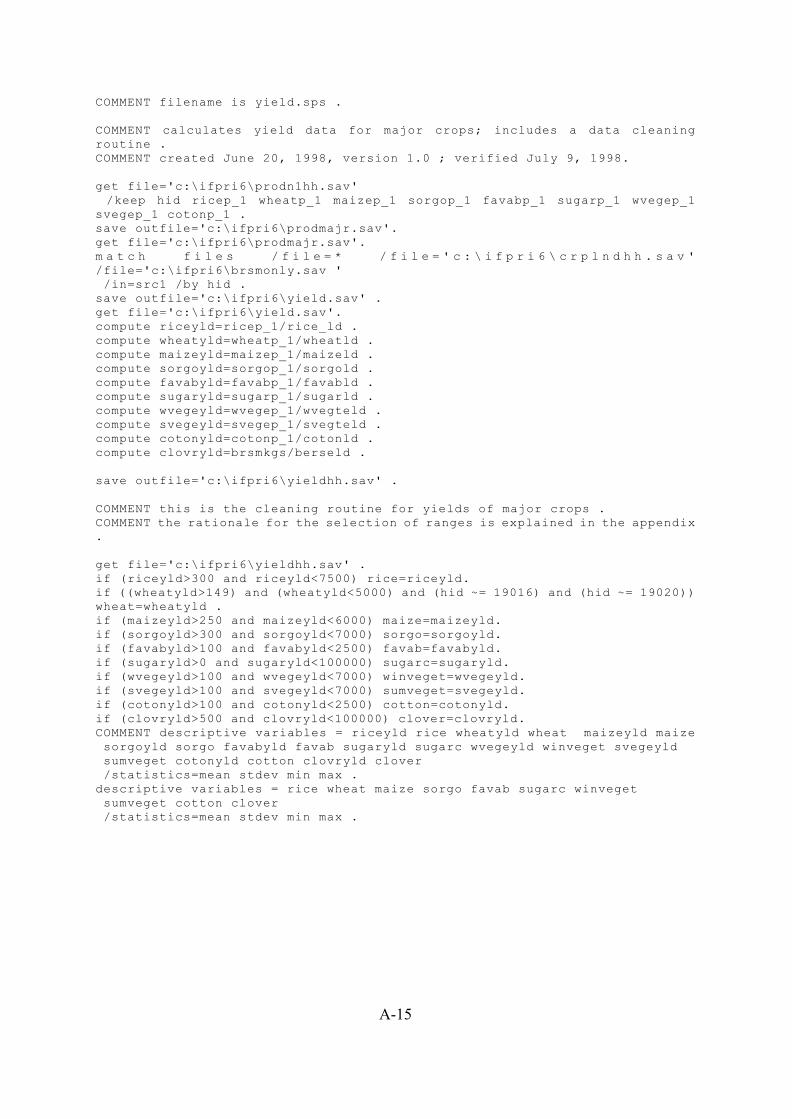
A-15
COMMENT filename is yield.sps .
COMMENT calculates yield data for major crops; includes a data cleaningroutine .COMMENT created June 20, 1998, version 1.0 ; verified July 9, 1998.
get file='c:\ifpri6\prodn1hh.sav' /keep hid ricep_1 wheatp_1 maizep_1 sorgop_1 favabp_1 sugarp_1 wvegep_1svegep_1 cotonp_1 .save outfile='c:\ifpri6\prodmajr.sav'.get file='c:\ifpri6\prodmajr.sav'.m a t c h f i l e s / f i l e = * / f i l e = ' c : \ i f p r i 6 \ c r p l n d h h . s a v '/file='c:\ifpri6\brsmonly.sav ' /in=src1 /by hid .save outfile='c:\ifpri6\yield.sav' .get file='c:\ifpri6\yield.sav'.compute riceyld=ricep_1/rice_ld .compute wheatyld=wheatp_1/wheatld .compute maizeyld=maizep_1/maizeld .compute sorgoyld=sorgop_1/sorgold .compute favabyld=favabp_1/favabld .compute sugaryld=sugarp_1/sugarld .compute wvegeyld=wvegep_1/wvegteld .compute svegeyld=svegep_1/svegteld .compute cotonyld=cotonp_1/cotonld .compute clovryld=brsmkgs/berseld .
save outfile='c:\ifpri6\yieldhh.sav' .
COMMENT this is the cleaning routine for yields of major crops .COMMENT the rationale for the selection of ranges is explained in the appendix.
get file='c:\ifpri6\yieldhh.sav' .if (riceyld>300 and riceyld<7500) rice=riceyld.if ((wheatyld>149) and (wheatyld<5000) and (hid ~= 19016) and (hid ~= 19020))wheat=wheatyld .if (maizeyld>250 and maizeyld<6000) maize=maizeyld.if (sorgoyld>300 and sorgoyld<7000) sorgo=sorgoyld.if (favabyld>100 and favabyld<2500) favab=favabyld.if (sugaryld>0 and sugaryld<100000) sugarc=sugaryld.if (wvegeyld>100 and wvegeyld<7000) winveget=wvegeyld.if (svegeyld>100 and svegeyld<7000) sumveget=svegeyld.if (cotonyld>100 and cotonyld<2500) cotton=cotonyld.if (clovryld>500 and clovryld<100000) clover=clovryld.COMMENT descriptive variables = riceyld rice wheatyld wheat maizeyld maize sorgoyld sorgo favabyld favab sugaryld sugarc wvegeyld winveget svegeyld sumveget cotonyld cotton clovryld clover /statistics=mean stdev min max .descriptive variables = rice wheat maize sorgo favab sugarc winveget sumveget cotton clover /statistics=mean stdev min max .

A-16
COMMENT filename is profits2.sps .
COMMENT This file prepares production data for calculation of profits .COMMENT Created July 3, 1998 ; verified July 9, 1998.
get FILE='c:\ifpri6\prodn1hh.SAV' .COMMENT pn=3 and s12bq04a=15 .if hid=14711 maizep_1 = 1603 *1.42.if hid=18502 maizep_1 = 1603 *0.5533.if hid=18901 maizep_1 = 1603 *0.08.if hid=19104 maizep_1 = 1603 *2.if hid=19118 maizep_1 = 1603 *2.if hid=19410 maizep_1 = 1603 *1.if hid=19413 maizep_1 = 1603 *0.67.if hid=19502 maizep_1 = 1603 *0.67.if hid=19515 maizep_1 = 1603 *3.17.if hid=22117 maizep_1 = 1603 *0.83.if hid=22306 maizep_1 = 1603 *0.29.COMMENT pn=40 and s12bq04a=15 .if hid=18601 svegep_1=1303*7.if hid=18603 svegep_1=1303*0.67.if hid=18604 svegep_1=1303*0.5.if hid=18612 svegep_1=1303*2.08.if hid=18619 svegep_1=1303*1.if hid=22003 svegep_1=1303*0.5.COMMENT pn=40 and s12bq04a=16 .if hid=14712 svegep_1=1303*1.08.if hid=14718 svegep_1=1303*0.167.if hid=15118 svegep_1=1303*0.5.COMMENT pn=39 and s12bq04a=16 .if hid=14717 wvegep_1=2379*0.3333.if hid=15105 wvegep_1=2379*0.5.if hid=15106 wvegep_1=2379*1.if hid=15117 wvegep_1=2379*0.458.save outfile='c:\ifpri6\prodn2hh.sav'.
COMMENT Aggregate prices to level of household.GET FILE='c:\ifpri6\prices.sav'.if othlgpx > 5 othlgpx = 0.89 .compute nation=1.AGGREGATE /OUTFILE='c:\ifpri6\pricehh.SAV' /BREAK=hid /psu=mean(psu) /national=mean(nation) /pprice = mean(ricepx) /ppwhea = mean(wheatpx) /ppmaiz = mean(maizepx) /ppsorg = mean(sorgopx) /ppbarl = mean(barlypx) /ppsoyb = mean(soybspx) /ppfava = mean(favabpx) /pppeas = mean(peas_px) /ppcowp = mean(cowpepx) /ppchkp = mean(chkpepx) /ppothl = mean(othlgpx) /ppwpot = mean(wpotapx) /ppspot = mean(spotapx) /ppswtp = mean(swtpopx) /ppbeet = mean(beet_px) /ppgrnu = mean(grnutpx) /ppsesa = mean(sesampx) /ppoliv = mean(olivepx) /ppotoi = mean(otoilpx) /ppchil = mean(chilspx) /pponio = mean(oniospx) /ppgarl = mean(garlcpx) /ppcori = mean(corinpx) /ppfenu = mean(fenugpx) /ppotsp = mean(otspcpx) /ppwveg = mean(wvegepx) /ppsveg = mean(svegepx) /pporan = mean(orangpx) /ppmang = mean(mangopx) /ppbana = mean(bananpx) /ppguav = mean(guavapx) /ppjack = mean(jackfpx) /ppplum = mean(plum_px) /ppotfr = mean(otfrtpx) /ppdate = mean(datespx) /ppsuga = mean(sugarpx) /ppcoto = mean(cotonpx) /ppclov = mean(clovrpx) /ppotcr = mean(otcrppx) /N_BREAK=N.
COMMENT Aggregate prices to the national level.GET FILE='c:\ifpri6\prices.sav'.compute nation=1.AGGREGATE /OUTFILE='c:\ifpri6\pricenat.SAV' /break=pn /national=mean(nation) /pnrice = mean(ricepx) /pnwhea = mean(wheatpx) /pnmaiz = mean(maizepx) /pnsorg = mean(sorgopx) /pnbarl = mean(barlypx) /pnsoyb = mean(soybspx)

A-17
/pnfava = mean(favabpx) /pnpeas = mean(peas_px) /pncowp = mean(cowpepx) /pnchkp = mean(chkpepx) /pnothl = mean(othlgpx) /pnwpot = mean(wpotapx) /pnspot = mean(spotapx) /pnswtp = mean(swtpopx) /pnbeet = mean(beet_px) /pngrnu = mean(grnutpx) /pnsesa = mean(sesampx) /pnoliv = mean(olivepx) /pnotoi = mean(otoilpx) /pnchil = mean(chilspx) /pnonio = mean(oniospx) /pngarl = mean(garlcpx) /pncori = mean(corinpx) /pnfenu = mean(fenugpx) /pnotsp = mean(otspcpx) /pnwveg = mean(wvegepx) /pnsveg = mean(svegepx) /pnoran = mean(orangpx) /pnmang = mean(mangopx) /pnbana = mean(bananpx) /pnguav = mean(guavapx) /pnjack = mean(jackfpx) /pnplum = mean(plum_px) /pnotfr = mean(otfrtpx) /pndate = mean(datespx) /pnsuga = mean(sugarpx) /pncoto = mean(cotonpx) /pnclov = mean(clovrpx) /pnotcr = mean(otcrppx) /N_BREAK=N.get file='c:\ifpri6\pricenat.sav'.aggregate outfile='c:\ifpri6\pricnat1.sav' /break=national /pn1rice = mean(pnrice) /pn1whea = mean(pnwhea) /pn1maiz = mean(pnmaiz) /pn1sorg = mean(pnsorg) /pn1barl = mean(pnbarl) /pn1soyb = mean(pnsoyb) /pn1fava = mean(pnfava) /pn1peas = mean(pnpeas) /pn1cowp = mean(pncowp) /pn1chkp = mean(pnchkp) /pn1othl = mean(pnothl) /pn1wpot = mean(pnwpot) /pn1spot = mean(pnspot) /pn1swtp = mean(pnswtp) /pn1beet = mean(pnbeet) /pn1grnu = mean(pngrnu) /pn1sesa = mean(pnsesa) /pn1oliv = mean(pnoliv) /pn1otoi = mean(pnotoi) /pn1chil = mean(pnchil) /pn1onio = mean(pnonio) /pn1garl = mean(pngarl) /pn1cori = mean(pncori) /pn1fenu = mean(pnfenu) /pn1otsp = mean(pnotsp) /pn1wveg = mean(pnwveg) /pn1sveg = mean(pnsveg) /pn1oran = mean(pnoran) /pn1mang = mean(pnmang) /pn1bana = mean(pnbana) /pn1guav = mean(pnguav) /pn1jack = mean(pnjack) /pn1plum = mean(pnplum) /pn1otfr = mean(pnotfr) /pn1date = mean(pndate) /pn1suga = mean(pnsuga) /pn1coto = mean(pncoto) /pn1clov = mean(pnclov) /pn1otcr = mean(pnotcr).match files /file='c:\ifpri6\pricehh.sav' /table='c:\ifpri6\pricnat1.sav' /by national.
COMMENT fill in temporary data for commodities with missing prices .compute pn1guav=mean(pn1oran, pn1mang, pn1bana, pn1jack, pn1plum, pn1otfr).compute pn1date=mean(pn1oran, pn1mang, pn1bana, pn1jack, pn1plum, pn1otfr).compute pn1peas=mean(pn1soyb, pn1fava, pn1cowp, pn1chkp).compute pn1barl=mean(pn1rice, pn1whea, pn1maiz, pn1sorg).compute pn1othl=0.89 .save outfile='c:\ifpri6\pricprep.sav'.
COMMENT merge in prices at hh and at psu-level (as well the national average).match files /file='c:\ifpri6\pricprep.sav' /table='c:\ifpri6\pricepsu.sav' /by psu.save outfile='c:\ifpri6\pricemer.sav' /compressed.get file='c:\ifpri6\prodn2hh.sav'.match files /file=* /file='c:\ifpri6\pricemer.sav' /by hid.compute riceval=pprice*ricep_1 .compute wheatval=ppwhea*wheatp_1 .compute maizeval=ppmaiz*maizep_1 .compute sorgoval=ppsorg*sorgop_1 .compute barlyval=ppbarl*barlyp_1 .compute soybsval=ppsoyb*soybsp_1 .compute favabval=ppfava*favabp_1 .compute peasval=pppeas*peas_p_1 .compute cowpval=ppcowp*cowpep_1 .compute chkpeval=ppchkp* chkpep_1 .compute othlgval=ppothl*othlgp_1 .compute wpotaval=ppwpot*wpotap_1 .compute spotaval=ppspot*spotap_1 .compute swtpoval=ppswtp*swtpop_1 .compute beetval=ppbeet*beet_p_1 .compute grnutval=ppgrnu*grnutp_1 .compute sesamval=ppsesa*sesamp_1 .compute oliveval=ppoliv*olivep_1 .compute otoilval=ppotoi*otoilp_1 .

A-18
compute chilival=ppchil*chilsp_1 .compute onionval=pponio*oniosp_1 .compute garlival=ppgarl*garlcp_1 .compute coriaval=ppcori*corinp_1 .compute fenugval=ppfenu*fenugp_1 .compute othspval=ppotsp*otspcp_1 .compute wvegeval=ppwveg*wvegep_1 .compute svegeval=ppsveg*svegep_1 .compute orangval=pporan*orangp_1 .compute mangoval=ppmang*mangop_1 .compute bananval=ppbana*bananp_1 .compute guavaval=ppguav*guavap_1 .compute jackfval=ppjack*jackfp_1 .compute plumval=ppplum*plum_p_1 .compute otfrtval=ppotfr*otfrtp_1 .compute datesval=ppdate*datesp_1 .compute sugarval=ppsuga*sugarp_1 .compute cotonval=ppcoto*cotonp_1 .compute clovrval=ppclov*clovrp_1 .compute otcrpval=ppotcr*otcrpp_1 .execute.if p_othl > 5 p_othl = 0.89 .if sysmis(pprice) riceval=p_rice*ricep_1 .if sysmis(ppwhea) wheatval=p_whea*wheatp_1 .if sysmis(ppmaiz) maizeval=p_maiz*maizep_1 .if sysmis(ppsorg) sorgoval=p_sorg*sorgop_1 .if sysmis(ppbarl) barlyval=p_barl*barlyp_1 .if sysmis(ppsoyb) soybsval=p_soyb*soybsp_1 .if sysmis(ppfava) favabval=p_fava*favabp_1 .if sysmis(pppeas) peasval=p_peas*peas_p_1 .if sysmis(ppcowp) cowpval=p_cowp*cowpep_1 .if sysmis(ppchkp) chkpeval=p_chkp* chkpep_1 .if sysmis(ppothl) othlgval=p_othl*othlgp_1 .if sysmis(ppwpot) wpotaval=p_wpot*wpotap_1 .if sysmis(ppspot) spotaval=p_spot*spotap_1 .if sysmis(ppswtp) swtpoval=p_swtp*swtpop_1 .if sysmis(ppbeet) beetval=p_beet*beet_p_1 .if sysmis(ppgrnu) grnutval=p_grnu*grnutp_1 .if sysmis(ppsesa) sesamval=p_sesa*sesamp_1 .if sysmis(ppoliv) oliveval=p_oliv*olivep_1 .if sysmis(ppotoi) otoilval=p_otoi*otoilp_1 .if sysmis(ppchil) chilival=p_chil*chilsp_1 .if sysmis(pponio) onionval=p_onio*oniosp_1 .if sysmis(ppgarl) garlival=p_garl*garlcp_1 .if sysmis(ppcori) coriaval=p_cori*corinp_1 .if sysmis(ppfenu) fenugval=p_fenu*fenugp_1 .if sysmis(ppotsp) othspval=p_otsp*otspcp_1 .if sysmis(ppwveg) wvegeval=p_wveg*wvegep_1 .if sysmis(ppsveg) svegeval=p_sveg*svegep_1 .if sysmis(pporan) orangval=p_oran*orangp_1 .if sysmis(ppmang) mangoval=p_mang*mangop_1 .if sysmis(ppbana) bananval=p_bana*bananp_1 .if sysmis(ppguav) guavaval=p_guav*guavap_1 .if sysmis(ppjack) jackfval=p_jack*jackfp_1 .if sysmis(ppplum) plumval=p_plum*plum_p_1 .if sysmis(ppotfr) otfrtval=p_otfr*otfrtp_1 .if sysmis(ppdate) datesval=p_date*datesp_1 .if sysmis(ppsuga) sugarval=p_suga*sugarp_1 .if sysmis(ppcoto) cotonval=p_coto*cotonp_1 .if sysmis(ppclov) clovrval=p_clov*clovrp_1 .if sysmis(ppotcr) otcrpval=p_otcr*otcrpp_1 .execute.if p_othl > 5 p_othl = 0.89 .

A-19
if (sysmis(pprice) and sysmis(p_rice)) riceval=pn1rice*ricep_1 .if (sysmis(ppwhea) and sysmis(p_whea)) wheatval=pn1whea*wheatp_1 .if (sysmis(ppmaiz) and sysmis(p_maiz)) maizeval=pn1maiz*maizep_1 .if (sysmis(ppsorg) and sysmis(p_sorg)) sorgoval=pn1sorg*sorgop_1 .if (sysmis(ppbarl) and sysmis(p_barl)) barlyval=pn1barl*barlyp_1 .if (sysmis(ppsoyb) and sysmis(p_soyb)) soybsval=pn1soyb*soybsp_1 .if (sysmis(ppfava) and sysmis(p_fava)) favabval=pn1fava*favabp_1 .if (sysmis(pppeas) and sysmis(p_peas)) peasval=pn1peas*peas_p_1 .if (sysmis(ppcowp) and sysmis(p_cowp)) cowpval=pn1cowp*cowpep_1 .if (sysmis(ppchkp) and sysmis(p_chkp)) chkpeval=pn1chkp* chkpep_1 .if (sysmis(ppothl) and sysmis(p_othl)) othlgval=pn1othl*othlgp_1 .if (sysmis(ppwpot) and sysmis(p_wpot)) wpotaval=pn1wpot*wpotap_1 .if (sysmis(ppspot) and sysmis(p_spot)) spotaval=pn1spot*spotap_1 .if (sysmis(ppswtp) and sysmis(p_swtp)) swtpoval=pn1swtp*swtpop_1 .if (sysmis(ppbeet) and sysmis(p_beet)) beetval=pn1beet*beet_p_1 .if (sysmis(ppgrnu) and sysmis(p_grnu)) grnutval=pn1grnu*grnutp_1 .if (sysmis(ppsesa) and sysmis(p_sesa)) sesamval=pn1sesa*sesamp_1 .if (sysmis(ppoliv) and sysmis(p_oliv)) oliveval=pn1oliv*olivep_1 .if (sysmis(ppotoi) and sysmis(p_otoi)) otoilval=pn1otoi*otoilp_1 .if (sysmis(ppchil) and sysmis(p_chil)) chilival=pn1chil*chilsp_1 .if (sysmis(pponio) and sysmis(p_onio)) onionval=pn1onio*oniosp_1 .if (sysmis(ppgarl) and sysmis(p_garl)) garlival=pn1garl*garlcp_1 .if (sysmis(ppcori) and sysmis(p_cori)) coriaval=pn1cori*corinp_1 .if (sysmis(ppfenu) and sysmis(p_fenu)) fenugval=pn1fenu*fenugp_1 .if (sysmis(ppotsp) and sysmis(p_otsp)) othspval=pn1otsp*otspcp_1 .if (sysmis(ppwveg) and sysmis(p_wveg)) wvegeval=pn1wveg*wvegep_1 .if (sysmis(ppsveg) and sysmis(p_sveg)) svegeval=pn1sveg*svegep_1 .if (sysmis(pporan) and sysmis(p_oran)) orangval=pn1oran*orangp_1 .if (sysmis(ppmang) and sysmis(p_mang)) mangoval=pn1mang*mangop_1 .if (sysmis(ppbana) and sysmis(p_bana)) bananval=pn1bana*bananp_1 .if (sysmis(ppguav) and sysmis(p_guav)) guavaval=pn1guav*guavap_1 .if (sysmis(ppjack) and sysmis(p_jack)) jackfval=pn1jack*jackfp_1 .if (sysmis(ppplum) and sysmis(p_plum)) plumval=pn1plum*plum_p_1 .if (sysmis(ppotfr) and sysmis(p_otfr)) otfrtval=pn1otfr*otfrtp_1 .if (sysmis(ppdate) and sysmis(p_date)) datesval=pn1date*datesp_1 .if (sysmis(ppsuga) and sysmis(p_suga)) sugarval=pn1suga*sugarp_1 .if (sysmis(ppcoto) and sysmis(p_coto)) cotonval=pn1coto*cotonp_1 .if (sysmis(ppclov) and sysmis(p_clov)) clovrval=pn1clov*clovrp_1 .if (sysmis(ppotcr) and sysmis(p_otcr)) otcrpval=pn1otcr*otcrpp_1 .execute.recode riceval wheatval maizeval sorgoval barlyval soybsval favabvalpeasval cowpval chkpeval othlgval wpotaval spotaval swtpovalbeetval grnutval sesamval oliveval otoilval chilival onionvalgarlival coriaval fenugval othspval wvegeval svegeval orangvalmangoval bananval guavaval jackfval plumval otfrtval datesvalsugarval cotonval clovrval otcrpval (sysmis=0).execute.save outfile='c:\ifpri6\profits1.sav' /compressed .
COMMENT add back berseem production.GET FILE='C:\ifpri6\S12bnew2.sav' .if (pn=63) percsold=s12bq05b / s12bq04b.if (pn=63) bsalval=s12bq05c .AGGREGATE OUTFILE = 'c:\ifpri6\bersale2.sav' /BREAK = hid /bsalperc = SUM(percsold) /bsalvalu = SUM(bsalval) /psu=mean(psu) .GET FILE='C:\ifpri6\brsmonly.sav' .MATCH FILES /FILE = * /FILE='C:\ifpri6\bersale2.sav' /BY hid .COMPUTE berprice = (bsalvalu)/(bsalperc*brsmkgs) .SAVE OUTFILE='C:\ifpri6\brsmdat2.sav' /COMPRESSED
get file='c:\ifpri6\brsmdat2.sav' /drop psu.if berprice=0 berprice=sysmis(berprice) .

A-20
compute nation=1 .compute psu=trunc(hid/100).aggregate outfile = 'c:\ifpri6\brpripsu.sav' /break=psu /national=mean(nation) /brprcpsu=mean(berprice) .
get file='c:\ifpri6\brsmdata.sav' .if berprice=0 berprice=sysmis(berprice) .compute national=1 .aggregate outfile = 'c:\ifpri6\brprinat.sav' /break=national /brprcnat=mean(berprice) .
match files /file='c:\ifpri6\brpripsu.sav' /table='c:\ifpri6\brprinat.sav' /by national .save outfile='c:\ifpri6\brprtmp.sav'.get file='c:\ifpri6\brsmdat2.sav'.compute psu=trunc(hid/100).save outfile='c:\ifpri6\brsmdat3.sav' /compressed.
match files /file='c:\ifpri6\brsmdat3.sav' /table='c:\ifpri6\brprtmp.sav' /by psu .save outfile='c:\ifpri6\brprtmp2.sav' .
get file='c:\ifpri6\brprtmp2.sav' .if berprice=0 berprice=brprcnat.if brprcpsu=0 brprcpsu=brprcnat.compute brsmvalu=berprice*brsmkgs.execute.if sysmis(berprice) brsmvalu=brprcpsu*brsmkgs.execute.if (sysmis(berprice) and sysmis(brprcpsu)) brsmvalu=brprcnat*brsmkgs.save outfile='c:\ifpri6\brprtmp3.sav' /keep hid brsmvalu.
get file='c:\ifpri6\profits1.sav' .match files /file=* /file='c:\ifpri6\brprtmp3.sav' /by hid.c o m p u t egrprofit=riceval+wheatval+maizeval+sorgoval+barlyval+soybsval+favabval+ peasval+cowpval+chkpeval+othlgval+wpotaval+spotaval+swtpoval+ beetval+grnutval+sesamval+oliveval+otoilval+chilival+onionval+ garlival+coriaval+fenugval+othspval+wvegeval+svegeval+orangval+ mangoval+bananval+guavaval+jackfval+plumval+otfrtval+datesval+ sugarval+cotonval+brsmvalu+otcrpval.COMMENT clovrval is removed in the previous step to avoid double-counting.des var= riceval wheatval maizeval sorgoval barlyval soybsval favabval peasval cowpval chkpeval othlgval wpotaval spotaval swtpoval beetval grnutval sesamval oliveval otoilval chilival onionval garlival coriaval fenugval othspval wvegeval svegeval orangval mangoval bananval guavaval jackfval plumval otfrtval datesval sugarval cotonval clovrval brsmvalu otcrpval grprofit.save outfile='c:\ifpri6\profits2.sav' /compressed .save outfile='c:\ifpri6\grprofit.sav' /compressed /keep hid grprofit.
COMMENT corrections to profits (where other information was available .COMMENT from the value of sales data-variable s12bq05c in s12bnew2.sav).
COMMENT get file='c:\ifpri6\s12bnew2.sav'.COMMENT compute addrev=(s12bq04b/s12bq05b)*s12bq05c.COMMENT compute filt64=(pn=64).COMMENT filter by filt64.COMMENT save outfile='c:\ifpri6\addrevx.sav' /keep pn addrev hid.
get file='c:\ifpri6\grprofit.sav'.compute grprofi2=grprofit.

A-21
if hid=13612 grprofi2=2000+grprofit.if hid=13806 grprofi2=150+grprofit.if hid=13807 grprofi2=5050+grprofit.if hid=13811 grprofi2=650+grprofit.if hid=13818 grprofi2=1611+grprofit.if hid=13820 grprofi2=6240+grprofit.
if hid=13210 grprofi2=16000+grprofit.if hid=20602 grprofi2=600+grprofit.if hid=19016 grprofi2=1358+grprofit.if hid=19020 grprofi2=815+grprofit.
if hid=18503 grprofi2=3520+grprofit.if hid=18602 grprofi2=420+grprofit.if hid=18603 grprofi2=320+grprofit.if hid=18606 grprofi2=120+grprofit.if hid=18612 grprofi2=1000+grprofit.if hid=18619 grprofi2=480+grprofit.if hid=19015 grprofi2=150+grprofit.
if hid=13315 grprofi2=4000+grprofit.if hid=13317 grprofi2=1500+grprofit.if hid=14706 grprofi2=700+grprofit.if hid=14719 grprofi2=300+grprofit.if hid=15019 grprofi2=900+grprofit.if hid=22108 grprofi2=2700+grprofit.if hid=19413 grprofi2=560+grprofit.if hid=20714 grprofi2=326+grprofit.save outfile='c:\ifpri6\profits3.sav' /compressed.
EXAMINE VARIABLES=grprofi2 /PLOT BOXPLOT STEMLEAF HISTOGRAM NPPLOT /COMPARE VARIABLES /MESTIMATORS HUBER(1.339) ANDREW(1.34) HAMPEL(1.7,3.4,8.5) TUKEY(4.685) /PERCENTILES(5,10,25,50,75,90,95) HAVERAGE /STATISTICS DESCRIPTIVES EXTREME /CINTERVAL 95 /MISSING LISTWISE /NOTOTAL.

A-22
COMMENT file is inputs.sps .
COMMENT compiles input use and expenditures into one file, at the householdlevel .COMMENT also merges in revenue data and calculates net profits & productivity.COMMENT created July 4, 1998; verified July 9, 1998.
COMMENT ******************************************************** .COMMENT the following steps were carried out manually.COMMENT GET FILE='C:\ifpri6\S12c1m.sav'.COMMENT FORMATS hid (F8).COMMENT SAVE OUTFILE='C:\ifpri6\s12c1m.sav' /COMPRESSED.COMMENT GET FILE='C:\ifpri6\S12c2mv2.sav'.COMMENT FORMATS hid (F8).COMMENT SAVE OUTFILE='C:\ifpri6\s12c2mv2.sav' /COMPRESSED.COMMENT GET FILE='C:\ifpri6\S12c3mv2.sav'.COMMENT FORMATS hid (F8).COMMENT SAVE OUTFILE='C:\ifpri6\s12c3mv2.sav' /COMPRESSED.COMMENT GET FILE='C:\ifpri6\S12c4m.sav'.COMMENT FORMATS hid (F8).COMMENT SAVE OUTFILE='C:\ifpri6\s12c4m.sav' /COMPRESSED.COMMENT GET FILE='C:\ifpri6\S12c5mv2.sav'.COMMENT FORMATS hid (F8).COMMENT SAVE OUTFILE='C:\ifpri6\s12c5mv2.sav' /COMPRESSED.COMMENT ******************************************************** .
COMMENT purchased seeds/young plants expenditures .get file = 'c:\ifpri6\s12c1m.sav'.compute filter1=(s12c1q1=1).filter by filter1.aggregate /outfile = 'c:\ifpri6\seedplhh.sav' /break=hid /seedplxp=sum(s12c1q4).get file = 'c:\ifpri6\seedplhh.sav'.COMMENT replace missing and zero values with mean for 14 out of 517 cases.recode seedplxp (sysmis=218.23) (0=218.23).des var = seedplxp.save outfile= 'c:\ifpri6\seedphh2.sav' /compressed .
COMMENT fertilizer expenditures .get file = 'c:\ifpri6\s12c2mv2.sav'.compute filter2=(s12c2q1=1).filter by filter2.aggregate /outfile = 'c:\ifpri6\fertilhh.sav' /break=hid /fertilxp=sum(s12c2q4).get file = 'c:\ifpri6\fertilhh.sav'.COMMENT replace missing values with mean for 31 out of 535 cases.recode fertilxp (sysmis=351.44).des var = fertilxp.save outfile ='c:\ifpri6\fertihh2.sav' /compressed .
COMMENT insecticide expenditures .get file = 'c:\ifpri6\s12c3mv2.sav'.compute filter3=(s12c3q1=1).filter by filter3.aggregate /outfile = 'c:\ifpri6\insecthh.sav' /break=hid /insectxp=sum(s12c3q4).get file = 'c:\ifpri6\insecthh.sav'.COMMENT replace missing values with mean for 7 out of 324 cases.recode insectxp (sysmis=171.587).des var = insectxp.save outfile='c:\ifpri6\insechh2.sav' /compressed .
COMMENT casual hired labor expenditures .

A-23
get file = 'c:\ifpri6\s12c4m.sav'.compute filter4= (s12c4q1=1).filter by filter4.COMMENT get file='c:\ifpri6\laborhir.sav'.recode s12c4q4 s12c4q5 s12c4q6 s12c4q7 (sysmis=0).compute wintrlab=s12c4q4*s12c4q3.compute summrlab=s12c4q5*s12c4q3.compute perenlab=s12c4q6*s12c4q3.compute Nililab=s12c4q7*s12c4q3.aggregate /outfile = 'c:\ifpri6\hlaborxp.sav' /break=hid /winterlx=sum(wintrlab) /summerlx=sum(summrlab) /perenlx=sum(perenlab) /Nililx=sum(Nililab).get file = 'c:\ifpri6\hlaborxp.sav'.compute laborexp=winterlx+summerlx+perenlx+Nililx.des var = winterlx summerlx perenlx Nililx laborexp .COMMENT replace 1 value of zero with mean value for all households .recode laborexp (0=301.82) .save outfile = 'c:\ifpri6\hhlaboh2.sav' /compressed .
COMMENT expenditures on permanent workers.get file = 'c:\ifpri6\s12c5mv2.sav'.compute filter5=(s12c5q1=1).filter by filter5.aggregate /outfile = 'c:\ifpri6\pmwrkrhh.sav' /break=hid /prmwrkxp=sum(s12c5q3) /nmbrpwrk=sum(s12c5q2).get file = 'c:\ifpri6\pmwrkrhh.sav'.compute avgpwrkr=prmwrkxp/nmbrpwrk.des var = prmwrkxp nmbrpwrk avgpwrkr .COMMENT replace 4 missing and 1 zero value out of 13 with sample mean .recode prmwrkxp (sysmis=1210.625) (0=1210.625).save outfile='c:\ifpri6\prwrkhh2.sav' /compressed .
COMMENT merge expenditure files for different purchased inputs.match files /file='c:\ifpri6\seedphh2.sav' /in=s01 /file = 'c:\ifpri6\fertihh2.sav' /in=s02 /file = 'c:\ifpri6\insechh2.sav' /in=s03 /file = 'c:\ifpri6\hhlaboh2.sav' /in=s04 /file = 'c:\ifpri6\prwrkhh2.sav' /in=s05 /by hid.save outfile='c:\ifpri6\inputexp.sav' /compressed .get file='c:\ifpri6\inputexp.sav' /keep=hid seedplxp fertilxp insectxp laborexp prmwrkxp.recode seedplxp fertilxp insectxp laborexp prmwrkxp (sysmis=0).save outfile='c:\ifpri6\inpexp1.sav' /compressed.
COMMENT add in family labor.get file='c:\ifpri6\s12c6m.sav'.COMMENT format hid (f8.0) [recode manually].recode s12c6q3 s12c6q4 s12c6q5 s12c6q6 (sysmis=0).aggregate outfile='c:\ifpri6\famlabhh.sav' /break=hid /winlabhh=sum(s12c6q3) /sumlabhh=sum(s12c6q4) /perlabhh=sum(s12c6q5) /neelabhh=sum(s12c6q6).get file='c:\ifpri6\famlabhh.sav'.COMMENT fre var=tothhlab winlabhh sumlabhh perlabhh neelabhh.COMMENT retrieve valid farm households (s12aq01=1).get file='c:\ifpri6\s12a1mv2.sav'.aggregate outfile='c:\ifpri6\valprodu.sav' /break=hid /psu=mean(psu) /respno=sum(s12aq01).get file='c:\ifpri6\valprodu.sav'.COMMENT freq var=psu respno.compute filthh=(respno>0).match files /file=* /file='c:\ifpri6\hhlabhh.sav'

A-24
/by hid.select if (filthh=1).compute tothhlab=winlabhh+sumlabhh+perlabhh+neelabhh.recode tothhlab (sysmis=0).save outfile='c:\ifpri6\vlfamlab.sav'/keep=hid tothhlab.
COMMENT prepare misc. ag. revenues and expenditures file.COMMENT delete invalid households (non-farmers) from data set.
GET FILE='C:\ifpri6\S12dm.sav'.COMMENT FORMATS hid (F8) [done manually].SORT CASES BY hid (A) .match files /file=* /file='c:\ifpri6\valprodu.sav' /by hid.compute filthh=(respno>0).select if (filthh=1).recode s12dq01 s12dq02 s12dq03 s12dq04 s12dq05 s12dq06 s12dq07 s12dq08 s12dq09 s12dq10 s12dq11 s12dq12 s12dq13 s12dq14 s12dq15 s12dq16 s12dq17 s12dq18 (sysmis=0).save outfile='c:\ifpri6\othexp9d.sav'.get file='c:\ifpri6\othexp9d.sav'.
COMMENT note that expenditures are entered first (according to label).COMMENT fre var s12dq01 s12dq02 s12dq03 s12dq04 s12dq05 s12dq06 s12dq07 s12dq08 s12dq09 s12dq10 s12dq11 s12dq12 s12dq13 s12dq14 s12dq15 s12dq16 s12dq17 s12dq18 .
rename variables (s12dq01=irrig) (s12dq02=tcrop) (s12dq03=tinpt) (s12dq04=sacks) (s12dq05=storg) (s12dq06=imprv) (s12dq07=eqrep) (s12dq08=rdrft) (s12dq09=rtrac) (s12dq10=rthrs) (s12dq11=rmach) (s12dq12=otexp).save outfile='c:\ifpri6\varexp1.sav' /keep=hid psu irrig tcrop tinpt sacks storg imprv eqrep rdrft rtrac rthrs rmach otexp.
COMMENT get file='c:\ifpri6\varexp1.sav'.get file='c:\ifpri6\othexp9d.sav'.rename variables (s12dq13=byprd) (s12dq14=ydrft) (s12dq15=ytrac) (s12dq16=ythrs) (s12dq17=ymach) (s12dq18=otrev).save outfile='c:\ifpri6\varrev1.sav' /keep=hid psu byprd ydrft ytrac ythrs ymach otrev.COMMENT get file='c:\ifpri6\varrev1.sav'.
COMMENT merge in revenues earned by renting out land .COMMENT assumes in-kind payments have been converted to cash equivalent.get file='c:\ifpri6\s12a2mv2.sav'.COMMENT Format hid (f8).select if s12aq01=1.save outfile='c:\ifpri6\landrout.sav'.get file='c:\ifpri6\landrout.sav'.recode s12aq03a s12aq03b s12aq03c s12aq03d s12aq03e s12aq03f s12aq03g s12aq03h (sysmis=0).compute landincm=s12aq03a+s12aq03b+s12aq03c+s12aq03d+ s12aq03e+s12aq03f+s12aq03g+s12aq03h.aggregate outfile='c:\ifpri6\landrou2.sav' /break=hid /ldrntinc=sum(landincm).get file='c:\ifpri6\landrou2.sav'.
match files /file=* /file='c:\ifpri6\varrev1.sav' /by hid.recode ldrntinc (sysmis=0).save outfile='c:\ifpri6\varrev1a.sav'.
COMMENT keep only valid expenditures from the 'varexp1.sav' file.get file='c:\ifpri6\varexp1.sav'.

A-25
compute vlvarexp=irrig+tinpt+eqrep+rdrft+rtrac+rthrs+rmach.save outfile='c:\ifpri6\varexp2.sav' /keep=hid vlvarexp.
COMMENT create expenditure totals master file.match files /file='c:\ifpri6\inpexp1.sav' /file='c:\ifpri6\vlfamlab.sav' /file='c:\ifpri6\varexp2.sav' /by hid.compute allexp=seedplxp+fertilxp+insectxp+laborexp+prmwrkxp+vlvarexp.save outfile='c:\ifpri6\allxpns.sav'.execute.
COMMENT calculate value of equipment.GET FILE='c:\ifpri6\s12em.sav'.COMMENT format hid to numeric first.IF pn = 1 tractor=s12eq05.IF pn = 2 plow=s12eq05.IF pn = 3 cart=s12eq05.IF pn = 4 thresher=s12eq05.IF pn = 5 trolley=s12eq05.IF pn = 6 wtrpump=s12eq05.IF pn = 7 generato=s12eq05.IF pn = 8 strgbin=s12eq05.IF pn = 9 inscspry=s12eq05.IF pn = 11 other=s12eq05.COMMENT calculate number of pieces.IF pn = 1 ntractor=s12eq02.IF pn = 2 nplow=s12eq02.IF pn = 3 ncart=s12eq02.IF pn = 4 nthreshe=s12eq02.IF pn = 5 ntrolley=s12eq02.IF pn = 6 nwtrpump=s12eq02.IF pn = 7 ngenerat=s12eq02.IF pn = 8 nstrgbin=s12eq02.IF pn = 9 ninscspr=s12eq02.IF pn = 11 nother=s12eq02.aggregate outfile='c:\ifpri6\equiphh.sav' /break=hid /tractval=sum(tractor) /plowval=sum(plow) /cartval=sum(cart) /thresval=sum(thresher) /trollval=sum(trolley) /wtrpmval=sum(wtrpump) /geratval=sum(generato) /strgbval=sum(strgbin) /insecval=sum(inscspry) /tractnum=sum(ntractor) /plownum=sum(nplow) /cartnum=sum(ncart) /thresnum=sum(nthreshe) /trollnum=sum(ntrolley) /wtrpmnum=sum(nwtrpump) /geratnum=sum(ngenerat) /strgbnum=sum(nstrgbin) /insecnum=sum(ninscspr).get file='c:\ifpri6\equiphh.sav'.compute tracx=tractval*tractnum.compute plowx=plowval*plownum.compute cartx=cartval*cartnum.compute tresx=thresval*thresnum.compute trolx=trollval*trollnum.compute wtrpx=wtrpmval*wtrpmnum.compute gerax=geratval*geratnum.compute strgx=strgbval*strgbnum.compute inscx=insecval*insecnum.recode tracx plowx cartx tresx trolx wtrpx gerax strgx inscx (sysmis=0).compute capital1=tracx+plowx+cartx+tresx+trolx+wtrpx+gerax+strgx+inscx.compute capital=capital1.COMMENT replace with sample average values in cases where missing.if hid=19311 capital=capital+7000.if hid=22305 capital=capital+15000.

A-26
if hid=19311 capital=capital+400.if hid=13116 capital=capital+2348.3.if hid=17017 capital=capital+2348.3.if hid=14719 capital=capital+259.if hid=17110 capital=capital+(45*0.50).save outfile='c:\ifpri6\capitalx.sav' /keep=hid capital.
COMMENT merge in revenue and land use files .get file='c:\ifpri6\varrev1a.sav'.compute miscrev=byprd+ydrft+ytrac+ythrs+ymach+otrev+ldrntinc.save outfile='c:\ifpri6\varrev2.sav' /keep=hid miscrev.
COMMENT sub-file filename is landused.sps (up to the #### sign below).COMMENT calculates land areas cultivated in feddan.COMMENT created July 5th 1998, version 1.0 .COMMENT no distinction is presently made between owned and rented land.COMMENT (the majority of land renters rent the land for both main seasons).GET FILE='C:\ifpri6\s12a1mv2.sav'.COMPUTE fed2fed = s12aq02a .COMPUTE quir2ha = s12aq02b / 24 .RECODE fed2fed (SYSMIS=0) .RECODE quir2ha (SYSMIS=0) .COMPUTE feddan=quir2ha + fed2fed .compute rentalrt=s12aq04/feddan.compute LEperFed=s12aq06/feddan.aggregate outfile='c:\ifpri6\fedval.sav' /break=hid /feddanhh=sum(feddan) /fedvalhh=sum(s12aq06) /psu=mean(psu).get file='c:\ifpri6\fedval.sav'.compute valprfed=fedvalhh/feddanhh.COMMENT des var=feddanhh fedvalhh valprfed.COMMENT freq var=feddanhh fedvalhh valprfed.compute fedvalh2=fedvalhh.if sysmis(fedvalhh) fedvalh2=feddanhh*44147.if fedvalhh=0 fedvalh2=feddanhh*44147.compute fedcateg=feddanhh.recode fedcateg (lo thru 0.49999999=1001) (0.5 thru 0.8=1002) (0.801 thru 1.3=1003) (1.301 thru 2.2=1004) (2.201 thru high=1005).COMMENT freq var=fedcateg.COMMENT EXAMINE VARIABLES=feddanhh BY fedcateg /PLOT BOXPLOT STEMLEAF /COMPARE GROUP /STATISTICS DESCRIPTIVES /CINTERVAL 95 /MISSING LISTWISE /NOTOTAL.compute fedcate2=feddanhh.recode fedcate2 (lo thru 0.99=2001) (0.991 thru 1.99=2002) (1.991 thru 4.99999999=2003) (5.0 thru high=2004).freq var=fedcate2.COMMENT EXAMINE VARIABLES=feddanhh BY fedcate2 /PLOT BOXPLOT STEMLEAF /COMPARE GROUP /STATISTICS DESCRIPTIVES /CINTERVAL 95 /MISSING LISTWISE /NOTOTAL.COMMENT #### end of 'landused.sav' sub-file .
match files /file=* /file='c:\ifpri6\profits3.sav' /file='c:\ifpri6\varrev2.sav' file='c:\ifpri6\allxpns.sav' /file='c:\ifpri6\capitalx.sav' /by hid.compute revprfed=grprofi2/feddanhh.COMMENT examine var=revprfed BY fedcateg .examine var=revprfed by fedcate2.COMMENT examine var=revprfed by psu.compute totalrev=grprofi2+miscrev.
COMMENT the following profits are before taking out family laborCOMMENT charges, equipment costs and land costs.

A-27
compute profitsx=totalrev-allexp.compute productx=totalrev/allexp.compute famlabxp=tothhlab*6.5 .compute profitsy=totalrev-allexp-famlabxp.compute producty=totalrev/(allexp+famlabxp).compute landcost=feddanhh*2300.compute profitsz=totalrev-allexp-famlabxp-landcost.compute productz=totalrev/(allexp+famlabxp+landcost).recode capital (sysmis=0).compute capituse=capital*0.19 .compute profitxx=profitsz-capituse.compute prodctxx=totalrev/(allexp+famlabxp+landcost+capituse).des var=productx producty productz prodctxx.examine var=prodctxx by fedcateg.examine var=prodctxx by fedcate2.execute.select if feddanhh>0.select if grprofit>0. save outfile='c:\ifpri6\prodvty.sav'.select if profitsy ~= sysmis(profitsy).save outfile='c:\ifpri6\profctn.sav' /keep=hid profitsy capital feddanhh.
COMMENT the following statements check for consistency between .COMMENT values and numbers of equipment reported by farmers .COMMENT USE ALL.COMMENT COMPUTE filter_$=(tractnum > 0 & MISSING(tractval)).COMMENT FILTER BY filter_$.COMMENT FREQUENCIES VARIABLES=hid /ORDER ANALYSIS .COMMENT USE ALL.COMMENT COMPUTE filter_$=(tractval > 0 & MISSING(tractnum)).COMMENT FILTER BY filter_$.COMMENT FREQUENCIES VARIABLES=hid /ORDER ANALYSIS .COMMENT USE ALL.COMMENT COMPUTE filter_$=(plownum > 0 & MISSING(plowval)).COMMENT FILTER BY filter_$.COMMENT FREQUENCIES VARIABLES=hid /ORDER ANALYSIS .COMMENT USE ALL.COMMENT COMPUTE filter_$=(plowval > 0 & MISSING(plownum)).COMMENT FILTER BY filter_$.COMMENT FREQUENCIES VARIABLES=hid /ORDER ANALYSIS .
COMMENT USE ALL.COMMENT COMPUTE filter_$=(cartnum > 0 & MISSING(cartval)).COMMENT FILTER BY filter_$.COMMENT FREQUENCIES VARIABLES=hid /ORDER ANALYSIS .COMMENT USE ALL.COMMENT COMPUTE filter_$=(cartval > 0 & MISSING(cartnum)).COMMENT FILTER BY filter_$.COMMENT FREQUENCIES VARIABLES=hid /ORDER ANALYSIS .COMMENT USE ALL.COMMENT COMPUTE filter_$=(thresnum > 0 & MISSING(thresval)).COMMENT FILTER BY filter_$.COMMENT FREQUENCIES VARIABLES=hid /ORDER ANALYSIS .COMMENT USE ALL.COMMENT COMPUTE filter_$=(thresval > 0 & MISSING(thresnum)).COMMENT FILTER BY filter_$.COMMENT FREQUENCIES VARIABLES=hid /ORDER ANALYSIS .
COMMENT USE ALL.COMMENT COMPUTE filter_$=(trollnum > 0 & MISSING(trollval)).COMMENT FILTER BY filter_$.COMMENT FREQUENCIES VARIABLES=hid /ORDER ANALYSIS .COMMENT USE ALL.

A-28
COMMENT COMPUTE filter_$=(trollval > 0 & MISSING(trollnum)).COMMENT FILTER BY filter_$.COMMENT FREQUENCIES VARIABLES=hid /ORDER ANALYSIS .COMMENT USE ALL.COMMENT COMPUTE filter_$=(wtrpmnum > 0 & MISSING(wtrpmval)).COMMENT FILTER BY filter_$.COMMENT FREQUENCIES VARIABLES=hid /ORDER ANALYSIS .COMMENT USE ALL.COMMENT COMPUTE filter_$=(wtrpmval > 0 & MISSING(wtrpmnum)).COMMENT FILTER BY filter_$.COMMENT FREQUENCIES VARIABLES=hid /ORDER ANALYSIS .
COMMENT USE ALL.COMMENT COMPUTE filter_$=(geratnum > 0 & MISSING(geratval)).COMMENT FILTER BY filter_$.COMMENT FREQUENCIES VARIABLES=hid /ORDER ANALYSIS .COMMENT USE ALL.COMMENT COMPUTE filter_$=(geratval > 0 & MISSING(geratnum)).COMMENT FILTER BY filter_$.COMMENT FREQUENCIES VARIABLES=hid /ORDER ANALYSIS .COMMENT USE ALL.COMMENT COMPUTE filter_$=(strgbnum > 0 & MISSING(strgbval)).COMMENT FILTER BY filter_$.COMMENT FREQUENCIES VARIABLES=hid /ORDER ANALYSIS .COMMENT USE ALL.COMMENT COMPUTE filter_$=(strgbval > 0 & MISSING(strgbnum)).COMMENT FILTER BY filter_$.COMMENT FREQUENCIES VARIABLES=hid /ORDER ANALYSIS .
COMMENT USE ALL.COMMENT COMPUTE filter_$=(insecnum > 0 & MISSING(insecval)).COMMENT FILTER BY filter_$.COMMENT FREQUENCIES VARIABLES=hid /ORDER ANALYSIS .COMMENT USE ALL.COMMENT COMPUTE filter_$=(insecval > 0 & MISSING(insecnum)).COMMENT FILTER BY filter_$.COMMENT FREQUENCIES VARIABLES=hid /ORDER ANALYSIS .

A-29
COMMENT filename is inputs2.sps
COMMENT calculates expenditures by crop (and labor use by task) .COMMENT created 26-SEP-1998 .
COMMENT seed expenditures .get file = 'c:\ifpri6\s12c1m.sav'.compute filter1=(s12c1q1=1).filter by filter1.aggregate /outfile = 'c:\ifpri6\seedplhh.sav' /break=hid pn /seedplxp=sum(s12c1q4).get file = 'c:\ifpri6\seedplhh.sav'.MEANS TABLES=seedplxp BY pn /CELLS MEAN COUNT STDDEV .
COMMENT fertilizer expenditures by crop .get file = 'c:\ifpri6\s12c2mv2.sav'.compute filter2=(s12c2q1=1).filter by filter2.aggregate /outfile = 'c:\ifpri6\fertilhh.sav' /break=hid pn/fertilxp=sum(s12c2q4).get file = 'c:\ifpri6\fertilhh.sav'.MEANS TABLES=fertilxp BY pn /CELLS MEAN COUNT STDDEV .
COMMENT insecticide expenditures by crop .get file = 'c:\ifpri6\s12c3mv2.sav'.compute filter3=(s12c3q1=1).filter by filter3.aggregate /outfile = 'c:\ifpri6\insecthh.sav' /break=hid pn/insectxp=sum(s12c3q4).get file = 'c:\ifpri6\insecthh.sav'.MEANS TABLES=insectxp BY pn /CELLS MEAN COUNT STDDEV .
COMMENT hired labor use by task .get file = 'c:\ifpri6\s12c4m.sav'.compute filter4= (s12c4q1=1).filter by filter4.COMMENT get file='c:\ifpri6\laborhir.sav'.recode s12c4q4 s12c4q5 s12c4q6 s12c4q7 (sysmis=0).compute wintrlab=s12c4q4*s12c4q3.compute summrlab=s12c4q5*s12c4q3.compute perenlab=s12c4q6*s12c4q3.compute Nililab=s12c4q7*s12c4q3.aggregate /outfile = 'c:\ifpri6\hlaborxp.sav' /break=hid pn /winterlx=sum(wintrlab) /summerlx=sum(summrlab) /perenlx=sum(perenlab) /Nililx=sum(Nililab).get file = 'c:\ifpri6\hlaborxp.sav'.MEANS TABLES=winterlx summerlx perenlx Nililx BY pn /CELLS MEAN COUNT STDDEV .
COMMENT family labor use by task .get file='c:\ifpri6\s12c6m.sav'.COMMENT format hid (f8.0) [recode manually].recode s12c6q3 s12c6q4 s12c6q5 s12c6q6 (sysmis=0).aggregate outfile='c:\ifpri6\famlabhh.sav' /break=hid pn /winlabhh=sum(s12c6q3) /sumlabhh=sum(s12c6q4) /perlabhh=sum(s12c6q5) /neelabhh=sum(s12c6q6).

A-30
get file='c:\ifpri6\famlabhh.sav'.MEANS TABLES=winlabhh sumlabhh perlabhh neelabhh BY pn /CELLS MEAN COUNT STDDEV .

A-31
COMMENT filename is prfuprep.sps .COMMENT purpose is to set up the profit function estimation .
get file='c:\ifpri6\profits1.sav' /keep=hid pprice ppwhea ppmaiz ppsorg ppcoto pn1rice pn1whea pn1maiz pn1sorg pn1coto p_rice p_whea p_maiz p_sorg p_coto.match files /file=* /file='c:\ifpri6\brprtmp2.sav' /by hid.execute.compute bersp=berprice.if sysmis(berprice) bersp=brprcpsu.if (sysmis(berprice) and sysmis(brprcpsu)) bersp=brprcnat.compute cotop=ppcoto.if sysmis(ppcoto) cotop=p_coto.if (sysmis(ppcoto) and sysmis(p_coto)) cotop=pn1coto.compute sorgp=ppsorg.if sysmis(ppsorg) sorgp=p_sorg.if (sysmis(ppsorg) and sysmis(p_sorg)) sorgp=pn1sorg. compute maizp=ppmaiz.if sysmis(ppmaiz) maizp=p_maiz.if (sysmis(ppmaiz) and sysmis(p_maiz)) maizp=pn1maiz. compute wheap=ppwhea.if sysmis(ppwhea) wheap=p_whea.if (sysmis(ppwhea) and sysmis(p_whea)) wheap=pn1whea. compute ricep=pprice.if sysmis(pprice) ricep=p_rice.if (sysmis(pprice) and sysmis(p_rice)) ricep=pn1rice. save outfile='c:\ifpri6\prointrm.sav' /keep=hid bersp cotop sorgp maizp wheap ricep.get file='c:\ifpri6\prointrm.sav'.match files /file=* /file='c:\ifpri6\profctn.sav' /by hid.select if profitsy ~= sysmis(profitsy).save outfile='c:\ifpri6\profctn1.sav'.if (bersp=0) bersp=0.08.
COMMENT estimate parameters of a generalized Leontief profit function.compute p1=ricep.compute p2=wheap.compute p3=maizp.compute p4=sorgp.compute p5=cotop.compute p6=bersp.compute p1p2=sqrt(p1*p2).compute p1p3=sqrt(p1*p3).compute p1p4=sqrt(p1*p4).compute p1p5=sqrt(p1*p5).compute p1p6=sqrt(p1*p6).compute p2p3=sqrt(p2*p3).compute p2p4=sqrt(p2*p4).compute p2p5=sqrt(p2*p5).compute p2p6=sqrt(p2*p6).compute p3p4=sqrt(p3*p4).compute p3p5=sqrt(p3*p5).compute p3p6=sqrt(p3*p6).compute p4p5=sqrt(p4*p5).compute p4p6=sqrt(p4*p6).compute p5p6=sqrt(p5*p6).compute p1c1=p1*capital.compute p1c2=p1*feddanhh.compute p2c1=p2*capital.compute p2c2=p2*feddanhh.compute p3c1=p3*capital.compute p3c2=p3*feddanhh.compute p4c1=p4*capital.

A-32
compute p4c2=p4*feddanhh.compute p5c1=p5*capital.compute p5c2=p5*feddanhh.compute p6c1=p6*capital.compute p6c2=p6*feddanhh.execute.
COMMENT estimate a generalized Leontief profit function,REGRESSION /MISSING LISTWISE /STATISTICS COEFF OUTS R ANOVA /CRITERIA=PIN(.05) POUT(.10) /NOORIGIN /DEPENDENT profitsy /METHOD=ENTER p1 p2 p3 p4 p5 p6 p1p2 p1p3 p1p4 p1p5 p1p6 p2p3 p2p4 p2p5 p2p6 p3p4 p3p5 p3p6 p4p5 p4p6 p5p6 p1c1 p1c2 p2c1 p2c2 p3c1 p3c2 p4c1 p4c2 p5c1 p5c2 p6c1 p6c2 .REGRESSION /MISSING LISTWISE /REGWGT=feddanhh /STATISTICS COEFF OUTS R ANOVA /CRITERIA=PIN(.05) POUT(.10) /NOORIGIN /DEPENDENT profitsy /METHOD=ENTER p1 p2 p3 p4 p5 p6 p1p2 p1p3 p1p4 p1p5 p1p6 p2p3 p2p4 p2p5 p2p6 p3p4 p3p5 p3p6 p4p5 p4p6 p5p6 p1c1 p1c2 p2c1 p2c2 p3c1 p3c2 p4c1 p4c2 p5c1 p5c2 p6c1 p6c2 .
COMMENT estimate a normalized quadratic profit function.compute normalpi=profitsy/wheap.compute n1=ricep/wheap.compute n2=maizp/wheap.compute n3=sorgp/wheap.compute n4=cotop/wheap.compute n5=bersp/wheap.compute n1n2=n1*n2.compute n1n3=n1*n3.compute n1n4=n1*n4.compute n1n5=n1*n5.compute n2n3=n2*n3.compute n2n4=n2*n4.compute n2n5=n2*n5.compute n3n4=n3*n4.compute n3n5=n3*n5.compute n4n5=n4*n5.compute c=capital.compute l=feddanhh.compute n1c=n1*c.compute n1l=n1*l.compute n2c=n2*c.compute n2l=n2*l.compute n3c=n3*c.compute n3l=n3*l.compute n4c=n4*c.compute n4l=n4*l.compute n5l=n5*l.compute n5c=n5*c.execute.
REGRESSION /MISSING LISTWISE /STATISTICS COEFF OUTS R ANOVA /CRITERIA=PIN(.05) POUT(.10)

A-33
/NOORIGIN /DEPENDENT normalpi /METHOD=ENTER n1 n2 n3 n4 n1n2 n1n3 n1n4 n2n3 n2n4 n3n4 n2c n3c n4c n5 n1n5 n2n5 n3n5 n4n5 n1c n1l n2l n3l n4l n5l .REGRESSION /MISSING LISTWISE /REGWGT=feddanhh /STATISTICS COEFF OUTS R ANOVA /CRITERIA=PIN(.05) POUT(.10) /NOORIGIN /DEPENDENT normalpi /METHOD=ENTER n1 n2 n3 n4 n1n2 n1n3 n1n4 n2n3 n2n4 n3n4 n2c n3c n4c n5 n1n5 n2n5 n3n5 n4n5 n1c n1l n2l n3l n4l n5l .

A-34
comment syntax file name is prmkt.sps .comment produces crosstabs for input and output marketing characteristics.
comment use of improved seed varieties.GET FILE='C:\ifpri6\s12bnew2.sav' /keep=hid psu pn s12bq03 s12bq05d s12bq05e.select if ((pn=1) or (pn=2) or (pn=3) or (pn=4) or (pn=60) or (pn=63)).save outfile='c:\ifpri6\prmkt.sav'.get file='c:\ifpri6\prmkt.sav'.value labels pn 1 'Rice' 2 'Wheat' 3 'Maize' 4 'Sorgho' 60 'Cotton' 63 'Berseem'.CROSSTABS /TABLES=pn BY s12bq03 /FORMAT= AVALUE TABLES /CELLS= COUNT ROW.
comment use of purchased seeds and young plants.GET FILE='C:\ifpri6\s12c1m.sav'.select if ((pn=1) or (pn=2) or (pn=3) or (pn=4) or (pn=60) or (pn=63)).save outfile='c:\ifpri6\seedmkt.sav'.get file='c:\ifpri6\seedmkt.sav'.value labels pn 1 'Rice' 2 'Wheat' 3 'Maize' 4 'Sorgho' 60 'Cotton' 63 'Berseem'.CROSSTABS /TABLES=pn BY s12c1q1 /FORMAT= AVALUE TABLES /CELLS= COUNT ROW.CROSSTABS /TABLES=pn BY s12c1q3 /FORMAT= AVALUE TABLES /CELLS= COUNT ROW.CROSSTABS /TABLES=pn BY s12c1q5 /FORMAT= AVALUE TABLES /CELLS= COUNT ROW.CROSSTABS /TABLES=pn BY s12c1q6 /FORMAT= AVALUE TABLES /CELLS= COUNT ROW.CROSSTABS /TABLES=pn BY s12c1q7 /FORMAT= AVALUE TABLES /CELLS= COUNT ROW.CROSSTABS /TABLES=pn BY s12c1q8 /FORMAT= AVALUE TABLES /CELLS= COUNT ROW.
comment use of fertilizer.GET FILE='C:\ifpri6\s12c2mv2.sav'.select if ((pn=1) or (pn=2) or (pn=3) or (pn=4) or (pn=60) or (pn=63)).save outfile='c:\ifpri6\fertmkt.sav'.get file='c:\ifpri6\fertmkt.sav'.value labels pn 1 'Rice' 2 'Wheat' 3 'Maize' 4 'Sorgho' 60 'Cotton' 63 'Berseem'.CROSSTABS /TABLES=pn BY s12c2q1 /FORMAT= AVALUE TABLES /CELLS= COUNT ROW.CROSSTABS /TABLES=pn BY s12c2q3 /FORMAT= AVALUE TABLES /CELLS= COUNT ROW.CROSSTABS /TABLES=pn BY s12c2q5 /FORMAT= AVALUE TABLES /CELLS= COUNT ROW.CROSSTABS /TABLES=pn BY s12c2q6 /FORMAT= AVALUE TABLES /CELLS= COUNT ROW.CROSSTABS /TABLES=pn BY s12c2q7 /FORMAT= AVALUE TABLES /CELLS= COUNT ROW.CROSSTABS /TABLES=pn BY s12c2q8 /FORMAT= AVALUE TABLES /CELLS= COUNT ROW.
comment use of insecticides.GET FILE='C:\ifpri6\s12c3mv2.sav'.select if ((pn=1) or (pn=2) or (pn=3) or (pn=4) or (pn=60) or (pn=63)).save outfile='c:\ifpri6\insecmkt.sav'.get file='c:\ifpri6\insecmkt.sav'.

A-35
value labels pn 1 'Rice' 2 'Wheat' 3 'Maize' 4 'Sorgho' 60 'Cotton' 63 'Berseem'.CROSSTABS /TABLES=pn BY s12c3q1 /FORMAT= AVALUE TABLES /CELLS= COUNT ROW.CROSSTABS /TABLES=pn BY s12c3q3 /FORMAT= AVALUE TABLES /CELLS= COUNT ROW.CROSSTABS /TABLES=pn BY s12c3q5 /FORMAT= AVALUE TABLES /CELLS= COUNT ROW.CROSSTABS /TABLES=pn BY s12c3q6 /FORMAT= AVALUE TABLES /CELLS= COUNT ROW.CROSSTABS /TABLES=pn BY s12c3q7 /FORMAT= AVALUE TABLES /CELLS= COUNT ROW.CROSSTABS /TABLES=pn BY s12c3q8 /FORMAT= AVALUE TABLES /CELLS= COUNT ROW.
comment output marketing characteristics.GET FILE='C:\ifpri6\s12bnew2.sav' /keep=hid psu pn s12bq03 s12bq05d s12bq05e.select if ((pn=1) or (pn=2) or (pn=3) or (pn=4) or (pn=60) or (pn=63)).save outfile='c:\ifpri6\prmkt.sav'.get file='c:\ifpri6\prmkt.sav'.value labels pn 1 'Rice' 2 'Wheat' 3 'Maize' 4 'Sorgho' 60 'Cotton' 63 'Berseem'.CROSSTABS /TABLES=pn BY s12bq05d /FORMAT= AVALUE TABLES /CELLS= COUNT ROW.CROSSTABS /TABLES=pn BY s12bq05e /FORMAT= AVALUE TABLES /CELLS= COUNT ROW.