monitoring water quality in central puget sound during the
TRANSCRIPT


Science SeminarNovember 2, 2017
Stephanie Jaeger, Kimberle Stark, Wendy Eash-Loucks
Jeff Lafer
Water and Land Resources Division
Wastewater Treatment Division
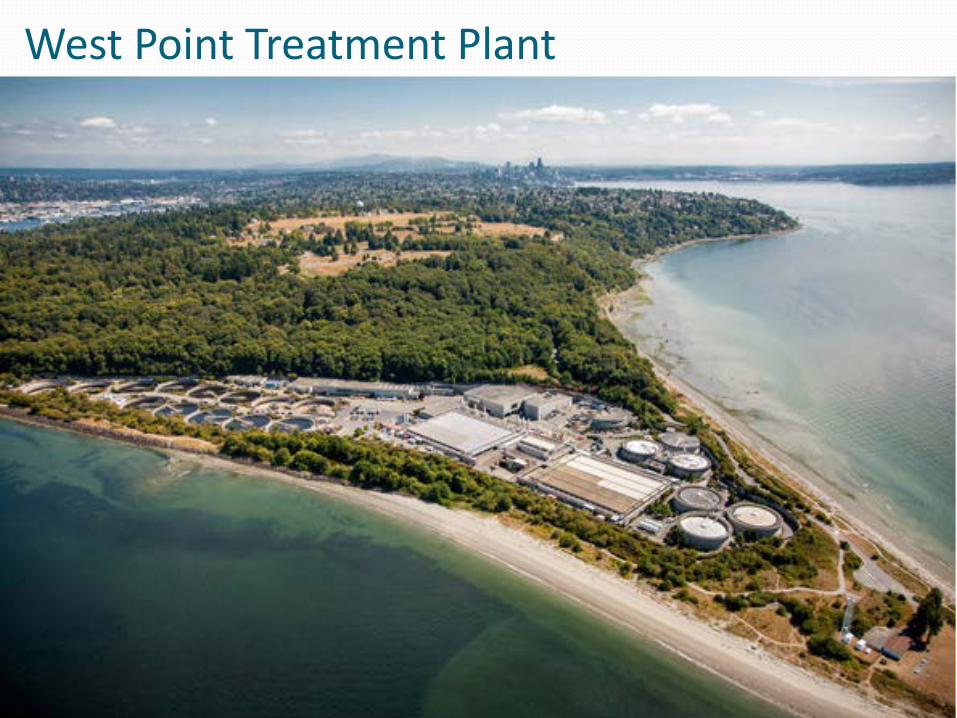
West Point Treatment Plant
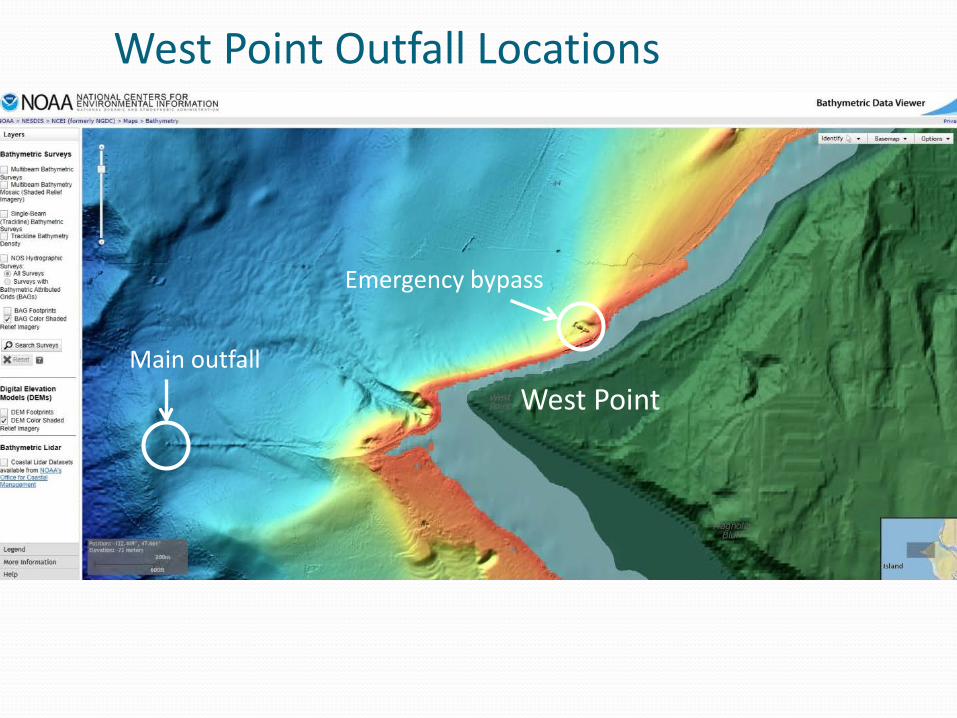
West Point Outfall Locations
Main outfall
Emergency bypass
West Point


How Do We Monitor Water Quality?
• Offshore & beach waters• Physical, chemical, & biological indicators• Routine sampling for decades
• Event response – beach waters• Fecal indicator bacteria; incident-dependent
• Moorings: since 2008• Automated sensors sample every 15-min
• Phytoplankton• Semi-Quantitative and FlowCam since 2014
• Zooplankton• Sediments (offshore and beach)

Timeline of EventsFeb. 9th : flood and emergency bypass; Beaches closed
Feb. 15-16th : Emergency bypass
Feb. 21st : Beaches reopened
May 10th-presentAll permit discharge limits are met
Apr. 27th : Restoration of full secondary treatment processes
Limited Primary Treatment During Restoration;Flows diverted to combined sewer overflow (CSO) facilities
Full Secondary Treatment
© Wonderlane
Mar. 30th : Partial secondary treatment begins

Increased sample frequency to weekly
Bi-weekly reporting online
Added nitrate sensor profiles (with help from Dept. of Ecology)
Trace metals water column analysis
Sediments sampled in summer
Organism tissues sampled (fish, clams, crab, and zooplankton)
Puget Sound MonitoringDuring Restoration Beach - Weekly
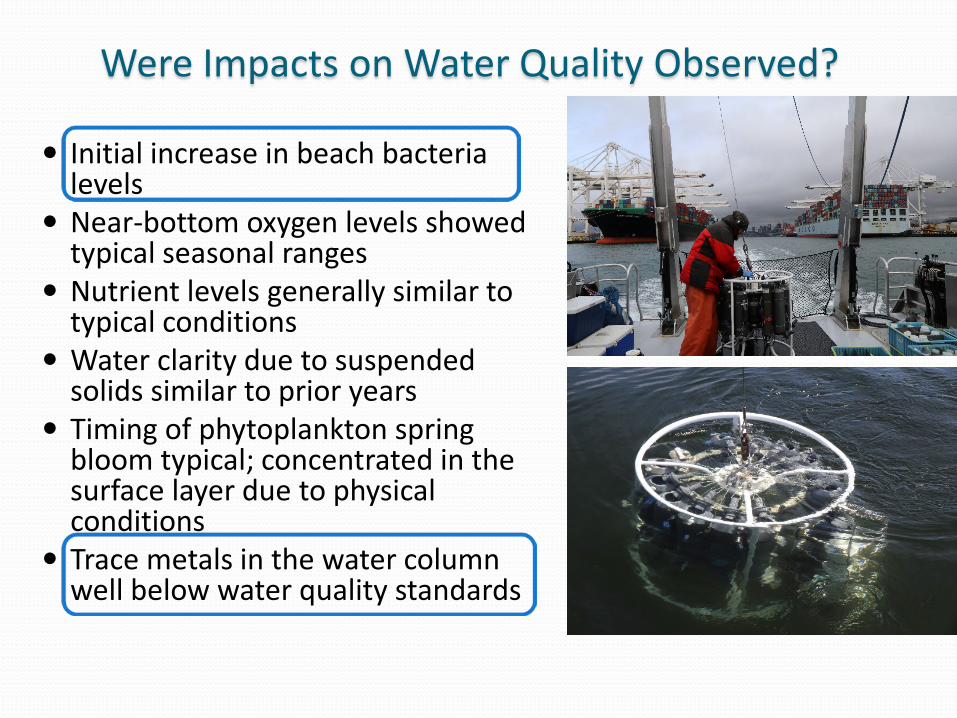
Initial increase in beach bacteria levels
Near-bottom oxygen levels showed typical seasonal ranges
Nutrient levels generally similar to typical conditions
Water clarity due to suspended solids similar to prior years
Timing of phytoplankton spring bloom typical; concentrated in the surface layer due to physical conditions
Trace metals in the water column well below water quality standards
Were Impacts on Water Quality Observed?
West Point Golden Gardens Carkeek
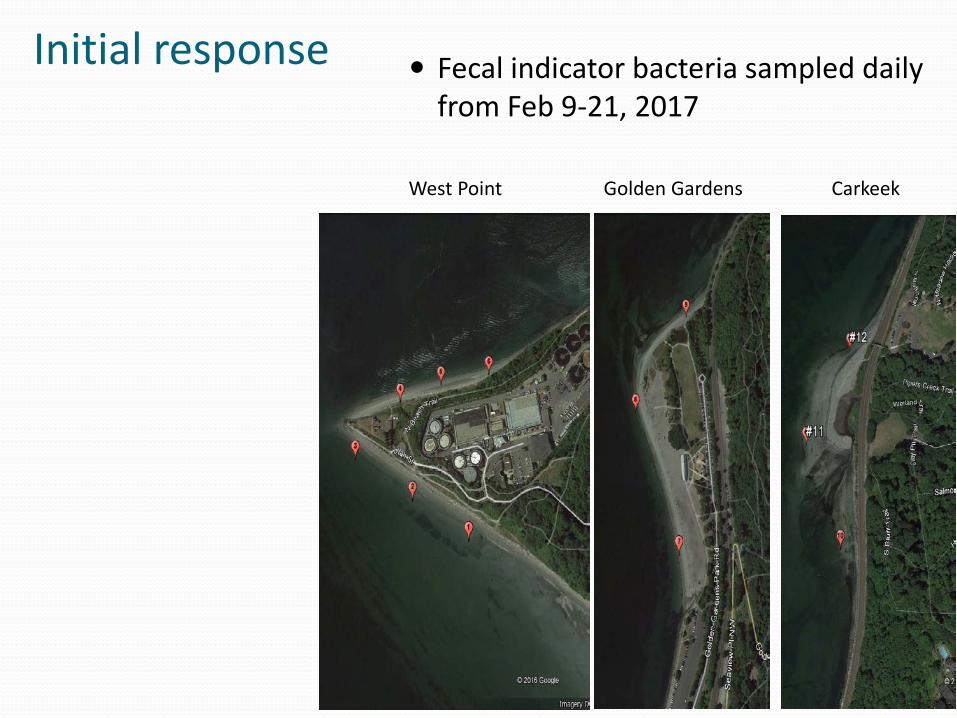
Fecal indicator bacteria sampled daily from Feb 9-21, 2017
Initial response

West Point Golden Gardens Carkeek
Fecal indicator bacteria sampled daily from Feb 9-21, 2017
Initial response

Feb. 9th
Bacteria Levels

Feb. 10th
Bacteria Levels

Feb. 11th
Bacteria Levels
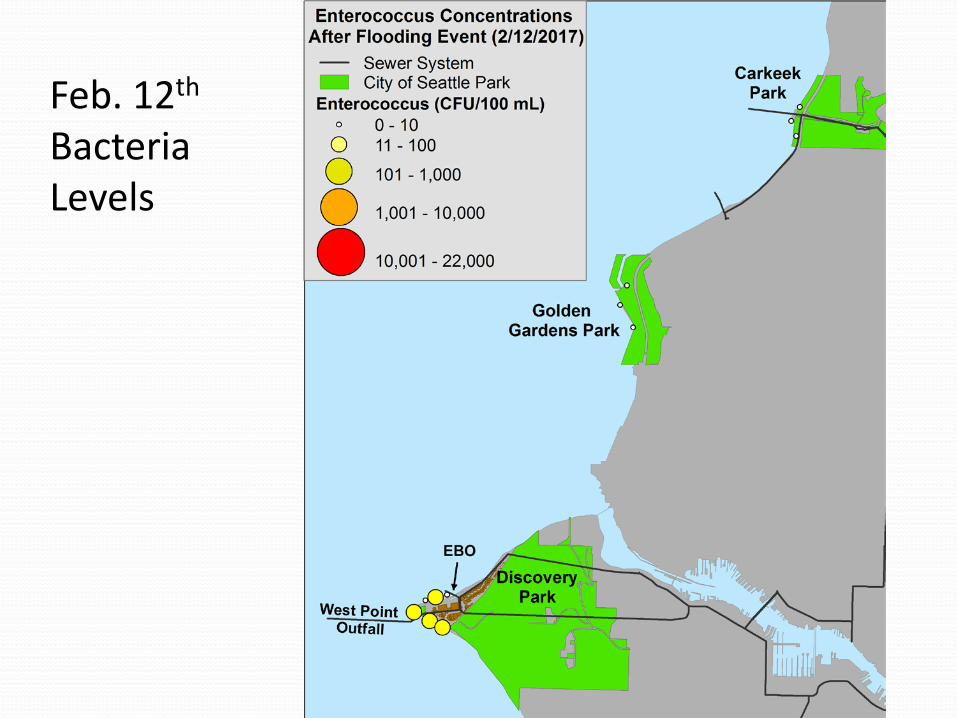
Feb. 12th
Bacteria Levels

Daily fecal coliform levels variable; met permit limits throughout restoration
Total suspended solids (TSS) and carbonaceous biological oxygen demand (CBOD) did not meet permit limits until May 10th
Nutrient levels generally similar to typical conditions
Trace metals elevated from recent ranges; below historic levels and met mixing zone standards
Acute & chronic toxicity tests showed no impacts on aquatic organisms in the lab
What was observed in the West Point effluent?

Example – Total Copper in Effluent
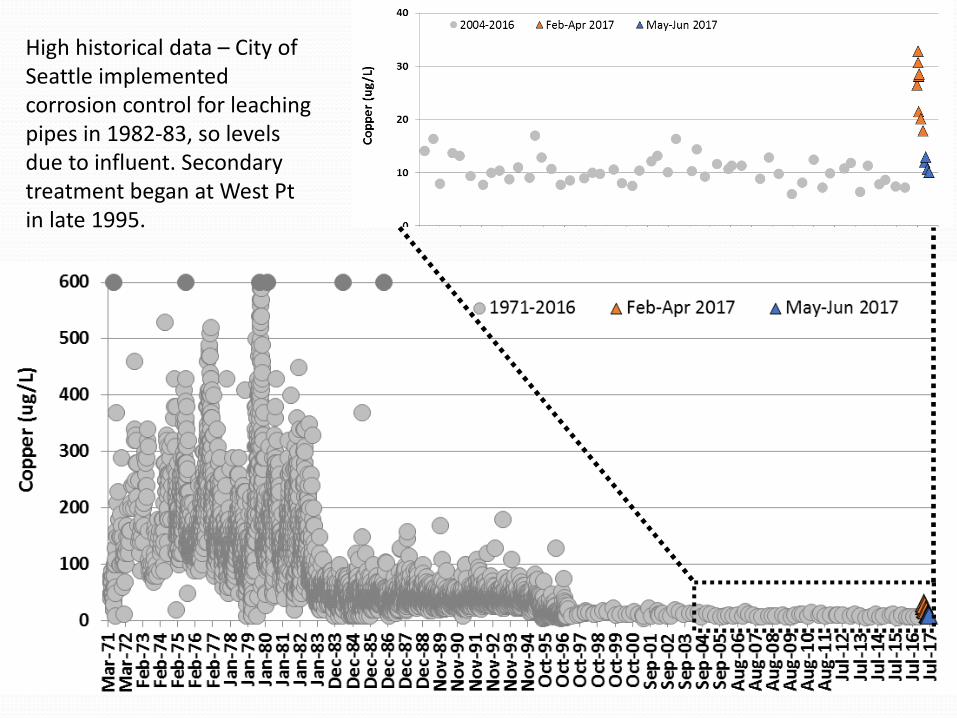
High historical data – City of Seattle implemented corrosion control for leaching pipes in 1982-83, so levels due to influent. Secondary treatment began at West Pt in late 1995.

Chronic marine water quality standard (dissolved) = 3.1 ug/L
Total Copper at the West Point outfall site in Puget SoundTo
tal C
oppe
r (ug
/L)
Depth (m)

Comparison of dissolved metals to state standards
Most Protective Marine Water Quality Criteria by Metal

West Point
Mixing, tidal currents, and outfall depth contribute to the fate and dispersal of West
Point effluent
Ebb
Floodtide

Summary Points
Increase in fecal indicator bacteria with Feb. dischargesWest Point effluent: some elevated levels of materials and
did not meet all permit discharge limits during restorationChronic and acute toxicity tests on aquatic organisms were negative
Other water quality indicators showed typical seasonal patterns and ranges in Central Puget SoundState marine water quality standards were met
Mixing and tidal currents contributed to fate and dispersal Sediment and organism tissue analyses next in order to
understand any other potential impacts

Thank you!Contributors:
King County Environmental Lab staff for intensivefield sampling and lab analysis
West Point Treatment Plant staff for intensivework during restoration process and photo credits
Bruce Nairn: WTD Modeling

Reports and Next Steps
Bi-weekly water quality summary reports during the restoration are available at http://kingcounty.gov/depts/dnrp/wtd/system/west/west-point-restoration/marine-monitoring.aspx
Effluent and water quality summary report for receiving waters expected by late 2017/early 2018
Sediment and tissue sampling reports are expected in 2018
West Point TP restoration near-field effluent mixing water quality analysis report is available at http://kingcounty.gov/~/media/depts/dnrp/wtd/system/WP/restoration/enviro-mon/170623_WP-priority-pollutant-data-update.ashx?la=en