monmouth real estate investment corporation securities eugene w. landy ... $20 $30 $40 $50 $60 $70...
TRANSCRIPT

Monmouth Real Estate Investment Corporation
2015 Annual Report
Monmouth Real EstateInvestment Corporation
A Public REIT Since 1968 NYSE: MNR
www.mreic.com
3499 Route 9 North Freehold, New Jersey 07728732.577.9996
2015 A
nnual Report
Monm
outh Real E
state Investment C
orporation

This is not yesterday’s warehouse,
CORPOR ATE INFORMATIONCORPORATE OFFICE 3499 Route 9 North Freehold, NJ 07728
INDEPENDENT AUDITORS PKF O’Connor Davies 665 Fifth Avenue New York, NY 10022
TRANSFER AGENT & REGISTRAR American Stock Transfer & Trust Company 6201 15th Avenue Brooklyn, NY 11219
COMMON STOCK LISTING NYSE:MNR
www.mreic.com
DIRECTORSANNA T. CHEW Certified Public Accountant Vice President and Chief Financial Officer UMH Properties, Inc.
BRIAN HAIMM Chief Financial Officer and Chief Operating Officer Ascend Capital
MICHAEL P. LANDY President and Chief Executive Officer
DANIEL D. CRONHEIM Attorney-at-Law Executive Vice President, General Counsel David Cronheim Company
NEAL HERSTIK Attorney-at-Law Gross, Truss & Herstik, PC
SAMUEL A. LANDY Attorney-at-Law President and Chief Executive Officer UMH Properties, Inc.
CATHERINE B. ELFLEIN Senior Director Risk Management Celgene Corporation
MATTHEW I. HIRSCH Attorney-at-Law Law Office of Matthew I. Hirsch
SCOTT L. ROBINSON Managing Director Oberon Securities
EUGENE W. LANDY Chairman of the Board
STEPHEN B. WOLGIN Managing Director U.S. Real Estate Advisors, Inc.
OFFICERS AND MANAGEMENTEUGENE W. LANDY Chairman of the Board
MICHAEL P. LANDY President and Chief Executive Officer
KEVIN S. MILLER Chief Financial and Accounting Officer, and Treasurer
ALLISON NAGELBERG General Counsel
MICHAEL D. PRASHAD In House Counsel
RICHARD MOLKE Vice President of Asset Management
SUSAN M. JORDAN Vice President of Investor Relations
KATIE RYTTER Controller
ALLISON VISCARDI Senior Property Manager
CRYSTAL GLAS Executive Assistant
LAURA TEMAN Assistant Controller
ASHLEY TRIPODI Assistant Property Manager
ELIZABETH CHIARELLA Secretary
Des
ign
by A
ddis
on w
ww
.add
ison
.com

this is an essential part of today’s Internet Ecosystem.
Mon
mou
th R
eal E
stat
e In
vest
men
t Cor
pora
tion
2015
Ann
ual R
epor
t

85%
Growth
7.5
8.5
9.6
11.2
14.0
Tota
l Squ
are
Feet
(in
Mill
ions
)
6.0
FY11 FY12 FY13 FY14 FY15
7.0
8.0
9.0
10.0
11.0
12.0
13.0
14.0
VALUE IN ACTION
GROSS LEASABLE AREA
02

OCCUPANCY 96%Average
FY11 FY12 FY13 FY14 FY15
97.1%
95.2%96.0% 95.9%
97.7%
70%
75%
80%
85%
90%
95%
100%
03
Mon
mou
th R
eal E
stat
e In
vest
men
t Cor
pora
tion
2015
Ann
ual R
epor
t

TOTAL MARKET CAPITALIZATION
VALUE IN ACTION
GROSS REVENUE
102%
Growth
$69.7
$81.7
$59.2$56.9$51.2
FY11 FY12 FY13 FY14 FY15
$80
$20
$30
$40
$50
$60
$70
$90
$ in
Mill
ions
FY11 FY12 FY13 FY14 FY15
$ in
Mill
ions
$582.6
$818.2 $786.8
$1,000.9
$1,175.7
29
1.7 4
55
.4 576
.9
60
5.7
40
3.5
53
.5
111.
0
111.
0
111.
0
111.
0
23
7.4
25
1.8
313
.0
45
9.0
27
2.3
Debt
Preferred
Equity$0
$200
$400
$600
$800
$1,000
$1,200
60%
Growth
04

TOTAL RETURN PERFORMANCE
ADJUSTED FUNDS FROM OPER ATIONS
FY11 FY12 FY13 FY14 FY15
$35
$30
$0
$5
$10
$15
$20
$25
$ in
Mill
ions
$18.0 $17.7$19.5
$25.8
$34.0
89%
Growth
12/3
1/13
12/3
1/11
12/3
1/0
8
12/3
1/0
9
06
/30
/14
06
/30
/12
06
/30
/09
06
/30
/10
12/3
1/14
12/3
1/12
12/3
1/10
12/3
1/0
7
06
/30
/15
06
/30
/13
06
/30
/11
06
/30
/08
12/3
1/15
MNR
RMS
S&P 500
126.1%
79.7%
65.7%
-100%
-50%
0%
50%
100%
150%
05
Mon
mou
th R
eal E
stat
e In
vest
men
t Cor
pora
tion
2015
Ann
ual R
epor
t

FedEx Ground, Alliance International Airport, Dallas/Fort Worth, Texas MSA, 305,000 sf
The Coca-Cola Company, Phoenix, Arizona MSA, 283,000 sf
VALUE IN ACTION
SELECT PROPERTIES06

Milwaukee Electric Tool Company, Memphis, Tennessee MSA, 615,000 sf
Best Buy Warehousing Logistics, Inc., Cleveland, Ohio MSA, 368,000 sf
07
Mon
mou
th R
eal E
stat
e In
vest
men
t Cor
pora
tion
2015
Ann
ual R
epor
t

Note: Recent Acquisitions include all acquisitions in Fiscal 2015 and Q1 2016.
Existing Properties
Recent Acquisitions
MREIC owns 93 properties. Our gross leasable area is now 14.4 million square feet, geographically diversified across 29 states.
VALUE IN ACTION
PROPERTY LOCATIONS
08

09
Mon
mou
th R
eal E
stat
e In
vest
men
t Cor
pora
tion
2015
Ann
ual R
epor
t

JANUARY, 2016 DEAR SHAREHOLDERS:
It has been said that “This time is differ-ent” are the four most expensive words the investment world has ever known. The reason they say this is because people tend to forget past lessons and fall prey to pitfalls that are neither unique nor uncommon. Yet the truly extraordinary opportunities are only experienced by those who can recognize when things really will be differ-ent this time.
Since the 1980’s the digital revolution has been unfolding. As you’ve undoubt-edly noticed, this revolution has radically changed the world we live in. The analog technology of typewriters, pay phones, dis-posable cameras, snail mail and other relics of the linear world are long gone. The speed of change brought on by digitization has been remarkable. The immense productiv-ity gains spreading throughout the global economy dwarf those of the industrial rev-olution. Our planet is now interconnected in countless ways. Consumers anywhere can search through all of the world’s goods from the confines of their own homes any-time they so desire. Global currencies can flow freely and rapidly across all markets and asset classes, leaving central bankers perplexed that their old policy methods have lost much of their potency. The changes that this new world order will bring will only get more profound with time.
At Monmouth Real Estate Investment Corporation (Monmouth), we have worked diligently to position ourselves to benefit from the structural changes the digital revo-lution requires. While fiscal 2015 saw great achievements for our Company, we are very confident that the best is yet to come.
Fiscal 2015 was an excellent year for Monmouth. Our long-term, qualitative focus has enabled us to put together a
best-in-class industrial property portfo-lio. As a result of our strong asset base, Monmouth outperformed this year on several fronts. To highlight some of our many accomplishments, during fiscal 2015 the Company:
• Acquired 2.7 million square feet of high-quality industrial space for $192 mil-lion, representing a 24% increase in our gross leasable area
• Renewed all six leases that were sched-uled to expire in fiscal 2015, resulting in a 100% tenant retention rate
• Increased rents on lease renewals by 6.3% on a GAAP basis
• Completed four property expansions and have several additional expan-sions underway
• Achieved a sector-leading 97.7% occu-pancy rate
• Increased occupancy an additional 180 basis points to 99.5% effective January 1, 2016
• Increased our total market capitalization by 17% to $1.2 billion at fiscal yearend
• Increased Net Operating Income by 22% to $65.3 million
• Generated AFFO per diluted share growth of 10%
• Raised $48.4 million in equity through our Dividend Reinvestment and Stock Purchase Plan
• Entered into commitments to acquire nine build-to-suit industrial proper-ties containing 2.4 million square feet, all leased long-term to investment- grade tenants, at an aggregate cost of $249.2 million
• Increased our common stock dividend by 6.7% on October 1, 2015.
Formed in 1968, Monmouth is one of the oldest publicly-traded REITs. We are also one of the most specialized. Our focus is on single-tenant, net-leased industrial properties on long-term leases, to invest-ment- grade tenants. Over our long history valuable relationships have been established that have been instrumental to our success. We have put together a best-in-class industrial property portfolio with an all-star tenant roster that includes: Anheuser-Busch, Beam Suntory, Cardinal Health, Caterpillar, Coca-Cola, ConAgra, Dr Pepper Snapple, FedEx, Home Depot, International Paper, Keebler/Kellogg’s, Milwaukee Tool, National Oilwell Varco, PP&G, Sherwin-Williams, Siemens, ULTA Cosmetics, and United Technologies. With 85% of our rental revenue derived from investment- grade tenants, our earnings quality is among the highest in the REIT industry. Our property portfolio now contains 14.4 million rentable square feet, consisting of 93 properties, geographically diversified across 29 states. Our weighted-average lease maturity increased by 7% this year and is now 7.2 years, with in-place leases going out until 2034.
As a result of the shift in consumer spending from traditional store sales to e-commerce, retailers have become much more concerned with the inventory levels in their distribution centers than in their tra-ditional brick-and-mortar stores. This shift has resulted in historically high occupancy rates for the industrial property sector. Over the 12 month period, the occupancy rate in our portfolio increased 180 basis points, from 95.9% at fiscal yearend in 2014, to a sector-leading 97.7% at the end of fiscal 2015. As a result of new leases that became effective subsequent to yearend, our occupancy rate has risen further and is now 99.5%. In fiscal 2015, 6% of our
LETTER TO SHAREHOLDERS
10
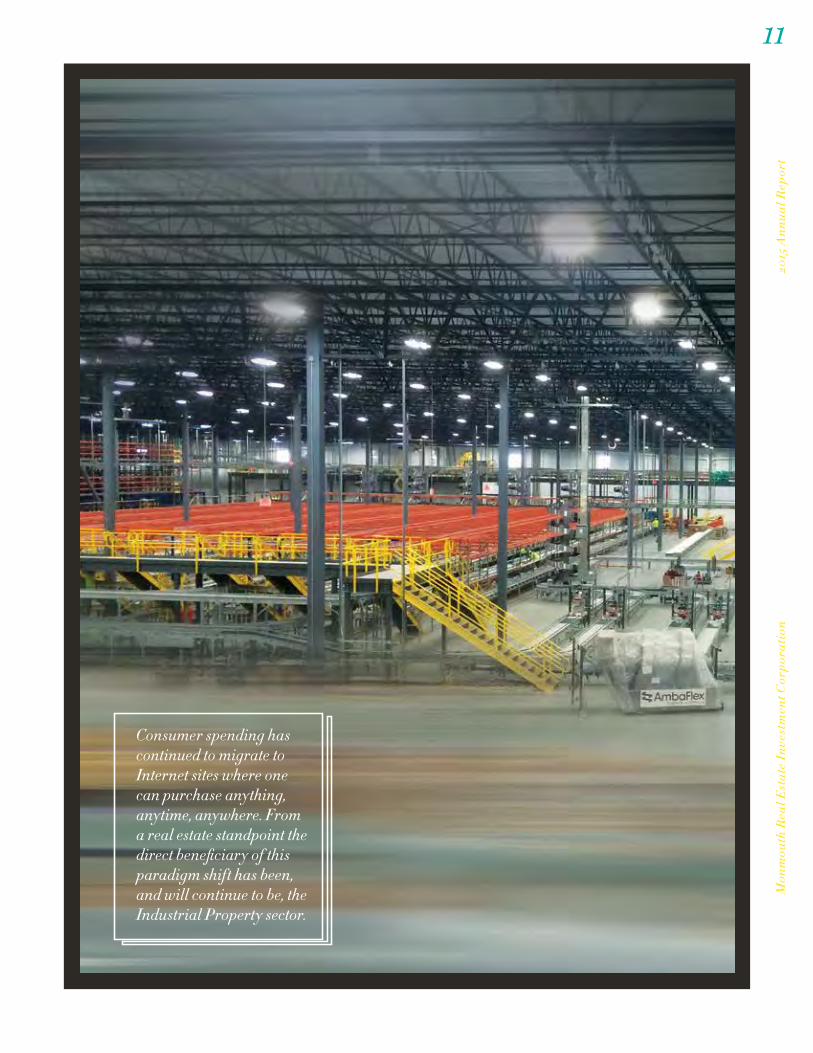
Consumer spending has continued to migrate to Internet sites where one can purchase anything, anytime, anywhere. From a real estate standpoint the direct beneficiary of this paradigm shift has been, and will continue to be, the Industrial Property sector.
11
Mon
mou
th R
eal E
stat
e In
vest
men
t Cor
pora
tion
2015
Ann
ual R
epor
t

gross leasable area, representing six leases totaling approximately 780,000 square feet, was scheduled to expire. All six of these leases were renewed, giving Monmouth a 100% tenant retention rate for fiscal 2015. These renewed leases have an average term of 3.8 years and an average lease rate of $5.06 per square foot representing a 6.3% increase in rents on a GAAP basis. Our business model of investing in industrial properties leased to investment-grade tenants has delivered very reliable returns over the long term. Our strong occupancy and tenant retention figures, combined with our weighted-average lease maturity of 7.2 years, provide excellent earnings visibil-ity going forward.
During fiscal 2015, Monmouth achieved a record amount of acquisitions, acquiring 2.7 million square feet of Class A built-to-suit industrial properties for $192.0 million. This represents a 24% increase in our Gross Leasable Area (GLA) and a 21% increase in our rental revenue. Moreover, going back four years, we have successfully grown our GLA by 85%. As you can see from the photos throughout this report, we have achieved this growth without sacrificing our high standards. In keeping with our long-term business plan, this growth was achieved by purchasing well-located, new Class A built-to-suit industrial properties, leased to investment-grade tenants. These assets are situated near major airports, major transportation hubs, and manufacturing plants that are integral to our tenants’ operations. During this period we have observed a significant increase in prices for high-quality industrial properties which in turn has translated into a significant increase in the value of our overall portfolio. The weighted-average age of our portfolio is approximately 10.0 years, providing us with a very modern, high-quality portfolio.
The legendary investor Charlie Munger wrote, “I’m convinced that everything that’s important in investing is counterintuitive and everything that is obvious is wrong.”
This insightful quote implores investors to think for themselves and not to assume that market pricing is always efficient and rational. In last year’s annual report, we published a two-page treatise titled, “A Few Thoughts on REIT Dividends and Total Return.” In it we argued that given the
high-quality earnings that our portfolio provides, our dividend yield should not represent a risk premium over the average REIT dividend yield. We are not going to restate those arguments here as this exposi-tion is readily available on our website or by contacting Susan Jordan, our Vice President of Investor Relations. Following 24 con-secutive years of maintaining or increasing our common stock dividend, on October 1 we announced a 6.7% dividend increase. As further proof of how counterintuitive and unjustified our yield premium is, Monmouth is not only one of the few REITs that maintained its cash dividend through-out the Global Financial Crisis, we are now one of the very few REITs that is paying out a higher cash dividend today than we did prior to the Global Financial Crisis.
As for the obvious being wrong, the concept of being diversified at all costs comes to mind. Harry Markowitz and other brilliant thinkers championed the ability to achieve superior risk-adjusted returns through diversified holdings that held little correla-tion to one another. While these strategies may look compelling on the drawing board, the action out on the field is what truly matters. Out on the field, FedEx has become an essential component of the Internet Ecosystem. They are the major artery that connects Main Street to Cyberspace. At the turn of the century, less than 1% of total retail sales took place online. Fifteen years later online sales have grown more than tenfold. However, they are still less than 10% of total sales, providing plenty of room for future growth. The recent Black Friday through Cyber Monday holiday
weekend saw total online sales eclipse brick-and-mortar sales for the first time ever. Online sales via mobile phones have come from nowhere to suddenly represent the majority of these sales. There are more than 3 billion people with high-speed Internet access, yet that is still only 40% of the global population. The massive shift to e-commerce that continues to unfold will likely result in growing demand for FedEx’s services for many years to come. We have numerous FedEx projects in construction scheduled for completion in 2016 and 2017. We also have several expansion projects for FedEx currently underway. We are very fortunate to be working alongside this great company.
In fiscal 2015, we raised a total of $48.4 mil-lion in common stock through our Dividend Reinvestment and Stock Purchase Plan (DRIP). Investors who participate in our DRIP can enhance their returns by reinvesting their dividends and achieving a compounded return. This has proven to be a very reliable program to help fund our growth. Additionally, we financed our new acquisitions with low-cost, long-term, fixed-rate mortgage debt, raising $122.2 million in conjunction with our fiscal 2015 acqui-sitions, and an additional $33.7 million for the two acquisitions we have made thus far in fiscal 2016. Notwithstanding the FOMC’s recent 25 basis point increase, interest rates remain at very low levels. This has allowed us to achieve investment spreads in excess of 250 basis points. In view of the signifi-cant positive investment spreads associated with our recent transactions, as well as our robust acquisition pipeline, for which
12

we have already locked-in very favorable rates, we expect our investment returns to be meaningfully additive to our earnings in fiscal 2016.
It is no secret that in order to achieve the cycle-tested long-term track record of success that we have enjoyed, a strong balance sheet is required. Our total market capitalization was approximately $1.2 billion at fiscal year-end, representing a 17% increase over the prior year. Our capital structure is composed of approximately $606 million in equity capitalization, $111 million in preferred capital, and $459 million in debt. Eighty-one percent of our total debt is fixed-rate, with a weighted- average interest rate of 4.9% and a weighted- average maturity of 9.0 years. At fiscal yearend, our net debt to total market capitalization was a conservative 38%. We ended the fiscal year with $12.1 million in cash and with $50.0 million available from our recently expanded credit facility, as well as an additional $70.0 million potentially available from the facility’s accordion feature. We also held $54.5 million in mar-ketable REIT securities, representing 5% of our undepreciated assets. While over the past six years our securities portfolio has generated $24 million in net realized gains, we have positioned the Company to be less reliant on this type of outperformance going forward as the portfolio’s primary function is one of liquidity. During the year, we fully repaid a total of four loans with unamor-tized balances totaling $10.7 million, which unencumbered approximately $20.0 million of properties. We also sold one property this year for $9.0 million, recognizing a 59% gain over our original cost and a 131% gain over our current carrying cost. Our strong capital position provides us with substan-tial capacity to continue to execute our growth strategy.
Monmouth’s Core Funds from Operations (Core FFO), including gain over historic cost on the sale of real estate for fiscal 2015 and 2014, respectively, were $38.6 million as compared to $29.5 million. On a per share basis, Core FFO was $0.65 per diluted share in fiscal 2015, as compared to $0.59 per diluted share in fiscal 2014. As we stated in last year’s report, our main focus has been on growing our recurring earnings or what is commonly referred to as Adjusted Funds from Operations (AFFO). AFFO excludes gains or losses on the sale of real estate
and gains or losses on the sale of REIT securities, as well as lease termination income and the effects of straight-lined rent adjustments. Therefore, we believe AFFO serves as the best proxy for recurring cash earnings. Our AFFO for fiscal 2015 was $34.0 million, compared to $25.8 million in fiscal 2014. On a per share basis, AFFO was $0.57 per diluted share in fiscal 2015, as compared to $0.52 per diluted share in the prior year, representing a 10% increase. This marks our second consecutive year of double-digit AFFO per diluted share growth. As a result of our substantial recent acquisition and expansion activity, our increased occupancy, and our large acquisition pipeline, we anticipate continu-ing to meaningfully grow our AFFO per share significantly.
With regard to the overall US industrial property market, 2015 ranked as one of the strongest years ever in terms of net absorp-tion, with 174 million square feet in positive net absorption through the third quarter. This represents the most space absorbed during the first three quarters of a year since 2005. While new construction has been ramping up with 182 million square feet currently under construction, it is still below the absorption levels which have been positive now for six consecutive years. This trend has caused vacancy levels to continue to fall to their current rate of 7.4% representing a 90 basis point improvement over the prior year. National rental rates are up 4.7% year over year at an average asking rate of $5.34 per square foot. As a result of consumer spending’s continued migration online, it is anticipated that industrial rent growth will not diminish in 2016. Further, as a result of the labor dis-ruptions at the West Coast ports, shipping container growth at the East Coast ports has been thriving. This shift in demand is only expected to continue as the expanded Panama Canal begins operations later this year. As one can see from our Property Portfolio Map on pages 8 and 9 of this report, Monmouth is very well positioned to benefit from these favorable trends.
On a personal note, a pioneer of the digital revolution, Larry Rosen, died this past October. Larry was a great mentor, friend, and entrepreneur. From the ground up he built two amazing companies, including one of the world’s first e-commerce companies.
I will always remember his energy, his passion and his vision.
Speaking of mentors, you could never ask for a better mentor than the one I have in my father, our Company’s Founder and Chairman, Eugene Landy. At 82 years old, Gene is still very active in the day-to-day activities here at Monmouth, the company he built. I am so fortunate to be able to work alongside him on a daily basis. He is one of those extremely rare individuals where every time you get to speak with him, you walk away smarter. I think that our shareholders should know that in addition to being awarded in 2014 with Yale Law School’s Simeon Baldwin Award, he was recently named Man of the Year by his other alma mater, the U.S. Merchant Marine Academy at Kings Point. He also proudly serves on NAREIT’s Advisory Board of Governors, an organization he is very fond of. For all this, we are truly blessed.
In conclusion, our Company continues to perform exceptionally well. Our new fiscal year could not have gotten off to a better start, with a 6.7% dividend increase announced on the very first day. Our long- term track record of dividends and profitability would not be possible without our time-tested business model, our strong tenant base, and our high-quality property portfolio. It would also not be possible with-out the hard work of our talented staff. I would like to thank our great team for all of their dedication and hard work. I would also like to thank our directors for their valuable input. Thank you as well to our loyal long-term shareholders for the faith and trust that you have shown in our Company. We look forward to continuing our prosperous journey together.
Very truly yours,
MICHAEL P. LANDYPresident and Chief Executive Officer
13
Mon
mou
th R
eal E
stat
e In
vest
men
t Cor
pora
tion
2015
Ann
ual R
epor
t
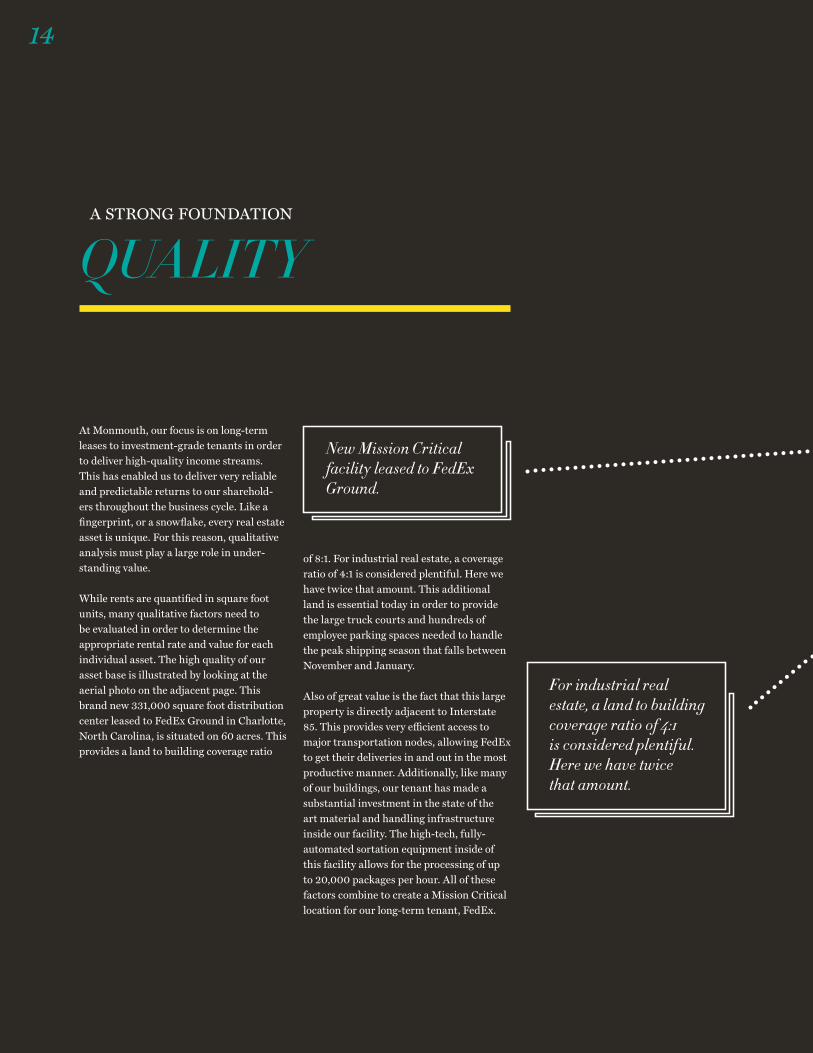
At Monmouth, our focus is on long-term leases to investment- grade tenants in order to deliver high-quality income streams. This has enabled us to deliver very reliable and predictable returns to our sharehold-ers throughout the business cycle. Like a fingerprint, or a snowflake, every real estate asset is unique. For this reason, qualitative analysis must play a large role in under-standing value.
While rents are quantified in square foot units, many qualitative factors need to be evaluated in order to determine the appropriate rental rate and value for each individual asset. The high quality of our asset base is illustrated by looking at the aerial photo on the adjacent page. This brand new 331,000 square foot distribution center leased to FedEx Ground in Charlotte, North Carolina, is situated on 60 acres. This provides a land to building coverage ratio
A STRONG FOUNDATION
QUALITY
of 8:1. For industrial real estate, a coverage ratio of 4:1 is considered plentiful. Here we have twice that amount. This additional land is essential today in order to provide the large truck courts and hundreds of employee parking spaces needed to handle the peak shipping season that falls between November and January.
Also of great value is the fact that this large property is directly adjacent to Interstate 85. This provides very efficient access to major transportation nodes, allowing FedEx to get their deliveries in and out in the most productive manner. Additionally, like many of our buildings, our tenant has made a substantial investment in the state of the art material and handling infrastructure inside our facility. The high-tech, fully- automated sortation equipment inside of this facility allows for the processing of up to 20,000 packages per hour. All of these factors combine to create a Mission Critical location for our long-term tenant, FedEx.
For industrial real estate, a land to building coverage ratio of 4:1 is considered plentiful. Here we have twice that amount.
New Mission Critical facility leased to FedEx Ground.
14

FedExThis FedEx facility is located in the Charlotte, North Carolina MSA. The 331,000 square foot distribution center sits on 60 acres adjacent to Interstate 85.
Mon
mou
th R
eal E
stat
e In
vest
men
t Cor
pora
tion
2015
Ann
ual R
epor
t
15

QUALITY
16

Today’s modern industrial buildings need to service not just the Business-to-Business (B to B) part of the economy but also the sales that bypass the brick-and-mortar retail channel altogether and are shipped directly to the consumer (B to C). In order to serve both of these channels, known as “Omni-Channel” distribution, a large investment in the technology that resides inside of these facilities must be made by the tenant.
Consumer spending has continued to migrate to Internet sites where one can pur-chase anything, anytime, anywhere. While total retail sales are only showing a 1.5% year over year increase, online sales are up 15.2% this year. The recent Black Friday through Cyber Monday holiday weekend saw total online sales eclipse brick-and-mortar sales for the first time. Every year market share keeps moving online. From a real estate standpoint the direct beneficiary of this paradigm shift has been, and will continue to be, the Industrial Property type.
Omni-channel distribution requires very high-quality, state of the art industrial space. Monmouth’s 14.4 million square foot portfolio has a weighted-average age of only 10 years, providing us with the most modern industrial property portfolio in the Industrial REIT sector. Because much of the demand for industrial space has been e-commerce related, our occupancy rate was up 180 basis points to a sector-leading 97.7% at fiscal yearend, and it increased further to 99.5%, effective January 1, 2016.
Featured here is our brand new 600,000 square foot distribution center leased to Beam Suntory, situated on 92 acres along the Bourbon Trail in Frankfort, Kentucky.
17
Mon
mou
th R
eal E
stat
e In
vest
men
t Cor
pora
tion
2015
Ann
ual R
epor
t

A STRONG FOUNDATION
OPPORTUNITY
The quality of our asset base is evidenced by our 100% tenant retention rate, as well as our sector leading occupancy rate of 97.7% at fiscal yearend.
During fiscal 2015, Monmouth acquired 2.7 million square feet of high-quality industrial space for $192.0 million, consisting of ten brand new, Class A built-to-suit properties, all leased long-term to investment-grade tenants.
18

“You do things when the opportunities come along.” — Warren Buffett
Sounds simple but the trick is in seeing the opportunities when they are not so obvious. The key question one must ask is, “What is the world going to look like years from now?” If you can get a clear picture, you can find the opportunities.
Because we are now living in a digital world, many opportunities can only be seen by those that understand what this means. The old adage, “Invest in land because they ain’t making any more of the stuff,” was true for centuries but that was back when we were living in an analog world.
Since the late 1980’s, digital technology has been reshaping our world in profound ways. The world has effectively shrunk as many physical objects that once required a substantial amount of physical space, can now be digitized and stored on spaces so microscopically small that a new metaphor-ical place called, “the Cloud” has been added to today’s lexicon. Just how much virtual acreage currently resides up there, on or in these “Clouds”? No one knows. We do know that whatever the amount is, it is growing exponentially. What is also certain is that the conventional ways of conducting com-merce no longer apply. The opportunities will be found by those who understand this new world order.
19
Mon
mou
th R
eal E
stat
e In
vest
men
t Cor
pora
tion
2015
Ann
ual R
epor
t

Investors are rightly often focused on the balance of supply and demand. Looking at historical data has in the past proven help-ful in forecasting future trends, especially in the cyclical asset class of real estate. From a U.S. real estate standpoint, one wonders if the current supply of brick-and-mortar retail stores is enough to handle future demand, given a population that grows at an annual rate of 1%, which equates to approximately 3 million people, and an economy that
conservatively should grow at a real rate of at least 2%, which equates to $360 billion in increased production. However, this linear type of thinking is no longer adequate in today’s non-linear digital world. For no one can truly understand the future supply and demand balance of retail sales unless they know how much market share will be taking place online. We know at the turn of the century it was less than 1% of total sales. Today, 15 years later, it has grown more
than tenfold. Yet, it is still less than 10% of total sales. This year, sales via smartphones have suddenly grown from a very small percentage to more than 50% of total online sales. With this type of exponential growth it is very difficult to estimate future demand levels with any precision. The important thing however, is to understand and observe the alacrity and depth with which consumer spending habits are changing.
OPPORTUNITY
20

The Industrial Property sector is clearly seeing increased demand as a result of these changes. This year represented one of the strongest years ever for the U.S. Industrial Property market with over 200 million square feet in positive net absorption. There has now been a record breaking six consecutive years of positive net absorption for our property type. Rental rates have been on the rise for several years as well and were up 4.7% nationally in 2015. It is estimated that over 50% of this demand for industrial space is e-commerce related. Because online sales represent only 10% of total sales, the runway for future growth is vast. Also, while high-speed Internet access has been growing at an incredibly fast rate, only 40% of the global population has access today. There are over 5 billion people that are not even connected yet. A future where the majority of the world’s commerce is happening online is no longer that hard to imagine. Having the majority of the global population able to participate in this vast marketplace would represent a tremendous improvement in our overall quality of life and therefore it would be of great benefit to society at large. These momentous changes represent a wave of opportunity that we at Monmouth intend to be a part of for many years to come.
Featured here is our brand new 670,000 square foot e-commerce fulfillment center, leased to Ulta Salon, Cosmetics & Fragrances, the largest beauty retailer in the U.S.
21
Mon
mou
th R
eal E
stat
e In
vest
men
t Cor
pora
tion
2015
Ann
ual R
epor
t

“Many people, when considering a job, are primarily concerned with their role and responsibilities, the company’s track record, the industry, and compensation. Further down on the list, probably somewhere between length of commute and quality of the coffee in the kitchen, comes culture.” — From “How Google Works”
Like Google, Monmouth fosters an environ-ment where the people who work here place culture at the top of the list. Because in order to be most effective, you need to have people who truly care about the company. It is the people that make the place and separate the great company from the medio-cre one. At Monmouth, we have assembled a very talented and hard-working team that truly cares.
Over our 47 year history we have developed a few core principles that sum total into our corporate culture. These straight-forward
principles include, but are not limited to, the following:
1. Treat everyone that you do business with as a partner. There is nothing wrong with all parties being satisfied with the outcome of a transaction. In fact, that is the ideal scenario, as that is precisely the scenario that will foster future growth.
2. Always think long term, as that is the only way that enduring value can be built. Unfortunately, in today’s world many inves-tors are focusing on ever-shorter investment horizons. It is always best to ignore the myopic noise, such as the daily stock fluctu-ations, and stick to your long-term focus.
3. The customer always comes first. At Monmouth our customers are our tenants. Over the years we have built very strong relationships with our tenants. The quality of our tenant base is unsurpassed in the REIT world. Whether it is Anheuser-Busch,
Beam Suntory, Cardinal Health, Caterpillar, Coca-Cola, ConAgra, Dr Pepper Snapple, FedEx, Home Depot, International Paper, Keebler/Kellogg’s, Milwaukee Tool, National Oilwell Varco, PP&G, Sherwin-Williams, Siemens, ULTA Cosmetics, United Technologies, or any of our other excellent tenants, our job is to provide the high-quality space that they deserve.
4. Keep things as simple as possible, but never more simple than necessary. Because of our 47 year track record of success, one should take comfort that our business model is empirically sound, our foundation is strong, and our course is clear. Therefore, it would be incredibly foolish for us to deviate from our cycle-tested strategy. While our high FedEx concentration and our investing in REIT securities may strike someone new to our company as unorthodox, our substan-tial returns from both of these investment strategies should not be discounted as they have provided excellent long-term results.
The quality of our tenant base is unsurpassed in the REIT world.
Featured here is our 235,000 square foot distribution center leased to Anda Distribution, a division of Allergan, Inc.
A STRONG FOUNDATION
CULTURE
22

23
Mon
mou
th R
eal E
stat
e In
vest
men
t Cor
pora
tion
2015
Ann
ual R
epor
t

FINANCIAL HIGHLIGHTSThe following is a calendar yearend common stock review:
Year Share Volume
Opening Price ($)
Closing Price ($)
Dividend Paid ($)
Appreciation (Depreciation)
Total Return
2015 53,003,500 1 1 .07 1 0.46 0.61 –5.5% 0.3%
2014 58,753, 100 9.09 1 1 .07 0.60 2 1 .8% 29.2%
2013 33,1 10,000 1 0.36 9.09 0.60 –1 2.3% –6.8%
2012 25,1 03,1 00 9. 1 5 10.36 0.60 1 3.2% 20.0%
2011 28,85 1 ,500 8.50 9. 1 5 0.60 7.6% 1 5.7%
2010 1 9,344,900 7.43 8.50 0.60 1 4.4% 23.7%
2009 1 2,1 02,300 7.00 7.43 0.60 6. 1% 1 6.6%
The shares of common stock of Monmouth Real Estate Investment Corporation are traded on the New York Stock Exchange (NYSE:MNR).
The following is a 5-year dividend payment and Core FFO analysis:
Fiscal Year Ended September 30
Core Funds From Operations ($)
Dividends Per Share ($)
2015 35,276,535 0.60
2014 29,482,323 0.60
2013 27,852,944 0.60
2012 27, 1 26,804 0.60
2011 23,546,986 0.60
24

This is not yesterday’s warehouse,
CORPOR ATE INFORMATIONCORPORATE OFFICE 3499 Route 9 North Freehold, NJ 07728
INDEPENDENT AUDITORS PKF O’Connor Davies 665 Fifth Avenue New York, NY 10022
TRANSFER AGENT & REGISTRAR American Stock Transfer & Trust Company 6201 15th Avenue Brooklyn, NY 11219
COMMON STOCK LISTING NYSE:MNR
www.mreic.reit
DIRECTORSANNA T. CHEW Certified Public Accountant Vice President and Chief Financial Officer UMH Properties, Inc.
BRIAN HAIMM Chief Financial Officer and Chief Operating Officer Ascend Capital
MICHAEL P. LANDY President and Chief Executive Officer
DANIEL D. CRONHEIM Attorney-at-Law Executive Vice President, General Counsel David Cronheim Company
NEAL HERSTIK Attorney-at-Law Gross, Truss & Herstik, PC
SAMUEL A. LANDY Attorney-at-Law President and Chief Executive Officer UMH Properties, Inc.
CATHERINE B. ELFLEIN Senior Director Risk Management Celgene Corporation
MATTHEW I. HIRSCH Attorney-at-Law Law Office of Matthew I. Hirsch
SCOTT L. ROBINSON Managing Director Oberon Securities
EUGENE W. LANDY Chairman of the Board
STEPHEN B. WOLGIN Managing Director U.S. Real Estate Advisors, Inc.
OFFICERS AND MANAGEMENTEUGENE W. LANDY Chairman of the Board
MICHAEL P. LANDY President and Chief Executive Officer
KEVIN S. MILLER Chief Financial and Accounting Officer, and Treasurer
ALLISON NAGELBERG General Counsel
MICHAEL D. PRASHAD In House Counsel
RICHARD MOLKE Vice President of Asset Management
SUSAN M. JORDAN Vice President of Investor Relations
KATIE RYTTER Controller
ALLISON VISCARDI Senior Property Manager
CRYSTAL GLAS Executive Assistant
LAURA TEMAN Assistant Controller
ASHLEY TRIPODI Assistant Property Manager
ELIZABETH CHIARELLA Secretary
Des
ign
by A
ddis
on w
ww
.add
ison
.com

Monmouth Real Estate Investment Corporation
2015 Annual Report
Monmouth Real Estate Investment Corporation
A Public REIT Since 1968 NYSE: MNR
www.mreic.reit
3499 Route 9 North Freehold, New Jersey 07728 732.577.9996
2015 A
nnual Report
Monm
outh Real E
state Investment C
orporation