monopsony power and the tradeoff between return to...
TRANSCRIPT
Monopsony Power and the Tradeoff Between Return
to Performance and Contract Length in Major
League Baseball Advisor: Dr. John Shea
Author: Ira Rickman
1
Ira Rickman Advisor: Professor John Shea
ECON396
Monopsony Power and the Tradeoff Between Salary and Contract Length in Major League Baseball
In Major League Baseball a player’s negotiation rights are owned by his team for the first
six years of his Major League playing career. As a result, teams enjoy a monopsonistic
advantage over players during this time. A player takes his salary as given his first three years,
is eligible for arbitration his fourth through sixth years and becomes a free agent after his sixth
year. Past literature investigated the relationship between average salary and contract length
for long-term contracts signed by free agents. However, these papers do not examine long-
term contracts signed by players who have not yet attained free agency, which have become
more common in recent years. This paper explores the effect of monopsony on the tradeoff
between contract length and average annual salary in long-term contracts signed by players
with less than six years of Major League service time.
This paper builds on existing studies on the construction of contracts and tradeoffs made
by players. Krautmann and Oppenheimer (2002) study the tradeoff between salary and contract
length and establishes that players’ return to performance decreases with additional contract
length. Link and Yosifov (2011) build on Krautmann and Oppenheimer (2002) and find that the
relationship between return to performance and contract length is most strongly negative for
players with more than 10 years of MLB service time, suggesting a higher risk premium.
However, these papers examine samples consisting only of contracts signed by free agents with
six or more years of Major League service time.
In this paper I extend previous literature to examine the tradeoff between contract length
and average salary in contracts signed by players prior to free agency. This study will explore

2
how the degree of monopsony power affects both the tradeoff between return to performance
and contract length and between contract length and average annual salary.
II. Background and Literature Review
i. Background
Players accumulate Major League service time for each full day they are on a Major
League Club’s active list (CBA 2012). A full year of Major League Service constitutes 172 days
of service time, and players cannot gain more than one year of service in a championship
season. For players’ first three years of service time, they typically earn the major league
minimum salary1. Eligibility for salary arbitration theoretically improves the bargaining power of
players.
At the end of a season for which a player has more than three years but less than six
years of service time, a player can file for salary arbitration if he and his club cannot agree to
terms on a contract by the filing date for the upcoming season.2 In salary arbitration, the club
and the player submit final offer figures. Figures are then exchanged and the parties are free to
continue negotiating up until the arbitration hearing. Arbitrations are heard by a three member
panel of third-party arbitrators.3 The panel then decides which final offer will serve as the
player’s salary for the upcoming season.
1 Teams decide players’ salaries unilaterally for their first three seasons, but can pay them more than the major league minimum. For instance, Mike Trout finished second in AL MVP voting in 2012 and received a $20,000 raise over the major league minimum (Heitner 2013) 2 There is also a type of arbitration eligibility called “SuperTwo” status, whereby the top 22%(before 2012 it was 17%) of players with less than three years of service time and at least 86 days of service time are eligible for arbitration. They receive arbitration eligibility one year earlier, but still must wait six years for free agency. 3 Arbitration criteria are “Player’s contribution to his Club during the past season, the length and consistency of his career contribution, the Record of a player’s past compensation, comparative baseball salaries…” Comparative baseball salaries places an emphasis on players no more than one annual service class above the player (CBA 2012).
3
Contract extensions serve as an alternative to the traditional service time process.
Teams and players can lock in salary figures for multiple years and reduce the uncertainty both
sides face in the future. Contract extensions for pre-free agency players were not common prior
to 19924 and have increased in popularity since 2000 when there were only nine extensions in
comparison to 38 in 2012. Extensions are also being signed at earlier stages in players’
careers, buying out pre-arbitration years in some cases. The upwards trend in extensions can
be seen in Figure 1 and summary statistics by year can be seen in Table 1.
ii. Literature Review
The effect of eligibility for arbitration and free agency on salary and contract duration is
studied in Kahn (1993). Using a longitudinal data set, Kahn (1993) performs a fixed effects
regression to separately measure the contributions of arbitration eligibility, free agency eligibility,
and a multitude of performance statistics5 to average annual salary and contract duration. The
results provide evidence that arbitration eligibility and free agency increase salaries. However,
only free agency is associated with a rise in contract duration.6
Intuitively, monopsony power has an effect on the player salaries during the period of
arbitration eligibility because players can still only negotiate with one team instead of the whole
market. The effects of monopsony are examined in Raimondo (1983) in light of the beginning of
MLB free agency. The findings suggest monopsony has a large effect on the salaries players
might otherwise make in free agency. I plan to further investigate the effect of monopsony with
a focus on the tradeoff players face between return to performance and contract length.
4 John Hart, the General Manager of the Cleveland Indians, pioneered the trend in the early 1990s (Holtzman 1995). 5 Kahn (1993) uses performance statistics including batting average, extra-base hits, walks, stolen bases, gold gloves, and dummies for non-first base infield positions and catcher. 6 The degree of salary increase is higher for the free agency dummy variable than for the arbitration eligibility dummy variable, but the coefficient on arbitration eligibility lies within the standard error for the coefficient on free agency.

4
The determination of contract length is explored by Maxcy (2004), who studies the
choice between one year contracts and long term contracts both theoretically and empirically.
Maxcy (2004) finds theoretically that teams decide contract length as a function of market
uncertainty, defined as the amount of uncertainty over future market prices for talent, and player
performance uncertainty. When market uncertainty is at its highest relative to player
performance uncertainty, teams are more likely to prefer a long term contract. Empirically
Maxcy estimates a binary choice probit model of the choice between one year and long term
contracts. He finds empirically that long term contracts are more likely for arbitration eligible
players than for players not yet eligible for arbitration and still more likely for free agents,
controlling for player performance and measures of performance uncertainty. Importantly,
Maxcy (2004) does not factor salary into the binary choice probit model, arguing that
compensating wage differentials are unlikely to be important in markets for uniquely-skilled
workers who cannot be easily replaced.
In Krautmann and Oppenheimer (2002) meanwhile, the authors allow for compensating
differentials by investigating the impact of contract length, performance, and their interaction, on
salaries. They find positive, statistically significant impacts on salaries of contract length and
performance, but a negative, statistically significant coefficient on the interaction between
performance and contract length. Their sample is limited to the salaries observed in the first
year of free agent position player contracts signed from 1990-1994, and uses slugging average
as the key performance statistic.
The findings are updated by Link and Yosifov (2011), who estimate compensating wage
differentials using the same broad framework as Krautmann and Oppenheimer (2002).
However, the study uses data over a longer sample period, experiments with average salary
over the contract as the dependent variable, and uses winshares as an alternative performance
statistic. Winshares should in principle be a more accurate measure of player performance than
5
slugging average, and in fact Link and Yosifov find a stronger negative correlation between
contract length and return to performance using winshares rather than slugging percentage.
In this paper I will extend the methodology of Krautmann and Oppenheimer (2002) and
Link and Yosifov (2011) to incorporate long term contracts signed by players prior to free
agency. This will allow me to determine the effect of monopsony on the tradeoff between
return to performance and contract length, as well as the risk premium between salary and
contract length. I also plan to use the Krautmann and Oppenheimer (2002) specification,
because I disagree with the argument presented in Maxcy (2004) that the market for Major
League Baseball players is a market for uniquely skilled players who cannot be replaced. There
is no uniform way to build a baseball club and different combinations of players create different
team performance distributions. While players’ specific skills cannot be easily replaced, their
value can be substituted in other ways. The major contribution of sabermetric advances is the
ability to recognize previously unseen value in baseball player performance, making it easier to
unearth different player combinations that are of equal value. I plan to utilize these sabermetric
advances as a way to control for player productivity more accurately than in previous studies.
In theory, either players or clubs might be willing to pay a risk premium, in the form of
decreased return to performance, in exchange for a longer term contract. Player performance
and health in future years are uncertain, so players might be willing to accept a lower return to
their performance in exchange for a longer-term contract than they would expect to receive
under a series of one-year contracts. On the other hand, the future market salary and
availability of players with particular characteristics are also uncertain, so teams might be willing
to pay a higher return to expected player performance in long-term contracts. There is a
presumption that players are more risk averse than teams, but ultimately it is an empirical
question whether the risk premium for long term contracts is paid by players or teams.

6
III. Data and Empirical Strategy
i. Empirical strategy
Every player that signs a long term contract potentially pays a risk premium, in the form
of a lower return to performance over the life of the contract, than he would expect to receive
from a series of short-term contacts. In order to measure the effect of monopsony power on
this risk premium, this paper extends the methodology used in Krautmann and Oppenheimer
(2002) and Link and Yosifov (2011).
The empirical model in Krautmann and Oppenheimer (2002) assumes that a player’s
salary is a function of expected performance, team specific characteristics, player specific
characteristics, and market factors affecting salaries. As such, the paper uses the following
specification:
Ln(SALij)= β1 + β2 PERFij + β3 (PERFIJ * LENGTHIJ) + β4 (LENGTHIJ) + β5 (PLAYERI) + β6
(TEAMJ)+ εIJ
Where SALIJ is the annual salary for playeri on the teamj, PERFij is a measure of the
player’s expected productivity based on past performance, LENGTHIJ is the length of the
contract negotiated between playeri and teamj, PLAYERI measures player-specific
characteristics, TEAMj measures team specific characteristics, and εIJ represents the error term
including unobservable effects. For the purposes of this paper, I use the Krautmann and
Oppenheimer (2002) specification to estimate the tradeoff between return to performance and
contract length. While Krautmann and Oppenheimer (2002) and Link and Yosifov (2011)
included only free agent contracts in their sample, I extend their approach to accommodate
players who sign contract extensions before they reach free agency, with additional
independent variables specifying percentage of the contract covering years before arbitration,
arbitration eligible years, and free agency years.
7
I also update the performance variables used by Krautmann and Oppenheimer (2002)
and Link and Yosifov (2011). Krautmann and Oppenheimer (2002) use Slugging Average as
the performance statistic to estimate a player’s productivity, which is calculated by dividing total
bases by at-bats. The implicit assumption is that a home run is four times as valuable as a
single, which overstates the value of extra base hits. Furthermore, using solely Slugging
Average excludes other performance factors for which teams compensate players and measure
productivity more accurately. Slugging average does not account for walks, sacrifices, base
running, or defense. Link and Yosifov (2011) finds that using winshares generates a stronger
tradeoff between return to performance and contract length. Winshares attempts to allocate the
percentage of a team’s actual wins in a year to a player based on his runs created. By using
actual wins, the measure is subject to a significant amount of non-performance related biases
that affect a team’s wins and that are not captured by player performance alone. Winshares
captures a broader range of offensive contributions than slugging percentage but still does not
capture a player’s contribution on the base paths.
I attempt to improve upon previous work by using Wins Above Replacement (WAR) as a
measure of performance. WAR is arguably a superior performance measure for several
reasons.7 WAR measures a position player’s contribution to his team as a function of weighted
runs above average, defensive runs saved, and base running runs.8 Using historical analysis of
the number of runs likely to win a game and the league average scoring for a given year, WAR
accounts for the added probability of winning produced by a player’s individual contributions on
the field. WAR is also measurable for pitchers, as a function of the pitcher’s performance on
7 A 2012 study demonstrated that WAR-based projection models account for 91% of variation in actual team performance (Dupaul 2012) 8 Position player WAR consists of weighted Runs Above Average, Ultimate Base Running, weighted Stolen Bases, and Ultimate Zone Rating. The average player’s contribution across hitting, base running, and defense is calculated and a player’s marginal contribution above replacement level is converted into runs and compiled into his WAR.

8
outcomes within his control, which are home runs, walks, hit by pitches, and strikeouts9. A
pitcher’s WAR measures the added probability of winning without the effect of his defense. The
added probability of winning for both pitchers and position players is measured against the
average “replacement level” player a team could be expected to use in the event of a player
injury. If a player gets injured, teams either replace him with another player on their roster, a
minor leaguer, or a new acquisition. WAR focuses solely on a player’s individual performance
and is corrected for park, league, and position effects to create a context-neutral statistic for
measuring player value. Because WAR incorporates all aspects of a player’s value, it should be
more strongly related to expected future performance and player salaries than other measures
of performance.
I also extend the Krautmann and Oppenheimer (2002) sample by adding contracts for
players who are not yet eligible for free agency and for pitchers. Adding these contracts will
allow me to measure the degree to which monopsony affects salary tradeoffs by the inclusion of
variables measuring the fractions of contracts’ years that cover pre-arbitration eligibility,
arbitration eligibility and free agency. Just as Krautmann and Oppenheimer (2002) measure
tradeoffs through the interaction of performance and contract length, I measure the effect of
monopsony on the tradeoff by including interactions of performance, length, and the fraction of
contracts’ years covering the different stages of monopsony. My specification is below.
9 Pitcher’s WAR is primarily made up of Fielding Independent Pitching(FIP). FIP is a weighted formula measuring outcomes the pitcher was in complete control of, including home runs, walks, hit by pitches, and strikeouts. The effect of his defense is neutralized and a league average for batting average on balls in play is used to convert FIP to Earned Run Average without the effect of defense a pitcher’s defense.
9
Ln(Average Annual Salary) = α + β1 (WARt-1) + β2 (Lengtht)+ β3 (WARt-1* Lengtht) +
β4 (pctMLMt) + β5 (WARt-1* pctMLMt) + β6 (Lengtht * pctMLMt) + β7 (WARt-1 * Lengtht*
pctMLMt) + β8 (pctArbt)+ β9(WARt-1* pctArbt) + β10 (Lengtht* pctArbt) + β11 (WARt-1 * Lengtht*
pctArbt) + εIJ
Where Ln(Average Annual Salary) is the natural logarithm of the total value of the
guaranteed portion of a contract averaged over the guaranteed contract length, WARt-1 is the
preceding year’s WAR, Lengtht is the guaranteed length of the contract, pctMLMt is the
percentage of the contract covering years prior to arbitration eligibility when the Major League
Minimum salary is common, and pctArbt is the percentage of the contract covering arbitration
eligible years. The terms are interacted with each other to capture the effects of monopsony on
the tradeoff between contract length and return to performance.
The interactions between performance and contract length capture the effect of contract
length on return to performance, much like the Krautmann and Oppenheimer (2002)
specification. The two-way interactions of performance and length with percentage of years
prior to arbitration eligibility and percentage of arbitration eligible years measure the effect of
monopsony on the return to performance and the correlation between salaries and contract
length. Finally, the three-way interaction terms estimate the impact of monopsony power on the
tradeoff between return to performance and contract length. A significant negative coefficient
on the three way interaction would suggest that monopsony increases the risk premium paid by
players. Another addition I plan to make relative to Krautmann and Oppenheimer (2002) and
Link and Yosifov (2011) is an analysis of the total effect of these interactions, by examining the
empirical distribution of player performance, contract length, and degree of monopsony. Lastly,
the specification allows for the measurement of the true risk premium. Theoretically, every
player will have a negative risk premium, willing to trade off a year of contract length for some

10
amount of average annual salary. However, the endogeneity of contract length and salary
makes the effect difficult to measure.
Reproducing the Krautmann and Oppenheimer (2002) specification with the addition of
contract extensions and players not yet eligible for free agency is a first step in the process to
measure the effect of monopsony on salary tradeoffs. However, there will always be
unobservable player qualities that cannot be controlled for, which make it difficult to measure
the tradeoff of contract length and return to performance.
The endogeneity of contract length and salary are also of concern, since both are
decided at the same time. Krautmann and Oppenheimer (2002) and Link and Yosifov (2011)
both use the number of days spent on the disabled list in prior seasons as an instrumental
variable for contract length in a two-stage least squares regression, to try to remove some of the
endogeneity associated with contract length. However, their two-stage least squares results
were not significantly different from the ordinary least squares results and, a priori it is hard to
justify the implicit assumption that injury history affects contract length but not annual salaries.
ii. Data
Each observation in the dataset is a contract signed by a player. The sample used in
this paper consists of nearly every Major League Baseball free agent contract, minor league
contract that became guaranteed, contract extension, and one year pre-free agency contract
signed by Major League Baseball players between 2000 and 2013. Each observation also
contains the player’s position, a measure of service time by innings pitched or plate
appearances, the player’s age, the signing year, signing team, contract length, total guaranteed
contract value, and previous year’s WAR (Baseball Compensation Home 2014). Additionally, I
have data on each player’s performance statistics from 1992-2013, taken from Fangraphs.com,
which produces a leading WAR statistic (Fangraphs 2014). WAR also corrects for position
adjustments since some positions add more value defensively than others. For instance,
shortstops account for more defensive runs saved than right fielders. In addition to the

11
preceding year’s WAR, I have a player’s monopsony status at the time of signing, average
guaranteed annual salary, and player position.
Free agent contracts since the 2007 offseason were taken from ESPN’s Free Agent
Tracker and included the contract length and total contract value (ESPN Free Agent Tracker
2014). Extensions were taken from MLBTradeRumors.com’s extension tracker and included
the contract length and total contract value (MLB Trade Rumors 2014). Extensions are defined
as any contract of two or more years signed by a player before free agency. However any
contract signed before free agency but only covering free agent years is considered a free agent
deal. The remaining free agent contracts from 2000-2006 were created by cross-referencing
transactions from MLBTradeRumors.com’s transaction tracker against annual salaries
downloaded from Baseball Prospectus’s Compensation home (Baseball Prospectus 2014).
Contracts were then reverse engineered and fact checked through the Baseball Prospectus
Compensation Home. One year contracts were also reverse-engineered by cross-referencing
annual salaries against free agent contracts and extensions. Any player who received a salary
from 2000-2012 and was not under an extension or free agent contract was assumed to be a
pre-free agency player. Player service time estimates used 300 plate appearances or 50
innings pitched as one year of service. From there, player salaries were appropriately labeled
as pre-arbitration or arbitration contracts, including corrections for Super Two players.
Lastly, options held by the player or held mutually were treated as new free agent deals
if exercised. Options held by the club were treated as part of the initial total contract length and
total contract value. When a player agrees to a club option, he essentially signs on for the
additional years at the team’s discretion. When a player exercises a player option, he is
electing to re-sign because he feels it is his best available deal, since his alternative is free
agency. In the rare case of a player opt-out, the opt-out is treated the same as a player option.

12
i. Pitchers
The summary statistics for pitchers are available in Table 2 and the contract distribution
is available in Table 3. The dataset for pitchers consists of 4,581 contracts, of which 135 are
extensions, 1,344 are free agent signings, and the remainders are one year contracts signed
prior to free agency. The average annual salary for pitchers is $1.94 million with a standard
deviation of $2.81 million and the average previous season’s WAR is .96 with a standard
deviation of 1.29. The average length of a pitcher contract is 1.20 years. In addition, Table 4
shows summary statistics for pitchers who signed extensions before free agency. Their
average previous season’s WAR was 2.88 with a standard deviation of 1.87 and their average
salary was $5.4 million with a standard deviation of $3.7 million. Of the years covered by
contract extensions for pitchers, 10% are pre-arbitration years, while 69% are arbitration years
and the remaining 21% are free agent years. Figures 2 and 3 demonstrate the relationship
between salary and contract length and the relationship between salary and WAR. Both trend
upwards, suggesting better players get longer contracts and higher salaries and that players
receive greater compensation for better past performance.
ii. Position Players
The summary statistics for position players are available in Table 5 and the contract
distribution is available in Table 6. The dataset for position players consists of 4,681 contracts,
of which 194 are extensions, 1,366 are free agent signings, and the remainders are one year
contracts signed prior to free agency. The average annual salary for position players is $2.10
million with a standard deviation of $3.13 million and the average previous season’s WAR is
1.16 with a standard deviation of 1.69. The average length of a position player contract is 1.30
years. In addition, Table 7 shows summary statistics for position players who signed extensions
before free agency. Their average previous season’s WAR was 3.43 with a standard deviation
of 2.11 and their average salary was $6.0 million with a standard deviation of $4.4 million. The
distribution of years covered by contract extensions is split into 7% pre-arbitration years, 69%

13
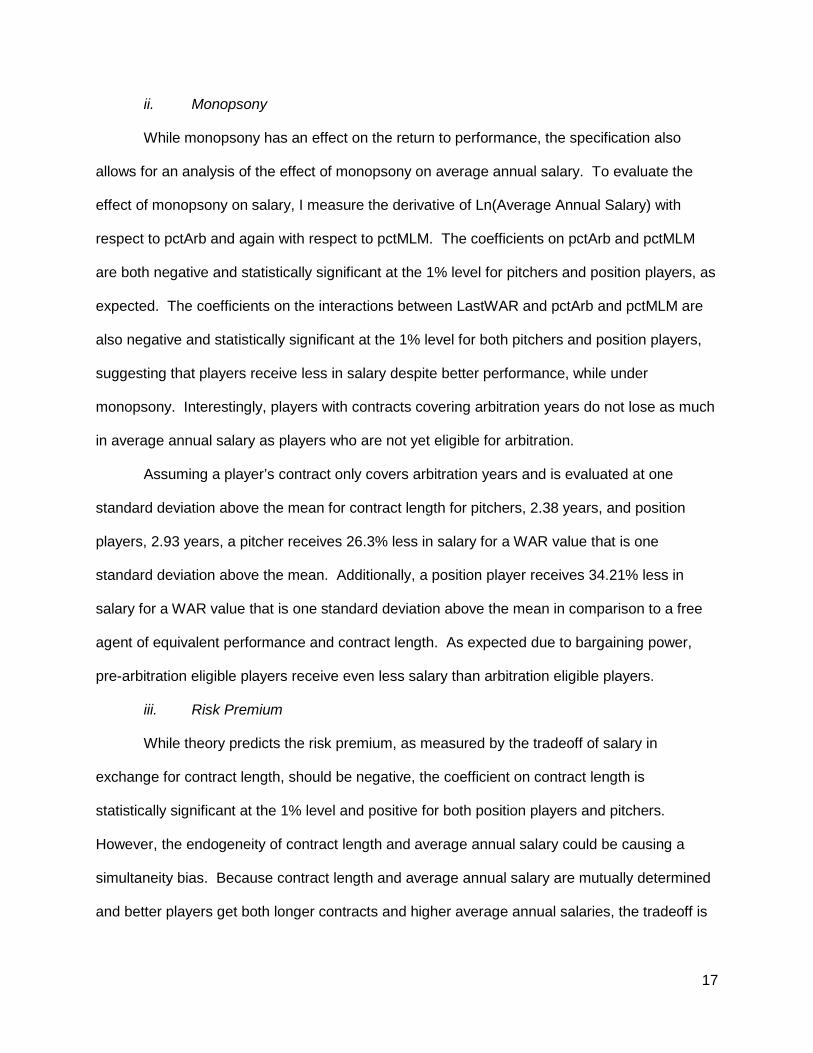
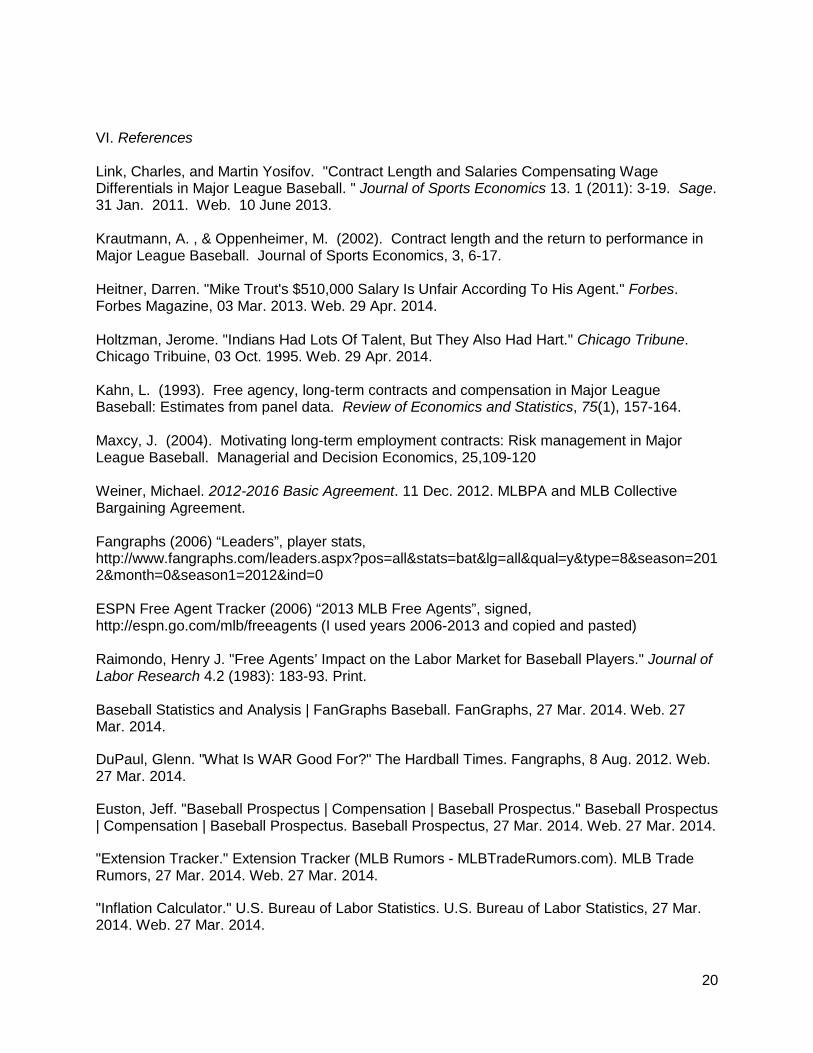
arbitration years, and 24% free agent years. Figures 4 and 5 demonstrate the relationship
between salaries and contract length and how salaries relate to WAR. Again, both trend
upwards, suggesting salaries have risen over time and players receive greater compensation for
better past performance.
IV. Results
I ran ordinary least squares regression models with different combinations of variables.
The results for pitchers are in Table 8 and the results for position players are in Table 9. For
both position players and pitchers, Model 9 was the most fully specified and had the highest r-
squared value. After performing a Chow test for pitchers and position players, and rejecting the
null hypothesis that the coefficients on the independent variables were the same for pitchers
and position players, I ran separate regressions. My key variables of interest are the interaction
terms between performance, contract length, and degrees of monopsony.
The proper way to evaluate a player’s full return to performance is to measure the
derivative of a player’s Ln(Average Annual Salary) with respect to performance as measured by
WAR. For players who sign free agent contracts, the return to performance can be measured
as β1 + β3 *Length. For players under monopsony, the return to performance contains additional
coefficients involving the interaction terms between WAR, length, and the percentage of their
contract covering monopsony years.
Furthermore, the risk premium is evaluated by measuring the derivative of a player’s
Ln(Average Annual Salary) with respect to contract length. The risk premium for free agent
contracts is β2+ β3 *Length. The additional coefficients involving interaction terms between
WAR, length, and percentage of a contract covering monopsony years are included in the
derivative as appropriate for players under monopsony.
14
i. Return to Performance
For both position players and pitchers, the coefficient on the interaction between
LastWAR and contract length is statistically significant and negative at the 1% level. For free
agents, pitchers’ return to performance decreases by 8.83 % for every one year increase in
contract length, while position players’ return to performance decreases by 5.92% for every one
year increase in contract length. Evaluated at mean contract length of 1.46 years for pitchers
and 1.62 years for position players, a player can expect an additional win above replacement to
increase his salary by 33.6% and 29.1% respectively. However, because the return to
performance varies with contract length and the coefficient on the interaction between LastWAR
and contract length is negative, both position players and pitchers’ salaries may decrease from
an additional win above replacement when signing contracts of 7 years or more for position
players and 6 years or more for pitchers. For free agents, 7 pitchers and 36 position players are
calculated to have a negative overall return to performance, suggesting that given the lengths of
their contracts, an additional win above replacement is expected to reduce their average annual
salary.
In addition to the coefficients on LastWAR and the interaction between LastWAR and
contract length, players under different levels of monopsony have different returns to
performance as well. For a player whose contract only covers arbitration eligible years, the
coefficients on the interaction between LastWAR and pctArb are negative and statistically
significant at the 1% level. The coefficients on the interaction between LastWAR, contract
length, and pctArb are not statistically significant and are likely too highly correlated with the
previous interactions to have a measurable effect. For contracts covering only arbitration years,
position players can expect an additional year of contract length to decrease return to
performance by 15.2%, while pitchers can expect a decrease of 18.2% in comparison to free
agents. When evaluated at the average length of contract for all contracts with more than 0% of
length covering arbitration years, I used the mean contract length for non-zero percentage of

15
contract years for arbitration. The summary statistics for players with more than 0% of contract
years covering arbitration can be found in Table 10. At a mean contract length of 1.16 years for
pitchers and 1.34 years for position players, the return to performance decreases as the
percentage of the contract covering arbitration years increases. The distribution can be seen in
Table 11. At mean contract length of less than two years and when evaluated at 33% of
contract years, the decrease in return to performance as a result of monopsony is 5.75% for
pitchers and 4.85% for position players. Despite being very close to free agency, a player
signing a contract under less than one year of monopsony is still calculated to trade off return to
performance.
Lastly, the coefficients on the interactions between LastWAR and pctMLM are negative
and statistically significant as well. However, the coefficients on the interaction between
LastWAR, contract length, and pctMLM are not statistically significant because of
multicollinearity. For contracts covering solely pre-arbitration years, position players can expect
a decrease of 27.9% while pitchers can expect a decrease of 32.7% in return to performance for
each additional year of contract length, in comparison to free agents. To better evaluate the
effect of the different stages of pre-arbitration years, the mean contract lengths for contracts
covering more than 0% of pre-arbitration years is used. The mean contract lengths are 1.07
years for pitchers and 1.09 years for position players and can be seen in Table 12. As
expected, the return to performance decreases as the percentage of a contract’s years
approaches 100% pre-arbitration. For a contract covering 100% pre-arbitration years, a pitcher
can be expected to receive 32.38% less in return to performance, while a position player can be
expected to receive 27.38% less in return to performance. The full distributions are available in
Table 13.
The different degrees of monopsony and their effects on return to performance can be
better understood with a standard contract length and LastWAR. Assuming a contract length of
2.38 years for pitchers and 2.93 years for position players, which are both one standard
16
deviation from the mean for free agents, the return to performance decreases as levels of
monopsony increase. The distribution of the effects of monopsony on return to performance
can be seen in Table 14. For all levels of monopsony, return to performance is less than for a
free agent signing a contract of equivalent length.
Furthermore, the monetary effect of monopsony on the return to performance can be
evaluated at the 50th percentile and 75th percentile for WAR10. The 50th percentile of WAR for
pitchers and positions players are .5 and .6 respectively and can be thought of as starting
pitcher Jamie Moyer’s 2009 season with the Phillies and shortstop Asdrubel Cabrera’s 2013
season with the Indians. To determine the monetary differences between different levels of
monopsony, the full returns to performance, as measured at the free agent mean contract
lengths, are multiplied by the 50th and 75th percentiles of WAR.
The distribution can be seen in Table 15 and demonstrates the increase in return to
performance as service time increases. At Jamie Moyer’s level of 2009 performance, a free
agent pitcher gains an additional $65, 280 for his performance, while a pitcher with a contract
covering only arbitration years gains an additional $34,156. Lastly, a pitcher with a contract
covering only pre-arbitration years gains only an additional $5,512 for a Jamie Moyer 2009 level
of performance. Meanwhile, the distribution for positions players is more pronounced between
free agents and arbitration contracted players, than for pitchers. The return to performance for
Asdrubel Cabrera’s 2013 WAR is an additional $103,266 for free agents, $52,538 for arbitration-
only contracts, and $16,885 for pre-arbitration only contracts. Finally, as WAR increases, the
monetary differences in return to performance between the different levels of monopsony for
both pitchers and position players increases.
10 The 25th percentile has a WAR value of 0.
17
ii. Monopsony
While monopsony has an effect on the return to performance, the specification also
allows for an analysis of the effect of monopsony on average annual salary. To evaluate the
effect of monopsony on salary, I measure the derivative of Ln(Average Annual Salary) with
respect to pctArb and again with respect to pctMLM. The coefficients on pctArb and pctMLM
are both negative and statistically significant at the 1% level for pitchers and position players, as
expected. The coefficients on the interactions between LastWAR and pctArb and pctMLM are
also negative and statistically significant at the 1% level for both pitchers and position players,
suggesting that players receive less in salary despite better performance, while under
monopsony. Interestingly, players with contracts covering arbitration years do not lose as much
in average annual salary as players who are not yet eligible for arbitration.
Assuming a player’s contract only covers arbitration years and is evaluated at one
standard deviation above the mean for contract length for pitchers, 2.38 years, and position
players, 2.93 years, a pitcher receives 26.3% less in salary for a WAR value that is one
standard deviation above the mean. Additionally, a position player receives 34.21% less in
salary for a WAR value that is one standard deviation above the mean in comparison to a free
agent of equivalent performance and contract length. As expected due to bargaining power,
pre-arbitration eligible players receive even less salary than arbitration eligible players.
iii. Risk Premium
While theory predicts the risk premium, as measured by the tradeoff of salary in
exchange for contract length, should be negative, the coefficient on contract length is
statistically significant at the 1% level and positive for both position players and pitchers.
However, the endogeneity of contract length and average annual salary could be causing a
simultaneity bias. Because contract length and average annual salary are mutually determined
and better players get both longer contracts and higher average annual salaries, the tradeoff is

18
very difficult to measure. One promising solution is the inclusion of an instrumental variable
which affects the contract length but does not affect average annual salary.
Two potential instrumental variables which can be explored are positional year to year
volatility in performance and general managers. Positions like catcher and pitcher might be
inherently more volatile and cause players at those positions to be more interested in a long
term deal. If such volatility exists, there is a possibility they might prefer longer term deals. The
second possibility intuits that despite the inclusion of team –fixed effects, general manager
turnover is frequent and each general manager has different roster construction styles.
Different general managers might prefer different lengths of deals. The issue needs to be
explored further and is an important discussion point moving forward. Lastly, despite the
difficulties in observing the risk premium, 61 free agent contracts and 4 contract extensions had
negative risk premiums and the distribution of risk premium by contract length and monopsony
can be seen in Figures 6 and 7.
V. Conclusions
The results are very promising and provide evidence of the negative return to
performance and ultimately a form of compensating wage differential in contract extensions for
players not yet eligible for free agency. The results are also consistent with both Link and
Yosifov (2011) and Krautmann and Oppenheimer (2002). The distributions to return to
performance as contract length and performance increase, suggest a tradeoff between return to
performance and contract length for players under monopsony.
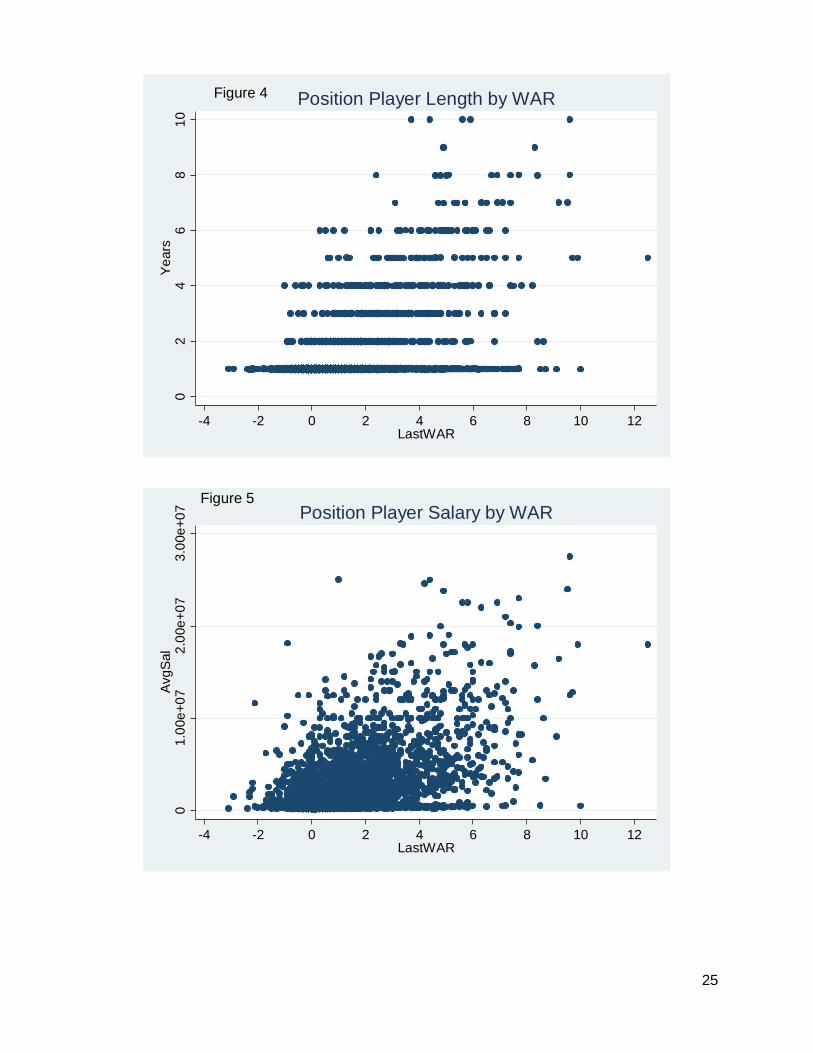
The full breakdown of returns to performance for extensions can be seen in Figure 8 and
demonstrate that players at the highest performance levels with the longest contracts are
actually receiving a negative return to performance. While other players have decreasing
returns to performance, they do not cross over into negative. Of the 194 position player contract
extensions, 51 have negative returns to performance while 19 of the 136 pitcher contract
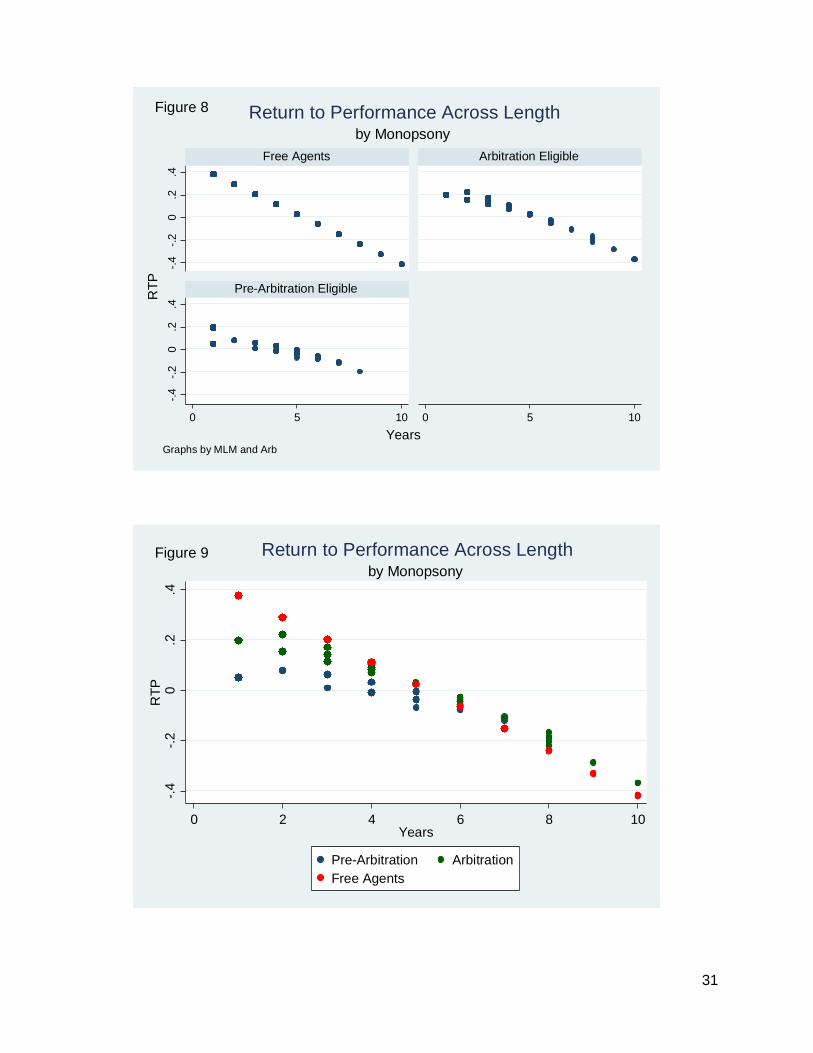
extensions have negative returns to performance. As seen in Figure 9, of the 1366 free agent

19
position player contracts 36 players have negative returns to performance, while 7 of the 1344
free agent pitcher contracts have negative returns to performance. While theoretically a player
should have a positive return to his performance, the players with negative returns to
performance have high annual average salaries, but the rate at which they are compensated for
their performance is driven down by the length of their contract. The negative coefficients on
the interaction terms including LastWAR suggest that despite superior performance to other
players, some players are still not paid at the level they deserve given their WAR and are thus
trading off their return to performance for additional years of contract length.
The results measuring the impact of monopsony on return to performance also call into
question the effectiveness of arbitration in raising salaries to free agency level. In Kahn (1993),
he asserts that arbitration and free agencies both raise salary, but only free agency raises
contract length. The results indicate that arbitration does indeed raise return to performance in
comparison to pre-arbitration players, but the return to performance is still lower than in free
agency. Even in the event of a contract covering a minimal amount of arbitration years, when
evaluated at one standard deviation from the mean of free agent contract length, a pitcher still
receives 3.86% less in return to performance and position players receive 4.82% less in return
to performance. For contracts of greater lengths, the return to performance only decreases.
While these results are very interesting and do provide evidence of a tradeoff between
return to performance and contract length, a more thorough investigation of the true risk
premium is necessary. I plan to continue my analysis and improve upon my specification with
better controls for player quality and the potential inclusion of an instrumental variable.
20
VI. References
Link, Charles, and Martin Yosifov. "Contract Length and Salaries Compensating Wage Differentials in Major League Baseball. " Journal of Sports Economics 13. 1 (2011): 3-19. Sage. 31 Jan. 2011. Web. 10 June 2013. Krautmann, A. , & Oppenheimer, M. (2002). Contract length and the return to performance in Major League Baseball. Journal of Sports Economics, 3, 6-17. Heitner, Darren. "Mike Trout's $510,000 Salary Is Unfair According To His Agent." Forbes. Forbes Magazine, 03 Mar. 2013. Web. 29 Apr. 2014. Holtzman, Jerome. "Indians Had Lots Of Talent, But They Also Had Hart." Chicago Tribune. Chicago Tribuine, 03 Oct. 1995. Web. 29 Apr. 2014. Kahn, L. (1993). Free agency, long-term contracts and compensation in Major League Baseball: Estimates from panel data. Review of Economics and Statistics, 75(1), 157-164. Maxcy, J. (2004). Motivating long-term employment contracts: Risk management in Major League Baseball. Managerial and Decision Economics, 25,109-120 Weiner, Michael. 2012-2016 Basic Agreement. 11 Dec. 2012. MLBPA and MLB Collective Bargaining Agreement. Fangraphs (2006) “Leaders”, player stats, http://www.fangraphs.com/leaders.aspx?pos=all&stats=bat&lg=all&qual=y&type=8&season=2012&month=0&season1=2012&ind=0 ESPN Free Agent Tracker (2006) “2013 MLB Free Agents”, signed, http://espn.go.com/mlb/freeagents (I used years 2006-2013 and copied and pasted) Raimondo, Henry J. "Free Agents’ Impact on the Labor Market for Baseball Players." Journal of Labor Research 4.2 (1983): 183-93. Print. Baseball Statistics and Analysis | FanGraphs Baseball. FanGraphs, 27 Mar. 2014. Web. 27 Mar. 2014.
DuPaul, Glenn. "What Is WAR Good For?" The Hardball Times. Fangraphs, 8 Aug. 2012. Web. 27 Mar. 2014.
Euston, Jeff. "Baseball Prospectus | Compensation | Baseball Prospectus." Baseball Prospectus | Compensation | Baseball Prospectus. Baseball Prospectus, 27 Mar. 2014. Web. 27 Mar. 2014.
"Extension Tracker." Extension Tracker (MLB Rumors - MLBTradeRumors.com). MLB Trade Rumors, 27 Mar. 2014. Web. 27 Mar. 2014.
"Inflation Calculator." U.S. Bureau of Labor Statistics. U.S. Bureau of Labor Statistics, 27 Mar. 2014. Web. 27 Mar. 2014.

21
"Transaction Tracker." Transaction Tracker (MLB Rumors - MLBTradeRumors.com). MLB Trade Rumors, 27 Mar. 2014. Web. 27 Mar. 2014.

22
Table 1
Year Pre-Arbitration
Arbitration Eligble Total Percentage Cumulative Percentage
2000 2 7 9 2.42% 2.42% 2001 3 11 16 4.30% 6.72% 2002 5 12 19 5.11% 11.83% 2003 2 7 13 3.49% 15.32% 2004 1 15 22 5.91% 21.24% 2005 2 19 24 6.45% 27.69% 2006 8 16 27 7.26% 34.95% 2007 4 26 38 10.22% 45.16% 2008 10 21 34 9.14% 54.30% 2009 9 18 28 7.53% 61.83% 2010 5 23 28 7.53% 69.35% 2011 7 29 36 9.68% 79.03% 2012 12 26 39 10.48% 89.52% 2013 8 21 39 10.48% 100.00%
78 251 372 100%
VII. Attachments
9
14
17
9
16
21
24
3031
2728
3638
29
CBA2002 CBA2006 CBA2012
010
2030
40Fr
eque
ncy
199920002001200220032004200520062007200820092010201120122013Season
Extensions by YearFigure 1

23
Table 2 Summary Statistics for Pitchers
LastWAR Average Salary Years % MLM % Arb Mean 0.96 $1,937,474.00 1.20 0.32 0.38 Standard Devation 1.29 $2,814,323.00 0.67 0.46 0.48 Min -1.9 $100,000.00 1 0 0 Max 8.1 $28,000,000.00 8 1 1 Count 4581 4581 4581 4581 4581
Table 3 Contract Distribution for Pitchers
Extensions 135 2.95% Free Agent Deals 1,344 29.34% Pre-Arbitration 1 year deals 1,701 37.13% Arbitration 1 year deals 1,401 30.58% Total 4581 100%
Table 4
Summary Statistics for Pitchers on Extensions LastWAR Average Salary Years % MLM % Arb Mean 2.88 $5,423,259.00 3.19 0.096 0.69 Standard Devation 1.87 $3,697,053.00 1.05 0.18 0.26 Min -0.8 $900,000.00 2 0 0.2 Max 8.1 $20,300,000.00 6 0.67 1 Count 136 136 136 136 136
02
46
8Y
ears
-2 -1 0 1 2 3 4 5 6 7 8LastWAR
Pitcher Length by WARFigure 2

24
Table 5 Summary Statistics for Position Players
LastWAR Average Salary Years % MLM % Arb Mean 1.16 $2,101,508.00 1.30 0.37 0.33 Standard Devation 1.69 $3,129,319.00 0.99 0.48 0.46 Min -3.1 $50,000.00 1 0 0 Max 12.5 $27,500,000.00 10 1 1 Count 4681 4681 4681 4681 4681
Table 6
Contract Distribution for Position Players Extensions 194 4.14% Free Agent Deals 1,366 29.18% Pre-Arbitration 1 year deals 1,879 40.14% Arbitration 1 year deals 1,242 26.53% Total 4681 100%
Table 7 Summary Statistics for Position Players on Extensions
LastWAR Average Salary Years % MLM % Arb Mean 3.43 $5,984,939.00 3.86 0.07 0.69 Standard Devation 2.11 $4,447,968.00 1.71 0.14 0.26 Min -1 $762,500.00 2 0 0.13 Max 9.6 $25,000,000.00 10 0.6 1 Count 194 194 194 194 194
01.
00e+
072.
00e+
073.
00e+
07A
vgS
al
-2 -1 0 1 2 3 4 5 6 7 8LastWAR
Pitcher Salary by WARFigure 3
25
02
46
810
Yea
rs
-4 -2 0 2 4 6 8 10 12LastWAR
Position Player Length by WARFigure 4
01.
00e+
072.
00e+
073.
00e+
07A
vgS
al
-4 -2 0 2 4 6 8 10 12LastWAR
Position Player Salary by WARFigure 5

26
(1) (5) (9) lnavgsal lnavgsal lnavgsal LastWAR 0.226*** 0.465*** 0.465*** (0.0105) (0.0242) (0.0242) Years 0.383*** 0.507*** 0.506*** (0.0171) (0.0279) (0.0348)
LastWAR_Years
-0.0882*** -0.0883***
(0.00819) (0.0104) pctMLM -1.341*** -1.094*** -1.089*** (0.0401) (0.198) (0.297) LastWARpctMLM
-0.365*** -0.368***
(0.0607) (0.0924) YearspctMLM
-0.0245 -0.0289
(0.192) (0.293) LastWAR_YearspctMLM
0.0400 0.0413
(0.0515) (0.0845) pctArb -0.722*** -0.691*** -0.696*** (0.0351) (0.115) (0.120) LastWARpctArb
-0.228*** -0.229***
(0.0407) (0.0413) YearspctArb
0.142 0.148
(0.0986) (0.108) LastWAR_YearspctArb
0.0478 0.0471
(0.0256) (0.0306) Age 0.0269*** 0.0297*** 0.0297*** (0.00390) (0.00395) (0.00349) Team Fixed Effects NO YES YES Position Fixed Effects NO YES YES Year Fixed Effects NO NO YES Constant 13.05*** 12.69*** 12.87*** (0.135) (0.153) (0.142) Observations 4581 4581 4581 R-squared 0.599 0.641 0.642
Standard errors in parentheses
** p<0.01 * p<0.05 *** p<0.001
Table 8
Pitcher Results
-

27
Position Player Results Table 9 (1) (5) (9) lnavgsal lnavgsal lnavgsal LastWAR 0.185*** 0.386*** 0.387*** (0.00798) (0.0169) (0.0152) Years 0.279*** 0.437*** 0.438*** (0.0122) (0.0216) (0.0268)
LastWAR_Years
-0.0589*** -0.0592***
(0.00464) (0.00535) pctMLM -1.463*** -0.846*** -0.860*** (0.0388) (0.155) (0.201) LastWARpctMLM
-0.341*** -0.336***
(0.0401) (0.0580) YearspctMLM
-0.306* -0.291
(0.147) (0.197) LastWAR_YearspctMLM
0.0628 0.0571
(0.0342) (0.0531) pctArb -0.642*** -0.536*** -0.528*** (0.0345) (0.0829) (0.0916) LastWARpctArb
-0.164*** -0.166***
(0.0268) (0.0258) YearspctArb
0.131* 0.124
(0.0585) (0.0778) LastWAR_YearspctArb
0.0126 0.0142
(0.0126) (0.0172) Age 0.00473 0.0124*** 0.0125*** (0.00374) (0.00367) (0.00349) Team Fixed Effects NO YES YES Position Fixed Effects NO YES YES Year Fixed Effects NO NO YES Constant 13.86*** 13.14*** 13.29*** (0.132) (0.155) (0.145) Observations 4681 4681 4681 R-squared 0.629 0.674 0.675
Standard errors in parentheses
** p<0.01 * p<0.05 *** p<0.001
-

28
Table 10 Summary Statistics for non-zero pctArb
Pitchers LastWAR Average Salary Years Mean 1.25 $1,646,531.00 1.16 Standard Devation 1.41 $2,033,599.00 0.65 Min -1.4 $200,000.00 1 Max 8.1 $20,300,000.00 6 Count 1797 1797 1797 Position Players LastWAR Average Salary Years Mean 1.63 $2,121,569.00 1.34 Standard Devation 1.87 $2,630,678.00 1.1 Min -2.1 $179,258.00 1 Max 9.6 $25,000,000.00 10 Count 1621 1621 1621
Table 12 Summary Statistics for non-zero pctMLM
Pitchers LastWAR Average Salary Years Mean 0.47 $534,431.00 1.07 Standard Devation 0.84 $826,624.00 0.45 Min -1 $200,000.00 1 Max 5.6 $12,400,000.00 5 Count 1474 1474 1474 Position Players LastWAR Average Salary Years Mean 0.55 $571,219.00 1.09 Standard Devation 1.14 $952,071.00 0.62 Min -3.1 $200,000.00 1 Max 10 $12,500,000.00 8 Count 1737 1737 1737
Table 11 Non-Zero pctArb Return to Performance
Pitchers Position Players
effect of average length for non-zero-.33 -5.75% -4.85% effect of average length for non-zero-.66 -11.51% -9.70% effect of average length for non-zero-1 -17.44% -14.70%

29
Effect of Monopsony on Return to Performance* Level of Monopsony Pitchers Position Players
33% Arbitration, 0% MLM -3.86% -4.11% 66% Arbitration, 0% MLM -7.72% -8.21%
100% Arbitration, 0% MLM -11.69% -12.44% 66% Arbitration, 33% MLM -16.62% -13.78% 33% Arbitration, 66% MLM -21.66% -15.24% 0% Arbitration, 100% MLM -26.97% -16.87%
*Evaluated at 2.38 Years for Pitchers and 2.93 Years for Position Players
Table 14
Table 13 Non-Zero pctMLM Return to Performance
Pitchers Position Players
effect of pctMLM-.33 pctArb-.66- non-zero -22.47% -18.97% effect of pctMLM-.66 pctArb-.33- non-zero -27.27% -23.04% effect of pctMLM-1 pctArb-0 - non-zero -32.38% -27.38%
Table 15
Median WAR 75th pctile WAR Mean Extensions WARPitcher Free Agent Increase 65,280.77$ 195,842.30$ 416,491.28$ Pitcher Arbitration Increase 34,156.82$ 102,470.46$ 217,920.51$ Pitcher Pre-Arbitration Increase 5,512.55$ 16,537.64$ 35,170.06$
Position Player Free Agent Increase 103,266.90$ 327,011.86$ 664,350.41$ Position Player Arbitration Increase 52,538.78$ 166,372.80$ 337,999.48$ Position Player Pre-Arbitration Increase 16,885.49$ 53,470.71$ 108,629.97$ *Eva luated at 1.46 Years for Pi tchers and 1.62 Years for Pos i tion Players
Return to Performance in Monetary Value

30
-.50
.51
-.50
.51
0 5 10 0 5 10
Free Agents Arbitration Eligible
Pre-Arbitration Eligible
riskp
rem
ium
YearsGraphs by MLM and Arb
by MonopsonyRisk Premium Across LengthFigure 6
-.50
.51
riskp
rem
ium
0 2 4 6 8 10Years
Pre-Arbitration Abritration EligibleFree Agents
by MonopsonyRisk Premium Across Length
Figure 7
31
-.4-.2
0.2
.4-.4
-.20
.2.4
0 5 10 0 5 10
Free Agents Arbitration Eligible
Pre-Arbitration EligibleRTP
YearsGraphs by MLM and Arb
by MonopsonyReturn to Performance Across LengthFigure 8
-.4-.2
0.2
.4R
TP
0 2 4 6 8 10Years
Pre-Arbitration ArbitrationFree Agents
by MonopsonyReturn to Performance Across LengthFigure 9