monorail technology study - ctr librarymonorail technology study" prepared by quinn brackett...
TRANSCRIPT

MONORAIL TECHNOLOGY STUDY
Prepared by
The Texas Transportation Institute
The Texas A&M University System College Station, Texas

"Monorail Technology Study"
Prepared
by
Quinn Brackett Mrinmay Biswas Rodger Koppa
and Stephen H. Lucy
of the
Texas Transportation Institute Texas A&M University
College Station, Texas 77843
February, 1983
for
The State Department of Highways and
Public Transportation

DISCLAIMER
This document is prepared for dissemination under the sponsorship of
the State Department of Highways and Public Transportation in the interest
of inforMation exchange. The State of Texas assumes no liability for its
contents or use thereof.
The contents of this report reflect the views of the authors who are
responsible for the facts and the accuracy of the data presented herein.
The contents do not necessarily reflect the official views or policy of the
State Department of Highways and Public Transportation.
This report does not constitute a standard, specification, or
requl a tion.
The State of Texas does not endorse products or manufacturers. Trade
or manufacturers' names appear herein only because they are considered
essential to the object of this document.
ii

PREFACE
This report combines the findings of Task I: A Review of Monorail
Systems,and Task II: An Operational Comparison. Task III was not completed
in accordance with the findings and recommendations of the first two tasks.
Task I summarizes the 11 state-of-the-art 11 of roonorail systems, their
characteristics, capabilities, and functional usage in urban transit. This
information was developed for the Texas State Department of Highways and Public
Transportation to familiarize the department with this technology and its
applicability to urban corridors in some of the larger Texas municipalities.
Early in this endeavor it was realized that the traditional literature
searches and document review would not produce the necessary information. Very
little information has been published in professional journals concerning
monorails,and what has been published is either out of date or unsuitable.
As a consequence, the majority of information collected came from organizations
which are currently operating or building monorail systems. While this is
without doubt the most current information, it is not in public domain and not
without bi as.
Perhaps because of the lack of a firm base in the.transportation litera
ture, there has been an accumulation of misinformation concerning the monorails
and their uses. Myths have been perpetuated based on previous exposure to
the technology in fair or amusement park settings or as the result of descrip
tions and appraisals of some of the earlier systems which have led transit and
public decision makers to dismiss monorails without the consideration they may
warrant.
It is the intent of Task I to serve as a primer to the current tech
nology which, it is hoped, will dispel some of the myths.
iii
Task II summarizes the results of a comparison of the operational
characteristics of a Monorail Transit System to other line-haul transit modes
suitable for use in urban areas.
The Appendices supporting this report are bound under separate cover.
iv

Task I:
A Review of Monorail Systems

TABLE OF CONTENTS
SECTION PAGE
Introduction
Monorail Description . . . . . . .. . . . . .. . . . . . . . . . . . . . . . . . . . . . . . .. . .. .. .. . . . 3
Definition . . . . . . . . . . . . . . . . . . . . . . . . . . . . . . . . . . . . . . . . . . . . . . . . . . . . . . 3
Types . . . . . . . . . . . . . . . . . . . . . . . . . . . . . . . . . . . . . . . . . . . . . . . . . . . . . . . . . . . 4
History . . . . . . . . . . . . . . . . . . . . . . . . . . . . . . . . . . . . . . . . . . . . . . . . . . . . . . . . . 7
System Characteristics . . . . . . . . . . . . . . . . . . . . . . . . . . . . . . . . . . . . . . . . . . . . . . . 9
Ro 11 i ng Stock . . . . . . . . . . . . . . . . . . . . . . . . . . . . . . . . . . . . . . . . . . . . . . . . . . . 9
Structura 1 Components . . . . . . . . . . . . . . . . . . . . . . . . . . . . . . . . . . . . . . . . . . . 11
Stat i ans . . . . . . . . . . . . . . . . . . . . . . . . . . . . . . . . . . . . . . . . . . . . . . . . . . . . . . . . 16
Monorails In Service . . . . . . . . .. . . . . . . . . . . . . . . . . .. . . . . . . . . . . . . . . . .. . . . . 17
United States . . . . . . . . . . . . . . . . . . . . . . . . . . . . . . . . . . . . . . . . . . . . . . . . . . . 17
Europe 19
Asia . . . . . . . . . . . . . . . . . . . . . . . . . . . . . . . . . . . . . . . . . . . . . . . . . . . . . . . . . . . . 20
Sys tern Eva 1 uati on . . . . . . . . . . . . . . . . . . . . . . . . . . . . . . . . . . . . . . . . . . . . . . . . . . . . 22
Genera 1 . . . . . . . . . . . . . . . . . . . . . . . . . . . . . . . . . . . . . . . . . . . . . . . . . . . . . . . . . 22
Specific . . . . . . . . . . . . . . . . . . . . . . . . . . . . . . . . . . . . . . . . . . . . . . . . . . . . . . . . 24
Summary and Conclusions . . . . . . . . . . . . . . . . . . . . . . . . . . . . . . . . . . . . . . . . . . . . . . 29
Synopsis . . . . . . . . . . . . . . . . . . . . . . . . . . . . . . . . . . . . . . . . . . . . . . . . . . . . . . . . . . . . . 31
References . . . . . . . . . . . . . . . . . . . . . . . . . . . . . . . . . . . . . . . . . . . . . . . . . . . . . . . . . . . 32
vi

FIGURE
1. Monorail Structure
LIST OF FIGURES
PAGE
5
2. Guideway Designs ................................................. 12-13
3. Pi er Support Designs . . . . . . . . . . . . . . . . . . . . . . . . . . . . . . . . . . . . . . . . . . . . . 15
vii

LIST OF TABLES
TABLE PAGE
l. Rolling Stock Characteristics .... ............ ........ .. .. ........ 10
2. Monorail Usage . . . . . . . . . . . . . . . . . . . . . . . . . . . . . . . . . . . . . . . . . . . . . . . . . . . 18
3. Utilization of Major Urban Rail Systems .......................... 25
4. Generic Transportation Comparisons .............. ...... ........ ... 27
viii

INTRODUCTION
In 1960, Hermann Botzow published his masters thesis on monorails in
book form. In the foreword to the book, A. S. Lang, Botzow's academic advisor,
wrote; 11 It is surely no secret that the problems of transporting people and
goods in and around our cities have assumed major proportions. The time has
long since passed when we should have marshalled all our technological capa
bilities in search of workable solutions to them. Yet the field of transpor
tation engineering suffers from a singular lack of unity and central purpose •.
There has been little attempt made, for instance, to assess soberly the
characteristics of our available transportation media and to compare them on
their basic merits. It seems that partly as a result of this neglect we
are not solving our problems as quickly as we should.
"Among the forms of transportation thought appropriate to the urban
environment, monorail is both the most loudly hailed and the least well under
stood. It has been promoted to the point that it has its wild enthusiasts;
yet no one has seen a monorail transit system in actual operation. The
fact is that we have little reliable information on the subject~ because no
one has yet taken a look, which attempted to be at once objective and relatively
complete. 11 ( 1)
A good portion of this statement is still true some twenty years after
it was written. While there have been atterripts at solving urban transportation
problems using new and innovative approaches they have generally focused on
making more efficient use of the existing highway system. These approaches
include the dedication of special use lanes for high occupancy vehicles (HOV)

or reverse traffic flow. There have also been attempts to compare transit
modes on their merits. However, in the United States the application of
monorail technology to transit systems appears to have been frozen in time.
The technology itself has been advanced and applied in the urban mass transit
mode in other countries,but transit authorities in the U.S. still respond as
if it is an unproven system with little reliable information available.
Perhaps this is due to the difficulty in obtaining information or the
casual observation that monorail systems have been limited to the circulation
of tourists and have no place in a transit system.
The information exists, but it is difficult to acquire because it is
generally anecdotal and must be obtained first hand. The characteristics of
the foreign transit systems that have been built using monorails are not directly
applicable because of geographical, cultural and, in some cases, physical
differences of the ridership population. However, the structures, performance
characteristics and operations can serve as models of the technology.
The most valuable contribution this report can make is to bring to the
attention of the reader the changes that have taken place in monorail tech
nology and to correct some of the erroneous notions that have grown up for
the last twenty years.
2

MONORAIL DESCRIPTION
As can be surmised from the word itself ,"monorail" means "single rail".
It is one of those generic terms that covers a variety of systems and is
apt to lead to miscommunication. It will conjure different mental images
depending on the experience of the individual using it and the context of the
conversation.
Perhaps the most prevalent monorail system in use today is the over-
head crane type that can be found in large industrial complexes over the globe.
These, of course, are not the subject of interest because they are not generally
used to transport passengers. Historically, however, the passenger variety
of monorail systems had their humble beginnings as cargo carriers.
The interest here is in the passenger carrying monorails. Again there
are various types of these systems. They can be categorized according to
structure and the method of propulsion.
A good description of the subject systems is required (if the pun can be
forgiven) to get everyone started on the right track. This includes a sound
working definition, a classification of the types of systems, and a brief
history.
DEFINITION
Monorail is a term applied to various types of passenger and cargo
vehicles that travel on a single track or beam. Since the current discussion
is concerned with transportation of passengers in urban areas, this definition
can be amended for that context.
3
Urban monorails are those vehicles that travel on a single rail or beam
that can be used to carry passengers in urban areas.
It should be noted that this definition includes some systems that are
not currently being used for urban transit.
TYPES
Monorail systems that currently satisfy the definition can be classified
according to their structure and their method of propulsion.
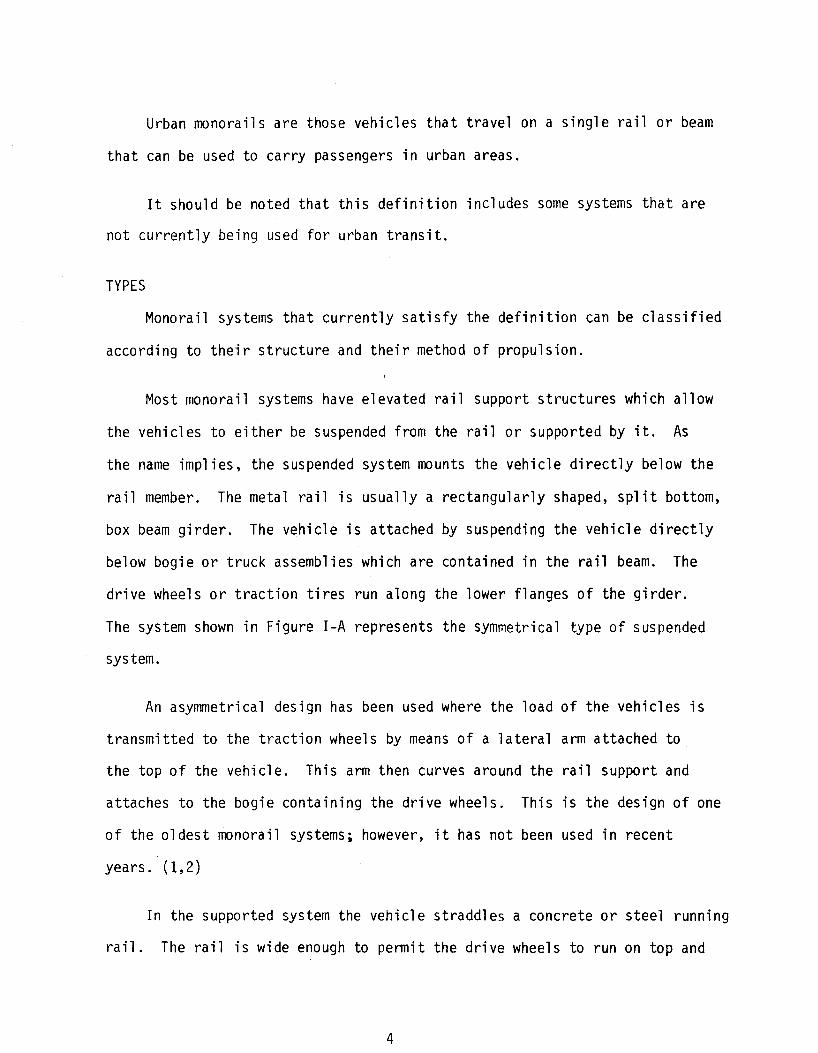
Most monorail systems have elevated rail support structures which allow
the vehicles to either be suspended from the rail or supported by it. As
the name implies, the suspended system mounts the vehicle directly below the
rail member. The metal rail is usually a rectangularly shaped, split bottom,
box beam girder. The vehicle is attached by suspending the vehicle directly
below bogie or truck assemblies which are contained in the rail beam. The
drive wheels or traction tires run along the lower flanges of the girder.
The system shown in Figure I-A represents the symmetrical type of suspended
system.
An asymmetrical design has been used where the load of the vehicles is
transmitted to the traction wheels by means of a lateral arm attached to
the top of the vehicle. This arm then curves around the rail support and
attaches to the bogie containing the drive wheels. This is the design of one
of the oldest monorail systems; however, it has not been used in recent
yea rs . ( 1, 2)
In the supported system the vehicle straddles a concrete or steel running
rail. The rail is wide enough to pennit the drive wheels to run on top and
4

a. 11111,ortM
Fi qure lo Monorail Structures
Source: Japanese Monorail Association Brochure 5

deep enough to allow support wheels to be mounted on either side to maintain
lateral stability (see Figure I-8). This arrangement creates the impression
that the vehicle is almost wrapped around the rail.
Most supported systems are variations of the Alweg design. This design
was developed by a Swiss industrialist named Alex Wenner-Gren in collaboration
with the Krupp Corporation of West Gennany. (1,2,3)
The propulsion systems that have been used for monorail systems include:
gasoline engines, electric motors, cable drive and magnetic levitation. Of
these, by far the most prevalent has been the use of electric motors. A
few demonstration systems using gasoline engines were built in the 1950 1 s
and 60's but they were discontinued. Cable drive systems are being used to
propel vehicles where the distance travelled is short,and trips can be from
point to point with few stops in between. Magnetic levitation is a relatively
new technology in which magnetic forces are used to both lift the vehicle and
propel it. Current designs use a single rail for these systems; however,
they are proposed for use in an interurban network because of the high speed
they are able to achieve. Maglev systems have attained speeds in excess of
250 mph. (4)
The system most likely to be found in use as urban transport would use
electric motors for propulsion and be of the suspended or supported type. These
systems represent existing, state-of-the-art technology requiring no research
and development for implementation. The other systems mentioned either have
restricted uses or are pushing the state-of-the-art in terms of technological
development. Consequently, the focus of this report will be on the electric
systems of either the suspended or supported variety.
6

HISTORY
Monorails have been in use since 1821 when an Englishman built a horse
drawn system for transporting materials in a London navy yard. This monorail
and another one like it were built by Henry Palmer using board rails supported
at intervals by poles.
The first passenger monorail was built in 1876 for the Philadelphia
Centennial Exposition. In 1890, a commercial line was developed connecting
Brooklyn and Coney Island. During this same period several other cargo and
passenger monorail lines were established in California and Ireland.
In 1901, a suspended type passenger system was constructed in Wuppertal,
Germany. This system is still in operation carrying over 16 million passengers
annually.
Ostensibly, the cargo monorails were developed either to conserve space
and reduce transportation costs. The passenger monorails were built for
their cost savings but also for their novelty and to provide a scenic vantage
platform. Undoubtably, part of the motivation for building these systems
rested in the engineering challenge they presented and the sheer love of
the concept. This motivation was necessary to sustain the monorail enthusi
asts during the automobile and highway expansion period following World War II.
In the late 1950's there was a resurgence of interest in "new" technology
which was created by the prosperous economic conditions and the "Sputni ck"
challenge in space. This led to repeated demonstrations of Space-age monorail
systems in Houston and Dallas, Texas, Disneyland in California, and in
7

Cologne, Germany. With the exception of the Disneyland system, these prototypes
were removed or were abandoned after a short period. The Disneyland system
has been continuously upgraded and improved. It is still in operation.
The demonstration of monorail technology continued in the 1960's with
installations at the Seattle World's Fair, the Tokyo Zoo, Hemisfair in San
Antonio, Texas,and many other areas. For the most part these systems were in
tended to circulate tourists about fair grounds and amusement centers. Once
the attractions were over, the lines were usually discontinued. (1 ,3)
In the 1970 1 s,monorail systems began to be considered again as a means
of transporting passengers in a transit rather than a tourist mode. This
has occurred primarily in Japan.
In the United States monorails have been considered in general as part
of the Federally required alternative evaluation process conducted prior to
implementing a new transit system. However, these comparisons have generally
dismissed monorails as unproven technologies. Consequently they have not been
considered eligible for federal funding support, and not included in the de
tailed evaluation.
8

SYSTEM CHARACTERISTICS
Monorails, like most other.transit systems, have three major components:
vehicles, track and stations. Vehicles, generally referred to as rolling
stock, include propulsion and propulsion with passenger units. The track in
this case is the elevated structure used to carry the rolling stock. The
stations, of course are the platforms used for loading or unloading passengers.
ROLLING STOCK
The major difference between monorail vehicles and traditional rail
road vehicles is that the propulsion units on monorails are included in each
car. There is no locomotive per se. The lead vehicle in a train has a space
for the operator; otherwise,it is identical to the rest of the cars.
The size, weight and passenger carrying capacity vary with the type of
system being used as does the vehicle performance. The range of passenger
capacity is from 40 per car for the scaled down Alweg version used at Disney
world where standing passengers are not allowed,to 229 in the Japanese Hatachi
Alweg. The 229 passenger capacity is based on a crush condition allowing only
one square foot for each passenger.
The propulsion units are usually 600 volt, direct current motors which
are capable of propelling the vehicles in excess of 60 mph. The normal operat
ing speed is in the 45 mph range.
A summary of the characteristics of the rolling stock is presented in
Table l for four systems now in operation. It should be remembered that only
the systems in Germany and Japan are being used in a transit mode.
9

System
~
Vehicle Descri_Etion
Empty Weight (lbs.)
Gross Weight (lbs.)
Table l.
Wuppertal, Germany
Suspended (MAN)
48,896 79,380
Normal Passenger Space:
Seated Standing Area (ft. 2)
Crush Passenger Space:
Seated Standing
2 Area ( ft. )
Vehicle/Train
Vehicle Performance
48 98 2.26
48 156
1. 35
2
Max Capacity(psgr/hr) 3,672 Min Headway(sec) Cruise Velocity(mph) Max Velocity(mph) Max Grade{%)
Propulsion
Motor per car Motor Pl a cement Power Type
Switching
Type Time (sec)
UKN 16-17 37.3
+3
2
1/Bogi e 600 voe
UKN UKN
Rolling Stock Characteristics
Tokyo, Japan
Supported (Hatachi-Alweg)
55,000 87,780
56 143
1. 21
56 173
1.0
4-8
62,000 90 45
50-70 10
4
a 11 axles 750-1500VDC
Flexible Beam 8-10 10
Seattle, Washington
Supported (Alweg)
25,000 40,000
61 82 UKN
61 UKN UKN
4
10,000
Single Trains 45 60+ UKN
2
1/Bogi e 600 voe
No Switching No Switching
Disneyland, Florida
Supported (Modified A 1 weg T
18,400 24,520
40
No Standing UKN
40
No Standing UKN
5-6
10,000 90 40 60+ 6
1-2 Bogie 600 voe
. Beam Replacement 30

STRUCTURAL COMPONENTS
As with all structures, the monorail structural system is composed of
several components: the guideway, the pier supports, and the foundation.
The guideway is the most essential and unique aspect of the monorail
system. The ideal guideway would be of uniform dimensions, which
should be toward practical minimums, provide for complete housing of and
access to all basic system support hardware, be visually attractive and
acceptable, and be structurally sound and economically realistic. This is,
obviously, a tall order for any structural component. Trade-offs and con
cessions must be made, but no compromise may be made on structural capacity
and provision for support hardware. This leaves aesthetics, economics, and
possibly some peripheral functions as negotiable features.
There have been several guideway structural configurations developed
for each type of monorail system. In the case of the supported monorail,
the most corrnnon configuration is a hollow reinforced or prestressed concrete
I-beam. (Figure 2A) This allows the drive wheels to run along the top sur
face of the beam and the stability wheels to run along the side of the beam.
In the Alweg system, for a 100 ft. span, a beam 3 ft. wide and 5 ft. deep is
required. In the majority of construction cases, precast prestressed beams
are used for straight and large radius curved sections while reinforced con
crete is used on the.remaining curved sections.
Suspended monorails usually use steel guideways when supported asynmetri
cally and concrete or steel with steel or wood running surfaces, guideways
when supported symmetrically. Modern assymetric supported monorails have
11

~ TO CAR
BOGIE \_ .....
STABILITY WHEELS
DRIVE WHEEL
CAR
A. l•BEAM GUIDEW A Y FOR
SUPPORTED MONORAIL
STABILITY WHEELS
DRIVE BOGIE
B. GUIDEW A Y FOR ASYMMETRIC SUSPENDED MONORAIL
Fiqure 2. RUIOEWAY DESIGNS 12

--HANGER
GUIDEWAY 11:r--- ST A81LITY
WHEELS
CAR
C. 8ll8PBIDD aYII ... TlltC IIOIIIIIAL
Figure 2 (Cont'd). GUIDEYAY DESIGNS
13

a triangular shaped steel rail which allows the drive wheels to run along the
flat top surface of the rail and the stability wheels to run along either side
of the sloping side surfaces as shown in Figure 2B. The synmetric supported
monorails have a split-bottom box girder made of prestressed concrete or steel
plate with a wooden or steel plate running surface on the inside of the lower
flanges. The box girder must be large enough to allow the bogie or truck to
ride inside the girder. See cross section of this design in Figure 2C.
There are really only three basic types of pier supports~ T-shaped support,
inverted J-shaped support, and single column support. These are shown in
Figure 3A, B, and C. If two-way traffic is desired,the T-shaped pier support
will economically support one rail at each end of the cross member. The in
verted J-shaped pier support is used when only one-way suspended monorail
traffic is desired. The single column support is used for one-way supported
monorail traffic.
One pier support system which is currently under investigation is the
use of a cable-stayed guideway,a concept similar to a suspension bridge. This
approach, which would require extremely tall supports, would only be feasible
in open or suburban areas. This approach is also applicable to all three types
of monorail systems and would allow space of up to 300 ft. for the guideway.
Placement of the supports is perhaps the single most important element .
in the structural evaluation of guideways types. The constraints and limitations
on support placement in an urban environment are restrictive. First and most
obvious, pier supports must be kept clear of intersecting streets, not only
for vehicle clearance but for sight distance as well. This also applies to
any driveways or building loading zones. Very often, utilities will dictate
areas to be avoided, particularly justified. Another significant constraint
14

GUIDEWAY A. •y• SHAPE
e.· INVERTED •J• SHAPE
C. SINGLE COLUMN SHAPE
Fiqure 3. PIER SUPPORT DESIGNS
15

is support placement related to adjacent architecture. Both urban designers
and building owners are sensitive to aesthetic integration of the structure
with building features. These constraints, taken collectively, will usually
dictate support placements that give wide variations in guideways>span lengths.
These constraints will also have an influence on the type of pier support
best suited for the job and, furthermore, on the size and type of the guideway
to be employed.
Any currently accepted form of foundation system can be made sufficient
to meet the loading and peripheral requirements imposed by the system. In
most cases, the most critical loading on the foundations will be movement caused
by the lateral wind load on the vehicle with respect to the pier support and
the centrifugal force from the vehicle.
STATIONS
The elevated nature of most monorail systems dictates that loading plat
forms or stations also be elevated. When the system descendslas is the case
in the Disneyworld hotel, the stations can also be lowered. The station lay
out depends on the number of lines and desired loading points. There can be,
for example, center loading stations between two tracks. There could also be
three platforms, two outside and one center. Single line platforms can be
located on either or both sides.
Station appointments could also vary with specified usage. As a mini
mum, they should include shelter from the elements for passengers, protection
for fare collection mechanisms as well as queueing and safe boarding devices.
The major consideration concerning stations is the length of the boarding
platform. It is the platform length that governs train length and thereby
line carrying capacity. 16

MONORAILS IN SERVICE
A compilation of operational monorail systems, not associated with
fairs nor intended for short term use, is presented in Table 2. This list was
derived from various sources. It is reasonably comprehensive but not ex
haustive. It provides an idea of the numbers, types and usage of the techno
logy. This Table also includes the Japanese monorails that are under con
struction as well as a list of those being planned. (l,2,3,5,6)
Although Table 2 summarizes the salient points for each system, addi
tional information concerning these systems is presented in the following
sec ti ans.
UNITED STATES
There are presently four major monorail systems in use in the United
States: two located at Disney amusement centers, one recently constructed
at Memphis, Tennessee,and one operational at Seattle, Washington.
The monorail located in Disneyland in California is a down-scaled version
of the Alweg supported design. It has two stations and is used to provide
a scenic tour of the park. The monorail syste~ at the Disneyworld Park in
Florida is longer but of similar design. It serves as the main link between
the parking areas, hotel and park. Recently expanded, this system will
provide transportation to a new attraction called the Epcot Center. Disney
world's monorails presently carry over 25 million passengers a year and have
a reliability record of 99.9% sustained over a ten year period. (5)
17

Table 2 11onora i ls Usage
OPERATIONAL SYSTEMS
Date Built Loca ti or. Length (11iles} ~ Use
1901 ~/upper ta l , 9.3 Suspended, Transit West Germany Electric (18 stations)
1959/61 Disneyland, ?. • 5 Supoorted, Tourist California Electric
1962 Seattle, 1.1 Supported, Transit/ 1-Jashi ngton Electric Tourist
1962 Inuyama, .86 Suspended, Unknown Japan Electric
1964 Tokyo, 8.2 Suspended, Transit, Ja;ian Electric (Airport)·
1964 Yomuriland, l. 9 Sur>Ported, Tourist Japan Electric
1971/82 Disneyworld, 7.0 Sunoorted, Transit/ Florida Electric Tourist
1980 Rhyl, 1.1 Suoported, Tourist North l·Jales Electric
1981 Memphis, .68 Suspended, Tourist Tennessee Cable
UNDER CONSTRUCTIOfl
1983 Kitakyushu, 5.2 Supoorted, Transit Japan Electric (12 stations)
1984 Osaka, 8.3 Supported, Transit Japan Electric (9 stations)
1986 Chiba City, 19.4 Supported, Transit Japan Electric (18 stations)
1987 r:aha City, 4 .1 Supported, Transit Okinawa Electric (14 stations)
PLANNED
Kawasaki, 23.8 Transit Japan
Okayama, 13.1 Transit Japan
Kumar.iota, 6.3 Transit Japan
Gifu, 8.8 Transit Japan
18

The cable powered, suspended system built in Memphis is used to shuttle
tourists from the city proper to a recreational area at Mud Island. This
unique system is suspended from the underside of a highway bridge crossing
the Mississippi River. It has the capacity of carrying 3000 passengers
each hour, making it the 11 highest capacity ropeway transportation system in
the United States. 11 ( 7)
The Seattle monorail was originally constructed for the World 1 s Fair
in 1962. It is a two station system designed to transport passengers from
downtown parking to the fair grounds. Reportedly, the original capital costs
of the system were recovered in the first five months of operation. Rather
than remove the system it was donated to the Seattle Center which now operates
the fair area as a cultural and amusement center. Currently, over 2 million
passengers make the 1.2 mile trip each year. The 35 cent fare generates
enough revenue to offset the operational cost. One cost savings aspect of
the operation is the method of accelerating to 60 mph in the first quarter
mile, thencoasting the rest of the trip. This reduces the electricity usage
while keeping the trip time down to around 90 seconds. (6,8)
EUROPE
Certainly, the Schwebebahn (swinging railroad) of Wuppertal, Gennany
illustrates the serviceability of monorail systems. This system, which has
been operating continuously since 1901, carries over 16 million corrmuters
annually. Botzow reported in 1960 that over one billion passengers had
traveled the line at that time with a report of only two injured passengers.
19
One of the injuries resulted from the panic of a baby elephant which was being
transported as a promotional stunt in 1952. He also points out that this
low speed system (17 mph) was operating at a profit. (1,3)
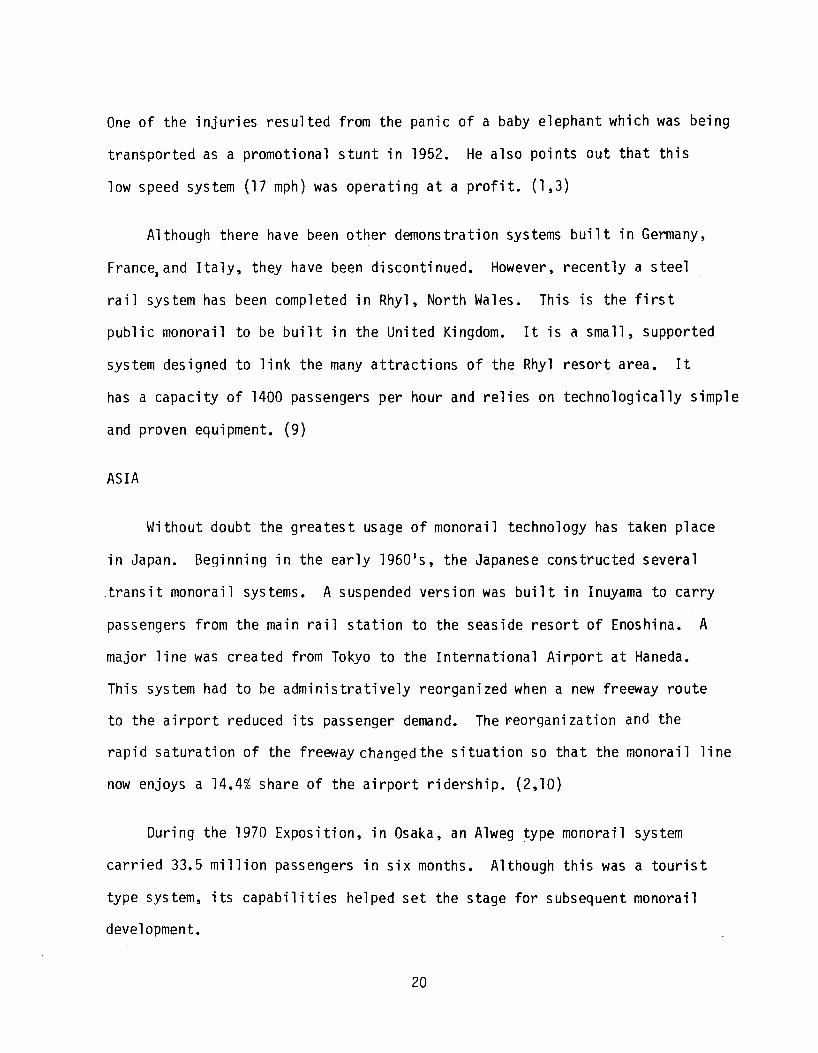
Although there have been other demonstration systems built in Germany,
France,and Italy, they have been discontinued. However, recently a steel
rail system has been completed in Rhyl, North Wales. This is the first
public monorail to be built in the United Kingdom. It is a small, supported
system designed to link the many attractions of the Rhyl resort area. It
has a capacity of 1400 passengers per hour and relies on technologically simple
and proven equipment. (9)
ASIA
Without doubt the greatest usage of monorail technology has taken place
in Japan. Beginning in the early 1960 1s, the Japanese constructed several
transit monorail systems. A suspended version was built in Inuyama to carry
passengers from the main rail station to the seaside resort of Enoshina. A
major line was created from Tokyo to the International Airport at Haneda.
This system had to be administratively reorganized when a new freeway route
to the airport reduced its passenger demand. The r-eorganization and the
rapid saturation of the freeway changed the situation so that the monorail line
now enjoys a 14.4% share of the airport ridership. (2,10)
During the 1970 Exposition, in Osaka, an Alweg type monorail system
carried 33.5 million passengers in six months. Although this was a tourist
type system, its capabilities helped set the stage for subsequent monorail
development.
20

The cause for the interest in monorail systems in Japan was created by
a combination of dramatic increases in automobile traffic and the high costs
associated with the construction of subway rail systems. In 1972, the
Japanese parliament enacted legislation to promote urban monorail systems.
This legislation included a mechanism allowing monorail track to be considered
a special type of road and therefore eligible for interest free loans from
public construction funds. Since the 1972 legislation,construction has begun
on four systems,and many others are in various stages of planning.
21

SYSTEM EVALUATION
All systems can be evaluated in both general and specific terms. General
evaluations consider the advantages and disadvantages of a particular system
without comparisons to other systems. Specific evaluations, on the other hand,
attempt to be more quantitative by using other systems as a frame of reference.
They are concerned with such things as the efficiency of a given system or its
ability to produce desired results at the smallest cost.
To go further, specific evaluations may be equivalent or generic in
nature. An equivalent evaluation attempts to compare the efficiency of systems
with respect to some predefined requirements, or to compare systems designed
for a specified operating environment. The generic evaluation attempts to com
pare salient aspects of representative examples of each systems with the
realization that they are not equivalent. This type of evaluation,grounded on
real-world examples, trades experience for rigor to provide a general idea of
the rank order of efficiency of widely different systems. The generic type of
evaluation was considered appropriate for this section.
GENERAL EVALUATION
The commonly stated advantages of monorail systems are that they:
l. Can be constructed quickly and simply
2. Have low construction costs
3. Are grade separated
4. Require minimal area at grade level
5. Have high ride comfort, little car sway
22
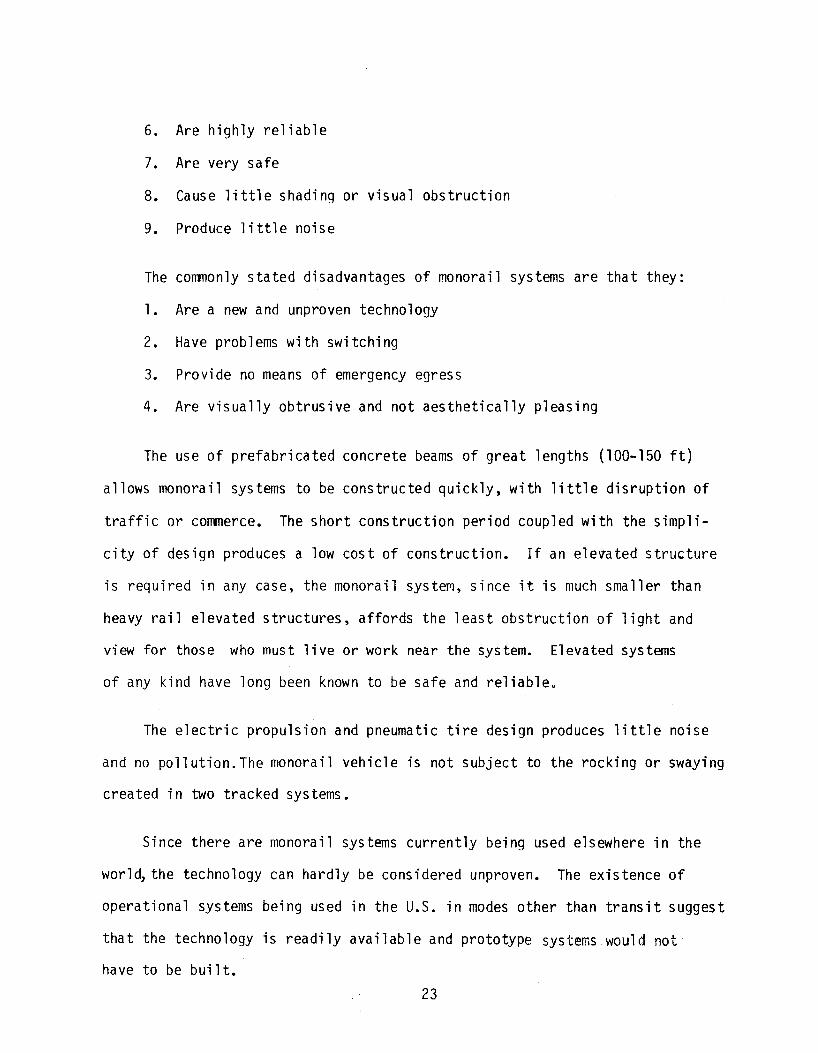
6. Are highly reliable
7. Are very safe
8. Cause little shading or visual obstruction
9. Produce little noise
The co11111only stated disadvantages of monorail systems are that they:
l. Are a new and unproven technology
2. Have problems with switching
3. Provide no means of emergency egress
4. Are visually obtrusive and not aesthetically pleasing
The use of prefabricated concrete beams of great lengths (100-150 ft)
allows monorail systems to be constructed quickly, with little disruption of
traffic or co11111erce. The short construction period coupled with the simpli
city of design produces a low cost of construction. If an ele~ated structure
is required in any case, the monorail systeM, since it is much smaller than
heavy rail elevated structures, affords the least obstruction of light and
view for those who must live or work near the system. Elevated systems
of any kind have long been known to be safe and reliable"
The electric propulsion and pneumatic tire design produces little noise
and no pollution. The monorail vehicle is not subject to the rocking or swaying
created in two tracked systems.
Since there are monorail systems currently being used elsewhere in the
world, the technology can hardly be considered unproven. The existence of
operational systems being used in the U.S. in modes other than transit suggest
that the technology is readily available and prototype systems would not
have to be built. 23

Switching of monorail vehicles from one track to another is not the
problem it has been. Flexible beams or beam replacement systems now allow
switches to be made in less than 30 seconds, which is sufficient to accommodate
trains operatin~ on 90 second headways.
Although slide chutes can be installed to permit egress from monorail
vehicles in emergency situations, their safety and reliability records would
not seem to warrant it. Slide chute opera ti on without the presence of an
attendant might pose a hazard; howeve~ the one operator on board might be
able to oversee their deployment.
When aesthetics are considered, there is no doubt that an elevated
structure placed in a collection of expensive office buildings or in resi
dential neighborhoods would not be readily appreciated for its beauty.
Experience in Seattle, Washington,and around San Francisco Bay has shown,
however, that elevated systems come to be accepted in time whether monorail
or heavy rail. Eventually, new structures are designed around the monorail
system to provide a more pleasing and integrated archetecture.
SPECIFIC EVALUATION
The efficiency of a transit system is determined by some measure of its
carrying capacity and the cost associated with generating that capacity. As
far as capacity is concerned, the current systems in use demonstrated a
capability of providing a wide range of capacities. Using variations in train
lengths and spacing, a given monorail line can satisfy most demands placed
on it. It should be pointed out that while some heavy rail systems are capable
of servicing larger demands, they seldom operate at or near capacity. (Refer
to Table 3) . ( 11 ) 24

Average Passenger Per Car
Car Capacity
Average Occupancy as% of Capacity
Source: ( 11)
TABLE 3 Utilization of Major Urban Rail Systems
World Wide Average New York Paris Metro
40.9 38.3 28.8
185 350 164
27.4 11. 0 17.6
25
Moscow Tokyo TRTA
54.5 72.3
170 144
32.0 50.2

The two major cost components of transit systems are the capital costs
and operational costs (sometimes refered to as operation and maintenance or
O&M costs). Obviously, capital costs depend on the length of the system, number
of lines, pieces of rolling stock, right of way, stations, construction time,
etc. But for a given system they are fixed. Operational costs, on the other
hand, are variable. They vary with the level of service provided and to some
extent the reliability and safety of the system.
Capital costs for monorail systems are lower than those for heavy rail
systems constructed either above or below grade lev0l. The construction cost of
elevated structures for monorails is cheaper due to the lighter weight of the
rolling stock and the relatively longer span distances involved. The cost
of elevated monorail structures has been estimated to be 1/3 to 1/4 the
subway construction cost for the same transportation capacity which is one
reason why Japan, which has limited space, is pursuing monorail development. (2)
However, the capital cost of a heavy rail system built at grade is less than
that of an elevated monorail as would be the cost of most light rail systems
which are built at grade.
Operating costs of monorail vehicles are about equivalent to those of
light rail vehicles which in turn are lower t1an those of heavy rail. However,
since the heavy rail vehicles carry a qreater number of passenners, the cost per
passenger is about the same.
A summary to these comparisons is presented in Table 4. Included with
the data for the monorail systems is similar information for two examples
of heavy rail and two examples of light rail systems. It should be recalled
that this is not intended as an equivalent comparison, but is included to
26

Table 4 Generic Transportation Comparisons
Manora i 1
COST Tokyo Seattle Capital Cost (Mill ion $)
'33.6-61.5* + 8.5-11.6 +
Annual Operating Cost (Million $)
CAPACITY Length (Mi 1 es) Pea k Hour Li n e
Capabi 1 i ty
Annual Passengers (Million)
N Annual Psgr. Mile '-I (Million)
EFFICIENCY
UKN
8.2 45,000
UKN
UKN
Capital Cost I 4.1-7.5 per Mi le (Mi 11 ion $)
Capital Cost per Mile I 167 per Unit of Peak Hr. Capacity ($)
Operating Cost I UKN per Passenger Mile
($) .
Operating Cost I UKN per Route Mile ·(Million $)
Implementation I 2-3 Time (Yrs.)
.6
1.1 10,000
2.1
2.3
7.7-10.5
1050
.26
. 5
2-3
Disneyworld
UKN
3.4
14.2 10,000
5.5**
40.7
UKN
UKN
.09
. 24
3-5
Heavy Rail
Atlanta
1,499.4
49.1
14 48,000
40.2
442.2
107.1
2231
.11
3.5
9+
Washington
2,698.8
116.1
39 63,000
98.5
1,083.5
69.2
1098
.11
3.0
12+
+Range due to different cost estimates from different sources
Light Rail
San Diego
94.4
3.7
16 4,000
12.0
93. 6**
5.9
1475
.04
. 2
2.5
. *P(O~~rbld l~H~l,do\lr1rf usin1 copc::11'fer 1 c: nfiCP i1dex 1 ~urro· (3 i:; 6, A 1 12) r· .. L.::> t, lftu 1..t:!
Cleveland
109.2
8.0
13 12,000
4.7
44. 7**
8.4
700
.18
.6
2.2

provide an idea or estimate of how the efficiency of a monorail compares to
other transit modes.
28

SUMMARY AND CONCLUSIONS
Perhaps the most succinct summary that can be made concerninq monorails
is that they are not substantially different from other rail transit modes.
Monorail systems are not new nor is their usage in urban transit unique. The
existence of transit lines in Japan attest to this fact just as the 81 year
history of the Wuppertal line demonstrates the technology.
These foreign urban transit monorails have si~ilar capabilities to most
heavy rail systems. They have equivalent speeds and carrying capar.ities. Their
U.S. counterparts, which are not used in urban transit, have scaled down carry
ing capacities which are quite similar to light rail systems.
The only characteristic of monorails that ap~ears to be unique
is the cost savings afforded under certain conditions. The structural costs
of monorails are apparently lower than those of either subways or elevated,
heavy rail systems. However, those savings are lost when comparisons are
made with heavy or light rail systems built at grade. The operational costs
are close to those of light rail systems which is probably due to their lighter
vehicle construction. A more comprehensive study of these costs will be the
product of the second task of this project.
The streamlined appearance of monorail and their novelty may serve to
attract a higher ridership than some of the more traditional systemso But,
the elevated structure would undoubtedly bring complaints of visual obstruction
and property devaluation. However, considering the elevated heavy rail alter
native, monorails are smaller and less obtrusive.
These somewhat positive statements lead to the standard question; "if
29

monorails are so functional, why aren't they being used for urban transit in
this country? 11 There is no definitive answer to this question. Some
plausible explanations may include:
1. Monorails have always been built and demonstrated in parks and fairgrounds
and consequently have come to be associated with tourist type operations rather
than transit.
2. Monorails are not a proven technology in U.S. urban transit. Frequently, they
are dismissed without serious consideration simply because there are none
around. Obviously, they cannot be proven in this country until one is built:
the 11 Catch-22 11 of monorails.
3. There are a number of foreign and domestic companies that manufacture and
market heavy rail systems but few that produce monorails;therefore the market
ing odds are against them.
It is understandable that transit authorities responsible for deciding
where and how to invest enormous sums of money would be concerned with making
the wrong choice. A decision to allocate funds to a system other than those
traditionally selected could lead to a great deal of criticism. It would be
ideal if these decisions could be made solely on the basis of sound performance
and cost requirements. Unfortunately, the emotional and political climates
do not always afford that opportunity.
One point is clear; transit officials need reliable information from which
to work. A great deal of the information concerning monorails is outdated,and
current information is hard to obtain. The information that was obtained for
this report indicates that monorails are not the universal panacea for urban
transit problems that some of the enthusiasts seem to propound nor are they
the useless folly their critics claim. Somewhere on the middle ground lies
the objective appraisal.
30

SYNOPSIS
, Current monorail technology affords a safe, reliable means of provid
ing an intermediate to large capacity as a single line or as part of a system.
, Monorail systems can be installed quickly along existing right-of-way
with little disruption to traffic or commerce.
, Since these systems are elevated, their capital costs are higher than
some light and heavy rail alternatives built using existing or at-grade beds,
but are cheaper than elevated or sub-grade rail systems.
, While modern monorail technology provides a viable and competitive
alternative in urban mass transit, it is by no means the optimal solution for
every corridor.
, Each corridor must be considered in its own context, alternatives
weighPd, and decisions made based on future demands and resources rather
than emotions and politics.
31

REFERENCES
l. Botzow, Herman S.D. Jr., Monorails, Simmons-Boardman Publishing Corp., New York, 1960.
2. Monorail System for New Urban Traffic, Japan Monorail Association, 17-9 Uchi kanda 1-Chome, Chiyoda-Ku, Tokyo, 101 Japan.
3. Heavy Rail Transit, Lea Transit Compendium, Volume II, No. 6, Huntsville, Al., 1975.
4. Overbye, Dennis, Trains That Fly, Discovery, February, 1982.
5. WED Transportation Systems, Inc., Mark IV Monorail, Brochure from Walt Disney 1./orld Resort Com~lex, 1981.
6. Alweg Rapid Transit Systems of Washington State, Inc., Alweg Monorail, 1962.
7. New Concepts in Urban Transportation, Transportation Research Board, Volur:ie 12, No. l, January 1982.
8. Martin, Ted, Seattle Center, Personal Conversations, August 18, 1982.
9. UK's First Public Monorail Gets Off The Ground, Transport, September/ October, 1980.
10. The Airport Access Problem in Tokyo, Paper Sponsored by Committee on Passenger Transportation Economics and Special Committee on International Cooperative Activities, presented at the 49th Annual Meeting. Toru Akiyama, Japan Airport Terminal Co., Ltd.
11. Albrecht P. Engel, The ~Jorld in Transit, Gibbs and Hill, and Gremont Felix, Consultant, Gibb and Hi 11 .
12. Transit: The Way To Go In The SO's, Operatinq Statistics Report, 1979, American Public Transit Association.
13. tJork Paper No. 2, Chara.cteristics of Express Transit Modes, Transportation Service Modes and Service Areas Study, Interim Regional Transportation Authority, Dallas, Texas, May 1982.
32

Task II:
An Operational Comparison

TABLE OF CONTENTS
SECTION PAGE
I . I n trod u ct i on . . . . . . . . . . . . . . . . . . . . . . . . . . . . . . . . . . . . . . . . . . . . . . . . . . . 1
II. Analysis of Operational Data ................................... 8
Service Envelope Method ........................................ 9
Level of Service Rating for Transit Systems .................... 17
III. Results of Operational Comparisons ............................. 29
IV. Conclusions and Recommendations ................................ 33
REFERENCES •••••.•••.•••.•••••••••••.•••••••••••••••••••••••••••••••• 35
ii

FIGURE
1
2
3
4
LIST OF FIGURES
Service Specification Envelope for the Tokyo -Haneda Monorail Line .................................. . 14
Effects of Fare Changes on Service Specification Envelope .............................................. . 15
Effects of Change in Speed Parameters on Service Envelope .............................................. . 16
Service Specification Envelopes for Four Modes of Transit ............................................... . 30
iii

TABLE
l
2
3
4
5
6
7
8
9
10
11
12
LIST OF TABLES
Comparisons of Capital Costs ........................... .
Modal Service Characteristics .......................... .
Tokyo Monorail Service Envelope Data ................... .
All Operational Data ................................... .
All Operational Data
All Operational Data
New Rapid Rail (Average) Service Envelope Data
Old Rapid Rail (Average) Service Envelope Data
Light Rail (Average) Service Envelope Data ............. .
Bus (Average) Service Envelope Data .................... .
Modified L-0-S ......................................... .
LOS Ratings for Comparable Mass Transit Modes .......... .
iv
PAGE
2
5
12
18
19
20
21
22
23
24
27
31

I. INTRODUCTION
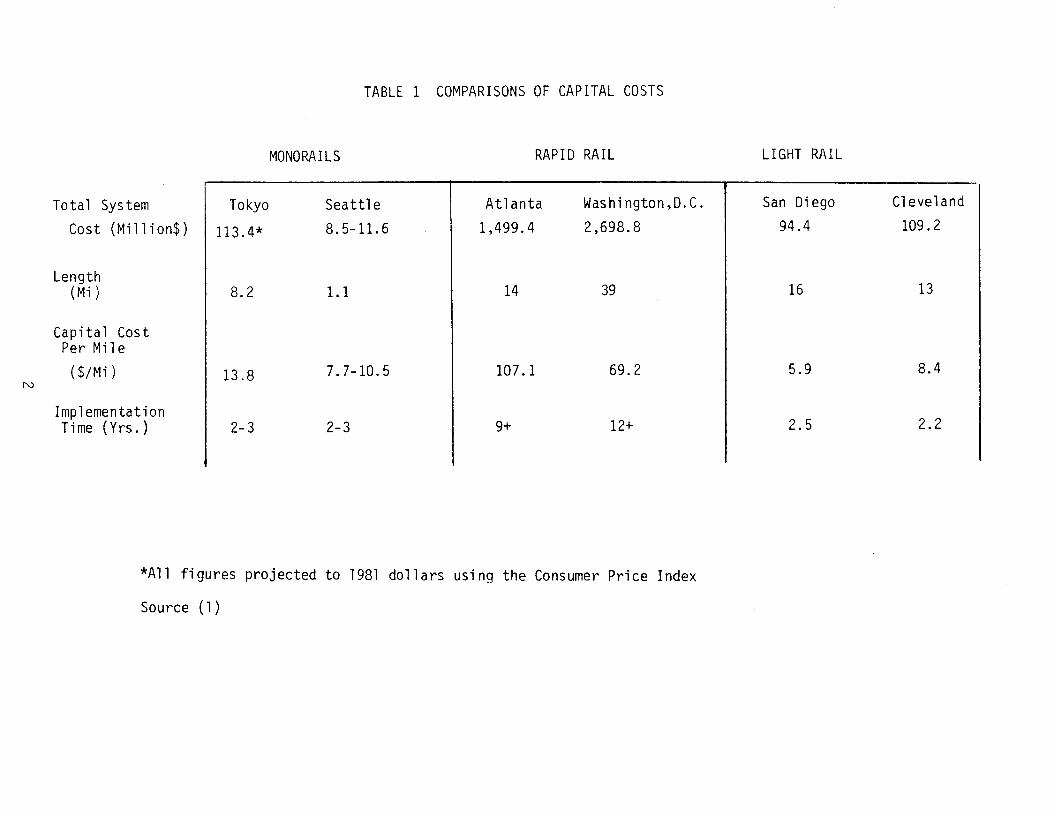
In the first task report on this study of monorail technology, it
was pointed out that the capital investment required to build a section
of any type of mass transit system varies by geographic location and by
type of system. Geographic location affects such factors as land prices,
the nature of construction (underground, at-grade, elovated), strength
of materials required, and labor costs. Type of transit system directly
involves the nature of construction, but also dictates the cost of rolling
stock, stations, track and supporting structures, etc. For this reason,
comparisons of capital cost experience of different transit modes can
only be used in a general sense in an alternatives analysis for a new
syste~. The development of capital cost estimates for monorails and
several other transit modes was generated in the first task report and
is summarized in Table l .(1) Estimates of the implementation costs of
various alternatives can only be reliably determined if detailed bids for
the specific site of interest are generated by venders of various transit
modes. Even if this information is available, additional information is
required concerning the operational capabilities and costs of transit
alternatives. Only then can capabilities be compared with needs and costs
with budgets in order to select the most practical alternative. In the
absence of detailed implementation cost bids, much can be done with
operational data on transit modes, if so~e rational basis of comparison
can be found.
This report provides such operational data for monorails.
1
N
TABLE 1 COMPARISONS OF CAPITAL COSTS
MONORAILS RAPID RAIL
Total System Tokyo Seattle Atlanta Washington,D.C.
Cost (Million$) 113.4* 8. 5-11. 6 1,499.4 2,698.8
Length ( Mi ) 8.2 1.1 I 14 39
Capita 1 Cost Per Mile
( $/Mi ) I 13.8 7.7-10.5 I 107 .1 69.2
Implementation I I Time (Yrs.) 2-3 2-3 9+ 12+
*All figures projected to 1981 dollars using the Consumer Price Index
Source (1)
LIGHT RAIL
San Diego Cleveland
94.4 109. 2
I 16 13
I 5.9 8.4
I 2.5 2.2

Comparisons of the operational characteristics and costs of monorails
to those of other transit modes have taken several forms. Far and away
the most common of these forms has been qualitative in nature, relying
primarily on subjective appraisals on the disadvantages of monorails and,
by implication, the advantages of other systems. A example of this type
of comparison can be found in a recent "state of the art 11 analysis which
concluded: "Aside from a relatively smooth and quite ride, albeit at
low speeds, monorails have comparatively few advantages over other proven
primary transit modes. The primary disadvantages of monorails include
a history of oscillation or sway of suspended monorails in high winds
and at high speeds, which may cause riding quality, station clearance,
and vehicle switching problems. The stability of suspended vehicles can
be improved by dual rail construction, but such construction further
complicates the switching mechanicsms. Switches or turnouts for both the
suspended and bottom-supported monorails are elaborate, cumbersome, and
slow acting because of the large guideway assemblies that must be moved
to change routes. In addition, monorails are not readily adaptable to
at-grade or underground aligments as are other primary transit modes because
of their comparatively large vertical dimensions. And finally, monorails
cannot provide the high-speed operation required for line-haul sections
of primary transit routes. Most monorails that are now in operation or
what have been demonstrated can attain speeds of only 20 to 30 mph. '
Therefore, their best application is as elevated alignments, which may
produce aesthetic problems in urbanized areas- especially top-supported
systems, which require an elaborate sunerstructure. 11 (2)
3

Unfortunately, these subjective comparisons tend to perseverate
through the transit community making more objective information difficult
to obtain and certainly less credible even when definitive data is available.
Those few objective operational comparisons that have been attempted
have usually focused on passenger carrying capacity, speed, and operating
cost per vehicle mile. These characteristics, derived for various systems
in current operation, are used to make relative comparisons among the modes
of interest. This technique has two distinct limitations. First, site
and population differences for the various systems can cause wide differences
in cost, ridership and other variables. However, since it is unlikely
that two transit systems will ever operate under identical conditions, it
must be assumed that these differences can be adjusted for by presenting a
range of system operating characteristics or by using averages.
The second li~iation applies strictly to monorail systems and it
deals with the lack of usable data. Aside from the short line in Seattle,
there are no monorails in this country functioning in the transit mode.
Consequently, estimates and extrapolations have to be made. A good
example of an approach to overcoming this limitation was demonstrated in
a report prepared for the Interim Regional Transportation Authority of
Dallas, Texas. ( 3) The authors of this report requested that the
engineering companY associated with building monorails for major amusement
parks estimates the characteristics and cost associated with a hypothetical
line designed to meet given requirements. A synopsis of the data developed
for monorails and other systems considered in this report is presented in
Table 2.
4

TABLE 2 MODAL SERVICE CHARACTERISTICS
RAPID RAIL MONORAIL LIGHT RAIL BUSWAY I -
Max Vehicle Speed I (MPH) 55-75 45-55 40-60 55-65
Accel/Decel(Ft./rec2)1 4.0-4.4/4.0-4.4 3.0/5.0 3.3-5.0/3.3-5.0 0. 7-3. 7/2. 9-4.4
Praticle Headway I (Min) 2.0 2.0 1-2 7.4 (sec)
Maximum Peak-Hour (J1
Lane Capacity I 42,000 10-20,000 19,000 27,000 (Pass./hr., peak direction)
Dwell Times (Sec.) I 10-60 10-90 10-30 10-160
Operating Costs I per vehicle mile $2.50-$5.00 $1. 00-$2. 70 $2.50-$5.00 $2.50-$4.00
Source (3)

Using data from this table and other sources, the authors tentatively
concluded: 11 Monorails provide similar service characteristics to grade
separated heavy rail and light rail transit systems. Most such systems
operate at lower speeds than grade-separated rails however. The
monorail operating at Disney ~Jorld in Orlando, Florida, can attain a top
speed of 45 mph, thereby offering an average speed capability in the same
range as heavy and light rail . 11 (3)
A second method of overcoming the lack of available U.S. data for
monorail systems operating in the transit mode is to use information from
foreign countries. The Schwebebahn of Wuppertal, Germany, built in 1901,
is too old a system to provide a useful comparison even though it is
still used daily for transit purposes. The Japanese Haneda Airport Line
in Tokyo, can serve for comparison purposes since it is representative of
modern monorail technology being employed in a transit mode.
Data obtained from the Japanese Monorail Association reflecting
the operational characteristics of the Tokyo monorail will thus be used
in this report to compare with average performance figures developed for
rapid rail, light rail and busway transit modes. The method of comparison,
rather than just presenting individual data points, will involve the
creation of transit service envelopes.
Transit service envelopes provide a graphical representation of the
hourly passenger volume required to support a given system at a specified
fare and headway configuration. They present a visual display of the
service areas of each transit mode as well as the overlap in operational
capabilities.
6

The construction of these envelopes and the transit systems for
which they are developed are discussed in the following section. The
resulting graphs are presented in Section III as are the results of an
attempt to compare these systems on the basis of level of service. The
conclusions and recommendations are presented in Section IV.
7
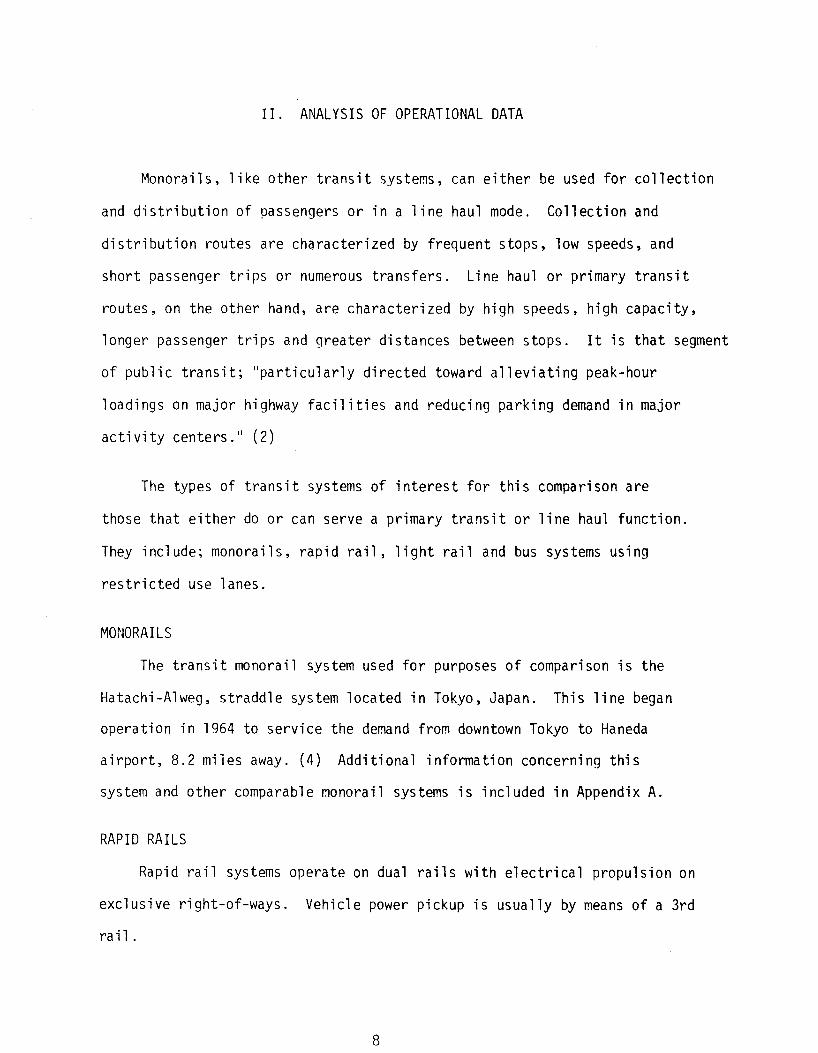
II. ANALYSIS OF OPERATIONAL DATA
Monorails, like other transit systems, can either be used for collection
and distribution of passengers or in a line haul mode. Collection and
distribution routes are characterized by frequent stops, low speeds, and
short passenger trips or numerous transfers. Line haul or primary transit
routes, on the other hand, are characterized by high speeds, high capacity,
longer passenger trips and greater distances between stops. It is that segment
of public transit; "particularly directed toward alleviating peak-hour
loadings on major highway facilities and reducing parking demand in major
activity centers. 11 ( 2)
The types of transit systems of interest for this comparison are
those that either do or can serve a primary transit or line haul function.
They include; monorails, rapid rail, light rail and bus systems using
restricted use lanes.
MONORAILS
The transit monorail system used for purposes of comparison is the
Hatachi-Alweg, straddle system located in Tokyo, Japan. This line began
operation in 1964 to service the demand from downtown Tokyo to Haneda
airport, 8.2 miles away. (4) Additional infonnation concerning this
system and other comparable ~onorail systems is included in Appendix A.
RAPID RAILS
Rapid rail systems operate on dual rails with electrical propulsion on
exclusive right-of-ways. Vehicle power pickup is usually by means of a 3rd
ra i 1 .
8

Examples of more recent rapid rail systems are those of Washington-Metro
and San Francisco-BART. Some of the older systems include; Philadelphia
SEPTRA, Chicago-CTA, Cleveland-SHAKER, and Boston-MBTA.
LIGHT RAILS
Light rail systems are defined as those that use: 11 predominately
reserved, but not necessarily grade-separated, rights-of-way." (2) They
are electrically propelled with power beings supplied through poles or
pantographs from overhead wires. Examples of light rail systems include
the Cleveland-SHAKER, Philadelphia-NORRISTOWN, and the Edmonton-NORTHEAST
lines.
BUSHAYS
Busways are those operations in mixed traffic on freeways for the
line haul portion of their trips. They may be provided with preferential
access and lanes. Although there are many examples of this type of
operation, an average or composite of these systems will be used for
comp a ri son.
SERVICE ENVELOPE METHOD
The method used to compare the operational characteristics and costs
of these systems is a modification of a transit service model developed
by Rea and Miller (5). This model produces a service-specification which:
11 defines the boundaries within which an operator is able to specify transit
service for a given technology in predefined circumstances. An envelope
is defined on one side by an economic or 11 viability 11 boundary and on the
other by a 11 capacity 11 boundary. The basis for comparison is the location
9

of the service-specification envelope in an output space defined by axes
representing passenger flow and level of service." Level of service in
the present use of this concept of presentation is represented by trip
time, whereas Rea and Miller used or metric of velocity, net speed. Trip
time, of course, reflects only one quality of the service provided,
consequently an attempt was made to assess quality in a more general way.
The method used for this assessment is discussed at the end of this section.
The service-specification envelopes are based on functions of
capacity Flow Limits, Viability Flow Limits, and Trip Time. The necessary
equations and the variables included in these functions are presented below:
[11 Capacity Flow Limit= (l+SPC)VSC x NVT x (60/HOWY)
[21 Viability Flow Limit= CPM(60/HDWY) /AFPM
where
[31
where:
SPC = ratio of standees to vehicular seating capacity
VSC = vehicle seating capacity
NVT - number of vehicles in train
HDWY = headway, minutes
CPM - operational cost per vehicle mile, dollars
AFPM = average fare per mile, dollars
Net Speed=
ADBS + MV ~ ACC
ATD
NLAT + (NLAT-1) DHELL + HDWY -2-
ADT = average trip distance, feet
ADBS = average distance between stops, feet
MV = maximum velocity, feet/sec
10

ACC = average operational acceleration and deceleration, feet/sec/sec
NLAT = number of stops
DWELL= average dwell time at stops, minutes
HDWY = headway, minutes
[4] Trip Time, a deviation of Net Speed = 88 ATD NET SPEED
The workings of these equations and the envelopes they produce are
best demonstrated by example. The operational data from the Tokyo-Haneda
monorail line will be used for this purpose. Using an average trip length
of 7 miles with stations spaced at one mile intervals, maximum passenger
capacities and average trip times were computed for headways ranging from
a train every two minutes to one every 30 minutes, in one minute increments.
The minimum passenger loads required for the line to pay for its operational
cost was computed using a fare estimate of five cents per mile per passenger.
These data were entered into a microcomputer to produce the data given
in Table 3. A list of the program statements used to generate the data is
presented in Appendix B.
The information presented in Table 3 indicates that when headways
are as low as two minutes, a six car monorail train requires a minimum of
7818 passengers per hour to break even. That figures is based on each
passenger paying five cents a mile for seven miles or 35 cents per trip.
The passenger capacity available with two minute headways is 22,896
passengers per hour. This leaves an excess revenue potential based on
15,078 passengers per hour.
At two trains per hour or 30 minutes headways, 521 passengers per hour
are required to support the system. This level of operation allows a
11

w
c.. 0 _
J
w
> z:
w
LJ...! u I-<
>
0::
w
V)
C
>::..:: C
I-
M
Q)
.-.a
rtl I-
~m
rn0
1m
mrn
mm
mm
rnrn
mm
01
01
m0
10
10
1m
mm
01
01
01
01
01
01
......
(··, C·l
C-·l (·,J
Cl ( 1 •'.··, ,:.,
,:·-, i"·l
,-. , ,:·-l
,:·-l ,:·.J
(··J (··J
,-.. , (··l ,:·-l ,-,,
Cl ,-.. l
C··J C·J
C··J C
J C
J (·l (··J
rr...::t...::t...::t...::t...::t~~...::t...::t...::t4...::t...::t...::t...::t...::t...::t...::t...::t...::t~...::t...::t...::t...::t...::t...::t...::t-.:::t ~
Qm
~~
~~
8~
8~
Q~
SD
S~
Q~
sm
SD
Sm
Q~
IS
lm
S
• •
• •
• a
I I
• •
• •
I I
I I
I I
I •
• •
• •
• I
I I
•
0-.::f...::t~
ml..D
I..D~
t'--OO
OO
ITT
[ll~~
~~
00
~~
~~
~~
~~
~~
~
:.-:,. d
,·--1 . ·i
.--< .• <
,· ;
, ·< , i
, · i , <
-<
r--1 1."·J
l.'·J l.'·J
l.'·J 1."·J
I. 'J 1,'·J J."•J
I. 'J l,'·J
l.'·J l,'•j
l,'·J l,'•j
l,'·j I.'<
l,'•J ([
11
11
1••D
lllllllll••s1
•1
•1
1•1
11
11
••
~n
NQ
mo
o~
1..D
~...::tn
N~
~0
10
1o
or---~
ww
mm
...::t...::tnn
NN
-r-1
l.Ll ·.:::i'
,.:j' . .::j
t·) v, v, r) t··)
t··) t·') t·)
t··) t·)
(·.j C'·J C'·J
(J Cl C-·J
(··J (··l
C'·J ,:,J N
(··J
c,J (··J Cl C··J
·-, ,:'_
... 1 LD
LD -::t rn rn
lf) !.D
r-1 t'--
lfJ LD ,--/
lD
;Jl <:t [11
1.D <:t Cr)
• •
• 11
• •
• •
• •
•
Ct'. 01 u:.i -.::f rn ,·.,
.-< . .j r,J en c-i I..D
c·l ISi
,:·-, C-J n
·-:t ~ 01 19
..... s co -r-1
-r-1 lD tfJ 01
LD 1 ,. 1 01
,··J -.;t 1n r-:,
-.::1 ,-·J w
r---:.D
• • (··J r---u
l LD a, -.:::t T
... co OJ
OJ 01 s
t-·:i LD en
t-·'.i I'--c-1
n. C-J LO
.. , .-. I.D t.n
t'-· !SJ
!() , ·• O
J I{) (··J
ISi 0
) UJ
LJ1 -~
CJ
, ..... IS
i 01
01 CO t'--
LD I.D I{)
I{) I)_
,:·)
' •. -~ en
t··~ I..D LJl
~-) -:I"
<:j v,
t··) t·) t··)
(··l C'·J (··J
C·J (··J (l (·l .......
r<
T;
.............. c-1
rl
.....
:J
I. l-·-i
}-~
--r-1
M
~
!'-1..D
l{)f'-00 N
!'-1..D
l{)-r-1[11N
... J C
J t'--
ifl 1·) :.D ::t
t'-· OJ
:i LO I.D LD -.:::t ~
Cl C··l
-.:::t O
J .,...,
C··l t'-·
• •
• •
• •
• •
• c··J r---w en OJ :n r---
OJ 1n ,-J' v, ....... -.:::t ...... c--i
Ct~ OJ C·i
Lil f'-LO
t··~1 <:t
t"'--i· ·:i
, ---1 t<1 (··~
:.il C-J •
• •
• •
• •
• •
• •
• •
• •
L.tJ • ~
, ... 1:9 ('·l ISi t-''.I
if) t-' :, 1.D
(•,J 19 ISi
....... ...::t ~
IJ1 (!) (··l
...... ·-::t !SI
lJ1 ....... Lil
'F' 01
OJ r.n ......
30
0N
ITT
-~N
IJ1
~1
{)...::t~
N-~
~-1
.DN
OO
...::t-~l{
)NS
~~
~N
CJ
I'-,Jl t·) t··)
C-J C
l ....
,··• ,-1
,·-<
,--, r<
~
• ,..... [11 al CO CO
~ ~ ~ I.D l.D
LD !JJ Ill l.Jl l.Jl ll1 __ J
>· (I
::-~ Q
a
s-N
n~
~1
..D~
oo
mo
-N
0...::tm
1.D
~o
om
s
Lil S:-4 t·:,
-::t !I) LD r---
c,J !J1 .....
,-<
'·<
.·<
'-! ,.,
,-, '
·I •••
d C-·l C
l (··, ,-.. ,
(··J (··l
C-·J C-·J
(--J C'·J
t--:1
I
12
Ii !SI
r---1--
LD 1'· Z
II
H
ii Ii
I->
U
O ([ 3
(j) I-_J C
l :>
i'.IZ
I
(··l lll 0) ISi
t-·~·
..... IS C
l ii
• •
• >-.,...,
t··) 3
II C
l II
E
II I
U!l.U
X
11
..lJ_
U(I
U) (J: a:
F-

maximum capacity of 1526 passengers per hour. Average trip time for
the 30 minute headway case is 28 minutes. This includes average waiting
period of 15 minutes and a 13 minute travel time. As the headways between
trains decrease, the waiting times decrease correspondingly. The waiting
time is always estimated by one half of the headway value.
A semilog graphical presentation of the service specification envelopes
resulting from a plot of these values is presented in Figure 1. In these
graphs, trip time is plotted on a linear scale of time in minutes, and
passengers per hour on a logarithmic scale. The viability limit or break
even hourly passenger requirement defines the left boundary for the
headway range considered. The right boundary is the maximum hourly
passenger capacity. The graph in Figure 2 shows how the boundary would be
affected by increases or decreases in focus.
would be required if the fare was increased.
of moving the viability limit to the left.
Fewer passengers, for example
This would have the effect
The effect of a change in the acceleration, deceleration or maximum
velocity capabilities of the transit technology considered would have the
effect of shifting the bottom line and top line location (See Figure 3).
Assuming that trip length and station spacing remain fixed, a decrease
in maximum velocity would lower the top and bottom lines representing
an increase in travel time for all headways. In other words, the whole
envelope would shift up for an increase in speed parameters and down for
a decrease.
Using this approach, operational data was compiled for various examples
of new rapid rail, old rapid rail, and light rail transit systems. In
order to obtain representative data for generic forms of these modes, values
13

f-' .i:,,.
Trip Time
in Min .
10
15
20
25
30
35
40---...i.-~---~ ...... ~...i--~~---L.---L.~--J...J...i-1-~--.J..~~L..-1--I-I-.J...J..
10 2 103 104
Passengers Per Hour (Log Scale)
Service Specification Envelope Tokyo - Haneda Monorail Line.
Figure 1. for The

10 r
Trip 15
Time in 20
Min. ...... 25 lT1
30
35
40 2 10
FARE INCREASE DECREASE
I I
103 104
Passengers Per Hour (Log Scale)
Figure 2. Effects of Fare Changes on Service Specification Envelope.
2 Headway Time
10 in Min.
-I 30

10
15 Trip Time 20
in Min. 25 ......
O')
30
35
40 10 2
• ---• INCREASE }
DECREASE
103 104
Passengers Per Hour (Log Scale)
CHANGE IN ACCELERATION OR MAXIMUM VELOCITY
Figure 3. Effects of Change in Speed Parameters on Service Envelope.
2 Headway
10 Time in
Min.
30

for the specific examples were averaged. These data are presented in
Tables 4, 5, and 6. Table 6 includes data for the operational characteristic
of an average busway. These data were obtained from a source that had
already derived average operational data. (2)
Once again using an average trip length of seven miles with stations
at one mile intervals, service-specification envelopes were generated
for mode averages, producing upper and lower passenger capacity limits
and trip times over the headway range of two to 30 minutes. These
data are presented in Tables 7 through 10. Data for the individual
lines, as well as some samples of light rail and busway data with three
mile trip lengths and quarter mile station spacing are included as Appendix
C.
LEVEL OF SERVICE RATING FOR TRANSIT SYSTEMS
A possible alternative to the single-factor trip time criterion for
transit system comparisons is a Level-of-Service (LOS) rating. This
concept, taken from a similar (and familiar) system of ratings for highway
facilities, as set forth in the Highway Capacity Manual (6), has been
studied by a number of researchers, perhaps most recently by Bullard and
Christiansen (7). LOS is therein defined as the "system's ability to provide
reasonable travel times and a comfortable ride." The LOS concept is
attractive because it is a multi-factor composite rating, essentially a
(weighted linear equation, which can take in various aspects of the transit
service as perceived by the would be user. In the original formulation,
these factors (all rated on an alpha scale from A to F) were:
17

TABLE 4
Manora i 1 New Rapid Rail
Variable I Tokyo-Haneda ~Jashi ngton BART Average --
Standees to Seating Capacity 1. 12 2.41 2.08 2.245
Seating Capacity 60 68 72 70
No. Vehicles in Train 6 6 6 6
Cost/Mile 13 .03 27.3 23.94 25.62
Average Fare/Mile .05 .05 .05 .05
Average Trip Distance 7 7 7 7
Average Distance Between Stops 1 1 1 1 I-' o:> Maximum Velocity I 72.9 I 110 117. 33 113.665
Average Operational Acceleration/ Deceleration 3.28 4.4 4.4 4.4
No. of Transfers in Average Trip 7 7 7 7
Dwell 20 20 20 20
Minimum Headway 2 2 2 2
Maximum Headway 30 30 30 30
Interval 1 1 1 1

TABLE 5
01 d Ra~ i d Ra il
Variable Philadelphia Chicago Cleveland Boston Average SEPTRA CTA GCTA MBTA ----- -----
Standees to Seating Capacity 2.73 2.06 .75 2.73 2.0675
Seating Capacity I 67 49 80 64 65
No. Vehicles in Train 6 6 6 6 6
Cost/Mile 18.48 15. 66 12. 72 53. 1 24.99
Average Fare/Mile .05 .05 .05 .05 .05
Average Trip Distance I 7 7 7 7 7
Average Distance Between Stops I 1 1 1 1 1 ......
Maximum Velocity I 73.33 <..O 80.66 88 65.55 76.885
Average Operational Acceleration/ Deceleration 4.4 2.2 2.88 3.85 3.3325
No. of Transfers in Average Trip 7 7 7 7 7
Dwel 1 20 20 20 20 20
Minimum Headway 2 2 2 2 2
Maximum Headway 30 30 30 30 30
Interval 1 1 l l 1

TABLE 6
Light Rail Bus
Variable 1c1eveland Philadelphia Edmonton Average Average Shaker Norristown North East
Standees to Seating Capacity 1. 41 1 . 64 1 . 53 1 . 527 1. 92
Seating Capacity 49 84 64 65.67 26
No. Vehicles in Train 1 1 1 1 1
Cost/Mi 1 e 2.9 4.04 7. 1 4.68 2.98
Average Fare/Mile .05 .05 .05 .05 .05
Average Trip Distance 7 7 7 7 7
Average Distance Between Stops 1 1 1 1 N 0 Maximum Velocity I 50 55 50 51 . 667 I 55
Average Operational Acceleration, 3 .1 3 .15 Deceleration 2.45 2.9 2.5
No. of Transfers in Average Trip 7 7 7 7 7
Dwel 1 20 20 20 20 20
Minimum Headway 2 2 2 2 2
Maximum Headway 30 30 30 30 30
Interval 1 1 1 l 1

Table 7 NEW RAPID RAIL (AVERAC,E) SERVICE ENVELOPE OATA
HEADWAY LOt,.JER LIMIT UPPER LIMIT NET SPEED AVG TRIP TIME 2 :..5372 40887 53.8778 11.4333 c 10248 27258 51. b212l4 11. 9333 ·-· 4 758E 20443.5 49.5445 i2.4333 5 5148.8 15354.8 47.5291 12.9333 5 5124 13629 45.8563 13.4333 7 4392 11682 44.2107 13.9333 8 3843 10221.8 42.5791 14.4333 9 3415 9086 41. 2502 14.9333 1 (Z) 3074.4 8177.4 :::::9. 9137 15.4333 11 2794.91 7434 38.6512 15.9333 12 2562 6814.5 37.4849 16.4333 13 2354.92 6290.31 35.3781 15.9333 14 2195 5841 35.3347 17. 433:3 15 2049.5 5451. 5 34.3495 17. •3333 16 1921. 5 51112). 88 33.4178 18.4333
N 17 1808.47 4810.24 32.5353 18.9333 I-'
18 1708 4543 31. 5982 19.4333 19 1618.11 4303.9 30.9031 19.9333 20 1537.2 4088. 7 30. 1459 20.4333 21 1464 3894 29.4268 20.9333 22 1397.45 3717 28.7404 21.4333 23 1336.7 3555.39 28. "1852 21.9333 24 1281 3407.25 27.4592 22.4333 .-.c:-,:_..; 1229.76 3270.95 26.8605 22.9333 26 1182.46 3145. 15 25.2874 23.4333 27 1138.57 3028.67 25.7382 23.9333 .-,n ..::..o 1098 2920.5 25.2115 24.4333 29 1050. 14 2819.79 24.712159 24.9333 30 1024.8 2725.8 24.2202 25.4333

<
l
et: C
.
w
c... 0 _
J
w
> z:
w
w
u ..... >
0::: w
V
)
_J
..... ~
0 ...... c... ct: 0:::
0 _J
0 co
QJ
r--.0
11:l I-
......
11 ........................
.
, ') 1·· :i <:.t :t :n u1
LiJ 'ii i'·· 1·-.. UJ OJ en rn ISi
5.J d
-,
,-·J ,-.. , t·)
i") <
j ..;j u
l LO 1.D !JJ r--r--
.• ,
, .. ; •. ,
· <
. < ,-<
;
, _, . <
,·<
<
, .• , d
,:· J Cl
,:···J C· l ,:··l
C-l C
l C'·l C
l (··l (•l () (··l C'·J C'·J
C'·l ·.T.
!.~. , ;J :.,1
,· .. ; :n i'·-'.0
··-1 ,. .. l
::r :·i -:r ,,.J r··., r')
1.0 1· ·:,
~--.. .1
···l ,:., '.D :.o r--
'.D rn
i.11 , .. , T
.... ·.::t '.d
· < O
J -:r LJ.J
1.D 'iJ
!)J 'Jl l(
l en -:t r·--
(; U
l t ·.,
, ( ·l r-) ,:·-j t'-
~-
ISi
lf'J ISi
'.fl ((I O
J ..;j !Jl
;J l(i
i.D en d
C·l ' . r-~
,,;i CTl r :i
t· '.1 ~--
uJ (1
) 1.11 U
l ul
.;j f')
-:::t (0
IJl t··~1 .:j
U) Q
U
) -.;j' t··)
:.:-1 ;)~
; · -.i fl]
;J~; .~· ~
S
~)J O
J I" .. -
~G ~n S~
C ~
.::t i'-
S
i .. ) t" .. -r-t :.rJ
Ol ·.:1 ;:n
~· J1 If) S
:.L (··J
11
•1
1a1
1••••••••1
1•••••••••••••
!-J···; . , : l, ::n u1 r , i i .1
u 1 , , t ., , ,
ci ci u~1 , .. co t··-1n
T .. rn u
l tn :.D 1.11
II "
" •
.. ..
.J ~-
.1 en .:..~ :J.~ :.n
, .. r<1 C·.t r<1
r---. :)J en s
r---~ cfJ O
J -,
st I' .. t.11 !fJ
,~ w
en :iJ
::J 1.n r--:. . J
" ..
• •
• "
• If
,1 •
• •
• •
• •
" •
• •
• •
•
,:r: u:i ,: , <i Lri LD ·n ,: i
L1~1 i'-·-in ... -, r-~ 1n ~o c 1 1··
~-rn co ,:,, s
ISi
Ti s
co t') tf'J ci
, 1J •:.1 r:;, :.n 1-,:i en ,:··i r---~-.
i'·-,-., •:o C·J
CJ co w
c-i rn r-·~ co ,., LD (··, rn r---UJ I.CJ UJ
~ r.n
n. L,· 1 1" :,
~--<r
• ..; ;:;;i en CT1 , .; Ln a1 in T.., r-
..;j' C-·J 01 r~ in <::t ,:-.i -
(Tl co
~
LD u
l -"'1' v, c1. : ) ,:·· .1
.-, ,.;
-. , -, o .1 :-.. ..
~-
:_o :n :n ~1
-.;;t ·.:::t
,:t r--:i t') t') n t··)
t,:i C·J c·-~ C-·J i:··J i:·-1 c··J
CJ
: :)
1-,' ~: H
i1)
I"•-1.Jl
0:-·J LTI
t·) (··J
(I) f"•. f"-
. J :D
~ J
::,J , ·i
!'·-C··J
(··J , ·)
.... i' !Sl
(I) lJ1 Jl [·-:<
:.0 S
l -.]'
II II
II II
• •
JI •
II •
• •
;_Cl ,:,::
1J1 r.D r--
r, •• co ,J
,:,J ,_-. J co '.U
en 1..0
CJ en <:.t ·.:.:t
:.D DJ en co
t··) 1·-·) a, en
t··) SI
T-4
..;j •
l t1 en a, en ::n r.:n riJ -:t
i°-:i 'Jl
:· J en :si -c::t en r--
i.i1 1.D r--cr1 C·J LD
is .;:,t 01
iJl -r--
t··) en ~
~JJl~
JJl(J
lN~
na,~
.;;tM-m
OO
~~
m.;:,t~
MM
N-~
-sS
lrn
CJ
. -I en r '•. ~~l
:j" .. j
t ) I·)
(··~ 1~--~
C··.i (··J (' ·J
.·-i .. -1
..... .-.. .-~
·,--1
'-I -:-I
,.; ,---{
,--1 r-i
.,.-. ·r-4
.-t 01 J
>r.I "}: ;::-_, cr
~,.....N
n~
mw
~o
oo
is~
Nn
.;jmU
Jr--o
ocn
s
1.u (··J t')
-::t 1n u
J I'· OJ en
.. ...; .-,
.. , ,.....
,.... "' ....,
,-, ...... ...... ,:-., N
C··J c·J c·-J ('·J C-·l ,:·-, c··J ,:,,
t') r.
22

Table 9 Lir,HT RAIL (AVERAGE) SERVICE ENVELOPE nATA
HEADWAY LOWER :...:MIT UPPER L.IMIT t'.icT ~3PEED AVG TRIP ·;-1Mt:: 2 2808 4978.44 :.9.7908 1 :,. ~5396 < 1872 3318.95 19. ~)758 13. 83St:i ·-· 4 1404 2489.22 18.4105 14.3395 5 1123.2 1991. 38 17.7903 14.8396 E, 935 1559.48 17.2104 15.3395 7 802.285 1422.41 :i. 5. 5571 15. 83'36 8 702 1244.E,1 15. 1571 16. 3.:,95 9 524 1105.32 15.b774 15.8395 10 551. 5 995.589 1 c:- .-,.-,c--,-
~ -'• ~.,!_~ ... ) 17.3395 11 510.545 905. 1 71 14.7985 17.8395 1 r, .::.. 458 829.741 14.3951 18.3396 13 4..,..-, ...:,L 755.914 14.0131 18.8395 14 401. 143 711. 2ill5 13.6508 19.3396 15 374.4 653.792 13.3058 19.8395 15 351 622.305 12.9795 20.3395
N 17 330.353 585.599 12. 5582 20.8396 w 18 312 553. i 6 12.3714 21.3395
19 295.579 524.047 12.0882 21. 8395 20 280.8 497.844 11.8175 22.3396 21 267.429 474. 137 11. 5589 ::~2. 8396 22 255.273 452.585 11.3113 23.3396 23 244. 174 432.908 11. 074 23.8396 24 234 414.87 10.8465 24.3395 .... ,C" .::.....J 224.54 398.275 10.5282 24.8396 25 215 382.957 10.4185 25.3396 27 208 358.774 10.2169 25.8396 28 200.571 355.503 10.L:1229 26.3396 29 193.555 343.341 9. 8362~; 25.8396 30 187.2 331. 896 9.65534 27.3396

L1..J c.... 0 _
J
L1..J >
z: L1..J
L1..J u ...... >
0::: L1..J V
)
0 rl
QJ
r-
.0
~
I-
1,1 t.
i· -I
~~~~~~~~~~~~~~~~~~~~~~~~~~~~~~
-< 1i)
Ii) 'D
!_i:) I.Li
!.Li 1.D
'.Cl 'il
1.iJ 1.D
I.D
I_() I.LJ 1.0
lJ.) !.D Ii)
ti) Ii)
'.iJ Ii) I.fl
1.0 !J)
1.D
!.D
'..l) I!)
·:r ,_(1 u.1
't:i , (l
•D
, u ,_o I.LI
11J I i1
1.D u::i 1..(1
,i:1 tD
,_o ,n ,iJ
1.11 1£1 1.il w
1i1 l.D 1..D
, o u:i 1.D 1.il
: ·· :)J
t·) :·,1
t ·:, C1J
t '.• CII
: ·1 :!J i '.• ::,J r··)
CO t·)
!J] 1--·1 CO t-·:, ~!]
t-·'.1 ~.))
t----, !)) V
1 ::JJ t-")
OJ t··)
!)] ••-•••••"•"•••••it••••••••••a
u
~n
~~
D~
~~
~~
oo
oo
mm
ssri ..... N
Nn
n...-:t...-:t~
~!..D
!..D~
~
:_-,. .---1
r<
-,·< ,-:
,..., r,
.-·< . ,
-.--< ,.;
,--< ,-<
,-1 C--1 ,:--J C
l C--~ C·-1
,:·-l (··J (··l (··l ("-J C·l (··l
C-·l C·l ::·-l C-·l "."I
C.J W
~C
ilOO
~
n~
D....;IT
TC
iJ~W
...-:tOO
~N
nN
-~D
W.:::tN
!..D
f'-00 1.t.1 CO
LO r--
CU SI ,--j
-, < 'D
r·) t··l ,-<
UJ
,:-,j r--< !J1 V
r t·) IJ1
OJ , . ..., ·.:::t l.D
t'-· !..D
C-·J V• f'-'D
~
n~
Do
on
n~
~~
~m
no
ow
~~
:-,...G...-:tC
il!..Dn
-iSls
-l.Dl.D
M
:J) SI t.-~, i'--
, • :.D -, :..C
->l i"---
r·) ~n :..C
,:· l a, :.D ;-·) S
0) U1 C-·l SI ::o l.D
.:;;t C··l SI
(··l ...-:t r-."
• •
• •••
• ••••
• •...
• •. •.
• .C
1JL1J.:j-i-
--m
c,J r----~-
1.D LD in iJ 1 --J·
-.:::r v, t '.• r-) ,:--i ,:·-i c-i ,: -i ..... -
,..., ...... .s;i
iSl iSl
iSl iSl
• •
• '..tl
·r-i ,.
-i ,
4 ,
; r..;
1 .• ; .,
-I ·,·-1
... -1 , ·-I
,-4
~· ,t
:·-1 -r-i
r·-4 .,. ....
r·-1 ., • .;:
""""" ·,--1
-r-! ,··1
.... ·r--1
T-f
r-f Oi
(fl Ln z i---S
·;
)·_ r-'.•
1-.--, rn
,-• r··) I'-
r--.. <t tn
c··l w
.,....,
:..D LD .. J :.D
,j UJ
·.J" :.:t
i"-) CJ iSl
I'-!)J
lll U1 .::t l.D
,·-< ll1 IJ1 tSl
-0) r-
·-:i •
• • :s1 , ··l r---
.j" • , !.J.J
, , :.D ...:t
t·) i.11 r---;:n s
1-... r--en
~;J SI ::o c1
c·-1 r---LD
SJ OJ
Cr.' r, .. _ C(i
f)) •
• •
II •
.. •
• •
• •
• •
• •
• •
• •
• •
• •
• •
•
LLJ r----, , i ·'.,
.-. en 1'.'"::l en w
,n -..:t !Jl
f.~ !Jl t---:i ...-:t :-,... t·:, en
~ LD r---
co en c--i u1 co i:·-1 ,-.... ~-• n.
1-J IJl
,..., , • !.Jl
l() U
J S
I IJl
-~
IJ1 Cl S
I OJ
lD IJl r··)
N
,..., 51
01 O
J 00
f"-lD
U
) lJ1 l.11
c, C
j .. ,
.-; 1J1 r--
lD tn
1n -:r .:::t
t ·) t.-:i t--) t<• c·-i i:·-i
c--1 c--1
c·-1 i:·-1 c--1 ,..., .,...., , . ...,
,-• -rl
.,...., -rl
.,....,
:.J
~--,-, }:: 1----l
f.-'_J I--!
l'-IJI
r·) t"·-
.,...., J.iJ
lJl OJ
co <t ,.:j"
_I f"-
C··l IJ~I
LO ,__,
OJ ...-:t
!'"--!SI <:l" -..:t u1 r··) :.D ,:,1 co c-1 :n
...-:t -.;j t-·~· ·-:t
,-1
-lSl U
l ... j" r .. -f•) (··J
t-:, en
f<i :.D :s
n: CiJ
C·J "
• •
• •
• •
• •
• •
• •
• •
• •
111 rn en <:t :.n 1.0
si r--
r---1--.. ;n ,:,) tn LO co v,
iSl oo rn co
:si i:--i u1 a, VJ ~ c-1
~ t.-:, en
:,; ~
--·,
< (n
, -l
(fl , -<
-~ C
fl '.rJ
(·.j iJl
f"-IJl
t') ('-j
rS
[f'I
OJ
j'-I"•
J.iJ lJ1 . .:j
. .::j V1
f-".1 (',j (··J
,•< '.-]
, -I
• ·I co ~---~n u
l <'.i f···.1
i<1 r.-) 1>~
C·J C'·J C'·J
C·J ;~·-~
.,-4 -,•,I
,.-1 r-l
r-1 r,f
.,.-C
·1·""'1 ,-,f
·1--I ·M
·r-1
,.-1
.1
><:[
::;,; C
l cr
s-Nn
<t~
!.Dl'-O
O!JltS
l-riNM
...-:t~L
Dl'-O
O(T
liSI
tll C--J t-')
-:t !fl !.D
1----co
!Jl ,--1
,. • r<
, .. ,
, _.., ,_..,
- 0-1
,-<
.,...., ... ,
C-·l C-·l
(··l (··I (··l
('l N
C··l N
c,i t-·~1
I
24

(1) Accessibility --relates the alpha scale to time and distance,
either walking or riding, to or from the station.
(2) Travel Time --this is a ratio of transit time on a typical trip
to the time it would take to make the same trip by car. This ratio is
then associated with the alpha scale.
(3) Directness of Service --number of transfers necessary to accomplish
a trip, the less, the higher the rating.
(4) Delay --a rating of the amount of time expended in unexpected delay
during a trip (which may or not be made up by higher travel speeds
after the delay)
(5) Frequency of Service --the "policy" or maximum time between consists
or units of the transit system. This is often called "headway."
(6) Reliability --an estimate of how well the system sticks to its
schedule, with adjustments for frequency of consists or headway. The
more the headway, the less desirable late trains or cars are.
(7) Passenger Density --this factor supports the generally accepted user
perception that it is much more desirable to sit than to stand, even
for short trips. The rating is arrived at by computing a ratio of
passengers being carried to seating capacity, and also brings in the type
of seating provided.
(8) Passenger Comfort --three factors:
(a) Acceleration/deceleration capability
A = less than 1 fps/s
to
F = greater than 4 fps/s
(b) Temperature (high and low extremes)
25
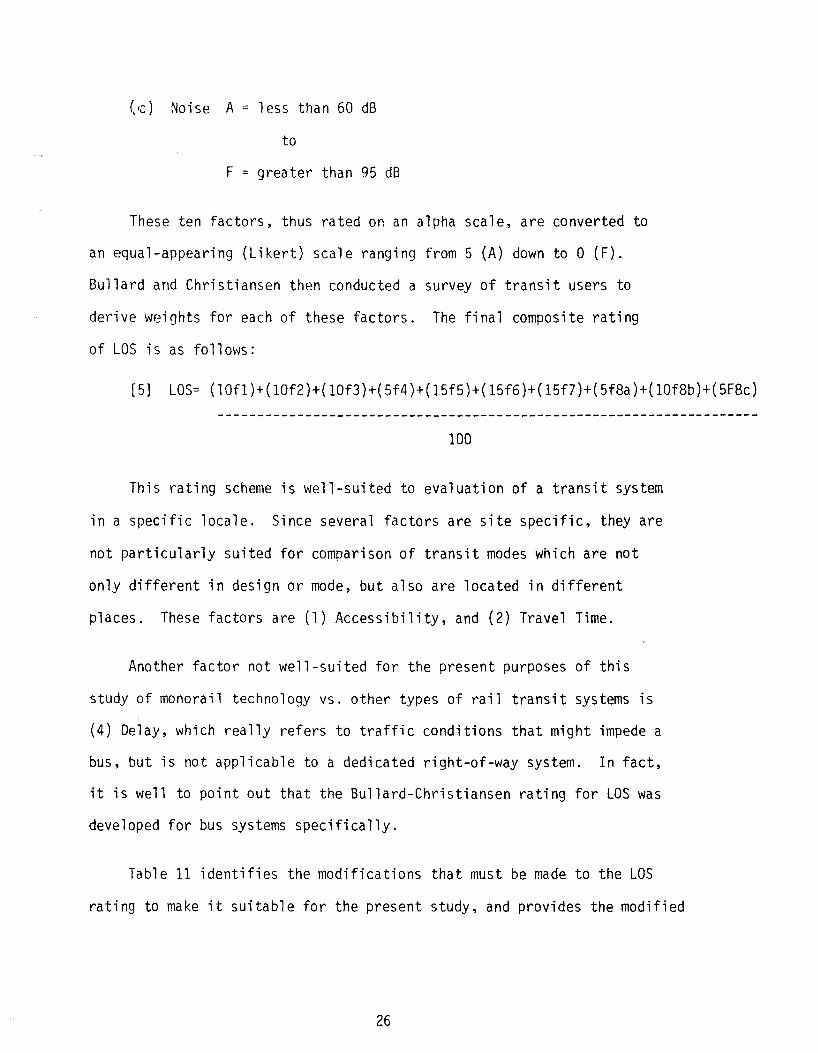
(~) Noise A= less than 60 dB
to
F = greater than 95 dB
These ten factors, thus rated on an alpha scale, are converted to
an equal-appearing (Likert) scale ranging from 5 (A) down to O (F).
Bullard and Christiansen then conducted a survey of transit users to
derive weights for each of these factors. The final composite rating
of LOS is as follows:
[5] LOS= (10fl)+(l0f2)+(10f3)+(5f4)+(15f5)+(15f6)+(15f7)+(5f8a)+(l0f8b)+(5F8c)
100
This rating scheme is well-suited to evaluation of a transit system
in a specific locale. Since several factors are site specific, they are
not particularly suited for comparison of transit modes which are not
only different in design or mode, but also are located in different
places. These factors are (1) Accessibility, and (2) Travel Time.
Another factor not well-suited for the present purposes of this
study of monorail technology vs. other types of rail transit systems is
(4) Delay, which really refers to traffic conditions that might impede a
bus, but is not applicable to a dedicated right-of-way system. In fact,
it is well to point out that the Bullard-Christiansen rating for LOS was
developed for bus systems specifically.
Table 11 identifies the modifications that must be made to the LOS
rating to make it suitable for the present study, and provides the modified
26

Table 11. MODIFIED L-0-S
Rating Scheme for Monorail Study
1. ACCESSIBILITY - No data available for systems studied, drop factor.
2. TRAVEL TIME - No data on auto travel time over route equivalent to
transit route, drop factor.
3. DIRECTNESS OF SERVICE Transfers required on given trip; can be roughly
estimated. Retain Factor.
4. DELAY - No data on actual trip delays vs. scheduled, not completely
applicable to dedicated right-of-way facility. Drop Factor.
5. FREQUENCY OF SERVICE - Policy headway evaluated for peak and off-peak.
Retain Factor.
6. RELIABILITY - No data on schedule maintenance,drop factor.
7. PASSENGER DENSITY - Occupancy/seated capacity ratio, data available,
retain factor.
8. PASSENGER COMFORT (A) - JOLTING - Acceleration and deceleration capability
data available, re ta i n factor.
8. (B) TEMPERATURE - No data, drop factor.
8. ( C) NOISE - Rough estimate of noise available, retain
factor.
Modified L-0-S rating for Monorail Study:
50
27

composite rating equation.
In order to compare LOS ratings with Trip Time ratings (which are
unidimensional average speed of transit estimates), four representative
transit systems were evaluated with respect to the five factors identified
in Table 11, using the guidelines established by Bullard and Christiansen (8).
These four transit systems were:
(1) Monorail in Tokyo, Japan
(2) Rapid Rail System, the Metro in Washington, D.C.
(3) A light rail (trolley) system with some dedicated right-of-way
in Cleveland, Ohio
(4) A park-and-ride conventional bus system using HOV access to
downtown in Dallas, Texas.
28

III. RESULTS OF OPERATIONAL COMPARISONS
The service-specification envelopes for the average operational
data are presented in graphical form in Figure 4. The envelope for the
older rapid rail systems is not included in this figure because of its
similarity to that of the newer systems. It is included, as are the
envelopes for light rail and bus averages using 3 mile trip lengths and
quarter mile station spacings, as Appendix D.
The graphs in Figure 4 shows an increasing trend in both break
even or viability capacity and maximum capacity limits starting with
busway operations on the lower end to rapid rail on the upper end of the
spectrum. The difference in trip times among the various modes is not
as pronounced. The four transit modes considered are so similar in their
speed parameters that the differences in trip times is of no practical
consequence.
Level of Service (LOS) rating which was intended to add a measure of
discrimination to the trip time criterion failed to demonstrate such
discrimination. The outcome of this comparison is presented in Table 12.
It will be noted that all of these modes earn relatively poor "C" marks
on an alpha scale of A to F, since LOS includes on factor 7, passenger
density (weight of 15). All but the under-utilized Dallas bus system
have standees during peak operations. If this factor is discounted, and
the divisor for the overall LOS rating is reduced from 50 to 35, the final
column in Table 12 results. Buses show up as inferior to other modes,
29

NE'..I RAPID RAIL ~." I P f I ME 'Jr-
15
20
MIIWTES 25
30
35
40 10 2 10 3 104
'10NORAIL
:J 20
."lllUTES 25
30
35
40 ,oz 103 104
LIGHT RAIL 10
15
20
MINUTES 25
30
35
40 10 2 10 3 10 4
BUS 10
20
Ml NUTES
30
35
40 10 2 10 3 104
PASSENGERS PER HOUR (LOG SCALE)
Figure 4. Service Specification Envelopes for Four Modes of Transit
30

w ,_.
TRANSIT SYSTEM
RAPID RAIL-WASH. DC METRO
MONORAIL-TOKYO
LIGHT RAIL-CLEVELAND SHAKER
BUS-PARK & RIDE DALLAS
VALUE OF ALPHA RATINGS:
A = 5 B = 4 C = 3 D = 2 E = 1 F = 0
Table 12 LOS RATINGS FOR COMPARABLE MASS TRANSIT MODES
RATING FACTORS
Directions Freq. of Passenger Accel/ of Service Service Density Decel (F3) (F5) ( F7) ( F8A) Weight: 10 Weight: 15 Weight: 15 Weight: 5
Ra ti nCJ WeiCJhted R w R w R w
B 40 A 75 F 0 D 10
B 40 A 75 F 0 F 0
D 20 A 75 F 0 D 10
D 20 B 60 B 60 F 0
Noise LOS LOS Rating Rating
(F8C) Without Weight: 5 F7 R w
B 20 2.9=C 4.14=B
C 15 2.6=C 3. 71=B
B 20 2.5=C 3.57=B
C 15 3.l=C 2.71=C

but PCC* trolleys, a modern rapid rail system that is probably the
most costly of its kind in the world, and a 19-year old monorail system in
Tokyo rate the same - B. Presumably, if these four factors represent the
non-site-specific point of view of the user, these 3 systems would be
equally satisfactory to the same person. Obviously LOS as modified here is not
a very sensitive discriminator.
*President's Commission Car, a technical group in the 1930's appointed by the President of the U.S. drew up specifications for this design.
32

IV. CONCLUSIONS AND RECOMMENDATIONS
The service specification envelope approach indicated a continuum of
hourly passenger requirements with some overlap in capabilities. Busway
and light rail systems tend to group at the lower end of this continuum,
meaning that they require fewer passengers per hour to break even but have
smaller maximum capacities. Monorail and rapid rail cluster at the upper
end of the continuum with considerable overlap in their operational envelopes.
They cost more to operate but provide greater maximum capacities.
The trip time dimension of the various systems showed only slight
differences in capabilities and did not practically discriminate. The Level
of Service comparisons also failed to show any significant differences in
this dimension. Based on these comparisons it was concluded that monorail
transit technology has operational characteristics that fall between those
of light rail and rapid rail but performing a great deal like the latter.
The service-specification envelope methodology served the purpose for
which it was intended. It allowed a visual comparison to be made of the
operational characteristic of the various systems which is an improvement over
the presentation of individual data points.
Monorails are a proven transit technology similar in operation to rapid
rail systems. Due to the nature of their smaller, above ground construction,
they are less costly to build than other underground or elevated rapid rail
systems. Use of pre-casting construction techniques allow monorail systems
to build quickly with little disruption of traffic or commerce.
33

The line switching constraints of 8 to 30 seconds do not pose any
difficulty considering the minimum train headways used in practical transit
operations (1.5-2 minutes). Safety and emergency egress can be handled by
using trains on the parallel beamway or pneumatic slides similar to those
used in aircraft. These provisions are available even though monorail systems
have excellent safety and reliability records.
This background along with the information and experience in the perfor
mance of the first two tasks allows the following recolTlllendations to be made:
1. Monorail systems are a viable transit technology and as such
should be seriously considered as an alternative to other transit
modes.
2. Transit modes alternative analyses can only provide a preliminary
examination of the feasibility of the various systems. As a result,
in most cases,all alternatives are feasible. Need or passenger
demand, cost, capitalization methods, political climate, and other
factors ultimately determine the selection of a mode. Consequently,
the time and resources committed to investigating alternatives would
be better spent on requesting bids from vendors or various suppliers
for systems to perform specific functions.
3. Monorail systems are eminently feasible in any city where demands
warrant the consideration of rapid or light rail. Since this is
the case and since the present investigators are not in a position
to make an engineering and construction estimate to build a monorail
or any other transit system, it is reconmended that the third task
of this project not be attempted and the project concluded at this
point.
34

REFERENCES
1. Brackett, Q., Biswas, M., and Lucy, S.H. Monorail Technology Study Task I: A Review of Monorail Systems. College Station, Texas: Texas Transportation Institute, Texas A&M University, October, 1982.
2. Southeastern Wisconsin Regional Planning CoITTTiission. State-of-the-Art of Primary Transit System Technology: Technical Report No. 24. Waukesha, Wisconsin, February, 1981.
3. Bechtel Civil and Minerals, Inc. and Barton-Aschman Associates, Inc. Transportation Service Modes and Service Areas Study: Characteristics of Express Transit Modes, Work Paper No. 2. Prepared for Interim Regional Transportation Authority, Dallas, Texas, May, 1982.
4. Persona 1 Communication. Japan Monorail Association, 17-9 Uchi kanda 1-Chome, Chiyoda-Ku, Tokyo, 101 Japan.
5. Rea, John C. and Miller, James, H. Comparative Analysis of Urban Transit Modes Using Service-Specification Envelopes. Pennsylvania State University.
6. Special Publication 699: Highway Capacity and Level of Service (1979) ISBN 02844-2, Transportation Research Board, National Academy of Sciences.
7. Bullard, D. and Christiansen, D.L. "Level of Service Concept. Applied to Pub 1 i c Transportation. 11 Tech. Report 1067-lF (Study 2-10-81-1067 for State Department of Highways and Public Transportation) texas Transportation Institute, Texas A&M University System, August, 1981.
35