monroe capital corporation (nasdaq: mrcc) company … capital corporation... · annualized dividend...
TRANSCRIPT

Monroe Capital Corporation (NASDAQ: MRCC)
Company OverviewAugust 2015
1
Disclaimer
1
These materials and any presentation of which they form a part are neither an offer to sell, nor a solicitation of an offer to purchase, an interest in Monroe Capital
Corporation (“Monroe”, “Monroe Capital” or the “Company”). These disclosure materials are being provided for discussion purposes only and do not constitute an
offer or invitation for the sale or purchase of securities. These materials are not advice, a recommendation or an offer to enter into any transaction with Monroe or
any of its affiliates. There is no guarantee that any of the goals, targets or objectives described in these materials will be achieved. The information contained
herein is not intended to provide, and should not be relied upon for, accounting, legal or tax advice or investment recommendations. These materials and the
presentations of which they are a part, and the summaries contained herein, do not purport to be complete and no obligation to update or otherwise revise such
information is being assumed. Nothing shall be relied upon as a promise or representation as to the future performance of the Company.
These materials may contain certain forward-looking statements. Any such statements, other than statements of historical fact, are likely to be affected by other
unknowable future events and conditions, including elements of the future that are or are not under the Company’s control, and that the Company may or may not
have considered; accordingly such statements cannot be guarantees or assurances of any aspect of future performance. Actual developments and results are
highly likely to vary materially from these estimates and projections of the future as a result of a number of factors, including those described from time to time in
the Company’s filings with the Securities and Exchange Commission. These materials should be read in conjunction with the Company’s periodic and current
reports filed from time to time with the Securities and Exchange Commission, which reports are available on the website of the Company and the Securities and
Exchange Commission.
There is no guarantee that any of the estimates, targets or projections illustrated in these materials and any presentation of which they form a part will be
achieved. The case studies, and any other references herein to any of the Company’s past or present investments or its past or present performance, have been
provided for illustrative purposes only. It should not be assumed that these investments were or will be profitable or that any future investments by the Company
will be profitable or will equal the performance of these investments.
Certain information contained herein has been derived from financial statements and other documents provided by the portfolio companies and/or the third party
manager of such portfolio companies unless otherwise stated.
Past performance is not indicative of future results. In addition, there can be no assurance that unrealized investments will be realized at the expected multiples
shown as actual realized returns will depend on, among other factors, future operating results of each of the Company’s current portfolio companies, the value of
the assets and economic conditions at the time of disposition, any related transaction costs, and the timing and manner of sale, all of which may differ from the
assumptions on which the Company’s expected returns are based. In many instances, the Company will not determine the timing or manner of sale of the
Company’s portfolio companies.

2
Investment Highlights: Monroe Capital Corporation (NASDAQ: MRCC)
Proven Senior Management Team
Experienced management featuring long-term focus on the lower middle market
Over $3.9 billion invested since inception as a team in over 800 middle-market investments
Approximately $2.4 billion in assets under management as of June 30, 2015
Credit first underwriting, with “zero loss tolerance”
Unique Lower Middle Market Platform
A leading brand in the lower middle market; 2013 and 2014 Small Mid Market Lender of the Year (Global M&A Network); 2013 Unitranche Lender of the Year (Private Debt Investor); 2014 Senior Lender of the Year (Private Debt Investor); 2015 Small Business Investment Company (SBIC) of the Year
Nationwide origination capabilities & substantial relationships with commercial banks across the United States
Demonstrated sponsored/non-sponsored sourcing and execution
Compelling Market Opportunity
Reduced competition as many regional banks and finance companies have left the market or curtailed cash flow lending
Enormous demand for middle-market debt capital due significant amount of debt maturities in the next five years and large pool of uninvested private equity capital
Middle market debt has lower default rates and higher recovery rates, offering downside protection
Attractive Portfolio & Pipeline
Existing portfolio of $282.5 million, 10.8% current contractual yield, 11.1% current effective yield; 81% first lien senior
secured and unitranche as of June 30, 2015
Large and growing pipeline of new financing opportunities
High Risk-Adjusted Returns
Annualized dividend yield to shareholders of approximately 9.7%1
Target portfolio return in the low-teens with attractive risk profile, consistent with unitranche and senior secured strategy
Shareholder friendly fee structure/terms; sponsor incentives aligned with shareholders
SBIC subsidiary creates potential for increased leverage and improvements in per share Net Investment Income
_____________________
(1) Based on closing stock price as of August 10, 2015
3
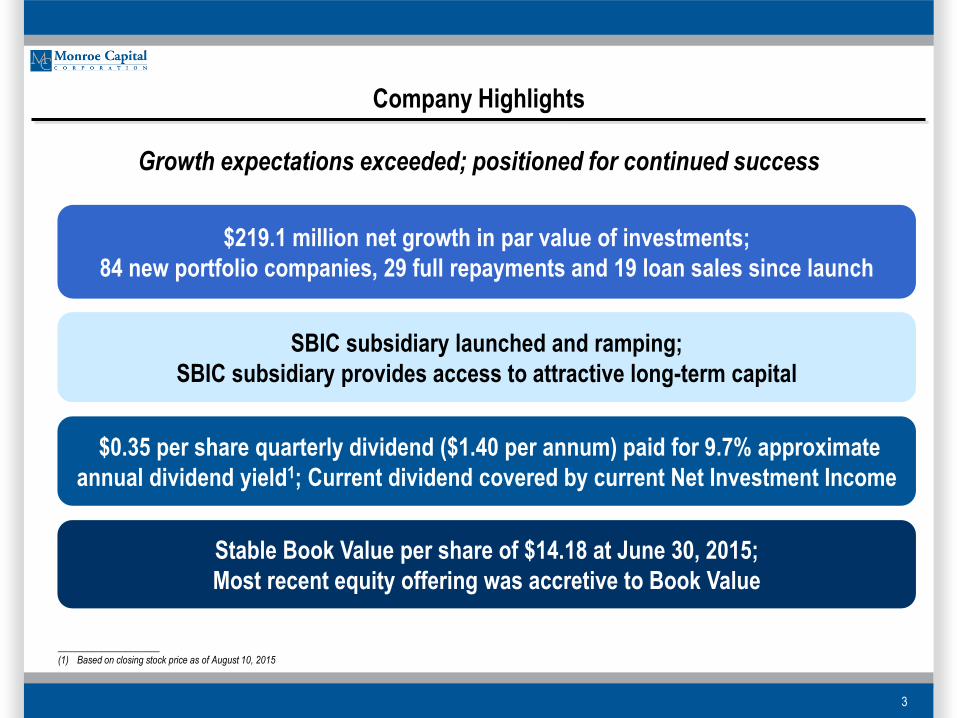
Company Highlights
$219.1 million net growth in par value of investments;
84 new portfolio companies, 29 full repayments and 19 loan sales since launch
SBIC subsidiary launched and ramping;
SBIC subsidiary provides access to attractive long-term capital
$0.35 per share quarterly dividend ($1.40 per annum) paid for 9.7% approximate
annual dividend yield1; Current dividend covered by current Net Investment Income
Stable Book Value per share of $14.18 at June 30, 2015;
Most recent equity offering was accretive to Book Value
Growth expectations exceeded; positioned for continued success
_____________________
(1) Based on closing stock price as of August 10, 2015

4
MRCC Has One of the Highest Returns of Its Peer Group Over the Last 12 Months
18.6% LTM
return is one
of the highest
in the BDC
industry,
which has a
negative
mean LTM
return
LTM Total Return (1)
Newtek Business Services Corp. 60.9% CM Finance Inc -3.7%
Gladstone Investment Corporation 19.9% Harvest Credit Capital Corporation -4.9%
Monroe Capital Corporation 18.6% Capitala Finance Corporation -6.3%
MCG Capital Corporation 17.7% Gladstone Capital Corporation -7.2%
Saratoga Investment Corp. 15.9% OHA Investment Corporation -8.1%
BlackRock Capital Investment Corp. 15.8% Apollo Investment Corporation -10.7%
Garrison Capital Inc. 12.0% American Capital, Ltd. -11.3%
New Mountain Finance Corp. 10.0% Horizon Technology Finance Corp. -11.4%
TPG Specialty Lending Inc. 9.5% Fidus Investment Corp. -13.2%
Golub Capital BDC, Inc. 8.1% TriplePoint Venture Growth BDC Corp. -14.9%
FS Investment Corporation 6.2% MVC Capital Inc. -18.6%
Ares Capital Corporation 4.9% TICC Capital Corp. -19.7%
PennantPark Floating Rate Capital Ltd. 4.5% Triangle Capital Corporation -20.2%
Solar Senior Capital Ltd 4.5% Stellus Capital Investment Corp -21.1%
Alcentra Capital Corporation 3.7% Hercules Technology Growth Capital -21.7%
Main Street Capital Corporation 2.5% Harris & Harris Group, Inc. -22.8%
WhiteHorse Finance, Inc. 2.3% Fifth Street Senior Floating Rate Corp -23.1%
THL Credit Inc. 1.9% Prospect Capital Corporation -23.2%
BDCA Venture, Inc. 1.2% PennantPark Investment Corp. -23.5%
Solar Capital Ltd. 1.1% Medley Capital Corp. -25.5%
American Capital Senior Floating Ltd 0.9% KCAP Financial, Inc. -29.0%
OFS Capital Corp. -2.2% Fifth Street Finance Corp. -30.1%
TCP Capital Corporation -3.0% Goldman Sachs BDC, Inc. NA
MEAN -3.4%
MEDIAN -3.0%
(1) LTM total return assumes dividends are reinvested.
Source: Raymond James, "BDC Industry Investment Banking Weekly Newsletter," August 7, 2015

5
MRCC Stock Had the Highest Return of Its Peer Group in 2014
30.8% LTM
return was
the highest in
the BDC
industry in
2014, which
had a
negative 6.4%
mean LTM
return
LTM Total Return (1)
Monroe Capital Corporation 30.8% Stellus Capital Investment Corp -7.2%
Garrison Capital Inc. 14.4% PennantPark Investment Corp. -9.6%
New Mountain Finance Corp. 9.8% BDCA Venture, Inc. -10.5%
TCP Capital Corporation 9.5% Solar Senior Capital Ltd -12.7%
Horizon Technology Finance Corp. 8.7% Solar Capital Ltd. -13.8%
PennantPark Floating Rate Capital Ltd. 8.1% WhiteHorse Finance, Inc. -13.9%
OFS Capital Corp 2.4% Prospect Capital Corporation -15.0%
Golub Capital BDC, Inc. 0.9% Harvest Capital Credit Corporation -15.8%
Capitala Finance Corporation -0.8% Fifth Street Senior Floating Rate Corp -16.9%
Harris & Harris Group, Inc. -1.0% TICC Capital Corp. -17.2%
Hercules Technology Growth Capital -1.6% Triangle Capital Corporation -19.2%
BlackRock Kelso Capital Corporation -2.9% THL Credit Inc. -21.1%
Main Street Capital Corporation -3.0% MVC Capital Inc. -21.7%
Fifth Street Finance Corp. -3.2% Fidus Investment Corp. -25.1%
Apollo Investment Corporation -3.5% Medley Capital Corp. -26.0%
Ares Capital Corporation -3.6% OHA Investment Corporation -35.4%
Gladstone Investment Corporation -3.9% Alcentra Capital Corporation NA
Saratoga Investment Corp. -4.0% American Capital Senior Floating Ltd NA
KCAP Financial, Inc. -4.2% CM Finance Inc NA
Gladstone Capital Corporation -5.6% TriplePoint Venture Growth BDC Corp. NA
American Capital, Ltd. -6.6% FS Investment Corporation NA
MCG Capital Corporation -6.9% TPG Specialty Lending Inc. NA
MEAN -6.4%
MEDIAN -4.9%
(1) LTM total return assumes dividends are reinvested.
Source: Raymond James, "BDC Industry Investment Banking Weekly Newsletter," December 31, 2014

6
MRCC Dividend Coverage is Among the Highest in the BDC Industry
129.4%
Dividend
Coverage is
among the
highest in the
BDC industry,
which has
mean
dividend
coverage of
96.7%
(1) Dividend coverage is the prior quarter's net investment income dividend by the prior quarter's dividend
(2) MAIN dividend coverage does not include supplemental dividend
(3) Adjusted Net Investment Income as calculated by the company for BKCC, FDUS, FSIC, HCAP, HRZN, MRCC, NMFC, PNNT, SUNS, TICC
(4) Recently reduced quarterly dividend
Source: Raymond James, "BDC Industry Investment Banking Weekly Newsletter," August 7, 2015
Dividend Coverage (1)(2)(3)
TriplePoint Venture Growth BDC Corp. 133.3% Harvest Capital Credit Corporation 94.8%
Monroe Capital Corporation 129.4% Gladstone Investment Corporation 94.4%
Garrison Capital Inc. 122.9% FS Investment Corporation 94.3%
TCP Capital Corporation 122.2% Stellus Capital Investment Corp 94.1%
TPG Specialty Lending Inc. 117.9% Golub Capital BDC, Inc. 93.8%
BlackRock Capital Investment Corp. 114.3% (4) Ares Capital Corporation 92.1%
Apollo Investment Corporation 110.0% Triangle Capital Corporation 90.7%
WhiteHorse Finance, Inc. 109.9% Prospect Capital Corporation 86.5% (4)
Gladstone Capital Corporation 109.5% OFS Capital Corp 82.4%
Alcentra Capital Corporation 108.8% Fifth Street Senior Floating Rate Corp 76.7%
American Capital Senior Floating Ltd 106.5% Fifth Street Finance Corp. 76.3% (4)
Main Street Capital Corporation 104.8% KCAP Financial, Inc. 76.2% (4)
Newtek Business Services Corp. 104.3% Hercules Technology Growth Capital 74.2%
PennantPark Floating Rate Capital Ltd. 103.7% Horizon Technology Finance Corp. 72.5%
New Mountain Finance Corp. 102.9% Capitala Finance Corporation 70.2%
THL Credit Inc. 102.9% TICC Capital Corp. 62.1% (4)
Solar Senior Capital Ltd 102.1% MVC Capital Inc. 33.3%
CM Finance Inc 100.9% BDCA Venture, Inc. NA
Fidus Investment Corp. 100.0% Goldman Sachs BDC, Inc. NM
Medley Capital Corp. 100.0% (4) MCG Capital Corporation NM
OHA Investment Corporation 100.0% (4) American Capital, Ltd. NM
PennantPark Investment Corp. 100.0% Saratoga Investment Corp. NM
Solar Capital Ltd. 95.0% Harris & Harris Group, Inc. NM
MEAN 96.7%
MEDIAN 100.0%

7
MRCC Return on Equity (NII) Supports the Dividend Yield
11.9% Return
on Equity
(NII) is among
the highest in
the BDC
industry,
which has
mean ROE of
9.0%
Return on Equity (NII) (1)
TCP Capital Corporation 14.1% PennantPark Floating Rate Capital Ltd. 9.0%
Triangle Capital Corporation 14.0% Goldman Sachs BDC, Inc. 8.9%
Medley Capital Corp. 12.5% Gladstone Capital Corporation 8.7%
Monroe Capital Corporation 11.9% Horizon Technology Finance Corp. 8.2%
TPG Specialty Lending Inc. 11.8% WhiteHorse Finance, Inc. 8.2%
Apollo Investment Corporation 11.4% American Capital Senior Floating Ltd 8.1%
PennantPark Investment Corp. 11.0% Gladstone Investment Corporation 8.0%
New Mountain Finance Corp. 11.0% Saratoga Investment Corp. 7.8%
Fidus Investment Corp. 10.8% Golub Capital BDC, Inc. 7.6%
Garrison Capital Inc. 10.8% Capitala Finance Corporation 7.6%
THL Credit Inc. 10.7% BlackRock Capital Investment Corp. 7.3%
Main Street Capital Corporation 10.0% Solar Senior Capital Ltd 7.2%
Fifth Street Finance Corp. 9.9% Solar Capital Ltd. 6.7%
Prospect Capital Corporation 9.9% OFS Capital Corp 5.1%
Fifth Street Senior Floating Rate Corp 9.7% American Capital, Ltd. 3.1%
TICC Capital Corp. 9.7% OHA Investment Corporation 2.8%
Stellus Capital Investment Corp 9.6% MVC Capital Inc. 0.2%
CM Finance Inc 9.4% MCG Capital Corporation NM
Harvest Capital Credit Corporation 9.2% BDCA Venture, Inc. NM
Hercules Technology Growth Capital 9.2% Harris & Harris Group, Inc. NM
Ares Capital Corporation 9.1% Newtek Business Services Corp. NA
KCAP Financial, Inc. 9.1% Alcentra Capital Corporation NA
TriplePoint Venture Growth BDC Corp. 9.0% FS Investment Corporation NA
MEAN 9.0%
MEDIAN 9.1%
(1) LTM net investment income divided by LTM average net assets.
Source: Raymond James, "BDC Industry Investment Banking Weekly Newsletter," August 7, 2015

8
Growth in Adjusted Net Investment Income
_____________________
1) Adjusted Net Investment Income is a non-GAAP measure. See the Company’s press releases at www.monroebdc.com for a reconciliation from net investment income to adjusted net investment income.
2) CAGR, or Compound Annual Growth Rate, is calculated based on the quarter ended 1Q 2013, which was the first full quarter of investment after the initial public offering and the quarter ended 2Q 2015.
$0.15
$0.29 $0.30
$0.27
$0.31
$0.33
$0.35
$0.39
$0.48
$0.44 $0.43
$0.10
$0.15
$0.20
$0.25
$0.30
$0.35
$0.40
$0.45
$0.50
4Q 2012 1Q 2013 2Q 2013 3Q 2013 4Q 2013 1Q 2014 2Q 2014 3Q 2014 4Q 2014 1Q 2015 2Q 2015
Quarterly Adjusted Net Investment Income per Share1
Adjusted Net Investment Income per Share has trended up since we raised capital in October 2012 and July 2013 and starting in
2Q 2014, comfortably covers our current quarterly dividend of $0.35 per share
Additional Capital
Raise Closed 7/22/13
Initial Public Offering
Closed 10/31/12
Additional Capital
Raise Closed 4/20/15

9
MRCC - Outsized Potential Return While Maintaining Safety
_____________________
Source: Wells Fargo Securities; Source: Raymond James, August 7, 2015, Yahoo! Finance; Company Filings
(1) BDC Mean consists of the mean of ABDC, ACAS, ACSF, AINV, ARCC, BDCV, BKCC, CMFN, CPTA, FDUS, FSFR, FSC, FSIC, GAIN, GARS, GBDC, GLAD, GSBD, HCAP, HRZN, HTGC, KCAP, MAIN, MCC, MCGC,
MRCC, MVC, NEWT, NMFC, OFS, OHAI, PFLT, PNNT, PSEC, SAR, SCM, SLRC, SUNS, TCAP, TCPC, TCRD, TICC, TINY, TPVG, TSLX and WHF (Source: Raymond James, "BDC Industry Investment Banking
Weekly Newsletter," August 7, 2015)
(2) BDC Mean consists of the mean of ABDC, ACAS, ACSF, AINV, ARCC, BKCC, FSC, FSFR, FSIC, GLAD, GBDC, GSBD, HCAP, HRZN, HTGC, MAIN, MCC, NMFC, PFLT, PNNT, PSEC, SCM, SLRC, SUNS, TCAP,
TCPC, TCRD, TICC, TSLX, TPVG and WHF (Source: Wells Fargo – The 7/23 Thursday Bocks’d Lunch, 7/23/15)
81.0%
56.7%
0.0%
20.0%
40.0%
60.0%
80.0%
100.0%
MRCC BDC Mean (2)
18.6%
-3.4%-10.0%
-5.0%
0.0%
5.0%
10.0%
15.0%
20.0%
25.0%
MRCC BDC Mean (1)
LTM Total Return (through 8/7/2015)
1st Lien Debt as a % of Portfolio
11.1%
10.3%
8.0%
9.0%
10.0%
11.0%
12.0%
MRCC BDC Mean (2)
129.4%
96.7%
80.0%
100.0%
120.0%
140.0%
MRCC BDC Mean (1)
Current Dividend Coverage
Weighted Average Effective Yield on Portfolio

10
Portfolio Mix – 1st Lien as a Percentage of the Portfolio
1. Source: Wells Fargo Securities, The 7/23 Thursday Bocks’d Lunch, July 23, 2015
2. Raymond James, “BDC Industry Investment Banking Weekly Newsletter”, August 7, 2015
MRCC is has a higher percentage of 1st lien debt and is generating a higher yield when compared the mean of peer BDCs
81% of MRCC’s
portfolio represents
1st lien senior
secured debt, which
is generally
considered less risky
than 2nd lien and
subordinated debt
investments
1st Lien Debt
Percentage of
Total1
Yield on 1st
Lien Debt1
Weighted Avg.
Total Portfolio
Yield1
Dividend
Coverage2
MRCC 81.0% 11.2% 11.1% 129.4%
Mean 56.7% 9.4% 10.3% 98.6%
TPVG 96.4% 10.9% 13.4% 133.3%
HRZN 95.1% 10.8% 11.8% 72.5%
FSFR 93.0% 6.5% 6.8% 76.7%
HTGC 92.7% 10.2% 10.6% 74.2%
TSLX 90.3% 8.7% 9.4% 117.9%
GBDC 88.9% 7.3% 7.7% 93.8%
PFLT 82.6% 7.3% 8.3% 111.1%
ACSF 69.8% 5.0% 5.4% 106.5%
FSIC 66.4% 9.7% 10.2% 94.3%
MCC 64.3% 11.7% 11.9% 100.0%
TCPC 62.3% 9.8% 10.5% 122.2%
SUNS 58.3% 6.2% 6.8% 102.1%
PSEC 56.8% 10.4% 11.3% 86.5%
GSBD 56.0% 9.6% 10.6% NM
FSC 54.5% 8.9% 10.1% 76.3%
TICC 54.0% 6.2% 7.2% 62.1%
GLAD 53.8% 9.9% 10.5% 109.5%
TCRD 52.6% 11.0% 11.6% 102.9%
WHF 52.5% 11.0% 11.5% 109.9%
HCAP 52.3% 13.9% 14.6% 94.8%
NMFC 46.1% 8.1% 9.4% 102.9%
MAIN 46.1% 7.4% 10.0% 104.8%
ACAS 41.8% 5.5% 7.9% NM
ABDC 39.5% 11.6% 12.1% 108.8%
BKCC 36.0% 10.9% 11.6% 114.3%
AINV 35.9% 11.1% 11.1% 110.0%
ARCC 35.1% 8.2% 9.2% 92.1%
PNNT 26.3% 11.7% 12.2% 100.0%
SCM 25.0% 9.5% 11.5% 94.1%
SLRC 19.5% 9.6% 9.6% 95.0%
TCAP 13.6% 11.4% 13.7% 90.7%

11
Strong Platform & Proprietary Deal Sourcing Capabilities
Monroe brings a strong established network that is unique to the lower middle market
Strategic Regional Bank Relationship Exposure
Monroe Offices * Current LPs in Monroe funds
Midwest
Regional Sponsors- Bolder Capital- Chicago Growth Partners- Frontenac Company- Geneva Glen Capital- Industrial Opportunity Partners - Resilience Capital- Wynnchurch Capital- Z Capital Partners
Regional Bank Relationships- BMO Harris*- Cole Taylor* (MB Financial)- Fifth Third Bank- FirstMerit Bank*- Key Bank- Private Bank & Trust*- Talmer Bank & Trust- Wintrust*
West Coast
Regional Sponsors- Caltius Equity Partners- Golden Gate Capital- Grey Mountain Partners- Olympic Valley Capital- SPK Capital- Swander Pace Capital
Regional Bank Relationships- City National Bank- East West Bank* - Wells Fargo
Southeast
Regional Sponsors- Harren Equity Partners- HIG Capital- Msouth Equity Partners- RMP Group- Sun Capital Partners
Regional Bank Relationships- AloStar Bank- EverBank
Northeast
Regional Sponsors- Battery Ventures- BelHealth Investment Partners- Boathouse Capital- Centre Partners- Goode Capital Partners- Monomoy Capital Partners- RLJ Equity Partners- Seaport Capital- Sentinel Capital- Summit Partners- Versa Capital- Wafra Partners- Webster Capital
Regional Bank Relationships- Bank of America Merrill Lynch*- Customers Bank- ING Capital- Santander Consumer USA
Southwest
Regional Sponsors- Pharos Capital- Trive Capital- Pinecrest Capital Partners
Regional Bank Relationships- Texas Capital Bank
12
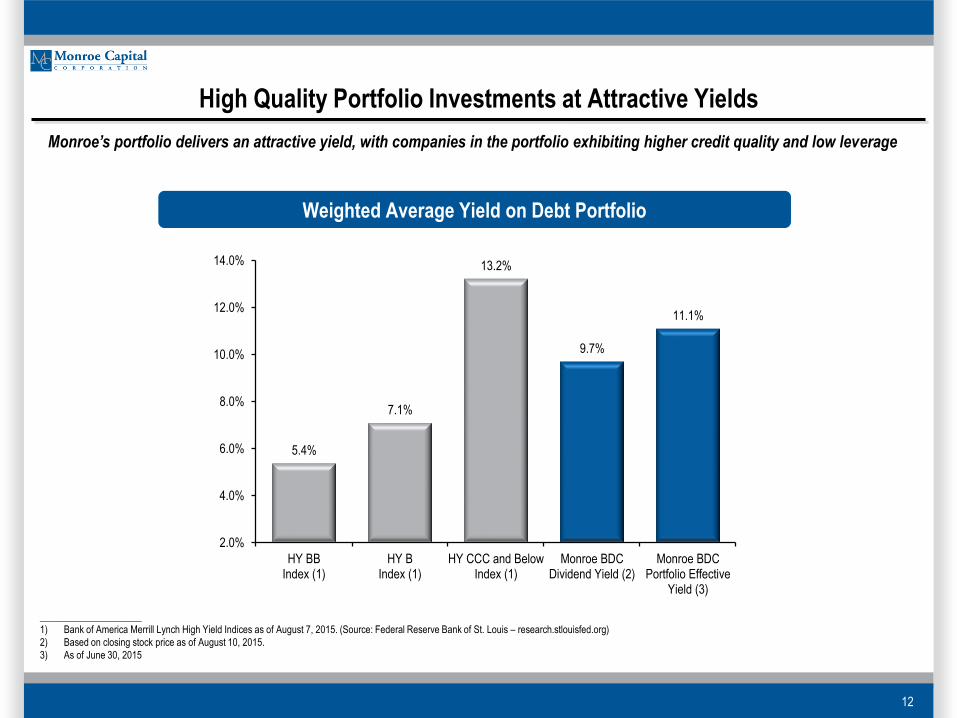
High Quality Portfolio Investments at Attractive Yields
_____________________
1) Bank of America Merrill Lynch High Yield Indices as of August 7, 2015. (Source: Federal Reserve Bank of St. Louis – research.stlouisfed.org)
2) Based on closing stock price as of August 10, 2015.
3) As of June 30, 2015
5.4%
7.1%
13.2%
9.7%
11.1%
2.0%
4.0%
6.0%
8.0%
10.0%
12.0%
14.0%
HY BBIndex (1)
HY BIndex (1)
HY CCC and BelowIndex (1)
Monroe BDCDividend Yield (2)
Monroe BDCPortfolio Effective
Yield (3)
Weighted Average Yield on Debt Portfolio
Monroe’s portfolio delivers an attractive yield, with companies in the portfolio exhibiting higher credit quality and low leverage
13
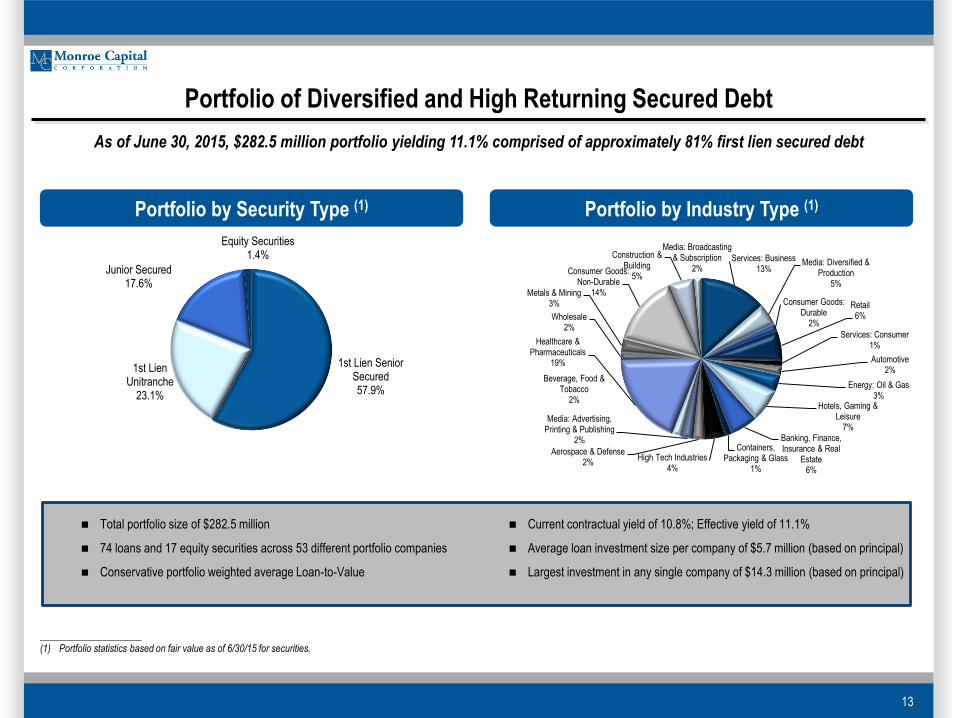
Portfolio by Security Type (1) Portfolio by Industry Type (1)
Portfolio of Diversified and High Returning Secured Debt
As of June 30, 2015, $282.5 million portfolio yielding 11.1% comprised of approximately 81% first lien secured debt
_____________________
(1) Portfolio statistics based on fair value as of 6/30/15 for securities.
Services: Business13%
Media: Diversified & Production
5%
Consumer Goods: Durable
2%
Retail6%
Services: Consumer1%
Automotive2%
Energy: Oil & Gas3%
Hotels, Gaming & Leisure
7%Banking, Finance, Insurance & Real
Estate6%
Containers, Packaging & Glass
1%
High Tech Industries4%
Aerospace & Defense2%
Media: Advertising, Printing & Publishing
2%
Beverage, Food & Tobacco
2%
Healthcare & Pharmaceuticals
19%
Wholesale2%
Metals & Mining3%
Consumer Goods: Non-Durable
14%
Construction & Building
5%
Media: Broadcasting & Subscription
2%
1st Lien Senior Secured57.9%
1st Lien Unitranche
23.1%
Junior Secured17.6%
Equity Securities1.4%
Total portfolio size of $282.5 million
74 loans and 17 equity securities across 53 different portfolio companies
Conservative portfolio weighted average Loan-to-Value
Current contractual yield of 10.8%; Effective yield of 11.1%
Average loan investment size per company of $5.7 million (based on principal)
Largest investment in any single company of $14.3 million (based on principal)

14
Selected Portfolio Investments

15
BDC Structure + Monroe Platform = Attractive Investment Opportunity
Permanent capital base / long term
investment horizon
Delivers a predictable dividend stream
Efficient tax structure (RIC election)
No entity-level taxation
Pass through capital gains to investors
Statutory asset diversification requirement and
leverage limitation reduces risk, while allowing
for enhanced returns
Premier lower middle market franchise
Nationwide origination focus
Proven management / track record
Unique senior secured first lien approach
Focus on direct originations
Strategic partnerships with banks
Credit first underwriting with “zero loss
tolerance”
Strong investment pipeline
BDC Structure Monroe Capital Platform
Attractive Investment Opportunity
Target portfolio return of 10% +
Lower risk profile
Attractive risk-adjusted returns
Strong dividend profile
Approximate 9.7% annualized yield
Dividend stability is a priority