montana deq - general field data needs for fate and
TRANSCRIPT

TECHNICAL GUIDANCE GENERAL FIELD DATA NEEDS FOR FATE AND TRANSPORT MODELING
September 2008
MONTANA DEPARTMENT OF ENVIRONMENTAL QUALITY REMEDIATION DIVISION SITE RESPONSE SECTION

1
1.0 Overview
This technical guidance identifies information needed to perform chemical fate and transport modeling. The Montana Department of Environmental Quality (DEQ) Site Response Section may use fate and transport models to assist in developing site-specific cleanup levels for contaminants of concern (CoCs) and making other determinations at contaminated sites. This guidance applies to organic chemicals and metals detected in soils and groundwater. Site data needs are subdivided into the following four categories:
� Soil characteristics; � Hydrogeologic characteristics; � Source characteristics; and � Chemical biodegradation
This guidance describes how the data are used for fate and transport modeling. The data are incorporated into a conceptual site model which conveys what is known or suspected about contaminant sources and release mechanisms, the factors that affect chemical transport, and the mechanisms of chemical attenuation [Bear et al., 1992; USEPA, 1998].
DEQ identified the general data needs described below based on a review of scientific and regulatory resources [Newell et al., 1996; USEPA, 1996a; USEPA, 1996b, USEPA, 1998; Wiedemeier et al., 1999]. However, site-specific considerations may require the collection of data not included in this guidance.
2.0 Soil Characteristics
Measurement of five soil properties is necessary for modeling the fate and transport of organic chemicals and metals [USEPA, 1996a]:
� Fraction of organic carbon (foc);� Dry bulk density; � Soil moisture; � Soil pH; and � Soil texture.
Sampling considerations are described below.
2.1 Soil organic carbon
Soil foc is the fraction of the soil matrix comprised of natural organic carbon in uncontaminated areas. The determination of soil foc is an essential part of any site characterization since it can markedly influence how chemicals react in soils and sediments [Schumacher, 2002]. Soil foc affects the mobility of organic compounds and metals in the environment. An increase in foc results in higher adsorption of dissolved constituents to soil and a decrease in mobility [USEPA, 1996b; Newell et al., 1996].

2
Soil foc may vary over several orders of magnitude in soils [Wiedemeier et al., 1999]. In spite of an extensive literature review, little information was identified by the USEPA regarding the distribution of foc in U.S. soils [USEPA, 1996b]. The EPA used a default soil foc of 0.002 gram/gram (g/g) in the calculation of generic soil screening levels [USEPA 1996a, 1996b].
The foc generally decreases with depth below ground surface (bgs) [USEPA, 1996b].
Soil sampling at three separate intervals is recommended to characterize the vertical distribution of foc:
� Surface soils (extending from ground surface to 2 feet bgs); � Subsurface soils (extending from 2 feet bgs to the water table); and � Aquifer sediments below the water table.
In order to determine representative foc values, the analysis of multiple discrete samples within each interval identified above is recommended. DEQ considers the following when evaluating soil foc data:
� The foc should be measured in uncontaminated soils. Organic chemicals of concern (CoCs) may interfere with the measurement of natural organic carbon [Newell et al., 1996];
� Samples collected from vadose zone soils should characterize the foc content of the major sediment types present; and
� Samples collected from aquifer sediments should generally focus on the transmissive (sand and gravel) sediments which provide the primary routes for contaminant transport [USEPA, 1998].
Laboratory methods for measuring soil foc include the Walkley-Black method (ASA Monograph #9, Part 2, Method 29-3.5.2) and high temperature dry combustion techniques described by the USEPA [Schumacher, 2002; see Attachment 1].
2.2 Soil Dry Bulk Density and Moisture
The soil dry bulk density is used to calculate total soil porosity [USEPA, 1988; USEPA, 1996a] and affects the mobility of dissolved CoCs in porous media. Soil density is determined by weighing a thin-walled tube soil sample of known volume and subtracting the tube weight [American Society for Testing and Materials (ASTM) D2937-04, 2004]. The measurement of soil moisture [ASTM 2216-05, 2005] on a subsample of the tube sample is required to adjust field bulk density to dry bulk density [USEPA, 1996a]. The USEPA used a default soil dry bulk density of 1.5 kg/L for calculating soil screening levels [USEPA 1996a, 1996b]. Soil density and moisture should be measured in the major sediment types in surface and subsurface soils at the site.

3
2.3 Soil pH
Soil pH affects the partitioning behavior and mobility of metals and ionizing organic compounds [USEPA, 1996a]. Ionizing organic compounds identified by the USEPA [1996b] are listed in Table 1. The majority of the ionizing organic compounds listed in the table are phenolic compounds, including pentachlorophenol. Although soil pH does not directly affect partitioning behavior of non-ionizing organic compounds (e.g., petroleum hydrocarbons), measurement of soil pH may still be useful in assessing site conditions that may affect CoC biodegradation.
Soil pH may be measured in the field using a portable pH meter in a 1:1 soil/distilled water slurry [USEPA, 1996a; USDA, 2005]. The USEPA assumed a soil pH of 6.8 in the development of generic soil screening levels for ionizing organic compounds and metals [USEPA, 1996b]. Soil pH should be measured in the major sediment types in surface and subsurface soils at the site.
2.4 Particle Size Analysis
Soil particle size analysis is performed to quantify the distribution of soil particle sizes, estimate average soil moisture conditions, and predict water percolation rates through the vadose zone [USEPA, 1996a]. The Standard Test Method for Particle-Size Analysis of Soils [ASTM D422-63, 2007] employs sieving and hydrometer procedures to quantify gravel, sand, silt, and clay fractions. Soil particle size should be measured in the major sediment types in surface and subsurface soils at the site.
3.0 Hydrogeologic Characteristics
The rate of groundwater movement affects the dilution of chemicals leaching from contaminated vadose zone soils and the transport of CoCs in groundwater. Aquifer parameters needed to estimate a site-specific dilution attenuation factor (DAF) include the hydraulic conductivity, hydraulic gradient, and aquifer thickness [USEPA, 1996a]. The hydraulic gradient is interpreted from fluid level measurements collected from a monitoring well network with surveyed well casing locations and elevations. Aquifer thickness is determined from lithologic data recorded during testhole drilling and from a review of literature resources. Hydraulic conductivity is estimated using field testing procedures described below.
Aquifer pumping tests and slug tests are the primary methods for estimating hydraulic conductivity [USEPA, 1996a]. Site-specific considerations will dictate the selection of aquifer testing methods or a combination of methods to estimate hydraulic conductivity. Pumping tests have been characterized as providing the most reliable method of measuring hydraulic conductivity, and slug tests have been described as accurate within an order of magnitude [Osborne, 1993]. Pumping tests measure aquifer properties over a larger physical scale than slug tests, generally resulting in a more accurate estimate of aquifer hydraulic conductivity across the entire site.

4
Slug testing may provide the best option for characterizing formations of low hydraulic conductivity [Butler, 1997]. In addition, slug tests may be utilized to characterize the range in hydraulic conductivities at a site or develop initial estimates of hydraulic conductivity. Proper well construction and development has been emphasized in obtaining accurate slug testing results [Butler and Healey, 1998]. Monitoring well construction standards are provided in Administrative Rules of Montana (ARM) Title 36, Chapter 21, Subchapter 8 (ARM 36.21.8). Methods for improving the accuracy of slug testing developed by the Kansas Geological Survey [Butler et al., 1996; Butler, 1997] should be implemented, including the performance of multiple slug tests at each monitoring well. Suggested standard operating procedures for aquifer pumping tests compiled by the USEPA are provided by Osborne [1993]. Guidance and tools for analyzing slug and pumping tests include Butler [1997], Halford and Kuniansky [2002], and Kasenow [2006].
Aquifer testing results must be combined with soil stratigraphy (recorded in testhole logs). This combined information will help to define the thickness of contaminated aquifers, and document the presence of low permeability sediments (indicated by the predominance of silts or clays) which may affect the movement of groundwater and the transport of CoCs. The presence and extent of perched saturated zones and the continuity of fine grained units must be determined.
4.0 Source Characteristics
4.1 CoC Source Dimensions and Concentrations
Estimates of the area and depth of contamination and the CoC concentrations in each source area are needed to conduct fate and transport modeling [USEPA, 1996a]. Two issues regarding source dimensions and concentrations are emphasized because they are significant in selecting and applying models:
� The vertical distribution of CoCs in source areas, relative to the position of the water table, must be determined. The thickness of the uncontaminated interval between contaminated materials and the seasonal high position of the water table is important in assessing impacts to water quality from chemical leaching. This information is determined from laboratory analytical data quantifying CoC concentrations in site soils. The soil samples can be collected via test pits, boreholes, excavations, etc. The depth to groundwater is determined from periodic fluid level measurements from properly constructed groundwater monitoring wells.
� Measured CoC concentrations in groundwater within source areas are critical in evaluating the rate of loading of CoCs to groundwater, modeling CoC fate and transport in groundwater plumes, and estimating the time required to reach a remediation goal [Newell et al., 2002]. Source area concentrations may be determined by periodic sampling of groundwater monitoring wells constructed in

5
the immediate vicinity of non-aqueous phase liquids (NAPLs) and highly contaminated soils.
4.2 CoC Leaching Characteristics
Due to the complexity of the behavior of metals and ionizing organic CoCs, leaching tests may be appropriate to quantify the partitioning and mobility of the compounds in site soils. The USEPA Synthetic Precipitation Leaching Procedure (SPLP, EPA SW-846 Method 1312, USEPA, 1994) was developed to model an acid rain leaching environment and is generally appropriate for a contaminated soil scenario [USEPA, 1996a].
The following issues apply to sample collection for SPLP analysis:
� SPLP analysis must be combined with a split sample that measures the soil CoC concentration. The ratio between the total soil concentration and the CoC concentration reported by the SPLP analysis is used to define the partitioning behavior [USEPA, 2002; Wisconsin DNR, 2003]; and
� Samples should be collected from areas representative of the contamination at the site [Wisconsin DNR, 2003].
4.3 Non-aqueous Phase Liquids Composition
At sites where NAPL is present and accessible, the determination of NAPL composition facilitates the estimation of CoC mass present in source areas and the effective CoC solubilities. In this case, NAPL samples are analyzed for the same CoCs that are analyzed in soil and groundwater samples collected at the site. For ionizing organic compounds and chlorinated solvents (Tables 1 and 2) the measurement of NAPL composition is valuable in determining if CoCs in soils and groundwater are attributable to NAPL dissolution or are attributable to the biodegradation of parent compounds. The detection of daughter products in other media which are not present in the source NAPL provides evidence of biodegradation [USEPA, 1998].
5.0 Chemical Biodegradation
Chemical biodegradation reactions may control the distance of plume stabilization for organic CoCs [Chapelle et al., 2003]. Screening level modeling may be performed neglecting the role of biodegradation reactions [USEPA, 1996a; USEPA, 1996b]. However, at sites where groundwater is contaminated, an assessment of CoC biodegradation is important in modeling current and future CoC distributions [Chapelle et al., 2003]. Guidelines issued by the U.S. EPA [USEPA, 1999] and the American Society for Testing and Materials [ASTM, 1998] have endorsed the use of site-specific biodegradation rates for evaluating natural attenuation processes in groundwater [Newell et al. 2002].
Site-measured groundwater CoC concentrations and geochemical data are necessary to estimate chemical biodegradation rates in groundwater plumes [Newell et al., 1996; Aziz

6
et al., 2000; Widdowson et al., 2005]. The geochemical data include electron acceptor concentrations (dissolved oxygen, nitrate, sulfate, iron, manganese, and methane), oxidation-reduction potential (ORP), pH, and temperature [Wiedemeier et al., 1999].
Dissolved oxygen, ORP, pH, and temperature are measured in the field using calibrated field probes. Laboratory analytical methods for the remaining analytes are listed in Table 3. For chlorinated solvents and ionizing organic compounds, the analysis of chloride and dissolved organic carbon in groundwater samples is appropriate in addition to the parameters listed above [USEPA, 1998].
The estimation of site-specific biodegradation rates for organic CoCs is complicated by heterogeneity in site attributes and complexity in factors that affect biodegradation rates [USEPA, 1998; Hack and Bekins, 2000; Holden and Fierer, 2005]. To interpret the past behavior of plumes, and to forecast their future behavior, it is necessary to describe the behavior of the plume in both space and time. It is necessary to collect long-term monitoring data from wells that are distributed throughout the plume [Newell et al., 2002]. A minimum of four monitoring wells extending in the direction of groundwater flow (including a source area monitoring well) facilitates the estimation of CoC biodegradation rates [Aziz et al., 2000]. Sites with multiple source areas may be assessed using a network of monitoring wells associated with each source area.
Numerous investigations of CoC biodegradation in laboratory settings have been published in scientific journals [Kearney et al., 1972; Coover and Sims, 1987; Hurst et al., 1997; Suarez and Rifai, 1999; Davis et al., 2003; Boopathy, 2004]. However, biodegradation rate constants determined by microcosm studies often are higher than rates achieved in the field [Sturman et al., 1995; USEPA, 1998]. Sturman et al. [1995] indicated that field degradation rates were a factor of 4 – 10 times slower than the rates indicated by laboratory data for gasoline-range hydrocarbons at six sites.
Employing literature values to estimate site-specific biodegradation rates is subject to a significant level of uncertainty. The laboratory procedures must be reviewed to evaluate the representativeness of the experimental conditions to the conditions at the field site. Important environmental conditions include the temperature, oxygen content, nutrients, and soil moisture content [Coover and Sims, 1987; Hack and Bekins, 2000]. In order to provide a conservative assessment of CoC biodegradation, laboratory-measured biodegradation rates must be reduced by a factor of 10 (or some other DEQ-approved factor) to represent non-ideal conditions which may be present at the site.
6.0 Summary of Data Recommendations
Table 3 summarizes the data recommendations for supporting site-specific fate and transport modeling. In many cases, the collection of these data may be coordinated with site sampling performed to characterize the magnitude and extent of contamination, minimizing the cost of the data. The analytical methods provided in Table 3 were drawn from USEPA guidance [USEPA, 1998; USEPA 2002] or selected from methods currently utilized in Montana for the measurement of soil characteristics. The analytical methods

7
listed in Table 3 are provided for general reference. Actual analytical methods employed must be consistent with the quality assurance project plan (QAPP) and/or sampling and analysis plan (SAP) developed for each site.
7.0 References
American Society for Testing and Materials, 1998. Standard Guide for Remediation of Ground Water by Natural Attenuation at Petroleum Release Sites, ASTM E 1943-98.
American Society for Testing Materials, 2004. Standard Test Method for Density of Soil in Place by the Drive-Cylinder Method, ASTM D2937-04.
American Society for Testing Materials, 2005. Standard Test Methods for Laboratory Determination of Water (Moisture) Content of Soil and Rock by Mass, ASTM D2216-05.
American Society for Testing Materials, 2007. Standard Test Method for Particle-Size Analysis of Soils, ASTM D422-63 (2007).
Aziz, C. E., Newell, C. J., Gonzales, K. R., Haas, P., Clement, T. P., Sun Y., 2000. BIOCHLOR Natural Attenuation Decision Support System, U.S. Environmental Protection Agency, Center for Subsurface Modeling Support, EPA/600/R-00/008.
Bear, J., Beljin, M. S. Ross, R. R., 1992. Fundamentals of Ground-Water Modeling. U.S. EPA Ground Water Issue, Robert S. Kerr Environmental Research Laboratory, EPA/540/S-92/005.
Boopathy, R., 2004. Anaerobic biodegradation of no. 2 diesel fuel in soil: a soil column study, Bioresource Technology 94, 143-151.
Butler, J. J., 1997. The Design, Performance, and Analysis of Slug Tests, CRC Publishing, pp. 262.
Butler, J. J., Healy, J. M., 1998. Relationship between pumping-test and slug-test parameters: scale effect or artifact? Ground Water 36(2) 305-313.
Butler, J. J., McElwee, C. D., Liu, W., 1996. Improving the Quality of Parameter Estimates Obtained from Slug Tests, Ground Water 34(3) 480-490.
Chapelle, F. H., Widdowson, M. A., Braunner, J. S., Mendez, E., Casey, C. C., 2003. Methodology for estimating times of remediation associated with monitored natural attenuation, U.S. Geological Survey Water-Resources Investigations Report 03-4057.
Coover, M. P. and R. C. Sims, 1987. The effect of temperature on polycyclic aromatic hydrocarbon persistence in an unacclimated agricultural soil, Hazardous Waste & Hazardous Materials (4), 69 – 82.
Davis, C., Cort, T., Dai, D., Illangasekare, T. H., Munakata-Marr, J., 2003. Effects of heterogeneity and experimental scale on the biodegradation of diesel, Biodegradation14, 373-384.
Hack, S. K., Bekins, B. A., 2000. Microbial populations in contaminant plumes, Hydrogeology Journal 8, 63-76.
Halford, K. J., Kuniansky, E. L., 2002. Documentation of Spreadsheets for the Analysis of Aquifer-Test and Slug-Test Data, U.S. Geological Survey Open-File Report 02-197.
Healy, R. W., 1990. Simulation of solute transport in variably saturated porous media with supplemental information on modifications to the U.S. Geological Survey's

8
Computer Program VS2D: U.S. Geological Survey Water-Resources Investigations Report 90-4025.
Holden, P. A., Fierer, N., 2005. Microbial processes in the vadose zone, Vadose Zone Journal 4, 1-21.
Hurst, C. J., Sims, J. C., Sims, J. L., Sorensen, D. L., Mclean, J. E., Huling. S., 1997. Soil gas tension and pentachlorophenol biodegradation, Journal of Environmental Engineering 123(4) 364-370.
Kasenow, M., 2006. Aquifer test data: analysis and evaluation, Water Resources Publications, Highlands Ranch, Colorado.
Kearney, P. C., Woolson, E. A., Ellington, C. P., 1972. Persistence and metabolism of chlorodioxins in soils, Environmental Science & Technology 6, 1017-1019.
Newell, C. J., McLeod, R. K., Gonzales, J., 1996. BIOSCREEN Natural Attenuation Decision Support System., U.S. Environmental Protection Agency, Center for Subsurface Modeling Support, EPA/600/R-96/087.
Newell, C. J., Rifai, H. S., Wilson, J. T., Connor, J. A., Aziz, J. A., Suarez, M. P., 2002. Calculation and Use of First-Order Rate Constants for Monitored Natural Attenuation Studies EPA/540/S-02/500.
Osborne, P. S. 1993. Suggested operating procedures for aquifer pumping tests. U.S. EPA Office of Research and Development EPA/540/S-93/503 p. 23.
Schumacher, B. A., 2002. Methods for the determination of total organic carbon (toc) in soils and sediments, United States Environmental Protection Agency Environmental Sciences Division, National Exposure Research Laboratory, NCEA-C-1282.
Sturman, P. J., Stewart, P. S., Cunningham, A. B., Bouwer, E. J., Wolfram, J. H., 1995. Engineering scale-up of in situ bioremediation processes: a review, Journal of Contaminant Hydrology 19, 171-203.
Suarez, M. P. and Rifai, H. S., 1999. Biodegradation rates for fuel hydrocarbons and chlorinated solvents in groundwater, Bioremediation Journal 3(4), 337-362.
United States Department of Agriculture, 2005. Soil Survey Technical Note 8, Use of Reaction (pH) in Soil Taxonomy, available at the following internet address: http://soils.usda.gov/technical/technotes/note8.html.
United States Environmental Protection Agency, 1988. Superfund Exposure Assessment Manual EPA/540/1-881001.
United States Environmental Protection Agency, 1994. Test Methods for Evaluating Solid Waste, Physical/Chemical Methods (SW-846), Third Edition, Revision 2, Washington, DC.
United States Environmental Protection Agency, 1996. Soil Screening Guidance: User’s Guide, EPA 9355.4-23.
United States Environmental Protection Agency, 1996. Soil Screening Guidance: Technical Background Document, EPA 540/R95/128.
United States Environmental Protection Agency, 1998. Technical Protocol for Evaluating Natural Attenuation of Chlorinated Solvents in Ground Water, EPA/600/R-98/128.
United States Environmental Protection Agency, 1999. Use of Monitored Natural Attenuation at Superfund, RCRA Corrective Action, and Underground Storage Tank Sites, Office of Solid Waste and Emergency Response, Directive 9200.4-17P.
United States Environmental Protection Agency, 2002. Supplemental Guidance For Developing Soil Screening Levels For Superfund Sites OSWER 9355.4-24.

9
Wiedemeier, T. H., Rifai, H. S., Newell, C. J., Wilson, J. T. 1999. Natural Attenuation of Fuel and Chlorinated Solvents in the Subsurface, John Wiley & Sons, Inc.
Widdowson, M. A., Mendez, E., Chapelle, F. H., Casey, C. C., 2005. Natural Attenuation Software User’s Manual Version 2.
Wiedemeier, T. H., Rifai, H. S., Newell, C. J., Wilson, J .T., 1999. Natural Attenuation of Fuel and Chlorinated Solvents in the Subsurface, John Wiley & Sons, Inc., p. 634.
Wisconsin Department of Natural Resources, 2003. Guidance on the Use of Leaching Tests for Unsaturated Contaminated Soils to Determine Groundwater Contamination Potential, publication RR-523-03 with Addendum.

Tables

Table 1Ionizing Organic Compounds
Chemical Name CAS Number Pentachlorophenol 87-86-5 2,3,4,5-Tetrachlorophenol 4901-51-3 2,3,4,6-Tetrachlorophenol 58-90-2 2,4,5-Trichlorophenol 95-95-4 2,4,6-Trichlorophenol 88-06-2 2,4-Dichlorophenol 120-83-2 2,4-Dimethylphenol 105-67-9 2,4-Dinitrophenol 51-28-5 2-Chlorophenol 95-57-8 2-Methylphenol 95-48-7 Phenol 108-95-2 Benzoic acid 65-85-0 N-Nitrosodi-n-propylamine 621-64-7 N-Nitrosodiphenylamine 86-30-6 p-Chloroaniline 106-47-8
Source: Soil Screening Guidance: Technical Background Document, EPA 540/R95/128
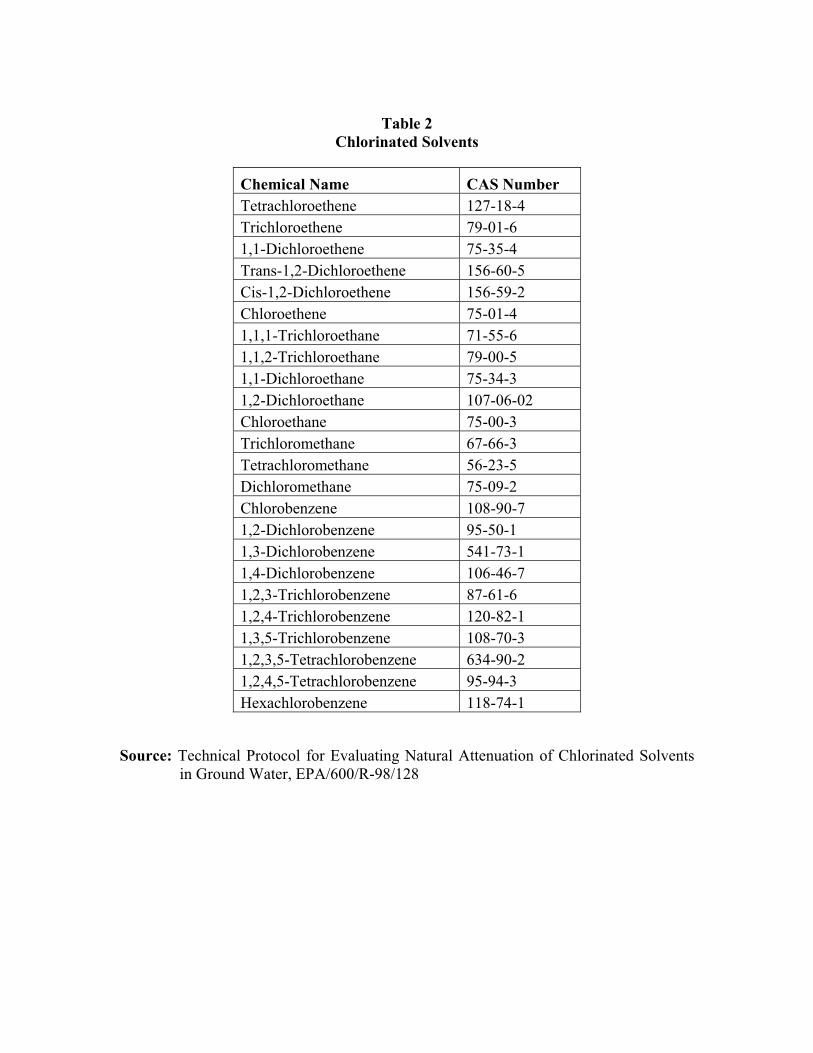
Table 2 Chlorinated Solvents
Chemical Name CAS Number Tetrachloroethene 127-18-4 Trichloroethene 79-01-6 1,1-Dichloroethene 75-35-4 Trans-1,2-Dichloroethene 156-60-5 Cis-1,2-Dichloroethene 156-59-2 Chloroethene 75-01-4 1,1,1-Trichloroethane 71-55-6 1,1,2-Trichloroethane 79-00-5 1,1-Dichloroethane 75-34-3 1,2-Dichloroethane 107-06-02 Chloroethane 75-00-3 Trichloromethane 67-66-3 Tetrachloromethane 56-23-5 Dichloromethane 75-09-2 Chlorobenzene 108-90-7 1,2-Dichlorobenzene 95-50-1 1,3-Dichlorobenzene 541-73-1 1,4-Dichlorobenzene 106-46-7 1,2,3-Trichlorobenzene 87-61-6 1,2,4-Trichlorobenzene 120-82-1 1,3,5-Trichlorobenzene 108-70-3 1,2,3,5-Tetrachlorobenzene 634-90-2 1,2,4,5-Tetrachlorobenzene 95-94-3 Hexachlorobenzene 118-74-1
Source: Technical Protocol for Evaluating Natural Attenuation of Chlorinated Solventsin Ground Water, EPA/600/R-98/128

Table 3 Field Data Recommended for Chemical Fate and Transport Modeling
Matrix Sample Locations Parameter Method/Reference Applicability Soil Surface soils
Subsurface soils Saturated zone soils
fraction of organic carbon (foc)
ASA Monograph #9, Part 2, Method 29-3.5.2 Organic CoCsMetals
Soil Surface soils Subsurface soils
Bulk density (dry weight basis)
ASTM D-2937-04 Organic CoCs Metals
Soil Surface soils Subsurface soils
Soil Moisture ASTM D2216-05 Organic CoCs Metals
Soil Surface soils Subsurface soils
Soil pH Prepare 1:1 soil mixture with distilled water and measure slurry pH using field pH meter
Organic CoCsMetals
Soil Surface soils Subsurface soils
Particle size analysis
ASTM D422-63 Organic CoCs Metals
Soil Surface soils Subsurface soils
SPLP USEPA 1312 for SPLP extraction, specify analyte list for measurement
MetalsIonizing organic CoCs
NAPL Monitoring wells NAPL composition USEPA 8260/8270 Organic CoCs
Groundwater Monitoring wells pH Field probe calibrated in the field according to manufacturer specifications
Organic CoCsMetals
Groundwater Monitoring wells Dissolved oxygen Dissolved oxygen meter calibrated in the field according to manufacturer specifications
Organic CoCs Metals
Groundwater Monitoring wells Temperature Field probe with direct reading meter Organic CoCs Metals

Table 3 (Continued)
Matrix Sample Locations Parameter Method/Reference Applicability Groundwater Monitoring wells ORP Field probe calibrated in the field
according to manufacturer specifications Organic CoCsMetals
Groundwater Monitoring wells Nitrate USEPA 353.2 Organic CoCs
Groundwater Monitoring wells Sulfate USEPA 300.0 Organic CoCs
Groundwater Monitoring wells Iron, Ferrous (Fe II) USEPA 200.7 Organic CoCs
Groundwater Monitoring wells Manganese USEPA 200.7/200.8/200.9 Organic CoCs
Groundwater Monitoring wells Methane GC/FID/Kampbell (SW 8015 Modified) Organic CoCs
Groundwater Monitoring wells Chloride USEPA 300.0 Chlorinated solvents Ionizing organic CoCs
Groundwater Monitoring wells Dissolved organic carbon
USEPA 415.2 USEPA 9060
MetalsChlorinated solventsIonizing organic CoCs
Notes: Organic CoCs include volatile and semi-volatile organic compounds. Ionizing organic CoCs and chlorinated solvents represent chemical classes within the group of organic CoCs.

Attachment 1
Methods for the Determination of Total Organic Carbon in Soils and Sediments

NCEA-C- 1282
EMASC-001
April 2002
METHODS FOR THE DETERMINATION OF TOTAL ORGANIC
CARBON (TOC) IN SOILS AND SEDIMENTS
Brian A. Schumacher, Ph.D.
United States Environmental Protection Agency
Environmental Sciences Division National
Exposure Research Laboratory
P.O. Box 93478 Las Vegas,
NV 89193-3478
Ecological Risk Assessment Support Center
Office of Research and Development
US. Environmental Protection Agency

ACKNOWLEDGMENTS
This document was prepared by Brian Schumacher of EPA•s National Exposure Research
Laboratory, Office of Research and Development (ORD) in response to a request received by ORD•s
Ecological Risk Assessment Support Center. Peer review of the document was conducted by Peter
Landrum of the National Oceanographic and Atmospheric Administration, and Robert Ozretich of
ORD•s National Health and Environmental Effects Research Laboratory. Bruce Duncan, EPA Region
10, and Sharon Thorns, EPA Region 4, provided helpful insights and comments during the preparation
of the document. Programmatic review of the document was conducted by the Trichairs of EPA•s
Ecological Risk Assessment Forum: Steve Wharton, EPA Region 8; Bethany Grohs, Office of Solid
Waste and Emergency Response, Office of Emergency and Remedial Response (OSWER/OERR); and
Brenda Jones, EPA Region 5. Finally, we would like to acknowledge the efforts of Mark Sprenger,
EPA/OSWER/OERR, in initiating the original request.
ii

1. INTRODUCTION
Organic matter in soils and sediments is widely distributed over the earth•s surface
occurring in almost all terrestrial and aquatic environments (Schnitzer, 1978). Soils and
sediments contain a large variety of organic materials ranging from simple sugars and
carbohydrates to the more complex proteins, fats, waxes, and organic acids. Important
characteristics of the organic matter include their ability to: form water-soluble and water
insoluble complexes with metal ions and hydrous oxides; interact with clay minerals and bind particles
together; sorb and desorb both naturally-occurring and anthropogenically-introduced organic
compounds; absorb and release plant nutrients; and hold water in the soil environment. As a result of
these characteristics, the determination of total organic carbon (a measure of one of the chemical
components of organic matter that is often used as an indicator of its presence in a soil or sediment) is
an essential part of any site characterization since its presence or absence can markedly influence how
chemicals will react in the soil or sediment. Soil and sediment total organic carbon (TOC)
determinations are typically requested with contaminant analyses as part of an ecological risk
assessment data package. TOC contents may be used qualitatively to assess the nature of the sampling location (e.g., was a depositional area) or may be used to normalize portions of the analytical chemistry
data set (e.g., equilibrium partitioning).
The purpose of this document, as defined by the Ecological Risk Assessment Forum, is to answer the question of “What is the most appropriate method for soil and/or sediment TOC analyses and what factors should be considered when selecting the method?”
2. SOURCES AND FORMS OF CARBON IN SOILS AND SEDIMENTS
In soils and sediments, there are three basic forms of carbon that may be present. They are: (1) elemental C, (2) inorganic C, and (3) organic C. The quality of organic matter in sediments is critical to the partitioning and bioavailability of sediment-associated contaminants. For example, Talley et al., 2002, demonstrated that although the majority of PAHs in a dredged sediment were found prefer-entially on coal-derived particles, the PAHs on the clay/silt sediment fraction were more mobile and available, and thus potentially of greater concern.
2.1. ELEMENTAL CARBON FORMS
Elemental carbon forms include charcoal, soot, graphite, and coal. The primary sources
for elemental carbon in soils and sediments are as incomplete combustion products of organic matter
(i.e., charcoal, graphite, and soot), from geologic sources (i.e., graphite and coal), or dispersion of the
these carbon forms during mining, processing, or combustion of these materials.
1
2.2. INORGANIC CARBON FORMS
Inorganic carbon forms are derived from geologic or soil parent material sources.
Inorganic carbon forms are present in soils and sediments typically as carbonates. The two most
common carbonate minerals found in soils and sediments are calcite (CaCO3) and dolomite
[CaMg(CO3)2] although other forms may be present (e.g., siderite, FeCO3) depending on where the
soils were formed or where the sediment source was located. It should be noted that calcite and to some
extent, dolomite, may also be present in soils and sediments due to agricultural input (i.e., liming
practices).
2.3. ORGANIC CARBON FORMS
Naturally-occurring organic carbon forms are derived from the decomposition of plants and animals. In soils and sediments, a wide variety of organic carbon forms are present and range from
freshly deposited litter (e.g., leaves, twigs, branches) to highly decomposed forms such as humus.
In addition to the naturally-occurring organic carbon sources are sources that are derived
as a result of contamination through anthropogenic activities. The spills or releases of con-
taminants into the environment increase the total carbon content present in the soil or
sediment. In general, though, the total carbon contribution from contaminants (typically
measured in the • g/kg to mg/kg concentration range) to the total organic carbon content
(measured in the % range) of the soil or sediment is relatively small to negligible unless a
fresh spill has occurred, pure product is present, or a hot spot is sampled.
In contrast to spilled contaminants, various sites may contain discrete organic
carbon bearing particles such as wood fibers from pulp mill wastes or leather scraps from
tannery wastes. At these locations, the total carbon content contribution of these wastes may
be a significant to dominant fraction of the TOC determined for the sample. It should be
noted that the methods for determining total organic carbon and total carbon contents
generally do not distinguish between the sources of the organic carbon forms. Nonetheless,
there arc two methods noted below that are capable of qualitatively identifying carbon
forms in the soil/sediment, and two methods that analyze specific fractions of the TOC.
3. SAMPLE COLLECTION AND HANDLING
Prior to any analyses for TOC, the soil or sediment sample must be collected and properly handled. During the collection and handling of the samples, losses of organic compounds may occur due to: microbial degradation, sample drying, oxidation, volatilization, and sample
processing biases (e.g., selective removal of carbon-bearing components). Soil and sediment
samples can be collected by numerous different tools but once collected, the samples are
2

typically stored at 4•C and have a holding time of up to 28 days. While microbial degradation is
greatly reduced at 4•C, it is not completely stopped leading to some potential loss of organic
materials. Prior to analysis, some methods may require or recommend drying (tither air drying or oven
drying) of the sample. Samples that contain volatile organic compounds and those that have been in
an anaerobic environment will undergo some loss of organic compounds when exposed to the
atmosphere during drying. Volatilization losses may also occur due to poor sealing of the sample
container. While these losses are generally small (probably <1% of the TOC content in a non-
contaminated soil or sediment), they are noted here to inform the reader of these potential sources for
carbon loss.
The collection and subsampling of a representative sample can be an area where organic matter is selectively removed from the soil or sediment and thus, the resultant TOC concentration will be affected. The main concern in obtaining the representative sample for analysis is what to do when there are large, discrete particles of organic matter present in the sample. For example, a sediment sample might contain part of a tree branch or a soil sample might contain wood chips. The larger particles may be removed by physically pulling the particles out of the sample or by sieving the sample. Typically, the larger particles are relatively inert chemically and thus do not contribute significantly to the soil or sediment•s capacity to sorb or release contaminants. Removal of the larger organic particles, therefore, may lead to a more accurate assessment of the sample•s TOC fraction that
does interact with the contaminants and biota in the soil or sediment. In cases where the discrete
particles of organic matter are believed to be either chemically or biologically active (i.e., they could
affect contaminant concentrations through degradation, sorption, or similar processes), they should
remain in the sample for analysis. Any decision to selectively remove particles from the sample should
be made in conjunction with the data quality objective process and should receive approval from all
parties involved in the program.
4. ANALYTICAL METHODS FOR TOC DETERMINATION
In soils and sediments:
Total Carbon = Inorganic Carbon + Organic Carbon (1)
TOC content can be measured directly or can be determined by difference if the total carbon content and inorganic carbon contents are measured. For soils and sediments where no inorganic carbon forms are present, Equation 1 becomes:
Total Carbon = Organic Carbon (2)
Typically this is the case so methods described as quantifying total or organic carbon should produce the same result. However, in geographic areas where the parent material/geology is limestone, dolomite, or another carbonate-bearing mineral, inorganic forms of carbon may be
3

present in the samples. In arid regions, soils and sediments may have greater concentrations of
carbon being derived from inorganic carbonates than from organic carbon sources.
The basic principle for the quantitation of total organic carbon relies on the destruction of
organic matter present in the soil or sediment although there are a few non-destructive techniques
identified in the literature that are currently under development. The destruction of the organic matter
can be performed chemically or via heat at elevated temperatures. All carbon forms in the sample are
converted to CO2 which is then measured directly or indirectly and converted to total organic carbon or
total carbon content, based on the presence of inorganic carbonates. These methods can either be
quantitative or semi-quantitative depending on the process used to destroy the organic matter and the
means used for detecting/quantifying the carbon present. In conjunction with the quantitative or semi-
quantitative methods, there are also methods that are qualitative and can accurately identify the type of
carbon compounds (e.g., sugars, carbohydrates, lignin, etc.) in the sample but are not far enough along
in their development to quantitate the carbon content of the sample.
There are several factors that one must consider when selecting a method for the determination of total organic carbon. These factors include the ease of use, health and safety concerns, cost, sample throughput, and comparability to standard reference methods. These factors are a concern for both the sample preparation and sample quantitation phases of TOC determinations. Each of these selection factors will be discussed in more detail in the following sections.
Sample preparation techniques can range from simply weighing the sample prior to analysis through wet chemistry digestion with strong acids. Nearly all of the sample preparation methods are
easy to perform following good laboratory practices. However, where sample preparation uses wet
chemistry techniques, these operations should be carried out in a well ventilated area and protective
clothing must be worn when handling concentrated acids. Another health and safety concern is that
when preparing and using some of the indicator solutions in the wet chemistry techniques, these
indicators may be carcinogenic (e.g., diphenylamine indicator) and should be handled with extreme
caution. Costs associated with sample preparation are generally low and consist mainly of replacing
consumable chemicals. Sample preparation throughput for typical wet chemistry techniques is around
25 minutes per sample. The use of a multiple extraction apparatus can increase the throughput by concurrently extracting multiple samples although the extraction time will remain about 25 minutes. Information on comparability of sample preparation techniques to standard reference methods will be more thoroughly presented in latter sections when each sample preparation technique is discussed and in the section on comparative studies.
Quantitation methods are as varied as the sample preparation methods. Some quantitation methods are based on titrations which rely on color changes of an indicator solution while others use gravimetric, volumetric, spectrophotometric, or chromatographic methods for carbon quantitation. As the detection and quantitation systems get more complex, the skill (and
4

knowledge) level of the operator increases. Typically, titrimetric, gravimetric, and volumetric
techniques are relatively easy to perform implementing good laboratory practices. Spectrophotometric
and chromatographic techniques require more skill in operating the instrument, interpreting the results,
and trouble shooting should system problems arise. Health and safety concerns are generally negligible
for the quantitation method except where the sample is combusted at high temperatures. These samples
must be handled with care to avoid severe burns. Another important consideration is whether the
quantitation method is manual or automated. It has been shown that the automated methods yield more
precise results than methods quantitated manually (Soon and Abboud, 1991). However, automated
methods tend to be more expensive due to the initial purchase of the instrument which can range up to
$20,000 or more. Manual methods can he performed with generally available laboratory glassware and
equipment. The rate of sample throughput during carbon quantitation can range from a matter of
seconds for gravimetric measurements to minutes for the other techniques. Sample throughput can be
greatly enhanced using automated systems, especially where a multi-sample autoloader is available
which allows the analyst to load a batch of samples, start the analyses, and then perform other sample
preparations while the first batch of samples is being analyzed. Information on analytical comparability
to standard reference methods will be more thoroughly presented in latter sections where each sample
quantitation technique is discussed and in the section on comparative studies.
4.2. QUALITATIVE METHODS FOR THE DETERMINATION OF ORGANIC
CARBON
There are two methods in the literature for the structural characterization of organic
carbon forms in soils and sediments. One of these qualitative methods is based on nuclear magnetic
resonance (NMR) spectroscopy and the other on diffuse reflectance infrared Fourier transform (DRIFT)
spectroscopy. A brief synopsis of these qualitative techniques is presented here because research is
ongoing to improve the techniques• qualitative identification capabilities and to advance the science into
the area of quantitative determinations of the carbon forms in soils and sediments.
NMR is a valuable tool for the characterization of soil organic matter and humification processes in soils (Kogel-Knaber, 1997). NMR spectroscopy works on the principle of measuring the
characteristic energy absorbed and re-emitted or dispersed by atomic nuclei that are placed in a static
magnetic field and subjected to an oscillatory magnetic field of known radio-frequency. One specialized
form of this technique is cross-polarization magic angle spinning (CPMAS) 13C NMR (Rumpel et. al,
1998). CPMAS 13C NMR is capable of distinguishing chemical structures that are characteristic of
recently formed organic matter as well as those organic carbon forms derived from the soil•s parent
material/geology, elemental carbon forms derived from ash, and even, carbonaceous particles from
airborne lignite-derived contamination in soils. The advantage of NMR techniques is that no extraction
of organic matter is needed. However, the NMR methods are expensive and time-consuming (Rumpel
et al., 2001).
5

DRIFT spectroscopy, when used in conjunction with multivariate data analysis (i.e., partial least squares), provides a rapid and inexpensive means of differentiating carbon forms in soils and sediments (Rumpel et al., 2001). Carbon compounds are identified by assignment of the main infrared absorption bands to the bonds being stretched or deformed at that particular frequency. Both inorganic and organic forms of organic compounds may be identified using this technique (Nguyen et al., 1991). In initial experiments, Rumpel et al., (2001) were able to identify and quantify the lignite contribution to the TOC content of soil samples; however, TOC determination was performed by a dry combustion technique (to be discussed).
4.3. SEMI-QUANTITATIVE METHODS FOR THE DETERMINATION OF ORGANIC MATTER
There are two primary methods for the semi-quantitative estimation of organic matter in soils and sediments. Organic matter content can be used as a rough estimate of the total organic
carbon content. Semi-quantitative methods are based upon the indiscriminant removal of all
organic matter followed by gravimetric determination of sample weight loss. The two primary semi-
quantitative methods are: (1) loss-on-ignition and (2) hydrogen peroxide digestion.
The loss-on-ignition (LOI) method for the determination of organic matter involves the heated destruction of all organic matter in the soil or sediment. A known weight of sample is
placed in a ceramic crucible (or similar vessel) which is then heated to between 3500 and 440•C
overnight (Blume et al., 1990; Nelson and Sommers, 1996; ASTM, 2000). The sample is then cooled in
a desiccator and weighed. Organic matter content is calculated as the difference between the initial and
final sample weights divided by the initial sample weight times 100%. All weights should be corrected
for moisture/water content prior to organic matter content calculation.
LOI method temperatures should be maintained below 440•C to avoid the destruction of
any inorganic carbonates that may be present in the sample. One concern with this technique is
that some clay minerals will lose structural water (i.e., water that is part of their matrix) or hydroxyl
groups at the temperatures used to combust the samples. The structural water loss will increase the total
sample weight loss leading to an overestimation in organic matter content. One possible means to
avoid this concern is through the pre-treatment of the sample via removal of the mineral matter using
HCl and HF acids (Rather, 1917). However, the use of HCI may dissolve part of the organic matter
leading to an underestimation of the organic matter content and the potential use of a correction factor.
Interestingly, ASTM method D 2974 allows for ashing the sample at 750•C for peats and other organic
soils, such as organic clays, silts, and mucks (ASTM, 2000) presumably based on the assumption that
no carbonates and little to no mineral matter are present in the sample that could influence the resultant organic matter content.
The hydrogen peroxide (H202) digestion method destroys the organic matter in the sample through oxidation. The hydrogen peroxide digestion involves the addition of concentrated hydrogen peroxide (30% or 50%) to a known weight of soil or sediment. H202 is
6

continually added to the sample until sample frothing ceases. The samples may be heated to
90•C during peroxide addition to increase the speed and completeness of the peroxide digestion. Care
must be taken to avoid excessive frothing and sample loss over the lip of the digestion container. Once
the digestion process is completed, the sample is dried at 1050C, cooled in a desiccator, and weighed.
Organic matter is determined gravimetrically and calculated as the difference between the initial and
final sample weights divided by the initial sample weight times 100%. All weights should be corrected
for moisture/water content prior to organic matter content calculation.
The hydrogen peroxide digestion method has several limitations that markedly reduce its
effectiveness to quantify organic matter and TOC and, a.. such, the method is semi-quantitative at best.
The major limitation of the peroxide digestion technique is that the oxidation of the organic
matter is incomplete and the extent of oxidation varies markedly from one soil or sediment to another
(Robinson, 1927). Another potential source for error with this method is the loss of volatile organic
compounds if samples are air- or oven-dried prior to digestion. It should be noted that this method is a
common pre-treatment during the determination of particle-size distributions in soils and sediments
since organic matter is known to bind particles together.
Since these two methods determine the organic matter content in the soil or sediment, it is necessary to convert the organic matter content to total organic carbon content. Traditionally, for
soils, a conversion factor of 1.724 has been used to convert organic matter to organic carbon based on
the assumption that organic matter contains 58% organic C (i.e., g organic matter/l .724 = g organic
C)(Nelson and Sommers, 1996). However, there is no universal conversion factor as the factor varies
from soil to soil, from soil horizon to soil horizon within the same soil, and will vary depending upon
the type of organic matter present in the sample. Conversion factors range from 1.724 to as high as 2.5
(Nelson and Sommers, 1996; Soil Survey Laboratory Methods Manual, 1992). Broadbent (1953)
recommended the use of 1.9 and 2.5 to convert organic matter to total organic carbon for surface and
subsurface soils, respectively.
4.4. QUANTITATIVE TECHNIQUES FOR THE DETERMINATION OF TOTAL
ORGANIC CARBON
Both destructive and non-destructive techniques are available for the determination of TOC and total carbon in soils and sediments. The destructive techniques are by far the most common techniques in use today and generally involve some form of sample preparation or pretreatment followed by sample extraction and quantitation. The three basic principles of the destructive techniques
are: (1) wet oxidation followed by titration with ferrous ammonium sulfate or photometric
determination of Cr3+(2) wet oxidation followed by the collection and measurement of evolved CO2,
and (3) dry combustion at high temperatures in a furnace with the collection and detection of evolved
CO2 (Tiessen and Moir, 1993). An innovative nondestructive technique using non-elastic neutron
scattering is also being developed for TOC determination (Wielopolski et al., 2000).
7

4.4.1. Sample Preparation and Pre-Treatment. Sample preparation for soil or sediment
samples for the determination of TOC generally involves the removal of large particles (generally those
particles greater than 2-mm in diameter) and sample homogenization. It should be noted that the
removal of the large particles changes the particle-size distribution of the sample and thus, may affect
the data quality objectives of the program. Large inorganic particles, such as gravel, pebbles and rocks,
are generally removed with little concern due to their lack of contribution to TOC and their chemical
inertness. The percentage of large inorganic particles can be determined visually or gravimetrically and
is recorded for completeness of sample characterization. Removal of large organic particles, such as
twigs, roots, stems, wood chips, branches, etc., will affect sample TOC concentrations. In some cases,
their removal is warranted due to their relative chemical inertness (as compared to the finer. more
highly decomposed forms of organic matter) or their lack of representativeness of the sample (e.g.,
anthropogenic additions versus naturally-occurring organic matter). Selective removal of the large
organic particles should be based on the data quality objectives of the program. The presence of the
large organic particles should be recorded for completeness of sample characterization. Samples should
be stored at 4•C when not in use.
Sample pre-treatment generally involve the removal of interferents or water (in the case
of the dry combustion technique). The primary interferent in the determination of TOC is the
presence of inorganic carbonates in the soil or sediment. If the samples are left untreated, depending
upon the method used, the carbonate minerals (e.g., calcite and dolomite) will be destroyed along with
the organic matter and in the process additional CO2 will be evolved and measured. The additional CO2
will lead to a falsely elevated TOC content. None of the methods available for the determination of
TOC are capable of distinguishing between inorganic or organic derived CO2.
A simple test can be performed to determine if carbonates are present. The test involves adding a few drops of HCl (1N to 4N HC1 are often cited) and observing if the sample
effervesces. Careful observations need to be made in cases where dolomite is present since it
does not rapidly effervesce like calcite. Alternatively, the pH of the soil or sediment may be determined
and if the pH is 7.8 to 8.2, then calcium carbonates are indicated in the sample (McLean, 1982).
However, as a safety factor to account for possible isolated pockets of carbonates, a pH of 7.4 has been
used as the pH above which the sample is treated to remove carbonates.
If carbonates are present, the most common method for their removal is the addition of an acid or a combination of acids. Two acids are commonly cited for carbonate removal, namely, HCl and H2SO4. HCl (1N) is added to the sample in small increments until effervescence stops. Two concerns with the use of HCl (to be discussed) are that the HCl will destroy some organic carbon compounds leading to a carbon loss prior to sample quantitation and Cl- is an interferents for the wet oxidation techniques. Alternatively, a combination of H2SO4 and FeSO4 may be used
(with sample drying if the dichromate method is used, see interferents below). Typically, 3 mL
of 2N H2SO4,-S%FeSO, is added to the sample to remove inorganic carbonates (Nelson and
8

Sommers, 1996). The FeSO4 is added to minimize oxidation and decarboxylation of organic matter by the H2SO4 or by MnO2 that may be present in the soil or sediment (Allison, 1960). If the soils or sediments are suspected of containing large amounts of carbonates (>10% calcium carbonate equivalent), then the H2SO4 strength should be increased to 3N or 4N.
Removal of carbonates for samples undergoing dry combustion quantitation is more
problematic than for those undergoing wet chemistry techniques (Nelson and Sommers, 1996). HCl
may be used in a manner similar to that used for the wet chemistry techniques but the samples must be
at least air-dried prior to analysis and there is the concern about the loss of organic matter due to its
decomposition by the HCI. Alternatively, Bremner (1949) proposed using a mild H2SO3 solution to
remove the carbonates but Allison (1965) found it difficult to tell whether the treatment was complete
especially if dolomite was present in the sample. It should be noted that the removal of carbonates for
samples undergoing dry combustion is not necessary if TOC is going to be determined by difference
(see the Analytical Methods for TOC Determination section).
Other interferents for the wet chemistry techniques include Fe 2+ and Cr which lead to
positive errors (i.e., overestimation) in TOC determinations, and MnO2 which leads to a negative error
(i.e., underestimation) of TOC contents (Schumacher et al., 1995). In a routine sample, both Fe 2+ and
organic matter are oxidized in the dichromate digestion solution (to be discussed) leading to a positive
sample bias in TOC content. Fe 2+ may be removed from the sample by oxidation (i.e., air-drying) at the
risk of loss of any volatile organic compounds present in the sample. Excess Cl- in a sample interferes
through the formation of chromyl chloride (CrO2Cl2). The consumption of the dichromate ions leads to
a positive bias in TOC content. Excessive Cl- may be removed by leaching the sample or through
precipitation, as AgCl, by adding AgSO2 to the H2S04 used during the digestion process. In contrast,
MnO2 in the sample will actively compete with the dichromate for any oxidizable carbon and thus, lead
to negative bias during subsequent quantitation. If large quantities of MnO2 are present, pretreatment of
the sample with FeSO4 will remove this interference (Walkley, 1947; Jackson, 1958).
The removal of water from the sample is essential during the determination of TOC by the dry
combustion methods. While water passing through the system is removed from the gas flow by a
sorbent, this sorbent is generally placed in the system to handle the removal of water created during the
combustion process. The free water associated with the sample prior to combustion can be removed by
the system sorbent but this will result in the more frequent replacement of the sorbent leading to
instrument downtime (for sorbent replacement and gas flow line purging), excessive sorbent chemical
loss, and unnecessary expense. Excessive water can be simply removed by air drying or oven-drying
the sample at 105•C overnight. One concern about drying the samples prior to analysis is the loss of
volatile organic compounds. For the wet oxidation methods, water removal is not essential but the
analyst will have to determine the moisture content on a separate subsample to accurately correct the
resultant data to an oven-dried basis.
9

4.4.2. Wet Chemistry Techniques for the Determination of Total Organic Carbon.
Wet chemistry techniques can be divided into two phases, namely, sample extraction and sample quantitation. The extraction technique employed is essentially the same for all methods in the literature with variations existing only in the strength and combination of reagents used during extraction. Quantitation techniques associated with the wet chemistry determination of TOC either rely on titration (manual or automated), calorimetric, gravimetric, or manometric techniques.
4.4.2.1. Sample Extraction - The standard wet chemistry technique for the sample extraction involves the rapid dichromate oxidation of organic matter. Perhaps the best known of the rapid dichromate oxidation methods is the Walkley-Black procedure which has been the
“reference” method for comparison to other methods in numerous studies. In this procedure, potassium dichromate (K2Cr2O2) and concentrated H2SO4 are added to between 0.5 g and 1 .O g (although the range may be up to 1 Og depending on organic carbon content) of soil or sediment. The solution is swirled and allowed to cool (note: the sample must be cooled as a result of the exothermic reaction
when the potassium dichromate and sulfuric acids are mixed) prior to adding water to halt the reaction.
The addition of H3PO4 to the digestive mix after the sample has cooled has been used to help eliminate interferences from the ferric (Fe 3+) iron that may be present in the sample although in most cases, this step is not necessary (Tiessen and Moir, 1993).
The chemistry of this extraction procedure is as follows:
2Cr2O7 2- +3 C0 + 16H+ = 4Cr 3+ + 3CO2 + 8H20. (3)
It should be noted that the concentrations of the reactants and volumes of solutions are not presented in this text due to the numerous variants available in the published literature, all of
which are based upon the Walkely-Black procedure.
The Walkley-Black procedure is widely used because it is simple, rapid, and has minimal
equipment needs (Nelson and Sommers, 1996). However, this procedure has been shown to lead to the
incomplete oxidation of organic C and is particularly poor for digesting elemental C forms. Studies
have shown that the recovery of organic C using the Walkley-Black procedure range from 60 to 86%
with a mean recovery being 76% (Walkley and Black, 1934). As a result of the incomplete oxidation
and in the absence of a site-specific correction factor, a correction factor of 1.33 is commonly applied to
the results to adjust the organic C recovery.
To overcome the concern of incomplete digestion of the organic matter, the Walkley-
Black procedure was modified to include extensive heating of the sample during sample
digestion (Mebius, 1960). In this variation of the method, the sample and extraction solutions are
gently boiled at 150•C for 30 minutes, allowed to cool, and then water is added to halt the
reaction. The addition of heat to the system leads to a complete digestion of the organic C in
the sample; therefore, no correction factor is needed. The temperature of this method must be
10

strictly controlled because the acid dichromate solution decomposes at temperatures above 150•C
(Charles and Simmons, 1986).
4.4.2.2. Sample Quantitation Upon completion of the sample extraction phase, the
quantity of organic carbon present in the soil or sediment can be determined through a variety of
different techniques. These techniques include: manual titration, automated titration using
potentiometric determination, calorimetry, gravimetric determination, or volumetric/manometric
measurement. Each of these techniques will be briefly discussed.
Upon examination of Equation 3, the three measurable products of the acid dichromate 2-digestion process are the excess/unused Cr2O7 Cr3+ and CO2- Both the Cr2O7
2- and Cr3+ will
remain in solution and can be measured titrimetrically or calorimetrically while the evolved CO2,
in its gaseous state, can be measured gravimetrically or manometrically.
-
To perform manual titrimetric quantitation, an indicator solution is added to the digestate.
The most common indicators used are ortho-phenanthroline ferrous complex (commercially available as
“Ferroin”), barium diphenylamine sulfonate, and N-phenylanlhranilic acid (Nelson and Sommers,
1996). The excess Cr2O72- is titrated with ferrous ammonium sulfate [Fe(NH4)2(SO4)2*6H2O] or ferrous
sulfate (FeSO4 until color change occurs in the sample. Color changes associated with these indicators
are: (1) green to reddish brown for the orthophenanthroline ferrous complex, (2) purple/blue to green
for the barium diphenylamine sulfonate, and (3) dark violet-green to light green for the N-phenylan-
thranilic acid. The primary concern with the manual titration technique is the low visibility or subtlety
of color changes during titration. Color changes may also be obscured by naturally-occurring high
chroma soils.
The use of an automated titrator eliminates the need for indicators to be added to the
digestate. Similar to manual titrimetric quantitation, excess Cr2O72- is titrated with ferrous ammonium
sulfate or ferrous sulfate. However, the endpoint is not a color change but is determined potentio-
metrically. In this technique, a simple calomel electrode or platinum electrode is placed in the digestate,
and the titer is added until a fixed electrical potential endpoint is reached. The endpoint is dependent
upon the type of electrode used. For example, the National Soil Survey Center (Soil Survey Laboratory
Methods Manual, 1992) uses a platinum electrode and sets the end point at 600 mV. Once the endpoint
is reached, the titration is stopped and the TOC content calculated. The automated titration technique
has the distinct advantage over manual titration since the endpoint is not dependent upon operator
optical determination of exactly when the color changed. The only disadvantage of the automated
technique is the necessity to purchase (i.e., cost) an automated titrator and suitable electrodes.
Colorimetric quantitation of TOC is performed through the measurement of the color change that results from the presence of Cr 3+ in solution. After sample digestion, the digestate is centrifuged or filtered to remove any suspended particles and then placed in a calorimeter set to
measure the light absorbance at a wavelength of 601) •M. Quantitation is performed by
comparison of the results against a standard curve. The calorimetric technique has the same
11

advantages (i.e., a measurable fixed endpoint with no human interpretation) and disadvantages
(i.e., primarily initial cost) as the automated titration technique.
In contrast to the three prior techniques, determination of TOC content can also be determined by
measuring the evolved CO2. The evolved CO2 can either be absorbed on Ascarite (or similar adsorbent)
or collected in a Van Slyke-Neil apparatus (Nelson and Sommers, 1996). Absorption of the evolved
CO2 by Ascarite causes a weight change in a tared weighing bulb. Once the digestion is completed, the
weighing bulb is reweighed and the weight difference is converted to TOC content. This gravimetric
technique has good accuracy, can be performed with readily available equipment. However, this
method requires careful analytical techniques in which a CO2 free gas flow system is maintained
throughout the digestion and CO, collection process.
The use of a Van Slyke-Neil apparatus involves the collection of the CO, in its gaseous
phase and measuring the change in pressure with a gauge (i.e., a manometric technique). While
this technique is relatively simple to conduct and doesn•t have the concern of maintaining a CO2
free atmosphere as in the gravimetric technique, great skill is needed to operate the equipment and the
initial expense of purchasing the apparatus is somewhat high (Nelson and Sommers, 1996).
Additionally, the Van Slyke-Neil apparatus is easily damaged.
4.4.3. Dry Chemistry Techniques for the Determination of Total Organic Carbon. Dry
chemistry techniques can be divided into two phases, namely, sample combustion and sample
quantitation. The sample combustion technique consists of burning the sample in an oven at
elevated temperatures. The end product of the combustion is CO2 which is quantitated by titrimetric,
gravimetric, manometric, spectrophotometric, or gas chromatographic techniques. Dry chemistry
techniques are typically cited as total carbon techniques but in the absence or removal of inorganic
carbonates, these techniques can be used to quantify TOC.
4.4.3.1. Sample Combustion Soil or sediment samples are combusted at elevated
temperatures in a resistance or an induction furnace in the presence of a stream of pure oxygen.
Combustion temperatures generally exceed 1000•C and are dependent on oven type. Resistance ovens
heat the sample to between 900 and 1000•C while induction ovens reach temperatures of between 1300
and 1500•C (Nelson and Sommers, 1996). It should be noted that combusting the sample at 13500 C or
higher will allow for the complete destruction of any inorganic carbonates present in the sample.
Therefore, it is essential to ensure that all carbonates have been removed from the sample prior to TOC
determination.
The typical sample combustion train consists of a pure oxygen gas source; the oven;
various traps and scrubbers to remove dust, particulate matter, halogen gases (especially important in
the case of soils or sediments with high salt contents and in particular Cl contents), and water vapor;
and a catalyst furnace to convert any CO to CO2 prior to collection and detection of the evolved CO2-.
12

Typical analyses consist of placing several hundred milligrams of soil or sediment in an
inert boat (e.g., platinum, porcelain, or ceramic). To ensure complete combustion of the sample, a pure
oxygen stream is used as well as various catalysts or accelerators. Typical catalysts and accelerants
include: vanadium pentoxide, Cu, CuO, and aluminum oxide (LECO, 1996). Through the use of the
accelerants, actual temperatures in the sample may temporarily reach up to 16500 C or greater as the
accelerants melt and fuse with the sample. The accelerators/catalysts are sprinkled on top or mixed into
the sample and the sample is then pushed into the oven. After several minutes of combustion in the pure
oxygen stream, a carrier gas (typically He) is turned on, the combustion chamber is swept clean, and the
evolved gases are carried through the traps and scrubbers to the detector.
The two main advantages of using a dry combustion method are that the elevated temperatures
ensure combustion of all carbon forms present in the sample and that sample preparation is minimal.
The two main disadvantages of using a dry combustion method are that a leak-free gas flow path must
be maintained, else a false positive value will be obtained due to cross-contamination with atmospheric
CO2, and the initial expense of purchasing the equipment may be high, especially if an automated
system is used (Nelson and Sommers, 1996).
4.4.3.2. Sample Detection and Quantitation - Upon completion of the sample combustion phase, the
quantity of organic carbon present in the soil or sediment can be determined through a variety of
different techniques. These techniques include titration, gravimetric, manometric, spectrophotometric,
or gas chromatographic techniques. The titration, gravimetric, and manometric techniques for
quantifying TOC contents are the same as described previously for the wet chemistry techniques and
thus, won•t be discussed here. The remaining two detection techniques will be briefly discussed.
For each of the remaining two detector systems, both a constant flow of the evolved gases and carrier gas are passed through the detection cell. Analyses are stopped after a known volume
of gas has been collected or after a given amount of time has passed and the TOC content
determined. The % C should be reported on an oven-dry basis so adjustments for moisture
content will be necessary if the samples are only air-dried prior to analysis.
Spectrophotometric detection techniques quantify the evolved CO2 using either thermal conductivity or infrared detectors. Thermal conductivity detectors measure the difference between the thermal conductivity of the gas evolved from the sample and a reference gas (usually the pure carrier
gas) and convert the temperature difference to % C in the sample. CO2 has a thermal conductivity of
(3.3 calories/cm*sec*0C) x 105 (LECO, 1996).
Infrared detectors rely on the absorption of infrared energy by CO2 at a very precise wavelength
(LECO, 1996). As CO2 enters the infrared detector cell, the measured energy level decreases and the
detector system converts the cumulative energy decrease to %C. CO2 absorbs infrared radiation at a
wavelength of 2.6 microns and 4 microns.
13

TOC may also be quantified using a gas chromatograph (GC) attached to either a thermal
conductivity detector or a flame ionization detector (Nelson and Sommers, 1996). For use of the flame
ionization detector (FID), the CO2 must first be converted to CH4 by passing the evolved gases
through a heated alumina coated with nickel in a H, enriched atmosphere. These methods are
expensive and make poor use of a GC system; however, the FID system can be purchased attached to
individual automated carbon analyzers.
4.4.4. A Non-Destructive Technique for TOC Determination in Soils. An innovative non destructive technique for TOC determination in soils is currently under development by Wielopolski et al. (2000). This technique involves inelastic neutron scattering and bears mentioning since it is non-destructive and can be performed in situ. This technique is based on the detection of 4.44 MeV gamma rays that result from the bombardment of carbon atoms with 14 MeV neutrons and the subsequent emission of gamma rays from the excited carbon. The gamma rays are then detected, quantified, and converted to % C content. Current drawbacks to the system are that it is in the preliminary stages of development and it requires a radioactive neutron generator be used and taken to the field for analysis.
4.4.5. Fractional Analysis of Carbon Forms in Soils and Sediments. Determining only TOC
may not be sufficient for explaining contaminant bioavailability. The quality of the organic
matter in sediments is critical to the partitioning and bioavailability of sediment-associated
contaminants. Although it is beyond the scope of this report, it should be noted that there are
methods available that look at specific fractions of the TOC in soils and sediments. Two examples of
fractional analytical methods include SW-846 Method 9071B (U.S. EPA, 1992) and the soot
quantification method of Gustafsson et al. (1997). SW-846 Method 9071B entitled, “n Hexane
Extractable Material for Sludge, Sediment, and Solid Material,” is used to quantify the oil and grease
fraction in soils and sediments. The Gustafsson et al. (1997) method was developed to quantify
sedimentary soot since soot may significantly affect the environmental speciation of polycyclic
aromatic hydrocarbons. Interestingly, the Gustafsson et al. method follows the same basic principles
of inorganic carbon removal, organic matter removal, and dry combustion for carbon quantification as
described in this report.
4.5. PROGRAMMATIC REQUIREMENTS FOR TOC METHODOLOGIES
Numerous programs require the analysis and determination of total carbon and total
organic carbon as standard characterization parameters for soils and sediments. Additionally, there
are published methods for general use and although they are perhaps, not program specific, they are
included in this text. While the programs and methods presented in Table 1 cover a majority of the
large-scale EPA programs, this list does not purport to be complete and is presented here for
informational purposes.
Table 1 presents a listing of the methods available for the determination of total carbon
(TC) and TOC listing the source (or reference) for the method, the basic principle of the method,
and a brief listing of any aspects that are unique to the method/program. Please note that if the
14
principle of operation seems vague, it is because the reference method leaves the choice of
specifics up to the user. Additionally, if there are multiple options allowed under the same
reference method, all methods will be presented in the table.
4.6. COMPARATIVE STUDIES
Numerous comparison studies have been performed examining the efficiency of TOC methods (Nelson and Sommers, 1996). In nearly all of these studies, the standard method to be compared against was the Walkley-Black dichromate extraction with titrimetric quantitation method. In general, nearly all of the newer methods having comparable or greater TOC recoveries and greater precision than the Walkley-Black method. For example, Bremner and Jenkinson (1960) showed that the TOC contents determined by the Tinsley method (heated dichromate/titration) were approximately 30% greater that those values determined by the Walkley-Black method. Further, when compared to “known” TOC concentrations (as determined by an independent wet combustion method), the corrected Walkley-Black TOC concentrations ranged from 73- 119% of the known TOC concen-tration. In contrast, the Tinsley method (heated dichromate/titration) yielded recoveries of 88 to 106% for the same soils. These results show the greater precision obtained using the Tinsley method than
using the Walkley Black method.
In a large scale comparison study by Soon and Abboud (1991), three dichromate extraction procedures with titrimetric quantitation, one dichromate extraction method with spectrophotometric quantitation, LOI, and a dry combustion procedure were compared. The three dichromate/titration
methods used were the Walkley-Black, the modified Tinsley method (a heated dichromate extraction
with H3PO4 as part of the extraction solution), and the modified Method (a heated dichromate
extraction method). The spectrophotometric method involved a heated dichromate extraction with
quantitation by calorimetric detection of Cr 3+ at a wavelength of 600 •M. The LOI method heated the
sample to 375•C overnight and measured gravimetric weight loss while the combustion method heated
the sample at 13710C and used infrared detection of the CO2 generated. The percent coefficient of
variation among replicate samples ranged from 2.7% to 5.6%. The most precise method was the
spectrophotometric method. The LOI method had the worst precision among replicate samples and
was generally deemed unreliable for soils with low TOC contents. The Walkley-Black method with a
correction factor of 1.40, instead of the traditional 1.33 value, yielded comparable TOC contents
(correlation coefficients = 0.979 to 0.996) to the other methods tested. Relative to the combustion
method, the modified Tinsley method and the modified Mebius method slightly underestimated the
soil organic carbon content (slopes ± standard errors were 1.05 ± 0.02 and 1.04 ± 0.02, respectively) .
The spectrophotometric method yielded the same recoveries as the combustion method within
experimental error (slope ± standard error = 0.98 ± 0.02). The automated quantitation methods were
found to be more precise than those methods in which manual titration was necessary.
15


5. SUMMARY AND RECOMMENDATION
The determination of total organic carbon is an essential part of any site characterization
or ecological assessment since its presence or absence can markedly influence how chemicals will
react in the soil or sediment. Numerous methods are available for the determination of TOC in soils
and sediments. Carbon can be present in elemental, inorganic, or organic forms. Carbon is usually
derived from weathering of the parent material/geology, the decomposition of plant and animal
matter, or by addition through anthropogenic activities. There are numerous methods and variations of
the methods for the identification and quantitation of TOC. These methods may be qualitative, semi-
quantitative, or quantitative depending upon the technique used. Quantitative methods generally
involve some form of sample preparation to remove water and/or inorganic carbonates, where present.
After sample preparation is complete, either wet chemistry digestion or combustion techniques are
used to convert the organic matter in the sample to CO2 which is then quantified. Quantitation
techniques range from simple gravimetric determinations through volumetric and manometric
measurements through the more complex spectrophotometric and chromatographic methods.
For the purposes of determining TOC, the author would recommend the use of a high
temperature, automated, dry combustion technique after pre-testing and pre-treatment to remove
inorganic carbonates, when present. Pre-testing should be performed using a 1 to 4 N HCl drop
test followed by observation for effervescence to determine if carbonates are present. Alternately, the
pH of the sample may be determined and if the pH is below 7.4, then the sample should be free of all
carbonates. If carbonates are present, they should be removed using a 2N H2SO4 - 5% FeSO4 solution
followed by sample drying prior to sample analysis. Combustion of the sample should be at
temperatures • 1350•C and be performed in a pure oxygen atmosphere to ensure complete
combustion of all carbon forms in the sample. Detection of the evolved CO2 should be accomplished
using either IR or thermal conductivity detectors (i.e., spectrometric determination). Both detector
systems produce comparable and reproducible results. The availability/choice of detectors is usually
based upon which instrument is purchased.
The advantages of the automated dry combustion technique are that: (1) minimal sample
preparation is required other than drying the sample, (2) destruction of all carbon form is ensured
at temperatures in excess of 1350•C, (3) actual sample analysis time is short, usually in the range
of 5-7 minutes per sample, (4) the automated systems have been shown to be more precise than
manually operated determinations, (5) the high temperature, dry combustion technique has been
shown to produce comparable TOC concentrations when compared to the standard wet chemistry
technique (i.e., the Walkley-Black technique), (6) the automated systems are capable of
determining total H, S, and N, simultaneously with the TOC; thereby, providing additional
information about the characteristics of the organic matter from a single sample analysis [Note:
multiple instrument configurations are available on the commercial market with the most common
configurations being the CN, CNS and CHN analyzers], and (7) the newer automated
systems can be purchased with a sample autoloader allowing the analyst to load batches (up to 49
19

or more) of samples, standards, and blanks for analysis freeing the analyst to perform other work
while the samples are being analyzed.
The disadvantages of the high temperature, automated, dry combustion technique
recommended are: (1) initial expense to purchase the unit is high but as sample numbers
increase the overall cost per sample markedly decreases, (2) a leak-ti-ee gas flow system must
be maintained or false positive TOC contents will be reported, (3) pure oxygen and carrier
gases must be purchased for the analysis, and (4) drying of the sample or pre-treatment to
remove carbonates may result in the loss of volatile organic compounds or the decomposition
and loss of other organic compounds present in the sample.
6. REFERENCES
Allison, L.E. 1960. Wet-combustion apparatus and procedure for organic and inorganic carbon in soil. Soil Sci. Sot. Am. Proc. 24:36-40.
Allison, L.E. 1965. Organic carbon. In: Methods of Soil Analysis, Part 2, C.A. Black et al., Ed. Agronomy. 9:1367-1378. Am. Sot. of Agron., Inc., Madison, WI.
ASTM. 2000. Standard test methods for moisture, ash, and organic matter of peat and other organic soils. Method D 2974-00. American Society for Testing and Materials. West
Conshohocken, PA.
Blume, L.J., B.A. Schumacher, P.W. Shaffer et al. 1990. Handbook of Methods for Acid Deposition Studies Laboratory Analyses for Soil Chemistry. EPA/600/4-90/023. U.S. Environmental Protection Agency, Las Vegas, NV.
Bremner, J.M. 1949. Use of the Van Slyke-Neil manometric apparatus for the determination of organic and inorganic carbon in soil and of organic carbon in soil extracts. Analyst. 74:492-498.
Bremner, J.M. and D.S. Jenkinson. 1960. Determination of organic carbon in soil. I. Oxidation by dichromate of organic matter in soil and plant materials. J. Soil Sci. 11:394-402.
Broadbent, F.E. 1953. The soil organic fraction. Adv. Agron. 5:153-183.
Charles, M.J. and M.S. Simmons. 1986. Methods for the determination of carbon in soils and
sediments: A review. Analyst. 111:385-390.
Gustafsson, O., F. Haghseta, C. Chan, J. MacFarlane and P.M. Gschwend. 1997. Quantification
of the dilute sedimentary soot phase: Implications for PAH speciation and bioavailability. Environ.
20

Jackson, M.L. 1958. Soil Chemical Analysis. Prentice-Hall, Inc., Englewood Cliffs, NJ.
Kogel-Knabner, I. 1997. 13C and 15N NMR spectroscopy as a tool in soil organic matter studies.
Geoderma. 80:243-270.
LECO. 1996. CNS-2000 Elemental Analyzer - Instruction Manual. LECO Corp., St. Joseph,
MI.
McLean, E.O. 1982. Soil pH and lime requirement. In: Methods of Soil Analysis, Part 2, 2nd ed.,
A.L. Page et al., Ed. Agronomy. 9: 199-224. Am. Sot. of Agron., Inc., Madison, WI.
Mebius, L.J. 1960. A rapid method for the determination of organic carbon in soil. Anal Chim. Acta. 22:120-124.
Michelson, T.C. and K. Bragdon-Cook. 1993. Organic carbon normalization of sediment data.
Technical Information Memorandum. WA Department of Ecology. p 11.
Nelson, D.W. and L.E. Sommers. 1996. Total carbon, organic carbon, and organic matter. In: Methods of Soil Analysis, Part 2, 2nd ed., A.L. Page et al., Ed. Agronomy. 9:961-1010. Am. Soc. of Agron., Inc. Madison, WI.
Nguyen, T.T., L.J. Janik and M. Raupach. 1991. Diffuse reflectance infrared fourier transform (DRIFT) spectroscopy in soil studies, Aust. J. Soil Res. 29:49-67.
Plumb, Jr., R.H. 1981. Procedures for handling and chemical analysis of sediment and water samples. Technical Report EPA/CE-81-1. U.S. Army Engineering Waterways Experiment Station, Vicksburg, MS.
Puget Sound Estuary Program. 1986. Recommended protocols for measuring conventional sediment variables in Puget Sound. U.S. Environmental Protection Agency, Region 10, Office of Puget Sound, Seattle, WA.
Rather, J.B. 1917. An accurate loss on ignition method for determination of organic matter in soils. Arkansas Agric. Expt. Stn. Bull. No. 140.
Robinson, W.O. 1927. The determination for organic matter in soils by means of hydrogen peroxide. J. Agric. Res. 34:339-356.
Rumpel, C., H. Knicker, I. Kogel-Knabner, J.O. Skjemstad and R.F. Huttl. 1998. Types and chemical composition of organic matter in reforested lignite-rich mine soils. Geodeima. 86:123-142.
21

Rumpel, C., L.J. Janik, J.O. Skjemstad and I. Kogel-Knabner. 2001. Quantification of carbon derived from lignite in soils using mid-infrared spectroscopy and partial least squares. Organic Geochemistry. 32:83l-839.
Schnitzer, M. 1978. Humic substances: Chemistry and reactions. In: Soil Organic Matter, M. Schnitzer and S.U. Khan, Ed. Elsevier Scientific Publishing Co., New York. p. l-64.
Schumacher, B.A., A.J. Neary, C.J. Palmer et al. 1995. Laboratory Methods for Soil and Foliar Analysis in Long-Term Environmental Monitoring Programs. EPA/600/R-95/077. U.S. EPA, Las Vegas, NV.
Soil Survey Laboratory Methods Manual. 1992. Soil Survey Investigations Report No. 42. U.S. Department of Agriculture, Washington, DC.
Soon, Y.K. and S. Abboud. 1991. A comparison of some methods for soil organic carbon determination. Commun. Soil Sci. Plant Anal. 22:943-954.
Standard Methods for the Examination of Water and Wastewater. 1992. Am. Pub. Health Assoc., Am. Water Works Assn. and Water Environ. Fed., Washington, DC.
Talley, J.W., U. Ghosh, S.G. Tucker, J.S. Furey and R.G. Luthy. 2002. Particle-scale understanding of the bioavailability of PAHs in sediment. Environ. Sci. Technol. 36:477-483.
Tiessen H. and J.O. Moir. 1993. Total and organic carbon. In: Soil Sampling and Methods of
Analysis, M.E. Carter, Ed. Lewis Publishers, Ann Arbor, MI. p. 187-2 11.
U.S. EPA. 1974. Methods for Chemical Analysis of Water and Wastes. U.S. Environmental Protection Agency, Office of Solid Waste and Emergency Response, Washington, DC.
U.S. EPA. 1992. Test Methods for Evaluating Solid Waste, SW-846, 3•d ed. U.S. Environmental Protection Agency, Office of Solid Waste and Emergency Response, Washington, DC.
U.S. EPA. 2001. Methods for Collection, Storage, and Manipulation of Sediments for Chemical and Toxicological Analyses: Technical Manual. Draft. U.S. Environmental Protection Agency,
Office of Water, Washington, DC.
Walkley, A. 1947. A critical examination of a rapid method for determining organic carbon m
soils: Effect of variations in digestion conditions and of inorganic soil constituents. Soil Sci.
63:251-263.
Walkley, A. and I.A. Black. 1934. An examination of the Degtjareff method for determining organic carbon in soils: Effect of variations in digestion conditions and of inorganic soil constituents. Soil Sci. 63:251-263.
22

Wielopolski, L., I. Orion, G. Hendrey and H. Roger. 2000. Soil carbon measurements using inelastic neutron scattering. IEEE Trans. Nuclear Sci. 47:914-917.
Zimmerman, C.F., C.W. Keefe and J. Bashe. 1997. Determination of Carbon and
Nitrogen in Sediments and Particulates of Estuarine/coastal Waters Using Elemental Analysis - Method 440.0. U.S. Environmental Protection Agency, Cincinnati, OH.
23