monte carlo photoionization simulations of diffuse ionized gas
TRANSCRIPT

Mon. Not. R. Astron. Soc. 353, 1126–1134 (2004) doi:10.1111/j.1365-2966.2004.07846.x
Monte Carlo photoionization simulations of diffuse ionized gas
Kenneth Wood1� and John S. Mathis2�1School of Physics & Astronomy, University of St. Andrews, North Haugh, St Andrews, Fife KY16 9SS2Astronomy Department, University of Wisconsin, 475 N. Charter Street, Madison, WI 53706, USA
Accepted 2004 June 18. Received 2004 June 18; in original form 2004 January 22
ABSTRACTWe demonstrate that the observed increase of some nebular line ratios with height abovethe midplane in the diffuse ionized gas (DIG) in the Milky Way and other galaxies is anatural consequence of the progressive hardening of the radiation field far from the midplaneionizing sources. To obtain increasing temperatures and line ratios away from the midplane,our photoionization simulations of a multicomponent interstellar medium do not require asmuch additional heating (over and above that from photoionization) as previous studies thatemployed one-dimensional, spherically averaged models.
Radiation leaking into the DIG from density bounded H II regions is generally harder in theH-ionizing continuum and has its He-ionizing photons suppressed compared to the ionizingsource of the H II region. In line with other recent investigations, we find that such leaky H II
region models can provide elevated temperatures and line ratios, and a lower He+ fraction inthe DIG. For a composite model representing the relative spectral types of O stars in the solarneighbourhood, we find that the natural hardening of the radiation field reaching large heightsin our simulations can explain most of the observed line ratios. However, additional heating isrequired to reproduce the largest line ratios in the DIG.
Key words: radiative transfer – H II regions.
1 I N T RO D U C T I O N
The presence of extended layers of diffuse ionized gas (DIG) in theMilky Way and other galaxies is inferred from faint emission in Hα
and other nebular lines (e.g. Reynolds & Tufte 1995; Hoopes, Wal-terbos & Greenawalt 1996; Domgoergen & Dettmar 1997; Rand1998; Wang, Heckman & Lehnert 1998; Otte & Dettmar 1999; Otteet al. 2001; Otte, Gallagher & Reynolds 2002; Hoopes & Walterbos2003). The ionization source for the DIG is believed to be O andB stars close to the midplane of galaxies. Photoionization modelsusing OB stars can reproduce the gross features of the DIG ion-ization structure (e.g. Miller & Cox 1993; Dove & Shull 1994). Ifextra heating is included, in addition to that from photoionizationby O stars, 1D models can reproduce the DIG spectrum (Mathis1986; Domgoergen & Mathis 1994; Mathis 2000; Sembach et al.2000). The main problem with O stars as the ionization source ofthe DIG is that for a smooth density distribution the mean free pathof Lyman continuum photons is very small, ∼0.1 pc for n(H0) = 1cm−3. Thus, it is difficult for photons to traverse the large distancesto ionize the extraplanar gas which has a scaleheight of around 1kpc in the Milky Way (Haffner, Reynolds & Tufte 1999). How-ever, three-dimensional photoionization models show that a two-component (Wood & Loeb 2000) or fractal ISM (Ciardi, Bianchi
�E-mail: [email protected] (KW); [email protected] (JSM)
& Ferrara 2002) can provide low-density paths allowing Lymancontinuum photons to reach large |z| heights above their midplanesources.
Measurements of emission lines in addition to Hα provide probesof the abundances, temperatures and densities in the DIG. Some ofthe most studied lines in the Milky Way and other galaxies are [N II]λ6584, [S II] λ6717, [O III] λ5007, [O II] λ3727 doublet, and [O I]λ6300. Observations of the He I λ5876 line provide information onthe spectrum of the ionizing sources (Reynolds & Tufte 1995). Here-after the above lines will simply be referred to as [N II], [S II], [O III],[O II], [O I], and He I. Some differences in the observed line ratiosin the DIG compared to traditional H II regions are: [S II]/Hα and[N II]/Hα ratios increase with height above the plane; [S II]/[N II]is quite uniform with height (Haffner et al. 1999) and with latitude(Rand 1997); and He is observed to be underionized with respect toH (Reynolds & Tufte 1995; Heiles et al. 1996).
Most models for the DIG employ smooth, one-dimensional den-sity distributions, and predict volume averages of the line strengthsand ratios (e.g. Mathis 1986; Domgoergen & Mathis 1994; Mathis2000; Sembach et al. 2000; Collins & Rand 2001). These modelsgenerally fail to reproduce the observed line ratios that increasewith |z| above the midplane. Haffner et al. (1999) and Reynoldset al. (1999) showed that the observed [S II]/Hα and [N II]/Hα lineratios may be explained if the gas temperature increases with heightabove the midplane. Including additional heating over and above thatof pure photoionization can reconcile the one-dimensional models
C© 2004 RAS

Monte Carlo photoionization simulations of diffuse ionized gas 1127
with observations (Reynolds et al. 1999; Mathis 2000). Additionalheating may plausibly arise from photoelectric heating from dust(Reynolds & Cox 1992), dissipation of turbulence (Slavin, Shull &Begelman 1993; Minter & Spangler 1997), and shocks (Raymond1992). However, it is well known that in photoionized H II regions theradiation field hardens towards the edge of the Stromgren sphere re-sulting in the highest temperatures occurring at the largest distancesfrom the ionizing source. This arises because low-energy photonshave relatively short mean free paths and are absorbed close to thesource. Higher-energy photons have longer mean free paths, travelfarther, and deposit more energy per photon at large distances fromthe source, giving rise to the increasing temperature away from thesource (Osterbrock 1989).
Such a scenario as described above is almost certainly occurringin the DIG, with the ionizing spectra penetrating to large |z| abovethe plane being significantly harder than the source spectra, naturallyproducing a temperature profile that increases with |z|. Models pre-sented by Bland-Hawthorn, Freeman & Quinn (1997), Rand (1998)and Wang et al. (1998) take this radiation transfer effect into ac-count by introducing a hardening of the radiation field with |z|. Inthese plane parallel models, the hardening of the radiation field leadsto increasing temperatures at large distances from the illuminatedface and corresponding increases in [S II]/Hα and [N II]/Hα. Mathis(2000) also mentions this effect, stating that line ratios for lines ofsight that pierce the outer edges of spherical models may reproducethe observations.
Radiation leaking into the ISM from traditional H II regions mayalso be hardened compared to the source spectrum. Hoopes &Walterbos (2003) investigated photoionization by photons fromleaky H II regions finding that the hardened spectrum leads to el-evated temperatures and increased line ratios when compared tomodels that do not invoke hardening of the source spectrum. In ad-dition, leaky H II region models lead to a suppression of He-ionizingphotons (hν > 24.6 eV) and a corresponding decrease in ionizationstages such as He+ and N2+.
In this paper we present Monte Carlo photoionization models fora multicomponent ISM. In what follows we describe the photoion-ization code, adopted ISM density structure, and spectra for theionizing sources. Due to the very large parameter space, we restrictthis paper to two-dimensional models of a single source ionizing amulticomponent, stratified ISM. Note that although our models arefor 2D systems, our simulations are run on a 3D density grid. A fu-ture paper will present models for 3D geometries and illuminations,investigating the role of diffuse ionizing radiation, 3D ionizationand temperature structures, and the resulting intensity maps. Somespecific issues we address in this paper are: increased temperatureswith increasing |z| above the midplane; problems arising with fit-ting [S II] emission due to undetermined dielectronic recombinationrates; predictions of excess [O I] emission compared with observa-tions; and the ionization of He within the DIG.
2 M O D E L S
Our simulations use a 3D Monte Carlo photoionization code, withinputs being the ISM density structure, and the locations and ion-izing spectra of point sources within the simulation grid. Theseingredients are briefly discussed below.
2.1 Photoionization models
The photoionization simulations are performed using the 3D MonteCarlo code of Wood, Mathis & Ercolano (2004). The code simu-
lates photoionization due to multiple point or extended sources anddiscretizes the density on to a 3D linear Cartesian grid. For all simu-lations in this paper the grid comprises 653 cells. The code performswell compared to traditional 1D codes and other independently de-veloped Monte Carlo codes (Och, Lucy & Rosa 1998; Ercolanoet al. 2003). We do not consider the effects of shocks or ionizationfronts. In our simulations there is no C0 or S0 because we assumeC and S are fully ionized by the ambient interstellar radiation field.There are no ionizing photons with energies above 54.4 eV, so thereis no He2+, consistent with observations of almost all H II regions.For further details of the code and comparisons with other codes seeWood et al. (2004).
For most simulations, we adopt the following abundances by num-ber relative to H: He/H = 0.1, C/H = 140 ppm, N/H = 75 ppm,O/H = 319 ppm, Ne/H = 117 ppm, and S/H = 18.6 ppm. With theexception of S/H, these abundances were used by Mathis (2000) inhis photoionization models of the local DIG. We found that the solarS/H (Anders & Grevesse 1989) provides a good match to the ob-servations. The lower value, S/H = 13 ppm, used by Mathis (2000)was probably due to different dielectronic recombination rates in hisphotoionization code (see discussion in Section 3.5.4). We also in-vestigate the effects of different abundances and perform some sim-ulations using abundances appropriate for the Perseus arm (Mathis2000). We do not consider cooling from collisionally excited linesfrom elements other than those listed here, so our temperatures maybe slightly hotter than 1D models that include more elements (e.g.Sembach et al. 2000).
Currently dielectronic recombination rates have not been calcu-lated for third and fourth row elements, so photoionization mod-elling of sulphur lines are subject to uncertainties due to unknownatomic data (see Ali et al. 1991). We use the total recombinationrates for S+ and S2+ from Nahar (2000). For S3+ we use the ra-diative recombination rates from Verner & Ferland (1996) and theaverage dielectronic rate of 2.5 × 10⁻¹¹ from Ali et al. (1991). Wediscuss the issues related to modelling [S II] lines in Section 3.5.4.
2.2 ISM density structure
The ISM is observed to comprise several components of (warm andcold) neutral and (warm and hot) ionized gas. Unlike many recentphotoionization models of the DIG, Monte Carlo techniques are notrestricted to 1D averaged models. For our smooth density models,we use the two-component density from Miller & Cox (1993)
n(H) = 0.1 exp(−|z|/0.3) + 0.025 exp(−|z|/0.9), (1)
where the number densities are per cm3 and the distances are in kpc.This represents the concentrated neutral layer and the extended ion-ized layer. In their model for the DIG, Miller & Cox used the abovesmooth density and included an approximation for absorption bydense clouds using a model that reproduces the statistics of cloudsin the ISM. Although this smooth density is lower than the averagedensity inferred for H0 and H+, when implemented in their ‘stan-dard cloud’ model using the known ionizing sources in the solarneighbourhood, it reproduces the average emission and dispersionmeasures observed in the Milky Way.
An obvious criticism of the Miller & Cox model is that the den-sity they used is smaller than that inferred for the H I in the Galaxy(e.g. Dickey & Lockman 1990). However, they did use the knowndistribution and ionizing luminosity of O stars in the solar neigh-bourhood, and found that the above density allowed for the gas tobe ionized at large z along with reproducing many of the observa-tions of the DIG. In reality the ISM is clumped on a large range of
C© 2004 RAS, MNRAS 353, 1126–1134
1128 K. Wood and J. S. Mathis
size-scales, so the Miller & Cox density provides an estimate of thesmooth component required to allow ionizing photons to penetrateto large |z|. Therefore, such a density is a good starting point for3D models that incorporate smooth and clumpy components: thesmooth component should be close to that used by Miller & Cox.
2.3 Ionizing sources and spectra
We consider single sources within multicomponent ISM densitydistributions. The ionizing spectra are taken from the WM-basicmodel atmosphere library (Pauldrach, Hoffmann & Lennon 2001;Sternberg, Hoffmann & Pauldrach 2003) which provides model at-mospheres and emergent spectra including the effects of non-LTEline-blanketing and stellar winds. We did not run the WM-basicmodels, but used spectra from the library generated by Sternberget al. (2003). The spectra used were for model atmospheres withsolar abundances, and gravities and temperatures in the range 3.6 �log g � 4.0 and 30 000 K � T � � 50 000 K.
3 S TA N DA R D M O D E L
Our standard single-source model has the two-component, smoothdensity structure of equation (1), an ionizing luminosity Q(H0) =6 × 1049 s−1, and an ionizing spectrum for a WM-basic model at-mosphere with T � = 40 000 K and log g = 3.75. The output ofthe photoionization simulation is the 3D temperature and ionizationstructure for the elements that we track. Using the output temper-ature and ionization grids, we then calculate emissivity grids forvarious lines and form maps of the intensity and line ratios. Theresults of our standard simulation are shown in Figs 1–5.
In forming the emissivity grid we do not include cells that haveH0/H > 0.25. Emissivities for cells in our simulations that have
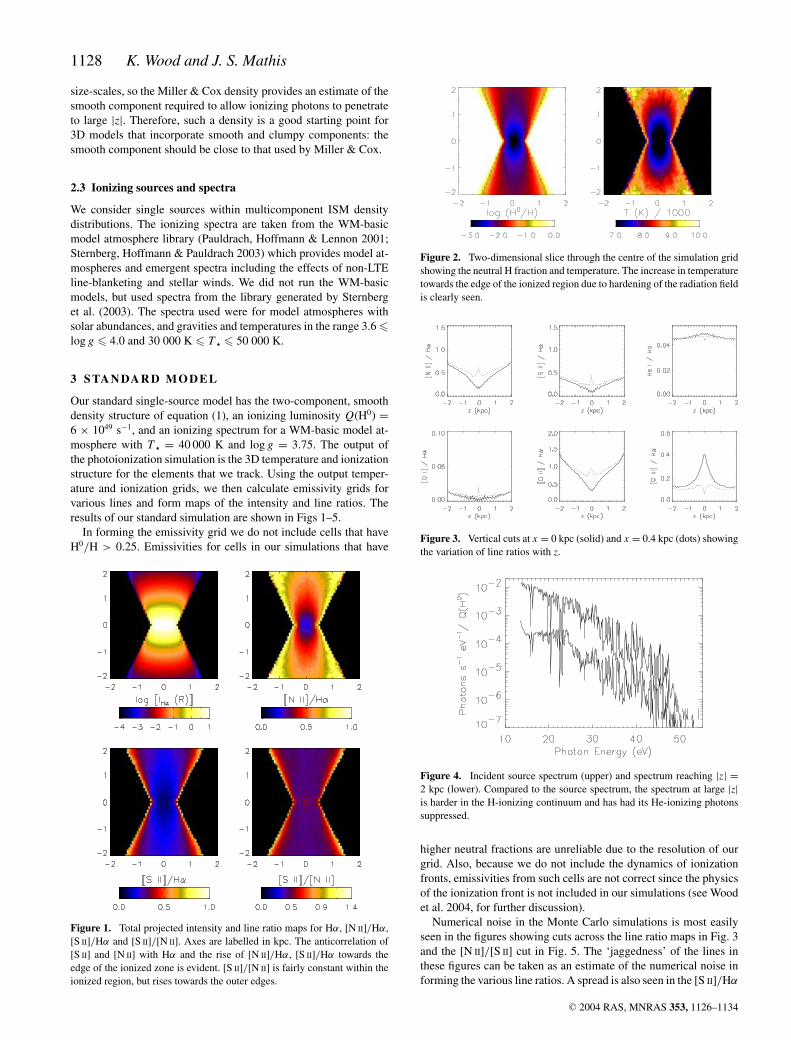
Figure 1. Total projected intensity and line ratio maps for Hα, [N II]/Hα,[S II]/Hα and [S II]/[N II]. Axes are labelled in kpc. The anticorrelation of[S II] and [N II] with Hα and the rise of [N II]/Hα, [S II]/Hα towards theedge of the ionized zone is evident. [S II]/[N II] is fairly constant within theionized region, but rises towards the outer edges.
Figure 2. Two-dimensional slice through the centre of the simulation gridshowing the neutral H fraction and temperature. The increase in temperaturetowards the edge of the ionized region due to hardening of the radiation fieldis clearly seen.
Figure 3. Vertical cuts at x = 0 kpc (solid) and x = 0.4 kpc (dots) showingthe variation of line ratios with z.
Figure 4. Incident source spectrum (upper) and spectrum reaching |z| =2 kpc (lower). Compared to the source spectrum, the spectrum at large |z|is harder in the H-ionizing continuum and has had its He-ionizing photonssuppressed.
higher neutral fractions are unreliable due to the resolution of ourgrid. Also, because we do not include the dynamics of ionizationfronts, emissivities from such cells are not correct since the physicsof the ionization front is not included in our simulations (see Woodet al. 2004, for further discussion).
Numerical noise in the Monte Carlo simulations is most easilyseen in the figures showing cuts across the line ratio maps in Fig. 3and the [N II]/[S II] cut in Fig. 5. The ‘jaggedness’ of the lines inthese figures can be taken as an estimate of the numerical noise informing the various line ratios. A spread is also seen in the [S II]/Hα
C© 2004 RAS, MNRAS 353, 1126–1134

Monte Carlo photoionization simulations of diffuse ionized gas 1129
Figure 5. Vertical cut at x = 0 kpc showing the variation of [S II]/[N II]with z. The scatter plots show the correlation of [S II]/Hα with [N II]/Hα
and the anticorrelation of [S II]/Hα and [N II]/Hα with Hα. In the [S II]/Hα–[N II]/Hα plot, the solid lines mark the range of observations in the localDIG (Haffner et al. 1999) and the squares show results from NGC 891 (Rand1998).
versus Hα and [S II]/Hα versus Hα scatter plots in Fig. 5, with somepoints deviating from the clear anticorrelation. This spread is a two-dimensional effect not seen in one-dimensional plane-parallel sim-ulations. It is due to sightlines through our grid sampling differenttemperatures and ionization states along the line of sight (see Figs 1and 2).
Fig. 1 shows maps of the Hα intensity (in rayleighs), and the[N II]/Hα, [S II]/Hα, and [S II]/[N II] line ratios. In calculating theHα intensity we have assumed that all the emission from the sim-ulation grid is at a distance of 2.5 kpc, roughly the distance to thePerseus arm (Haffner et al. 1999). This figure immediately showsthe anticipated increase in [N II]/Hα and [S II]/Hα with increasingdistance from the central ionizing source. The increasing line ra-tios arise from the hardening of the radiation field and subsequentincreasing temperatures at large distances from the source.
For this simulation [S II]/[N II] ∼ 0.6, similar to that seen in thelocal DIG (Haffner et al. 1999), and rises rapidly at the outermostedges of the ionized region. The rapid rise is explained by the relativeionization states of the elements. Close to the edge of the ionizedregion, N is mostly N+ and then transitions rapidly to N0, while Sis transitioning from S2+ to S+ (there is no S0 in our simulations).Therefore, S+/S increases and N+/N decreases at the edge of theionized zone leading to the large [S II]/[N II] line ratios at the outeredges of the line ratio map (see also Bland-Hawthorn et al. 1997,fig. 9). The rapid increase in line ratios from the interface in oursimulations is generally not observed in the DIG and may reflect ashortcoming of our pure photoionization models for this interface.
Fig. 2 shows a slice through the grid in the xz plane showingthe ionization of H and the 2D temperature structure. The ionizedvolume is extended perpendicular to the plane due to the increaseddensity in the midplane. This resembles the ‘Stromgren volumes’seen in other 2D photoionization simulations. The increasing tem-perature with distance from the source is clearly seen in this figure.
Fig. 3 shows line ratios as a function of z for vertical cuts atx = 0 and 0.4 kpc from the centre of the intensity maps in Fig. 1.The rise of [N II]/Hα and [S II]/Hα with increasing |z| is appar-ent as discussed above. [O III]/Hα decreases with height above theplane, while [O I]/Hα and [O II]/Hα increase with increasing |z|.The He I/Hα ratio decreases with |z| because the radiation reachingthese regions has had some of its He-ionizing photons absorbed at
lower |z|. For low-density gas at 104 K, He I/Hα = 0.5 He+/H+
(Osterbrock 1989), so the He I/Hα ratio probes the helium ioniza-tion and in turn the ionizing spectrum of the DIG (Reynolds & Tufte1995). Fig. 4 shows the incident spectrum and the spectrum thatreaches |z| = 2 kpc, clearly showing the hardening of the radiationfield and suppression of the He-ionizing photons.
In Fig. 5 we show a vertical cut across the centre of the [S II]/[N II]line ratio map. As in Fig. 1 we see [S II]/[N II] ∼ 0.6, similar toobservations by Haffner et al. (1999). Fig. 5 also shows some scatterplots as another way of displaying the trends seen in the intensityand line ratio maps of Fig. 1. These scatter plots display the valuesfor all pixels in the line ratio images of Fig. 1. Such scatter plots (e.g.Haffner et al. 1999) show the correlation of [S II]/Hα with [N II]/Hα
and the anticorrelation of [S II]/Hα and [N II]/Hα with Hα. Thesolid lines in the [S II]/Hα–[N II]/Hα scatter plot show the range ofobservations in the local DIG (Haffner et al. 1999) and the squaresare those for NGC 891 (Rand 1998). The increase in [S II]/[N II]towards the edges of the ionized volume in our simulations is evidentin the change of slope in the [S II]/Hα versus [N II]/Hα scatter plot.Note that the dots are appearing to turn around at very large valuesof [S II]/Hα, where the [N II]/Hα ratio is decreasing due to theN+ → N0 transition. Our grid resolution does not allow us to followthe decrease of [N II]/Hα smoothly to zero. The change of slope inthe [S II]/Hα–[N II]/Hα scatter plot is not present in data from thelocal DIG, but may be present in the NGC 891 data. Again, either theDIG is fully ionized or our models do not correctly treat emissionfrom the ionized/neutral interface. The variation of [S II]/Hα and[N II]/Hα against Hα shows an anticorrelation with the line ratiosbeing largest where the Hα emission is weakest, in agreement withobservations.
We now show some results and discuss the effects of varyingsource luminosity, ionizing spectrum, inclusion of extra heating,and ionization by photons from leaky H II regions. The intensity andline ratio maps are qualitatively similar, so our discussion mostlyfocuses on the intensity cuts and scatter plots for the simulationsbelow.
3.1 Varying ionizing luminosity
In Fig. 6 the ionizing luminosity is varied in the range 2 × 1049
s−1 � Q(H0) � 8 × 1049 s−1. All other parameters are the same
Figure 6. Vertical cuts at x = 0 showing the effects of varying ionizingluminosity on line ratios. Ionizing luminosities are 2 × 1049 s−1 (dots), 4 ×1049 s−1 (dashed), 6 × 1049 s−1 (solid) and 8 × 1049 s−1 (dot-dashed). Lowluminosities lead to a smaller ionized volume so there is a larger relativecontribution from the ionized to neutral transition zone, hence some lineratios are much larger towards large |z|. The lowest luminosity source isradiation bounded at |z| = 0.7 kpc.
C© 2004 RAS, MNRAS 353, 1126–1134

1130 K. Wood and J. S. Mathis
as presented in the previous section. Increasing or decreasing thesource luminosity yields larger and smaller ionized volumes. Forthe lowest ionizing luminosity, the simulation is radiation boundedat |z| = 0.7 kpc and the vertical cut shows that the [O I]/Hα ratiobecomes large (∼ 0.1) at the edge of the ionized volume. This isdue to the combination of high temperatures and oxygen rapidlybecoming neutral at the edge of the ionized volume (see discus-sion in Section 4.2). For lower-luminosity sources the [S II]/Hα
ratio is quite large at large |z|. This is because the ionized zoneis radiation bounded and we are seeing the effects of the interface(S2+ → S+) described above. Beyond the edge of the ionized zone[S II]/Hα is formally infinite because the Hα intensity is zero. Forthis simulation, the resolution of our grid is not sufficient to see therapid decrease in [N II]/Hα that occurs in the transition zone whereN+ → N0. We just see the rise of [N II]/Hα and [S II]/Hα with |z|and beyond the end of the dotted lines [N II]/Hα = 0.
3.2 Varying ionizing spectra
The effects of varying the ionizing spectrum are displayed in Figs 7and 8. Line ratios and scatter plots are shown for WM-basic model
Figure 7. Effect of varying ionizing spectra on line for ratios vertical cutsat x = 0 kpc. Effective temperatures for the ionizing source are 35 000 K(dots), 40 000 K (solid), 45 000 K (dashed) and 50 000 K (dot-dashed). Theharder ionizing spectra from the hotter stars lead to some very large lineratios.
Figure 8. Effect of varying ionizing spectra on scatter plots. Effective tem-peratures for the ionizing source are (a) 35 000 K, (b) 40 000 K, (c) 45 000 Kand (d) 50 000 K. The harder ionizing spectra from the hotter stars lead toincreased line ratios, in some cases much larger than observed in the localDIG (solid lines) or NGC 891 (squares).
Figure 9. Composite spectrum models at x = 0 kpc (solid lines) and withadditional heating (dots).
atmospheres with solar abundances, and effective temperatures andlog g values of (35 000 K, 3.8), (40 000 K, 3.75), (45 000 K, 3.9), and(50 000 K, 4.0). The ionizing luminosity is Q(H0) = 6 × 1049 s−1
and all other parameters are as in our standard model. As foundin other investigations, harder spectra produce higher temperaturesand increased line ratios for [N II]/Hα, [S II]/Hα, [O II]/Hα, and[O III]/Hα. The 35 000 K spectrum has little flux above 24.6 eV inthe He-ionizing continuum, so the He I/Hα ratios are very small forthis simulation.
3.3 Composite models and extra heating
The results of Figs 7 and 8 indicate that the observed line ratios inthe local DIG and NGC 891 could be reproduced with a range ofsource spectra and luminosities. We have followed Mathis (2000)and constructed models for a point source with a composite spec-trum that has the following contributions: 56% from T = 35 000 K,12 per cent from T = 40 000 K, and the rest from T = 45 000 K.This is comparable to the solar neighbourhood where the Garmany,Conti & Chiosi (1982) catalog shows that around 50 per cent of theO stars are spectral type O8 or later. Fig. 9 shows that [N II]/Hα and[S II]/Hα increase with height above the plane, to values close tothose observed in the local DIG. The line ratios are lower than thosefor NGC 891, likely reflecting the hotter sources ionizing its DIG.As with our other simulations, the very large [S II]/Hα line ratiosfrom the ionized/neutral interface should be viewed with cautiondue to incomplete physics in our code.
We have also investigated whether including additional heatingmay raise the [N II]/Hα ratio for this composite model. FollowingReynolds et al. (1999), we introduce an additional heating termproportional to ne, G1ne erg s−1 cm−3, which will dominate overphotoionization heating at low n e at large |z| in our simulations.The models in Fig. 9 (dotted curves) and Fig. 10 have G 1 = 5 ×10⁻²⁷ erg s−1, yielding temperatures of around 11 000 K at |z| = 2kpc. Increasing the heating to G 1 = 10−26 erg s−1 yields tempera-tures in excess of 15 000 K at |z| = 2 kpc. Fig. 9 shows the [S II],[N II], and [O II] emission is boosted compared to the simulationwith no additional heating, with [O II]/Hα providing a very goodprobe of additional heating (Mathis 2000). The very high [S II]/Hα
line ratios from the ionized/neutral interface are still evident as dis-cussed above. The additional heating required to explain the largestline ratios is density-dependent (Reynolds et al. 1999). Our simula-tions in Figs 9 and 10 have lower density at 1 kpc and hence loweradditional heating compared to the Perseus arm models of Reynoldset al. (1999).
C© 2004 RAS, MNRAS 353, 1126–1134

Monte Carlo photoionization simulations of diffuse ionized gas 1131
Figure 10. Composite spectrum scatter plots (left) and with additionalheating (right) 5 × 10⁻²⁷ne erg s−1 cm−3. The lines and squares showobservations from the local DIG and NGC 891.
3.4 Leaky H II regions
Observations indicate that many H II regions are not traditional radia-tion bounded Stromgren spheres, but are density bounded and leak afraction of the source luminosity into the DIG (Ferguson et al. 1996;Oey & Kennicutt 1997; Zurita et al. 2002). Depending on the sourcespectrum for an H II region, its He+ zone may be smaller than the H+
zone (e.g. Osterbrock 1989). Therefore, as suggested by Reynolds& Tufte (1995), if an H II region is density bounded beyond the He+
zone, but within the H+ zone, the spectrum leaking into the ISMmay have its He-ionizing photons suppressed and the H-ionizingcontinuum hardened. This is seen in Fig. 4, where the spectrumleaking from a density bounded region is harder than the incidentspectrum and may have its He-ionizing photons suppressed. There-fore, leaky H II regions are a very plausible way for providing highertemperatures, due to the harder H-ionizing continuum, and lowerHe+ fractions, due to the suppression of the He-ionizing photons.Hoopes & Walterbos (2003) presented 1D leaky H II region models,with some models producing elevated [S II]/Hα and [N II]/Hα andlower He I/Hα. We generate leaky spectra from a constant-densityH II region with n(H) = 100 cm−3. The outer boundary is adjusteduntil the escape fraction is 15 per cent, 30 per cent and 60 per cent ofthe incident source spectrum. The leaky spectra are then used as thesource spectrum for 2D models of the DIG. All DIG models havethe same luminosity, 6 × 1049 s−1, but differ in the source spectra,shown in Fig. 11.
The incident (T � = 40 000 K, log g = 3.75) and escaping spectrafor our leaky H II regions are shown in Fig. 11. The escaping spectracomprise photons that escape directly and contributions from thediffuse radiation field: H I Lyman continuum, He I Lyman contin-uum, He I two-photon continuum, and the He I 19.8 eV, 23 S →11S emission line. The leaky spectra are seen to be much harder inthe H-ionizing continuum (flatter, or even increasing in the interval13.6–24.6 eV) and for low leakage fractions the He-ionizing con-tinuum is suppressed. For leaky spectra with sources hotter than 45000 K, we found that the He-ionizing continuum is not significantlysuppressed (see also Hoopes & Walterbos, fig. 13).
Fig. 12 shows the variation of line ratios with height for the leakyspectra of Fig. 11, and Fig. 13 shows the corresponding scatter plots.The spectral shape of the leaky spectrum can lead to increased ordecreased [S II]/Hα and [N II]/Hα (see also Hoopes & Walterbos,fig. 14). For the simulations shown here, [N II]/Hα increases asthe H II region escape fraction decreases (all simulations have thesame ionizing luminosity), while [S II]/Hα slightly decreases for
Figure 11. Input spectra (a) and leaky spectra for leakage fractions of(b) 60 per cent, (c) 30 per cent and (d) 15 per cent. Note the hardening ofthe H-ionizing photons, the prominent 19.8-eV He I emission line, and thesuppression of He-ionizing photons for small escape fractions.
Figure 12. Models showing the effects of leaky spectra on line ratios verticalcuts at x = 0 kpc. All models have the same ionizing luminosity, but theionizing spectra are as shown in Fig. 11. The lines show a non-leaky 40 000 Kmodel (solid) and leaky models for escape fractions of 60 per cent (dots), 30per cent (dashed) and 15 per cent (dot-dashed).
the lower escape fractions. The increase of [N II]/Hα for the lowerescape fractions is due to the harder spectra between 13.6 eV and24.6 eV for these models (Fig. 11). The He I/Hα decreases for leakyspectra due to absorption of He-ionizing photons in the H II region.Thus some leaky H II regions provide another way for producing theelevated temperatures, line ratios and low He+ fraction observed inthe DIG.
3.5 Other models
We have investigated many more models than those presented above.Rather than present numerous figures, we now describe the maineffects of varying other parameters.
C© 2004 RAS, MNRAS 353, 1126–1134

1132 K. Wood and J. S. Mathis
Figure 13. Effect of leaky spectra models on scatter plots. Panels show(a) non-leaky model, and models with escape fractions of (b) 60 per cent,(c) 30 per cent and (d) 15 per cent.
3.5.1 Varying density structure
We performed simulations for a single-component density struc-ture, representing only the DIG component of the ISM. These sim-ulations had lower temperatures, smaller [N II]/Hα, [S II]/Hα, and[O II]/Hα, and a larger He I/Hα than the two-component model.This was due to the absence of the concentrated density compo-nent which yields more hardening of the spectrum reaching large|z| in the two-component density models. Similarly, the plane par-allel models presented by Rand (1998) and Bland-Hawthorn et al.(1997) did not produce as large [N II]/Hα and [S II]/Hα ratios as ourtwo-component models. It appears that a uniform slab, or single-component exponential density structure, cannot yield the large[N II]/Hα, [S II]/Hα that are observed without additional heatingof the DIG, or hardening of the radiation field via leaky H II regionmodels or a multicomponent ISM density structure.
3.5.2 Varying source location
As the source location is moved to larger z heights above the plane,the ionized zone becomes radiation bounded for z < 0 (e.g. Miller& Cox 1993). At large positive z the grid is more ionized since theradiation has less of the concentrated higher-density component toionize and pass through before reaching the gas at large z. Comparedto a simulation where the source is in the midplane, vertical intensitycuts for models where the source is located above the midplane showlarger line ratios towards the lower radiation bounded edge and lowerline ratios towards the upper edge of the grid. These effects are seenin the simulations in Section 3.1 where the source luminosity isvaried.
3.5.3 Varying elemental abundances
Using abundances appropriate for the Perseus arm: (C, N, O, Ne,S)/H = (85, 45, 250, 71, 8) ppm (Mathis 2000) slightly decreases[N II]/Hα, [S II]/Hα, and increases [O II]/Hα, [O III]/Hα by a factorof about 1.5 to 2 compared to those in Fig. 3. The lower oxygenabundances compared to our standard model result in increased lineemission to obtain equilibrium temperatures, and hence the elevatedline ratios.
3.5.4 Sulphur dielectronic recombination
Accurate modelling of the [S II] emission is not yet possible due tothe unknown dielectronic recombination rates for S (see discussion
in Ali et al. 1991). In our simulations we used total recombinationrates for S+ and S2+ from Nahar (2000) and the average suggestedfor S3+ from Ali et al. (1991). The rates of Nahar (2000) are fromtheoretical calculations, so may not be as accurate as from exper-iments. We have run our standard simulation with no dielectronicrecombination for S and also using the averages suggested by Aliet al. (1991) for S+, S2+ and S3+. We find the [S II]/[N II] line ratiovaries by about a factor of 1.5 among the three simulations. Untilmore accurate dielectronic recombination rates are available, thisuncertainty in modelling [S II] emission will remain.
4 D I S C U S S I O N
4.1 Sulphur and nitrogen
The model line ratios presented above appear to be in good agree-ment with observations of [S II] and [N II] in the local DIG (Haffneret al. 1999), NGC 891 (Rand 1998), and several other galaxies (e.g.Otte et al. 2001, 2002). The increase of [N II]/Hα and [S II]/Hα with|z| is a natural consequence of increasing temperatures away fromthe ionizing source due to the hardening of the radiation field. Com-pared to one-dimensional averaged models, our two-dimensionalsimulations can explain most of the observations, but additionalheating is required for the largest line ratios.
The change of slope in the [S II]/Hα versus [N II]/Hα scatter plots(e.g. Fig. 8) are not observed in the DIG of the Milky Way (Haffneret al. 1999). The change of slope in our simulations is due to theincreased S+/S and N0/N fractions at the edge of the ionized vol-umes. The fact that such slope changes are not observed suggeststhat the DIG is almost fully ionized and not density bounded like oursingle-source models. We will investigate multiple source modelswith overlapping ionized regions in a separate paper. Alternatively,it is quite likely that our models do not provide a good representationof the emission at the ionized/neutral interface as we do not includethe effects of shocks or ionization fronts. The role of interfaces in in-terpreting ISM observations is very important (Reynolds 2004), andthe very large [S II]/Hα and [N II]/Hα line ratios in our simulationsmay be a result of incomplete physics in our simulations.
Some galaxies do show changes in slope of the [S II]/Hα versus[N II]/Hα and this has recently been interpreted by Elwert, Dettmar& Tullmann (2003) as an indicator for chemical evolution in galax-ies. They suggest that increased [S II]/Hα compared to [N II]/Hα
may arise from younger DIG layers since in the ISM nitrogen (fromlow-mass stars, planetary nebulae, and stellar winds) is enrichedmore slowly than sulphur (from supernovae type II). Our modelsadopt uniform abundances throughout the simulation grid and donot address this scenario.
4.2 Oxygen
There is currently limited data on oxygen lines in the DIG of theMilky Way, with most observations probing the DIG at b = 0◦. How-ever, in NGC 891 there are detailed observations of the dependenceof [O III]/Hα and [O I]/Hα with height above the plane and Otteet al. (2001, 2002) have made measurements of [O II]/Hα in severalgalaxies. Rand (1998) finds that [O III]/Hα increases with height,which is opposite to what is seen in almost all of our simulations.The increase of [O III]/Hα with |z| in NGC 891 is cited as evidencefor O being ionized by a different mechanism, such as shocks (e.g.Collins & Rand 2001), instead of pure photoionization. Our modelsdo not consider dynamics or ionization fronts, so cannot addressthese effects. Note, however, that models with very hard spectra
C© 2004 RAS, MNRAS 353, 1126–1134

Monte Carlo photoionization simulations of diffuse ionized gas 1133
(T � = 50 000 K, Fig. 7) can produce increasing [O III]/Hα at large|z|.
Otte et al. (2001, 2002) observe [O II]/Hα and [O III]/Hα to in-crease with height above the plane in five galaxies they studied, find-ing 0.5 � [O II]/Hα � 5. They also observed increases of [S II]/Hα
and [N II]/Hα with |z|. Our pure photoionization models predict0.5 � [O II]/Hα � 3, and additional heating can raise this even fur-ther (e.g. Fig. 9). It appears that multidimensional pure photoion-ization models can reproduce most of the [O II]/Hα observations ofOtte et al. (2001, 2002), though additional heating or a harder ion-izing spectrum may be required for some of the largest [O II]/Hα
ratios.The [O I]/Hα line ratios in our models show that [O I] increases
in strength towards the edge of the ionized zone. The strong charge-exchange coupling of O0 to H0 and the increased temperatures to-wards the edge of the ionized zone result in the increased [O I]/Hα.This is generally seen as a problem with photoionization models,since in the few observations in the local DIG, albeit at b = 0◦,[O I] is observed to be rather weak with [O I]/Hα � 0.03. The [O I]emission may be reduced if the region is fully ionized, or densitybounded instead of radiation bounded (e.g. Mathis 2000; Sembachet al. 2000). This is seen in the vertical cuts showing that [O I]/Hα
< 0.03 in models where the gas is ionized beyond the maximum |z|of our simulation box (e.g. Fig. 3). The increasing [O I]/Hα with|z| in some of our simulations (e.g. Fig. 6) do match the data forNGC 891, where [O I]/Hα ∼ 0.1 at large |z| (Rand 1998). Moreobservations of [O I] at larger |z| in the Galactic DIG will determinewhether there really is a difference in the [O I] emission betweenthe Milky Way and NGC 891.
4.3 Helium
As with [O I], the few measurements of He I in the Galactic DIGare at b = 0◦. The observations indicate that helium is underionizedrelative to hydrogen with He+/ H+ � 0.04 (Reynolds & Tufte 1995;see also Heiles et al. 1996). The He I observations probe the ion-izing spectrum for the DIG and indicate a relatively soft spectrum,typically spectral type O8 or later, corresponding to T � ∼ 36 000 K.The situation is not as extreme in NGC 891 where He+/H+ ∼ 0.06,indicating a harder ionizing spectrum for its DIG (Rand 1997).
Our simulations using a composite spectrum, representative ofthe O stars in the solar neighbourhood, produce fairly low valuesfor He I/Hα, in line with current observations at b = 0◦. Furtherobservations of He I at higher latitudes will provide additional testsof our models and the hardening of the radiation field at large |z|.
We have also investigated an alternative mechanism for reducingthe helium ionization, even when the sources are hotter than O8. Thebasic idea is that the radiation leaking out of midplane H II regionsto ionize the DIG may have its helium ionizing photons suppressed(e.g. Hoopes & Walterbos 2003). Our leaky H II region models doindeed show that low values for He+/H+ may be obtained, even ifthe ionizing source is quite hot. For the same ionizing luminosity,these models also produce higher temperatures than our other mod-els, since the leaking ionizing spectrum is harder in the H-ionizingcontinuum. Therefore, leaky H II regions provide a plausible mech-anism for explaining the low helium ionization in the GalacticDIG.
5 S U M M A RY
We have presented some of the first multidimensional photoioniza-tion simulations investigating intensity and line ratio maps in models
of the diffuse ionized gas of the Milky Way. Our models produce[S II]/Hα and [N II]/Hα line ratios that are in good agreement withobservations. Our simulations reproduce the observed increase of[S II]/Hα and [N II]/Hα with increasing |z| due to the increasingtemperatures at large distances from the ionizing sources. Previousanalyses of line ratios in the DIG suggested additional heating wasrequired to reproduce the elevated line ratios at large |z|.
Our simulations can reproduce most of the observations withoutthe need to include any additional heating above that provided bypure photoionization. However, additional heating is still requiredat low densities to reproduce the largest observed line ratios. Modelssuch as those presented here, where line ratios are constructed forrays piercing the outer edges of photoionized regions, are moreappropriate for the DIG. We have also shown that leaky H II regionsprovide a plausible explanation for the low helium ionization inthe DIG. The hardened leaky spectra produce higher temperaturesthan our standard models, in agreement with other work (Hoopes &Walterbos 2003).
Unless we use very hard ionizing spectra, our models do not re-produce the observed increase of [O III]/Hα with |z| in NGC 891.The observed rise of [O III]/Hα may be due to hotter ionizing sourcesor an additional source of ionization not present in our photoion-ization simulations (e.g. shocks or massive stars formed at large |z|from the dense clouds observed there, Howk & Savage 1997). An-other potential problem with our simulations is that they do not treatthe physics at the ionization front, possibly resulting in an overpre-diction of the [S II]/Hα line ratios. Despite these shortcomings, ourmodels clearly demonstrate the importance of geometry in models ofthe DIG: compared to homogeneous or single-component densities,multicomponent models produce more hardening of the radiationfield, and more elevated temperatures at large |z|. In a future pa-per we will explore 3D models incorporating the known locations,luminosities and spectral types of O stars in the solar neighbour-hood. The WHAM data in addition to the H I atlas (Hartmann &Burton 1997) should enable us to place constraints on the ISM den-sity structure.
AC K N OW L E D G M E N T S
We thank Alison Campbell, Torsten Elwert, Barbara Ercolano,Matt Haffner, Kirk Korista, Lynn Matthews, John Raymond, RonReynolds, Jon Slavin, and Steve Tufte for many useful discussionsrelating to this work. Suggestions from an anonymous referee re-sulted in a clearer presentation of our results. KW acknowledgessupport from a PPARC Advanced Fellowship; JSM claims to beretired.
R E F E R E N C E S
Ali B., Blum R. D., Bumgardner T. E., Cranmer S. R., Ferland G. J., HaefnerR. I., Tiede G. P., 1991, PASP, 103, 1182
Anders E., Grevesse N., 1989, Geochim, Cosmochim. Acta, 53, 197Bland-Hawthorn J., Freeman K. C., Quinn P. J., 1997, ApJ, 143, 155Ciardi B., Bianchi S., Ferrara A., 2002, MNRAS, 331, 463Collins J. A., Rand R. J., 2001, ApJ, 551, 57Dickey J. M., Lockman F. J., 1990, ARA&A, 28, 215Domgoergen H., Dettmar R.-J., 1997, A&A, 322, 391Domgoergen H., Mathis J. S., 1994, ApJ, 428, 647Dove J. B., Shull J. M., 1994, ApJ, 423, 196Elwert T., Dettmar R.-J., Tullmann R., 2003, BAAS, 203, 111. 05Ercolano B., Barlow M. J., Storey P. J., Liu X.-W., 2003, MNRAS, 340,
1136
C© 2004 RAS, MNRAS 353, 1126–1134

1134 K. Wood and J. S. Mathis
Ferguson A. M., Wyse R. F. G., Gallagher J. S., Hunter D. A., 1996, AJ,111, 2265
Garmany C. D., Conti P. S., Chiosi C., 1982, ApJ, 263, 777Haffner L. M., Reynolds R. J., Tufte S. L., 1999, ApJ, 523, 223Hartmann D., Burton W. B., 1997, Atlas of Galactic Neutral Hydrogen.
Cambridge Univ. Press, CambridgeHeiles C., Koo B-C., Levenson N. A., Reach W. T., 1996, ApJ, 462, 326Hoopes C. G., Walterbos R. A. M., Greenawalt B. E., 1996, AJ, 112, 1429Hoopes C. G., Walterbos R. A. M., 2003, ApJ, 586, 902Howk J. C., Savage B. D., 1997, AJ, 114, 2463Mathis J. S., 2000, ApJ, 544, 347Mathis J. S., 1986, ApJ, 301, 423Miller W. W. III, Cox D. P., 1993, ApJ, 417, 579Minter A. H., Spangler S. R., 1997, ApJ, 458, 194Nahar S. N., 2000, ApJS, 126, 537Och S. R., Lucy L. B., Rosa M. R., 1998, A&A, 336, 301Oey M. S., Kennicutt R. C., 1997, MNRAS, 291, 827Otte B., Dettmar R.-J., 1999, A&A, 343, 705Otte B., Reynolds R. J., Gallagher J. S., Ferguson A. M. N., 2001, ApJ, 560,
207Otte B., Gallagher J. S., Reynolds R. J., 2002, ApJ, 572, 823Osterbrock D. E., 1989, Astrophysics of Gaseous Nebulae and Active Galac-
tic Nuclei. University Science Books, Mill Valley, CA
Pauldrach A. W. A., Hoffmann T. L., Lennon M., 2001, A&A, 375, 161Rand R., 1998, ApJ, 501, 137Rand R., 1997, ApJ, 474, 129Raymond J. C., 1992, ApJ, 384, 502Reynolds R. J., 2004, in Alfaro E. J., Perez E., Franco J., eds, How Does the
Galaxy Work? In pressReynolds R. J., Haffner L. M., Tufte S. L., 1999, ApJ, 525, L21Reynolds R. J., Tufte S. L., 1995, ApJ, 448, 715Reynolds R. J., Cox D. P., 1992, ApJ, 400, L33Reynolds R. J., 1985, ApJ, 294, 256Sembach K. R., Howk J. C., Ryans R. S. I., Keenan F. P., 2000, ApJ, 528,
310Slavin J. D., Shull J. M., Begelman M. C., 1993, ApJ, 407, 83Sternberg A., Hoffmann T. L., Pauldrach A. W. A., 2003, ApJ, 599,
1333Verner D. A., Ferland G. J., 1996, ApJS, 103, 467Wang J., Heckman T. M., Lehnert M. D., 1998, ApJ, 509, 93Wood K., Mathis J. S., Ercolano B., 2004, MNRAS, 348, 1337Wood K., Loeb A., 2000, ApJ, 545, 86Zurita A., Beckman J. E., Rozas M., Ryder S., 2002, A&A, 386, 801
This paper has been typeset from a TEX/LATEX file prepared by the author.
C© 2004 RAS, MNRAS 353, 1126–1134