monthly bulletin on foreign trade statisticsdgftcom.nic.in/exim/2000/tradestat/mis/bnov17.pdf ·...
TRANSCRIPT

Monthly Bulletin on Foreign trade StatiStiCS
Suggestions/feedback may be sent to Dr. P C Mishra, Statistical Advisor by e-mail at [email protected]
Government of India Ministry of Commerce and Industry
Department of Commerce Directorate General of Foreign Trade
Statistics Division (Data Analytics Unit)
November, 2017


Monthly Bulletin on Foreign Trade November 2017 Page i
CONTENTS ANALYSIS OF FOREIGN TRADE DATA ....................................................................................... 1
INTRODUCTION ............................................................................................................................. 1
A. Quick Estimates of Foreign Trade ................................................................................................. 1
A.1 India’s Merchandise Trade ....................................................................................................... 1
A.2 India’s Services Trade .............................................................................................................. 2
A.3 India’s Overall Trade ............................................................................................................... 4
A.4 Sectoral Analysis of Merchandise Trade Based on Quick Estimates (QE) ............................. 5
B. India’s Merchandise Trade Based on Provisional Estimates (PE) ................................................. 6
B.1 Export Scenario ........................................................................................................................ 6
B.1.2 Export by Principal Commodities ..................................................................................... 6
B.1.3 India’s Export: Region-wise .............................................................................................. 8
B.1.4 Export by Destination ........................................................................................................ 9
B.2 Import Scenario ...................................................................................................................... 11
B.2.2 Import by Principal Commodities ................................................................................... 11
B.2.3 India’s Import: Region-wise ............................................................................................ 12
B.2.4 Import from Sources ........................................................................................................ 13
Table 1: India’s month-wise Merchandise Trade.............................................................................. 15
Table 2: India’s month-wise Services Trade ..................................................................................... 15
Table 3: India’s month-wise Overall Trade (Merchandise plus Services) ........................................ 16
Table 4: India’s Merchandise Export of QE Groups: Month-wise ................................................... 17
Table 4 (contd.): India’s Merchandise Export of QE Groups: Month-wise ...................................... 18
Table 5: India’s Merchandise Export of QE Groups ........................................................................ 19
Table 6: India’s Merchandise Import of QE Groups: Month-wise ................................................... 20
Table 6 (contd.): India’s Merchandise Import of QE Groups: Month-wise ...................................... 21
Table 7: India’s Merchandise Import of QE Groups ........................................................................ 22
Table 8: India’s Export by Principal Commodity ............................................................................. 23
Table 9: India’s Import by Principal Commodity ............................................................................. 24
Table 10: India’s Export by Destination ........................................................................................... 25
Table 11: India’s Import by Sources ................................................................................................. 26
Table 12: India’s Export by Region .................................................................................................. 27
Table 13: India’s Import by Region .................................................................................................. 28

Monthly Bulletin on Foreign Trade November 2017 Page 1
ANALYSIS OF FOREIGN TRADE DATA Introduction
Merchandise foreign trade data are compiled on the basis of flows/movements of goods across the custom frontiers of India by DGCI&S. The value of import is based on CIF, i.e. Cost, Insurance and Freight whereas the value of export is on FOB (Free on Board). The foreign trade statistics are released in three phases:
(i) Monthly Quick Estimates are released by fifteenth of the following month,
(ii) Principal Commodity level data is released within 30 days, and
(iii) Detailed 8-digit commodity level data are released within 60 days.
All these data are provisional and are dynamically revised till it is finalised on the basis of late receipt data.
Foreign trade in services monthly data are collected through FETERS are used as input in compilation of balance of payments (BoP) for India and released by Reserve Bank of India (RBI) within 45 days.
A. Quick Estimates of Foreign Trade
The Quick Estimates of Merchandise Foreign Trade are grouped into 30 major commodities.
A.1 India’s Merchandise Trade
In October 2017 India’s merchandise export was US$ 23,098.18 million as compared to US$ 23,360.61 million in October 2016, registering a negative growth of 1.12%. In October 2017 India’s merchandise import was US$ 37,117.01 million as compared to US$ 34,495.09 million in October 2016, registering a positive growth of 7.60%.
Figure 1 depicts the merchandise trade performance for the period April-October 2017 over the corresponding period of the previous year. It shows that total value of export for April-October, 2017 was US$ 1,70,287 million as compared to US$ 1,55,344 million during the period April-October 2016, registering a positive growth of 9.62%. The total value of import in April-October, 2017 was US$ 2,56,434 million as compared to the import of US$ 2,09,835 million during the period April-October 2016, registering a positive growth of 22.21%. As a result, trade deficit during April-October 2017 has increased as compared to April-October 2016.

Monthly Bulletin on Foreign Trade November 2017 Page 2
The month-wise merchandise export, import, trade balance since April, 2015 is given in Table 1. The trend of merchandise export, import and trade balance over the months of April-October, 2017 is depicted at Figure 2.
A.2 India’s Services Trade
In September 2017 India’s export was US$ 13,732 million as compared to US$ 13,773 million in September 2016, registering a negative growth of 0.30%. In September 2017 India’s import was US$ 8,450 million as compared to US$ 8,304 million in September 2016, registering a positive growth of 1.76%.
Figure 3 depicts the services trade performance for the period April- September 2017 over the corresponding period of the previous year. It shows that value of export for April- September, 2017 was US$ 80,333 million as compared to US$ 79,619 million during April-
-100000
-50000
0
50000
100000
150000
200000
250000
300000
Export Import Trade Balance
1553
44 2098
35
-544
91
1702
87 25
6434
-861
48
Val
ue in
US$
Mill
ion
Figure 1: Merchandise Trade Performance
Apr-Oct, 16
Apr-Oct, 17
24592 23969 23108 22382 23517 28732
23098
38209 38317 36983 33986 35561 37628 37117
-13617 -14348 -13875 -11604 -12044 -8896
-14019
-20000
-10000
0
10000
20000
30000
40000
50000
Apr, 17 May, 17 June, 17 July, 17 Aug, 17 Sept, 17 Oct, 17
Val
ue in
US$
Mill
ion
Figure 2: Trend of Merchandise Trade during April, 17 to October, 17
Exports
Imports
Trade Balance

Monthly Bulletin on Foreign Trade November 2017 Page 3
September 2016, registering a positive growth of 0.90%. The total value of import in April- September 2017 was US$ 46,736 million as compared to US$ 47,261 million during April- September 2016, registering a negative growth of 1.11%. As a result, trade balance for services during April- September 2017 has improved as compared to April- September 2016.
The month-wise services export, import, trade balance since April, 2015 based on the press releases of RBI is given in Table 2. The trend of services export, import and trade balance over the months of April- September, 2017 is depicted at Figure 4.
0
10000
20000
30000
40000
50000
60000
70000
80000
90000
Export Import Trade Balance
7961
9
4726
1
3235
8
8033
3
4673
6
3359
7
Val
ue in
US$
Mill
ion
Figure 3: Services Trade Performance
Apr-Sept, 16
Apr-Sept, 17
12904 13430 13388 13178 13701 13732
7222 7615 7457 7334
8658 8450
5682 5815 5931 5844 5043 5282
0
2000
4000
6000
8000
10000
12000
14000
16000
Apr, 17 May, 17 June, 17 July, 17 Aug, 17 Sept, 17
Val
ue in
US$
Mill
ion
Figure 4: Trend of Services Trade during April, 17 to September, 17
Exports
Imports
Trade Balance

Monthly Bulletin on Foreign Trade November 2017 Page 4
A.3 India’s Overall Trade
In September 2017 India’s overall export was US$ 42,464 million as compared to US$ 36,541 million in September 2016, registering a positive growth of 16.21%. In September 2017 India’s import was US$ 46,078 million as compared to US$ 40,143 million in September 2016, registering a positive growth of 14.78%.
Figure 5 depicts the overall trade performance for the period April-September 2017 over the corresponding period of the previous year. It shows that total value of export for April-September, 2017 was US$ 226632 million as compared to US$ 211603 million during April-September 2016, registering a positive growth of 7.10%. The total value of import in April-September 2017 was US$ 267419 million as compared to US$ 222601 million during April-September 2016, registering a positive growth of 20.13%. As a result, overall trade deficit during April-September 2017 has increased as compared to April-September 2016.
The month-wise overall export, import, trade balance since April, 2015 is given in Table 3. The trend of overall export, import and trade balance over the months of April-September 2017 is depicted at Figure 6.
-50000
0
50000
100000
150000
200000
250000
300000
Export Import Trade Balance
2116
03
2226
01
-109
98
2266
32
2674
19
-407
87
Val
ue in
US$
Mill
ion
Figure 5: India's Overall Trade Performance
Apr-Sept, 16
Apr-Sept, 17
37496 37399 36496 35560 37218 42464
45431 45932 44440 41320
44219 46078
-7935 -8533 -7944 -5760 -7001 -3614
-20000
-10000
0
10000
20000
30000
40000
50000
Apr, 17 May, 17 June, 17 July, 17 Aug, 17 Sept, 17
Val
ue in
US$
Mill
ion
Figure 6: Trend of Overall Trade during April, 17 to September, 17
Exports
Imports
Trade Balance

Monthly Bulletin on Foreign Trade November 2017 Page 5
A.4 Sectoral Analysis of Merchandise Trade Based on Quick Estimates (QE)
The month-wise quick estimate of export for 30 major commodities since April, 2017 is given in Table 4 and the total quick estimate of export for April-October 2017 along with percentage change is given in Table 5. The trend of export of 10 major commodities over the months April-October, 2017 is depicted at Figure 7.
The month-wise quick estimate of import for 30 major commodities since April, 2017 is given in Table 6 and the total quick estimate of import for April-October 2017 along with percentage change is given in Table 7. The trend of import of 10 major commodities over the months of April-October, 2017 is depicted in Figure 8.
0
1000
2000
3000
4000
5000
6000
7000
8000
Apr, 17 May, 17 Jun, 17 Jul, 17 Aug, 17 Sept, 17 Oct, 17
Val
ue o
f Exp
ort (
US$
Mill
ion)
Figure 7: Trend of Export values of Major Commodities
Engineering Goods
Gems And Jewellery
Petroleum Products
Organic And Inorganic Chemicals
Drugs And Pharmaceuticals
RMG Of All Textiles
Cotton Yarn/Fabs./Madeups, Handloom Products Etc.
Marine Products
Plastic And Linoleum
Rice

Monthly Bulletin on Foreign Trade November 2017 Page 6
B. India’s Merchandise Trade Based on Provisional Estimates (PE) Provisional estimates of merchandise trade data are based on 168 principal commodities and countries.
B.1 Export Scenario
B.1.2 Export by Principal Commodities
During April-October 2017, the highest export of US$ 20,012 million was recorded in Petroleum Products which constitute the largest share of 11.82% in India’s total export. The top ten principal commodities of export during April-October 2017 along with percentage share are (i) Petroleum Products (11.82%) (ii) Pearl, Precious, Semiprecious Stones (8.85%), (iii) Gold & Other Precious Metal Jewellery (4.39%), (iv) Drug Formulations, Biologicals (4.28%), (v) Iron And Steel (3.63%), (vi) RMG Cotton Incl Accessories (2.80%), (vii) Marine Products (2.64%), (viii) Motor Vehicle/Cars (2.55%), (ix) Products of Iron and Steel (2.24%) and (x) Organic Chemicals (2.16%) and these top 10 principal commodities together accounted for about 45% of India’s total export.
The value of export of top 40 principal commodities along with the percentage change is given at Table 8.
0
1000
2000
3000
4000
5000
6000
7000
8000
9000
10000
Apr, 17 May, 17 Jun, 17 Jul, 17 Aug, 17 Sept, 17 Oct, 17
Val
ue o
f Im
port
(US$
Mill
ion)
Figure 8: Trend of Import values of Major Commodities
Petroleum, Crude & products
Electronic goods
Gold
Machinery, electrical & non-electrical
Coal, Coke & Briquettes, etc.
Pearls, precious & Semi-precious stones
Organic & Inorganic Chemicals
Transport equipment
Artificial resins, plastic materials, etc.
Iron & Steel

Monthly Bulletin on Foreign Trade November 2017 Page 7
Figure 9 depicts the percentage change in top ten principal commodities during April-October 2017 as compared to the corresponding period of the previous year. It shows that the highest growth of 58.46% registered in export of commodity Iron and Steel among the top ten principal commodities followed by Organic Chemicals (38.23%), Marine Products (29.08%), Petroleum Products (16.45%) and Products of Iron and Steel (14.43%).
Three Major Destinations of Export of Top 10 Principal Commodities:
Following Table depicts the top three destinations of export of the respective commodity along with the percentage share:
S. No.
Principal Commodities Major Destinations
1 Petroleum Products Singapore (20.18%)
U Arab Emts (11.46%)
U S A (6.45%)
2 Pearl, Precious, Semiprecious Stones Hong Kong (39.92%)
U S A (29.98%)
U Arab Emts (8.97%)
3 Gold and Other Precious Metal Jewellery U Arab Emts (42.59%)
Hong Kong (27.99%)
U S A (20.12%)
4 Drug Formulations, Biologicals U S A (36.05%)
South Africa (3.55%)
U K (3.28%)
5 Iron And Steel Italy (8.29%)
Nepal (7.31%)
Belgium (6.78%)
6 RMG Cotton Incl Accessories U S A (25.94%)
U K (11.95%)
U Arab Emts (9.51%)
7 Marine Products U S A (34.35%)
Vietnam Soc Rep (26.75%)
Japan (6.91%)
8 Motor Vehicle/Cars Mexico (24.10%)
South Africa (10.93%)
Indonesia (4.41%)
9 Products Of Iron And Steel U S A (25.22%)
U Arab Emts (6.34%)
Germany (5.77%)
10 Organic Chemicals China P RP (20.96%)
U S A (9.37%)
Saudi Arab (8.11%)
1718
6
1546
6
7382
7466
3882
4838
3470
4320
3321
2648
2001
2
1499
1
7431
7250
6152
4745
4479
4327
3800
3661
16.45
-3.07
0.66
-2.90
58.46
-1.91
29.08
0.16
14.43
38.23
-10
0
10
20
30
40
50
60
70
-3200
1800
6800
11800
16800
21800
Perc
enta
ge C
hang
e
Val
ue o
f Exp
ort (
US$
Mill
ion)
Figure 9: Export of Top 10 Commodities during April-October 2017
Apr-Oct 2016 Apr-Oct 2017(P) % Change

Monthly Bulletin on Foreign Trade November 2017 Page 8
B.1.3 India’s Export: Region-wise
India’s export is made to the Regions of (i) Asia, (ii) America, (iii) Africa, (iv) Europe, (v) Commonwealth of Independent States (CIS) & Baltics and (vi) Unspecified Region. The value of India’s export to various Regions during April-October 2017 along with percentage change is given at Table 12.
The percentage share of various Regions in India’s total export during the period of April-October 2017 is given in Figure 10. It shows that Asia Region constitute the highest share of 49.39% in India’s total export followed by America Region with 21.09% during April-October, 2017.
The detailed profile of export to Asia Region is given in the following Table. It reveals that the highest export of US$ 23,363 million was recorded to West Asia-Gulf Cooperation Council (West Asia-GCC) during April-October, 2017 and it constitutes the share of 13.80% followed by NE Asia (US$ 21,889 million) which constitutes the share of 12.93% in India’s total export.
India’s Export to Asia Region (Value in US$ Million)
Asia Region April-Oct, 16 %Share April-Oct, 17 (P) %Share % Change
West Asia- GCC 24,571.25 15.82 23,362.99 13.80 -4.92
NE Asia 18,311.27 11.79 21,889.09 12.93 19.54
ASEAN 15,597.96 10.04 19,192.82 11.33 23.05
South Asia 10,369.64 6.68 11,547.64 6.82 11.36
Other West Asia 4,480.33 2.88 4,986.73 2.94 11.30
East Asia (Oceania) 1,989.78 1.28 2,670.47 1.58 34.21 Total export to Asia Region 75,320.23 48.49 83,649.74 49.39 11.06
Europe 19.24%
Africa 8.37%
America 21.09%
Asia 49.39%
CIS & Baltics 1.04%
Unspecified Region 0.87%
Figure 10 : Region-wise share in India's Export during April-October 2017

Monthly Bulletin on Foreign Trade November 2017 Page 9
Figure 11 shows the comparative picture of export to various Regions during April-October 2017 over the corresponding period of previous year. It shows that the highest positive growth of 12.39% was registered in export to Region CIS & Baltics followed by Asia (11.06%) during April-October, 2017 over the corresponding period of previous year.
B.1.4 Export by Destination
During April-October 2017, the highest export of US$ 27,204 million was recorded to destination USA which constitutes the largest share of 16.06% in India’s total export. The top ten destinations of export during April-October 2017 along with percentage share are (i) USA (16.06%) (ii) UAE (10.14%), (iii) Hong Kong (5.22%), (iv) China PRP (3.98%), (v) Singapore (3.72%), (vi) UK (3.11%), (vii) Germany (2.82%), (viii) Vietnam Soc Republic (2.51%), (ix) Bangladesh PR (2.48%) and (x) Nepal (1.95%) and these top 10 destinations together accounted for about 52% of India’s total export.
The value of export to top 40 destinations along with percentage change is given at Table 10.
Figure 12 depicts the comparative picture of export to top ten destinations during April-October, 2017 over the period of April-October, 2016. It shows that the highest growth of 43.97% was registered in export to China PRP followed by Singapore (31.82%), Vietnam Soc Rep (24.42%), Bangladesh PR (19.03%) and Germany (16.80%) during April-October, 2017.
3003
5
1337
9
3242
5
7532
0
1563
3258
1
1418
2
3571
1
8365
0
1756
8.48
6.00
10.13 11.06
12.39
0
2
4
6
8
10
12
14
0
10000
20000
30000
40000
50000
60000
70000
80000
90000
Europe Africa America Asia CIS & Baltics
Perc
enm
tage
Cha
nge
Val
ue o
f Exp
ort (
US$
Mill
ion)
Figure 11 : India's Export by Region
Apr-Oct 2016 Apr-Oct 2017(P) % Change

Monthly Bulletin on Foreign Trade November 2017 Page 10
Top Three Major Principal Commodities exported to top ten Destinations:
Following Table depicts the top three principal commodities of export of the respective destination along with the percentage share:
S. No. Destinations Major Principal Commodities
1 U S A Pearl, Precious, Semiprecious
Stones (16.52%)
Drug Formulations, Biologicals
(9.61%)
Marine Products (5.65%)
2 U Arab Emts Gold & Other Precious Metal
Jewellery (18.45%)
Petroleum Products (13.36%)
Gold (11.61%)
3 Hong Kong Pearl, Precious, Semiprecious
Stones (67.65%)
Gold & Other Precious Metal Jewellery
(23.51%)
Finished Leather (1.46%)
4 China P RP Copper & Products Made Of
Copper (11.64%)
Organic Chemicals (11.39%)
Petroleum Products (8.84%)
5 Singapore Petroleum Products (64.12%)
Ship, Boat And Floating Structure (5.89%)
Pearl, Precious, Semiprecious Stones
(2.54%)
6 U K RMG Cotton Incl Accessories (10.77%)
RMG Manmade Fibers (4.82%)
Drug Formulations, Biologicals
(4.51%)
7 Germany Electric Machinery And
Equipment (9.65%)
RMG Cotton Incl Accessories
(7.50%)
Products Of Iron And Steel
(4.59%)
8 Vietnam Soc Rep Marine Products (28.25%)
Buffalo Meat (27.73%)
Iron And Steel (8.23%)
9 Bangladesh PR Cotton Yarn (8.34%)
Rice (Other Than Basmati) (7.39%)
Other Commodities (6.79%)
10 Nepal Petroleum Products (19.65%)
Iron And Steel (13.61%)
Motor Vehicle/Cars (4.26%)
2512
0
1856
6
8211
4679
4778
5112
4093
3410
3534
3051
2720
4
1716
5
8847
6736
6299
5263
4781
4242
4207
3306
8.29
-7.55
7.75
43.97
31.82
2.96
16.80
24.42
19.03
8.36
-20
-10
0
10
20
30
40
50
-13000
-8000
-3000
2000
7000
12000
17000
22000
27000
32000
Perc
enta
ge C
hang
e
Val
ue o
f Exp
ort (
US$
Mill
ion)
Figure 12: Top 10 Destinations of Exports during April-October 2017
Apr-Oct 2016 Apr-Oct 2017(P) % Change

Monthly Bulletin on Foreign Trade November 2017 Page 11
B.2 Import Scenario
B.2.2 Import by Principal Commodities
During April-October, 2017, the highest import of US$ 45,018 million was recorded for the commodity Petroleum crude which constitutes the largest share of 17.46% in India’s total import. The top ten principal commodities of import during April-October 2017 along with percentage share are (i) Petroleum: Crude (17.46%), (ii) Gold (7.73%), (iii) Pearl, Precious, Semiprecious Stones (7.59%), (iv) Telecom Instruments (4.95%), (v) Coal, Coke and Briquettes etc (4.76%), (vi) Petroleum Products (4.18%), (vii) Vegetable Oils (2.81%), (viii) Organic Chemicals (2.63%), (ix) Plastic Raw Materials (2.42%) and (x) Iron and Steel (2.41%) and these top 10 principal commodities together accounted for about 57% of India’s total import.
The value of import of top 40 principal commodities along with percentage change is given at Table 9.
Figure 13 depicts the percentage change in top ten principal commodities during April-October, 2017 over the corresponding period of previous year. It shows that the highest growth of 74.36% was registered in import of commodity Gold among these top ten commodities followed by Coal, Coke and Briquettes etc. (58.96%), Telecom Instruments (43.27%), Pearl, Precious, Semiprecious Stones (43.25%) and Iron and Steel (33.41%).
3779
2
1142
8
1366
2
8904
7713
8997
6211
5562
5246
4653
4501
8
1992
6
1957
1
1275
7
1226
1
1076
9
7234
6792
6233
6208
19.12
74.36
43.25 43.27
58.96
19.69
16.48 22.11 18.80
33.41
0
10
20
30
40
50
60
70
80
0
5000
10000
15000
20000
25000
30000
35000
40000
45000
50000
Perc
enta
ge C
hang
e
Val
ue o
f Im
port
(US$
Mill
ion)
Figure 13 : Imports of Top 10 Commodities during April-October 2017
Apr-Oct 2016 Apr-Oct 2017(P) % Change

Monthly Bulletin on Foreign Trade November 2017 Page 12
Three Major Sources of Import of Top ten Principal Commodities:
Following Table depicts the top three sources of import of the respective commodity along with percentage share:
S. No. Principal Commodities Major Sources
1 Petroleum: Crude Iraq (19.39%)
Saudi Arab (17.71%)
Iran (10.03%)
2 Gold Switzerland (51.57%)
U Arab Emts (12.50%)
Ghana (6.18%)
3 Pearl, Precious, Semiprecious Stones Hong Kong (20.10%)
U Arab Emts (15.81%)
Belgium (12.36%)
4 Telecom Instruments China P RP (70.7%)
Korea RP (7.10%)
Vietnam Soc Rep (3.45%)
5 Coal,Coke And Briquettes Etc Australia (36.85%)
Indonesia (27.54%)
South Africa (13.27%)
6 Petroleum Products Qatar (28.42%)
U Arab Emts (14.05%)
Saudi Arab (13.33%)
7 Vegetable Oils Indonesia (43.45%)
Argentina (21.17%)
Malaysia (14.07%)
8 Organic Chemicals China P RP (23.23%)
Saudi Arab (12.47%)
Singapore (10.84%)
9 Plastic Raw Materials Korea RP (11.81%)
China P RP (10.94%)
Saudi Arab (9.66%)
10 Iron And Steel Korea RP (21.72%)
China P RP (17.67%)
Japan (11.20%)
B.2.3 India’s Import: Region-wise
India’s import is made from the Regions of (i) Asia, (ii) America, (iii) Africa, (iv) Europe, (v) Commonwealth of Independent States (CIS) & Baltics and (vi) Unspecified Region.
The value of India’s import from various Regions during April-October 2017 along with percentage change is given at Table 13. The percentage share of various Regions in India’s total import during the period of April-October, 2017 is depicted at Figure 14. It shows that the Asia Region constitutes the highest share of 60.49% in India’s total import followed by Europe Region with 14.78% during April-October 2017.
Europe 14.78%
Africa 7.94%
America 11.81%
Asia 60.49%
CIS & Baltics 2.85% Unspecified Region
2.13%
Figure 14: Region-wise share in India's import during April-October 2017

Monthly Bulletin on Foreign Trade November 2017 Page 13
The detailed profile of import from Asia Region is given in the following Table. It reveals that the highest import of US$ 68,196 million was recorded from NE Asia during April-October 2017 and it constitutes the share of 26.45% in India’s total import.
India’s Import from Asia Region (Value in US$ Million) Asia Region Apr-Oct, 16 %Share Apr-Oct, 17 (P) %Share % Change NE Asia 53,798.26 25.64 68,196.00 26.45 26.76 West Asia- GCC 30,388.94 14.48 35,116.87 13.62 15.56 ASEAN 22,609.22 10.77 26,596.18 10.32 17.63 Other West Asia 13,395.16 6.38 16,187.23 6.28 20.84 East Asia (Oceania) 5,176.07 2.47 8,142.97 3.16 57.32 South Asia 1,703.01 0.81 1,698.76 0.66 -0.25
Total Import from Asia Region 1,27,070.66 60.56 1,55,938.01 60.49 22.72
Figure 15 shows the comparative picture of import from various Regions during April-October, 2017 as compared to the corresponding period of previous year. It shows that the highest positive growth of 61.68% was registered in import from Region CIS & Baltics followed by Africa (34.79%) during April-October, 2017 over the corresponding period of previous year. However, the highest import of India is recorded from Region Asia.
B.2.4 Import from Sources
During April-October 2017, the highest import of US$ 43,465 million was recorded from China PRP which constitutes the largest share of 16.86% in India’s total import. The top ten sources of import during April-October 2017 along with percentage share are (i) China PRP (16.86%) (ii) USA (5.47%), (iii) UAE (5.01%), (iv) Saudi Arab (4.65%), (v) Switzerland (4.38%), (vi) Korea RP (3.84%), (vii) Indonesia (3.65%), (viii) Iraq (3.39%) (ix) Australia (2.96%) and (x) Germany (2.88%) and these top ten sources together accounted for about 53% in India’s total import.
The value of import from top 40 sources along with percentage change is given at Table 11.
3310
7
1518
7
2531
2
1270
71
4531
3811
4
2047
0
3045
2
1559
38
7326
15.12
34.79
20.31 22.72
61.68
0
10
20
30
40
50
60
70
0
20000
40000
60000
80000
100000
120000
140000
160000
180000
Europe Africa America Asia CIS & Baltics
Perc
enta
ge C
hang
e
Val
ue o
f Exp
ort (
US$
Mill
ion)
Figure 15 : India's Import by Region
Apr-Oct 2016 Apr-Oct 2017(P) % Change

Monthly Bulletin on Foreign Trade November 2017 Page 14
Figure 16 depicts the comparative picture of import from top 10 sources during April-October, 2017 over the period of April-October, 2016. It shows that the highest positive growth of 60.15% was registered in import from Australia followed by, Korea RP (45.78%), Switzerland (42.62%), Iraq (40.69%) and Indonesia (36.67%) during April-October, 2017.
Top Three Major Principal Commodities imported from Top ten Sources:
Following Table depicts the top three principal commodities of import of the respective source along with the percentage share:
S. No. Sources Major Principal Commodities imported
1 China P Rp Telecom Instruments (20.75%)
Electronics Components (6.95%)
Computer Hardware, Peripherals
(6.62%)
2 U S A Electric Machinery And
Equipment (8.9%)
Gold (8.54%)
Petroleum Products (5.8%)
3 U Arab Emts Petroleum: Crude (28.02%)
Pearl, Precs, Semiprecs Stones
(23.92%)
Gold (19.28%)
4 Saudi Arab Petroleum: Crude (66.59%)
Petroleum Products (11.98%)
Organic Chemicals (7.07%)
5 Switzerland Gold (90.92%)
Indl. Machinery for Dairy (1.12%)
Other Misc. Engineering Items (0.82%)
6 Korea Rp Gold & Other Precious
Metal Jewellery (14.19%)
Iron And Steel (13.62%)
Telecom Instruments (9.15%)
7 Indonesia Coal, Coke & Briquettes Etc (35.91%)
Vegetable Oils (33.4%)
Bulk Minerals And Ores (4.56%)
8 Iraq Petroleum: Crude (99.81%)
Fresh Fruits (0.14%)
Finished Leather (0.04%)
9 Australia Coal,Coke & Briquettes Etc (59.14%)
Pulses (7.78%)
Petroleum Products (4.83%)
10 Germany Indl. Machinery For Dairy (13.3%)
Auto Components/Parts (6.35%)
Electric Machinery And Equipment (5.71%)
3498
9
1243
9
1160
0
1104
8
7925
6794
6882
6216
4771
6626
4346
5
1409
7
1292
8
1197
6
1130
2
9904
9405
8745
7641
7419
24.23
13.32 11.45 8.39
42.62 45.78
36.67 40.69
60.15
11.96 0
10
20
30
40
50
60
70
0
5000
10000
15000
20000
25000
30000
35000
40000
45000
50000
Perc
enta
ge C
hang
e
Val
ue o
f Im
port
(US$
Mill
ion)
Figure 16 : Top 10 Sources of Import during April-October 2017
Apr-Oct 2016 Apr-Oct 2017(P) % Change

Monthly Bulletin on Foreign Trade November 2017 Page 15
Table 1: India’s month-wise Merchandise Trade (US$ Millions)
2015-16 2016-17 2017-18
Months Export Import Trade Balance Export Import Trade
Balance Export Import Trade Balance
April 22137 33507 -11370 20863 25689 -4826 24592 38209 -13617
May 22529 32838 -10309 22407 28286 -5879 23969 38317 -14348
June 22324 33536 -11212 22656 30917 -8261 23108 36983 -13875
July 23281 36372 -13091 21692 29305 -7613 22382 33986 -11604
August 21583 33982 -12399 21597 29303 -7706 23517 35561 -12044
September 21869 32035 -10166 22768 31839 -9071 28732 37628 -8896
October 21456 31148 -9692 23361 34495 -11134 23098 37117 -14019
November 19561 29896 -10335 20066 33462 -13396
December 22593 34096 -11503 24056 34602 -10546
Jan 21199 28867 -7668 22356 32261 -9905
Feb 20846 27419 -6573 24727 34248 -9522
March 22912 27310 -4398 29302 39947 -10645
Total 262290 381006 -118716 275852 384356 -108504 169397 257800 -88403 Source: DGCI&S, Kolkata Note: Quick estimates data is available upto October, 2017
Table 2: India’s month-wise Services Trade
(US$ Millions) 2015-16 2016-17 2017-18
Months Export Import Trade Balance Export Import Trade
Balance Export Import Trade Balance
April 13012 7324 5688 12908 7183 5725 12,904 7222 5682
May 11874 6318 5556 13460 7922 5538 13430 7615 5815
June 12765 7522 5243 13322 8389 4933 13388 7457 5931
July 13386 7502 5884 12775 7409 5366 13178 7334 5844
August 13580 7773 5807 13381 8054 5327 13701 8658 5043
September 13321 7457 5864 13773 8304 5469 13732 8450 5282
October 13344 7013 6331 13113 7680 5433 November 12019 5686 6333 13338 8323 5015 December 14038 7187 6851 13804 8294 5510 Jan 12573 6841 5732 13570 8409 5161 Feb 12329 7189 5140 13060 7235 5825 March 12895 7905 4990 14179 8267 5912 Total 155136 85717 69419 160683 95469 65214 80333 46736 33597
Source: Press Releases, RBI Note: Data on trade in services is available upto September, 2017

Monthly Bulletin on Foreign Trade November 2017 Page 16
Table 3: India’s month-wise Overall Trade (Merchandise plus Services)
(US$ Millions)
2015-16 2016-17 2017-18
Months Export Import Trade Balance Export Import Trade
Balance Export Import Trade Balance
April 35149 40831 -5682 33771 32872 899 37496 45431 -7935
May 34403 39156 -4753 35867 36208 -341 37399 45932 -8533
June 35089 41058 -5969 35978 39306 -3328 36496 44440 -7944
July 36667 43874 -7207 34467 36714 -2247 35560 41320 -5760
August 35163 41755 -6592 34978 37357 -2379 37218 44219 -7001
September 35190 39492 -4302 36541 40143 -3602 42464 46078 -3614
October 34800 38161 -3361 36474 42175 -5701
November 31580 35582 -4002 33404 41785 -8381
December 36631 41283 -4652 37860 42896 -5036
Jan 33772 35708 -1936 35926 40670 -4744
Feb 33175 34608 -1433 37787 41483 -3697
March 35807 35215 592 43481 48214 -4733
Total 417426 466723 -49297 436535 479825 -43290 226632 267419 -40787
Source: DGCI&S and RBI

Monthly Bulletin on Foreign Trade November 2017 Page 17
Table 4: India’s Merchandise Export of QE Groups: Month-wise
(Value in US$ Million) S.
No. QE Groups Apr, 17 May, 17 Jun, 17 Jul, 17 Aug, 17
1 Engineering Goods 6090.31 6254.19 5911.80 5818.51 6006.35
2 Gems And Jewellery 3971.38 3938.33 3413.71 2543.01 2678.11
3 Petroleum Products 2947.17 2562.30 2590.88 2980.71 3397.78
4 Organic And Inorganic Chemicals 1261.68 1282.97 1375.21 1431.75 1479.46
5 Drugs And Pharmaceuticals 1296.01 1206.84 1378.30 1392.00 1423.60
6 RMG of All Textiles 1747.54 1605.57 1548.55 1281.21 1337.59
7 Cotton Yarn/Fabs./Madeups, Handloom Products Etc. 776.03 756.85 794.17 796.84 839.80
8 Marine Products 485.24 547.13 584.01 678.38 661.41
9 Plastic And Linoleum 516.79 497.89 490.30 526.37 541.92
10 Rice 568.76 639.37 754.87 600.69 588.98
11 Meat, Dairy And Poultry Products 299.62 316.33 361.69 325.53 421.26
12 Electronic Goods 507.54 531.94 515.00 478.85 480.34
13 Leather And Leather Manufactures 403.39 418.45 466.16 495.41 458.07
14 Man-Made Yarn/Fabs./Madeups Etc. 408.07 372.89 371.89 379.21 403.61
15 Mica, Coal And Other Ores, Minerals Including Process 341.63 311.54 270.08 276.37 278.16
16 Spices 275.28 257.93 232.06 227.62 255.97
17 Fruits And Vegetables 231.35 176.07 144.19 163.42 164.02
18 Ceramic Products And Glassware 170.69 175.72 175.86 171.48 180.60
19 Handicrafts Excl. Hand Made Carpet 147.48 148.25 149.09 154.79 148.00
20 Iron Ore 170.58 108.26 63.41 116.78 130.62
21 Cereal Preparations And Miscellaneous Processed Item 110.99 110.88 120.41 100.91 114.46
22 Carpet 119.20 122.16 113.00 105.53 132.01
23 Oil Seeds 100.77 70.32 74.01 89.76 81.79
24 Cashew 76.73 83.86 84.69 89.76 86.10
25 Tobacco 83.18 72.81 64.88 48.04 83.82
26 Tea 49.77 49.60 58.91 64.34 81.54
27 Oil Meals 95.98 69.51 64.07 41.28 94.35
28 Coffee 92.43 86.57 92.37 74.62 85.31
29 Other Cereals 12.97 14.80 15.68 14.32 12.42
30 Jute Mfg. Including Floor Covering 25.89 25.25 27.19 28.74 35.99
Total 23384.42 22814.60 22306.46 21496.22 22683.44
Others 1250.55 1261.29 1179.64 1044.63 1135.39
India’s Total Export 24634.97 24075.89 23486.10 22540.85 23818.83 Source: DGCI&S, Kolkata(P: Provisional) (Note: The analysis is based on the Quick Estimates Groups of commodities, data is available upto October, 2017)

Monthly Bulletin on Foreign Trade November 2017 Page 18
Table 4 (contd.): India’s Merchandise Export of QE Groups: Month-wise
(Value in US$ Million)
S. No. QE Groups Sept, 17 Oct, 17
1 Engineering Goods 7325.36 5916.46
2 Gems And Jewellery 4780.08 3308.30
3 Petroleum Products 3595.51 3185.25
4 Organic And Inorganic Chemicals 1684.74 1444.86
5 Drugs And Pharmaceuticals 1596.88 1343.16
6 RMG of All Textiles 1661.66 829.44
7 Cotton Yarn/Fabs./Madeups, Handloom Products Etc. 917.37 825.12
8 Marine Products 789.25 734.37
9 Plastic And Linoleum 565.04 546.66
10 Rice 580.64 496.93
11 Meat, Dairy And Poultry Products 402.29 467.26
12 Electronic Goods 571.05 460.70
13 Leather And Leather Manufactures 475.35 369.24
14 Man-Made Yarn/Fabs./Madeups Etc. 465.05 354.87
15 Mica, Coal And Other Ores, Minerals Including Process 293.78 241.65
16 Spices 264.04 220.56
17 Fruits And Vegetables 173.41 153.18
18 Ceramic Products And Glassware 187.07 150.36
19 Handicrafts Excl. Hand Made Carpet 173.12 134.86
20 Iron Ore 91.26 115.17
21 Cereal Preparations And Miscellaneous Processed Item 125.22 112.18
22 Carpet 144.98 102.53
23 Oil Seeds 69.03 84.97
24 Cashew 68.22 81.61
25 Tobacco 92.09 79.41
26 Tea 85.89 71.26
27 Oil Meals 60.57 64.67
28 Coffee 79.23 61.05
29 Other Cereals 18.79 23.75
30 Jute Mfg. Including Floor Covering 31.96 23.09
Total 27368.93 22002.92
Others 1244.48 1095.26
India’s Total Export 28613.41 23098.18 Source: DGCI&S, Kolkata (P: Provisional) (Note: The analysis is based on the Quick Estimates Groups of commodities, latest available upto October, 2017)

Monthly Bulletin on Foreign Trade November 2017 Page 19
Table 5: India’s Merchandise Export of QE Groups
(Value in US$ Million)
S.No. QE Groups Apr-Oct, 16 % Share Apr- Oct, 17 % Share % Change
1 Engineering Goods 36270.82 23.35 43292.54 25.42 19.36
2 Gems & Jewellery 26602.41 17.12 24649.87 14.48 -7.34
3 Petroleum Products 17185.67 11.06 21355.66 12.54 24.26
4 RMG of all Textiles 9820.75 6.32 10012.04 5.88 1.95
5 Organic & Inorganic Chemicals 7977.12 5.14 9968.71 5.85 24.97
6 Drugs & Pharmaceuticals 9846.69 6.34 9627.77 5.65 -2.22
7 Cotton Yarn/Fabs./made-ups, Handloom Products etc. 5483.21 3.53 5698.68 3.35 3.93
8 Marine Products 3470.03 2.23 4474.79 2.63 28.96
9 Rice 3231.21 2.08 4241.21 2.49 31.26
10 Plastic & Linoleum 3301.32 2.13 3692.79 2.17 11.86
11 Electronic Goods 3438.79 2.21 3536.27 2.08 2.83
12 Leather & leather products 3068.39 1.98 3088.31 1.81 0.65
13 Man-made Yarn/Fabs./made-ups etc. 2637.34 1.70 2755.33 1.62 4.47
14 Meat, dairy & poultry products 2523.17 1.62 2594.25 1.52 2.82
15 Mica, Coal & Other Ores, Minerals including processed minerals 1956.58 1.26 1999.21 1.17 2.18
16 Spices 1644.38 1.06 1741.90 1.02 5.93
17 Ceramic products & glassware 1099.44 0.71 1211.77 0.71 10.22
18 Fruits & Vegetables 1304.21 0.84 1191.05 0.70 -8.68
19 Handicrafts excl. hand made carpet 1216.12 0.78 1060.50 0.62 -12.80
20 Carpet 858.80 0.55 841.23 0.49 -2.05
21 Iron Ore 557.12 0.36 805.26 0.47 44.54
22 Cereal preparations & miscellaneous processed items 767.57 0.49 794.41 0.47 3.50
23 Coffee 481.82 0.31 572.63 0.34 18.85
24 Cashew 396.61 0.26 572.57 0.34 44.37
25 Oil seeds 616.24 0.40 570.60 0.34 -7.41
26 Tobacco 555.95 0.36 523.52 0.31 -5.83
27 Oil Meals 267.64 0.17 466.26 0.27 74.21
28 Tea 410.71 0.26 460.81 0.27 12.20
29 Jute Mfg. including Floor Covering 171.20 0.11 197.48 0.12 15.35
30 Other cereals 120.86 0.08 111.90 0.07 -7.41
Total 147282.17 94.81 162109.32 95.20 10.07
Others 8062.23 5.19 8177.23 4.80 1.43
India’ Total Export 155344.40 100.00 170286.55 100.00 9.62 Source: DGCI&S, Kolkata (P: Provisional) (Note: The analysis is based on the Quick Estimates Groups of commodities, latest available upto October, 2017)

Monthly Bulletin on Foreign Trade November 2017 Page 20
Table 6: India’s Merchandise Import of QE Groups: Month-wise
(Value in US$ Million) S.
No. QE Groups Apr, 17 May, 17 Jun, 17 Jul, 17 Aug, 17
1 Petroleum, Crude & products 7359.27 7692.71 8125.51 7844.94 7754.75
2 Electronic goods 4436.53 4158.72 4278.40 4048.84 4626.12
3 Gold 3853.10 4958.60 2453.92 2102.96 1889.39
4 Machinery, electrical & non-electrical 2656.67 2465.63 2462.28 2414.33 2624.78
5 Coal, Coke & Briquettes, etc. 1865.13 1846.15 1749.58 1540.31 1586.14
6 Pearls, precious & Semi-precious stones 3685.40 2952.51 3341.39 2252.44 1857.40
7 Organic & Inorganic Chemicals 1689.84 1636.38 1684.78 1613.19 1566.53
8 Transport equipment 1186.56 1036.83 1368.84 1062.01 1227.22
9 Artificial resins, plastic materials, etc. 1282.12 1217.29 1189.09 1144.51 1199.50
10 Iron & Steel 1008.79 1060.99 1133.04 1333.58 1375.33
11 Non-ferrous metals 992.93 1028.09 992.62 1004.19 1004.01
12 Vegetable Oil 1020.81 1081.51 1033.56 1053.95 1043.69
13 Metaliferrous ores & other minerals 595.06 609.23 597.04 655.53 718.89
14 Fertilisers, Crude & manufactured 308.82 493.98 563.08 525.64 517.66
15 Chemical material & products 494.36 543.40 540.96 516.17 514.01
16 Medcnl. & Pharmaceutical products 415.15 444.97 426.84 379.90 415.08
17 Wood & Wood products 467.23 494.41 506.08 484.38 524.33
18 Professional instrument, Optical goods, etc. 372.34 343.31 362.85 366.09 351.15
19 Silver 352.85 442.91 178.04 175.83 269.54
20 Machine tools 304.26 248.91 247.47 251.06 265.79
21 Project goods 201.62 152.92 124.96 116.53 187.74
22 Dyeing/tanning/colouring materials. 247.31 237.87 211.59 251.85 220.76
23 Pulses 289.44 295.90 352.07 327.93 324.19
24 Fruits & vegetables 199.17 181.03 140.13 98.67 140.78
25 Textile yarn Fabric, made-up articles 151.90 158.74 155.32 136.94 141.85
26 Pulp and Waste paper 101.36 103.94 89.83 76.17 118.33
27 Leather & leather products 79.37 85.66 86.43 79.66 87.30
28 Newsprint 61.44 74.99 65.01 70.61 86.89
29 Cotton Raw & Waste 59.65 115.10 160.90 141.84 152.90
30 Sulphur & Unroasted Iron Pyrts 7.01 7.48 11.59 7.50 16.06
Total 35745.49 36170.16 34633.20 32077.55 32808.11
Others 2138.79 1686.18 1889.28 1916.06 2654.67
India’s Total Import 37884.28 37856.34 36522.48 33993.61 35462.78 Source: DGCI&S, Kolkata (P: Provisional) (Note: The analysis is based on the Quick Estimates Groups of commodities, latest available upto October, 2017)

Monthly Bulletin on Foreign Trade November 2017 Page 21
Table 6 (contd.): India’s Merchandise Import of QE Groups: Month-wise
(Value in US$ Million)
S. No. QE Groups Sept, 17 Oct, 17
1 Petroleum, Crude & products 8188.08 9286.74
2 Electronic goods 5169.78 4016.04
3 Gold 1711.49 2945.19
4 Machinery, electrical & non-electrical 2845.78 2652.78
5 Coal, Coke & Briquettes, etc. 1638.01 2022.48
6 Pearls, precious & Semi-precious stones 3127.20 1759.84
7 Organic & Inorganic Chemicals 1553.65 1676.36
8 Transport equipment 1308.77 1535.21
9 Artificial resins, plastic materials, etc. 1239.78 1130.39
10 Iron & Steel 1296.13 1117.14
11 Non-ferrous metals 1112.70 1022.32
12 Vegetable Oil 1164.96 854.22
13 Metaliferrous ores & other minerals 719.03 840.56
14 Fertilisers, Crude & manufactured 520.30 587.48
15 Chemical material & products 541.87 513.17
16 Medcnl. & Pharmaceutical products 462.20 480.71
17 Wood & Wood products 566.95 473.94
18 Professional instrument, Optical goods, etc. 384.08 351.45
19 Silver 317.95 346.79
20 Machine tools 273.46 262.59
21 Project goods 208.34 251.31
22 Dyeing/tanning/colouring materials. 233.61 244.59
23 Pulses 264.30 238.41
24 Fruits & vegetables 189.85 207.75
25 Textile yarn Fabric, made-up articles 156.52 153.90
26 Pulp and Waste paper 98.68 109.59
27 Leather & leather products 83.76 79.02
28 Newsprint 81.12 65.95
29 Cotton Raw & Waste 144.87 31.69
30 Sulphur & Unroasted Iron Pyrts 14.95 6.95
Total 35618.17 35264.56
Others 1979.53 1852.45
India’s Total Import 37597.70 37117.01 Source: DGCI&S, Kolkata (P: Provisional) (Note: The analysis is based on the Quick Estimates Groups of commodities, latest available upto October, 2017)
Monthly Bulletin on Foreign Trade November 2017 Page 22
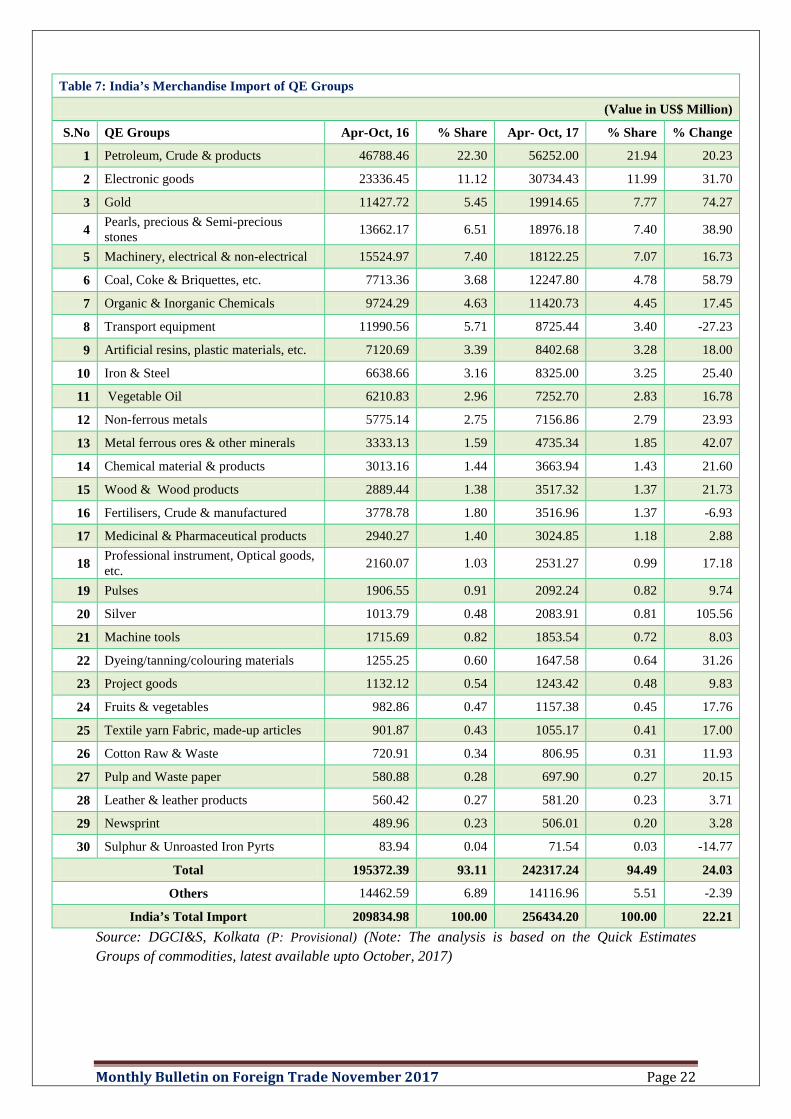
Table 7: India’s Merchandise Import of QE Groups
(Value in US$ Million)
S.No QE Groups Apr-Oct, 16 % Share Apr- Oct, 17 % Share % Change
1 Petroleum, Crude & products 46788.46 22.30 56252.00 21.94 20.23
2 Electronic goods 23336.45 11.12 30734.43 11.99 31.70
3 Gold 11427.72 5.45 19914.65 7.77 74.27
4 Pearls, precious & Semi-precious stones 13662.17 6.51 18976.18 7.40 38.90
5 Machinery, electrical & non-electrical 15524.97 7.40 18122.25 7.07 16.73
6 Coal, Coke & Briquettes, etc. 7713.36 3.68 12247.80 4.78 58.79
7 Organic & Inorganic Chemicals 9724.29 4.63 11420.73 4.45 17.45
8 Transport equipment 11990.56 5.71 8725.44 3.40 -27.23
9 Artificial resins, plastic materials, etc. 7120.69 3.39 8402.68 3.28 18.00
10 Iron & Steel 6638.66 3.16 8325.00 3.25 25.40
11 Vegetable Oil 6210.83 2.96 7252.70 2.83 16.78
12 Non-ferrous metals 5775.14 2.75 7156.86 2.79 23.93
13 Metal ferrous ores & other minerals 3333.13 1.59 4735.34 1.85 42.07
14 Chemical material & products 3013.16 1.44 3663.94 1.43 21.60
15 Wood & Wood products 2889.44 1.38 3517.32 1.37 21.73
16 Fertilisers, Crude & manufactured 3778.78 1.80 3516.96 1.37 -6.93
17 Medicinal & Pharmaceutical products 2940.27 1.40 3024.85 1.18 2.88
18 Professional instrument, Optical goods, etc. 2160.07 1.03 2531.27 0.99 17.18
19 Pulses 1906.55 0.91 2092.24 0.82 9.74
20 Silver 1013.79 0.48 2083.91 0.81 105.56
21 Machine tools 1715.69 0.82 1853.54 0.72 8.03
22 Dyeing/tanning/colouring materials 1255.25 0.60 1647.58 0.64 31.26
23 Project goods 1132.12 0.54 1243.42 0.48 9.83
24 Fruits & vegetables 982.86 0.47 1157.38 0.45 17.76
25 Textile yarn Fabric, made-up articles 901.87 0.43 1055.17 0.41 17.00
26 Cotton Raw & Waste 720.91 0.34 806.95 0.31 11.93
27 Pulp and Waste paper 580.88 0.28 697.90 0.27 20.15
28 Leather & leather products 560.42 0.27 581.20 0.23 3.71
29 Newsprint 489.96 0.23 506.01 0.20 3.28
30 Sulphur & Unroasted Iron Pyrts 83.94 0.04 71.54 0.03 -14.77
Total 195372.39 93.11 242317.24 94.49 24.03
Others 14462.59 6.89 14116.96 5.51 -2.39
India’s Total Import 209834.98 100.00 256434.20 100.00 22.21 Source: DGCI&S, Kolkata (P: Provisional) (Note: The analysis is based on the Quick Estimates Groups of commodities, latest available upto October, 2017)

Monthly Bulletin on Foreign Trade November 2017 Page 23
Table 8: India’s Export by Principal Commodity (Value in US$ Million)
S. No. Principal Commodities Apr-Oct, 16 % Share Apr-Oct, 17 % Share % Change 1 Petroleum Products 17,185.66 11.06 20,012.44 11.82 16.45 2 Pearl, Precious, Semiprecious Stones 15,465.96 9.96 14,991.24 8.85 -3.07
3 Gold & Other Precious Metal Jewellery 7,382.19 4.75 7,431.01 4.39 0.66
4 Drug Formulations, Biologicals 7,465.91 4.81 7,249.75 4.28 -2.90 5 Iron And Steel 3,882.19 2.50 6,151.88 3.63 58.46 6 RMG Cotton Incl Accessories 4,837.67 3.11 4,745.32 2.80 -1.91 7 Marine Products 3,470.04 2.23 4,479.12 2.64 29.08 8 Motor Vehicle/Cars 4,319.86 2.78 4,326.72 2.55 0.16 9 Products Of Iron And Steel 3,320.87 2.14 3,800.23 2.24 14.43
10 Organic Chemicals 2,648.26 1.70 3,660.78 2.16 38.23 11 Electric Machinery and Equipment 2,690.75 1.73 3,338.52 1.97 24.07 12 RMG Manmade Fibers 2,726.61 1.76 3,116.83 1.84 14.31 13 Cotton Fabrics, Madeups Etc. 3,041.82 1.96 3,113.64 1.84 2.36 14 Indl. Machinery For Dairy Etc 2,613.40 1.68 2,874.68 1.70 10.00 15 Auto Components/Parts 2,465.19 1.59 2,817.97 1.66 14.31 16 Manmade Yarn, Fabrics, Madeups 2,637.34 1.70 2,756.00 1.63 4.50 17 Aluminium, Products Of Aluminum 1,686.45 1.09 2,559.56 1.51 51.77 18 Residual Chemical And Allied Prod 2,175.79 1.40 2,437.02 1.44 12.01 19 Ship, Boat And Floating Structure 2,024.15 1.30 2,420.26 1.43 19.57 20 Rice -Basmati 1,817.08 1.17 2,355.79 1.39 29.65 21 Buffalo Meat 2,264.05 1.46 2,291.07 1.35 1.19 22 Gold 3,551.76 2.29 1,994.94 1.18 -43.83 23 Rice(Other Than Basmati) 1,414.15 0.91 1,993.98 1.18 41.00 24 Copper and Products Made of Copper 1,294.50 0.83 1,968.44 1.16 52.06 25 RMG of Other Textile Material 2,042.37 1.31 1,943.56 1.15 -4.84 26 Bulk Drugs, Drug Intermediates 1,952.37 1.26 1,941.29 1.15 -0.57 27 Cotton Yarn 1,702.29 1.10 1,784.80 1.05 4.85 28 Spices 1,644.38 1.06 1,743.40 1.03 6.02 29 Plastic Raw Materials 1,391.77 0.90 1,637.77 0.97 17.68 30 Ic Engines And Parts 1,262.11 0.81 1,467.57 0.87 16.28 31 Other Misc. Engineering Items 1,261.74 0.81 1,460.60 0.86 15.76 32 Aircraft, Spacecraft And Parts 1,900.21 1.22 1,302.20 0.77 -31.47 33 Agro Chemicals 1,130.93 0.73 1,301.16 0.77 15.05 34 Footwear Of Leather 1,247.28 0.80 1,259.58 0.74 0.99 35 Dyes 1,142.56 0.74 1,202.29 0.71 5.23 36 Electronics Components 1,060.67 0.68 1,169.21 0.69 10.23 37 Electronics Instruments 1,128.94 0.73 1,158.39 0.68 2.61 38 Granit, Natural Stone And Product 1,073.18 0.69 1,130.82 0.67 5.37 39 Two And Three Wheelers 948.88 0.61 1,130.61 0.67 19.15 40 Handcrafts(Excl.Handmade Carpets) 1,216.13 0.78 1,052.43 0.62 -13.46
Total 1,24,487.46 80.14 1,35,572.87 80.06 8.90 Others 30,856.95 19.86 33,776.53 19.94 9.46
India's total Export 1,55,344.41 100.00 1,69,349.40 100.00 9.02 Source: DGCI&S, Kolkata(P: Provisional) (Note: (i) Others includes remaining principal commodities including other commodities (ii) The above listed 40 principal commodities are fixed based on the top 40 principal commodities of export during the year 2016-17 )

Monthly Bulletin on Foreign Trade November 2017 Page 24
Table 9: India’s Import by Principal Commodity (Value in US$ Million)
S. No. Principal Commodities Apr-Oct, 16 % Share Apr-Oct, 17 % Share % Change
1 Petroleum: Crude 37,791.57 18.01 45,018.25 17.46 19.12 2 Gold 11,427.72 5.45 19,925.50 7.73 74.36 3 Pearl, Precious, Semiprecious Stones 13,662.18 6.51 19,570.83 7.59 43.25 4 Telecom Instruments 8,904.15 4.24 12,757.31 4.95 43.27 5 Coal, Coke and Briquettes Etc 7,713.37 3.68 12,261.18 4.76 58.96 6 Petroleum Products 8,996.89 4.29 10,768.65 4.18 19.69 7 Vegetable Oils 6,210.82 2.96 7,234.16 2.81 16.48 8 Organic Chemicals 5,562.20 2.65 6,792.05 2.63 22.11 9 Plastic Raw Materials 5,246.30 2.50 6,232.64 2.42 18.80
10 Iron And Steel 4,653.46 2.22 6,207.95 2.41 33.41 11 Indl. Machinery For Dairy etc 5,262.12 2.51 5,868.13 2.28 11.52 12 Electronics Components 4,145.85 1.98 5,674.83 2.20 36.88 13 Computer Hardware, Peripherals 3,996.68 1.90 4,645.45 1.80 16.23 14 Electric Machinery and Equipment 3,598.83 1.72 4,586.82 1.78 27.45 15 Electronics Instruments 3,339.26 1.59 4,019.70 1.56 20.38 16 Residual Chemical and Allied Product 2,973.35 1.42 3,588.43 1.39 20.69 17 Bulk Minerals and Ores 2,205.60 1.05 3,367.23 1.31 52.67 18 Fertilizers Manufactured 3,308.96 1.58 3,075.63 1.19 -7.05 19 Auto Components/Parts 2,381.60 1.13 2,856.83 1.11 19.95 20 Consumer Electronics 2,420.15 1.15 2,690.12 1.04 11.16 21 Copper and Products Made of Copper 1,984.80 0.95 2,660.07 1.03 34.02 22 Inorganic Chemicals 2,453.88 1.17 2,645.30 1.03 7.80 23 Aircraft, Spacecraft And Parts 4,468.24 2.13 2,627.01 1.02 -41.21 24 Aluminium, Products of Aluminum 2,080.19 0.99 2,520.01 0.98 21.14 25 Medical And Scientific Instrument 1,987.14 0.95 2,297.02 0.89 15.59 26 Products Of Iron And Steel 1,985.19 0.95 2,120.21 0.82 6.80 27 Pulses 1,906.55 0.91 2,084.84 0.81 9.35 28 Silver 1,013.79 0.48 2,081.62 0.81 105.33 29 Other Misc. Engineering Items 1,720.07 0.82 1,970.84 0.76 14.58 30 Paper, Paper Board And Product 1,474.31 0.70 1,906.97 0.74 29.35 31 Ship, Boat And Floating Structure 2,391.45 1.14 1,775.66 0.69 -25.75 32 Ac, Refrigeration Machinery Etc 1,610.55 0.77 1,761.79 0.68 9.39 33 Bulk Drugs, Drug Intermediates 1,596.28 0.76 1,663.80 0.65 4.23 34 Ic Engines And Parts 1,088.94 0.52 1,367.92 0.53 25.62 35 Machine Tools 1,260.96 0.60 1,323.16 0.51 4.93 36 Project Goods 1,132.13 0.54 1,251.53 0.49 10.55 37 Other Rubber Product Except Footwear 1,028.70 0.49 1,213.90 0.47 18.00 38 Other Construction Machinery 890.84 0.42 1,111.94 0.43 24.82 39 Fresh Fruits 925.45 0.44 1,075.54 0.42 16.22 40 Drug Formulations, Biologicals 1,001.81 0.48 988.25 0.38 -1.35
Total 1,77,802.33 84.73 2,23,589.07 86.73 25.75 Others 32,032.65 15.27 34,211.32 13.27 6.80
India's total Import 2,09,834.98 100.00 2,57,800.39 100.00 22.86 Source: DGCI&S, Kolkata(P: Provisional) (Note: (i) Others includes remaining principal commodities including other commodities (ii) The above listed 40 principal commodities are fixed based on the top 40 principal commodities of import during the year 2016-17)
Monthly Bulletin on Foreign Trade November 2017 Page 25
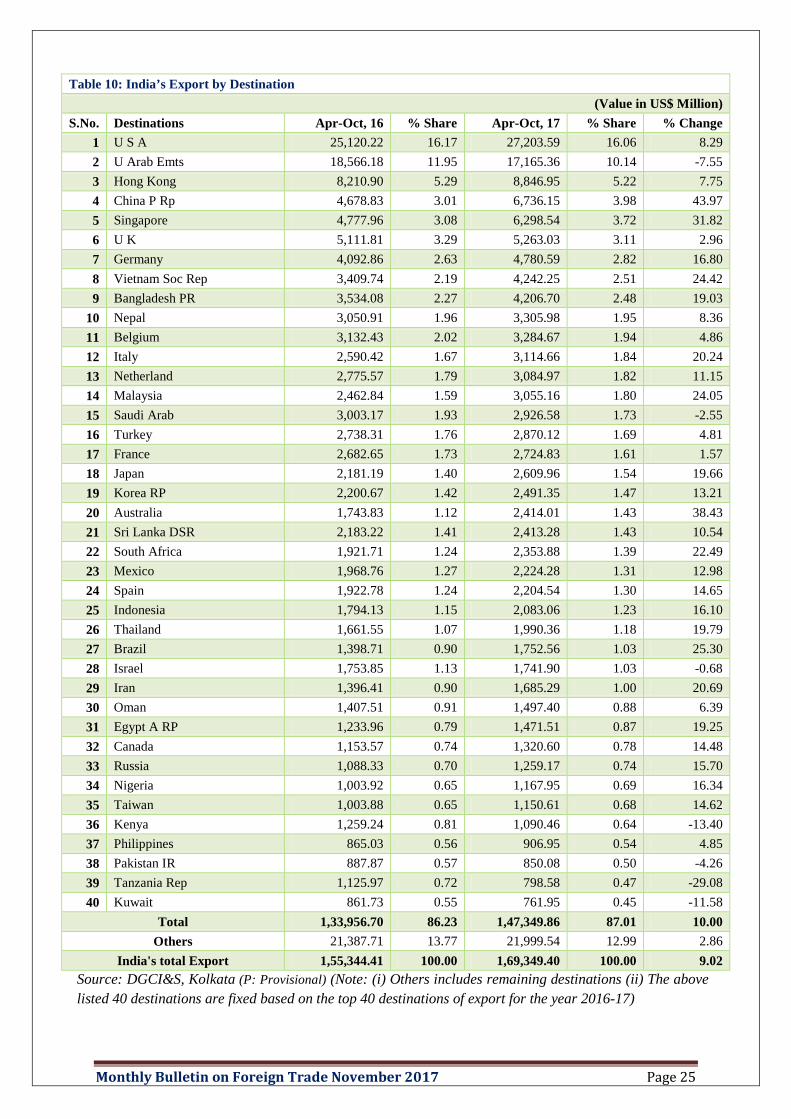
Table 10: India’s Export by Destination (Value in US$ Million)
S.No. Destinations Apr-Oct, 16 % Share Apr-Oct, 17 % Share % Change 1 U S A 25,120.22 16.17 27,203.59 16.06 8.29 2 U Arab Emts 18,566.18 11.95 17,165.36 10.14 -7.55 3 Hong Kong 8,210.90 5.29 8,846.95 5.22 7.75 4 China P Rp 4,678.83 3.01 6,736.15 3.98 43.97 5 Singapore 4,777.96 3.08 6,298.54 3.72 31.82 6 U K 5,111.81 3.29 5,263.03 3.11 2.96 7 Germany 4,092.86 2.63 4,780.59 2.82 16.80 8 Vietnam Soc Rep 3,409.74 2.19 4,242.25 2.51 24.42 9 Bangladesh PR 3,534.08 2.27 4,206.70 2.48 19.03
10 Nepal 3,050.91 1.96 3,305.98 1.95 8.36 11 Belgium 3,132.43 2.02 3,284.67 1.94 4.86 12 Italy 2,590.42 1.67 3,114.66 1.84 20.24 13 Netherland 2,775.57 1.79 3,084.97 1.82 11.15 14 Malaysia 2,462.84 1.59 3,055.16 1.80 24.05 15 Saudi Arab 3,003.17 1.93 2,926.58 1.73 -2.55 16 Turkey 2,738.31 1.76 2,870.12 1.69 4.81 17 France 2,682.65 1.73 2,724.83 1.61 1.57 18 Japan 2,181.19 1.40 2,609.96 1.54 19.66 19 Korea RP 2,200.67 1.42 2,491.35 1.47 13.21 20 Australia 1,743.83 1.12 2,414.01 1.43 38.43 21 Sri Lanka DSR 2,183.22 1.41 2,413.28 1.43 10.54 22 South Africa 1,921.71 1.24 2,353.88 1.39 22.49 23 Mexico 1,968.76 1.27 2,224.28 1.31 12.98 24 Spain 1,922.78 1.24 2,204.54 1.30 14.65 25 Indonesia 1,794.13 1.15 2,083.06 1.23 16.10 26 Thailand 1,661.55 1.07 1,990.36 1.18 19.79 27 Brazil 1,398.71 0.90 1,752.56 1.03 25.30 28 Israel 1,753.85 1.13 1,741.90 1.03 -0.68 29 Iran 1,396.41 0.90 1,685.29 1.00 20.69 30 Oman 1,407.51 0.91 1,497.40 0.88 6.39 31 Egypt A RP 1,233.96 0.79 1,471.51 0.87 19.25 32 Canada 1,153.57 0.74 1,320.60 0.78 14.48 33 Russia 1,088.33 0.70 1,259.17 0.74 15.70 34 Nigeria 1,003.92 0.65 1,167.95 0.69 16.34 35 Taiwan 1,003.88 0.65 1,150.61 0.68 14.62 36 Kenya 1,259.24 0.81 1,090.46 0.64 -13.40 37 Philippines 865.03 0.56 906.95 0.54 4.85 38 Pakistan IR 887.87 0.57 850.08 0.50 -4.26 39 Tanzania Rep 1,125.97 0.72 798.58 0.47 -29.08 40 Kuwait 861.73 0.55 761.95 0.45 -11.58
Total 1,33,956.70 86.23 1,47,349.86 87.01 10.00 Others 21,387.71 13.77 21,999.54 12.99 2.86
India's total Export 1,55,344.41 100.00 1,69,349.40 100.00 9.02 Source: DGCI&S, Kolkata (P: Provisional) (Note: (i) Others includes remaining destinations (ii) The above listed 40 destinations are fixed based on the top 40 destinations of export for the year 2016-17)

Monthly Bulletin on Foreign Trade November 2017 Page 26
Table 11: India’s Import by Sources (Value in US$ Million)
S.No. Sources Apr-Oct, 16 % Share Apr-Oct, 17 % Share % Change 1 China P RP 34,988.93 16.67 43,465.09 16.86 24.23 2 U S A 12,439.44 5.93 14,096.84 5.47 13.32 3 U Arab Emts 11,600.17 5.53 12,927.84 5.01 11.45 4 Saudi Arab 11,048.48 5.27 11,975.94 4.65 8.39 5 Switzerland 7,924.60 3.78 11,302.20 4.38 42.62 6 Korea RP 6,793.74 3.24 9,904.20 3.84 45.78 7 Indonesia 6,881.75 3.28 9,405.01 3.65 36.67 8 Iraq 6,215.61 2.96 8,744.51 3.39 40.69 9 Australia 4,771.07 2.27 7,640.73 2.96 60.15
10 Germany 6,626.42 3.16 7,418.67 2.88 11.96 11 Hong Kong 4,417.90 2.11 6,419.08 2.49 45.30 12 Japan 5,678.88 2.71 6,172.34 2.39 8.69 13 Iran 5,461.84 2.60 5,637.03 2.19 3.21 14 Malaysia 5,211.21 2.48 5,211.81 2.02 0.01 15 Nigeria 4,180.72 1.99 5,026.04 1.95 20.22 16 Russia 2,935.94 1.40 4,913.68 1.91 67.36 17 Qatar 4,237.72 2.02 4,493.76 1.74 6.04 18 Singapore 3,919.58 1.87 4,040.60 1.57 3.09 19 Thailand 3,168.97 1.51 3,917.69 1.52 23.63 20 South Africa 2,816.49 1.34 3,864.75 1.50 37.22 21 Venezuela 3,100.54 1.48 3,660.85 1.42 18.07 22 Belgium 4,335.73 2.07 3,367.59 1.31 -22.33 23 Kuwait 2,513.86 1.20 3,272.45 1.27 30.18 24 France 2,995.11 1.43 2,914.73 1.13 -2.68 25 Brazil 2,014.01 0.96 2,880.76 1.12 43.04 26 Canada 1,890.86 0.90 2,704.29 1.05 43.02 27 U K 2,150.13 1.02 2,698.01 1.05 25.48 28 Italy 2,262.60 1.08 2,578.30 1.00 13.95 29 Vietnam Soc Rep 1,952.30 0.93 2,573.65 1.00 31.83 30 Oman 800.14 0.38 2,238.88 0.87 179.81 31 Taiwan 1,838.08 0.88 2,203.58 0.85 19.88 32 Angola 1,184.88 0.56 1,950.50 0.76 64.62 33 Argentina 1,614.70 0.77 1,640.19 0.64 1.58 34 Mexico 1,411.16 0.67 1,589.67 0.62 12.65 35 Ghana 523.80 0.25 1,385.49 0.54 164.51 36 Netherland 1,016.71 0.48 1,288.70 0.50 26.75 37 Ukraine 997.14 0.48 1,275.35 0.49 27.90 38 Israel 1,158.51 0.55 1,161.31 0.45 0.24 39 Spain 906.84 0.43 948.93 0.37 4.64 40 Botswana 592.40 0.28 938.90 0.36 58.49
Total 1,86,578.96 88.92 2,29,849.94 89.16 23.19 Others 23,256.02 11.08 27,950.45 10.84 20.19
India's Total Import 2,09,834.98 100.00 2,57,800.39 100.00 22.86 Source: DGCI&S, Kolkata(P: Provisional) (Note: (i) Others includes remaining sources (ii) The above listed 40 sources are fixed based on the top 40 sources of import for the year 2016-17)

Monthly Bulletin on Foreign Trade November 2017 Page 27
Table 12: India’s Export by Region
(Value in US$ Million)
Regions Apr-Oct, 16 % Share Apr-Oct, 17 % Share % Change
1) Europe 30,035.29 19.33 32,580.99 19.24 8.48
1.1 EU Countries 26,483.67 17.05 28,904.64 17.07 9.14
1.2 European Free Trade Association (EFTA) 709.82 0.46 674.6 0.40 -4.96
1.3 Other European Countries 2,841.81 1.83 3,001.74 1.77 5.63
2) Africa 13,379.22 8.61 14,182.00 8.37 6.00
2.1 Southern African Customs Union (SACU) 2,044.79 1.32 2,472.51 1.46 20.92
2.2 Other South African Countries 847.69 0.55 769.87 0.45 -9.18
2.3 West Africa 3,301.65 2.13 3,916.06 2.31 18.61
2.4 Central Africa 615.03 0.40 653.25 0.39 6.21
2.5 East Africa 3,986.37 2.57 3,526.60 2.08 -11.53
2.6 North Africa 2,583.69 1.66 2,843.70 1.68 10.06
3) America 32,425.42 20.87 35,711.18 21.09 10.13
3.1 North America 28,242.55 18.18 30,748.48 18.16 8.87
3.2 Latin America 4,182.87 2.69 4,962.70 2.93 18.64
4) Asia 75,320.23 48.49 83,649.74 49.39 11.06
4.1 East Asia (Oceania) 1,989.78 1.28 2,670.47 1.58 34.21
4.2 ASEAN 15,597.96 10.04 19,192.82 11.33 23.05
4.3 West Asia- GCC 24,571.25 15.82 23,362.99 13.80 -4.92
4.4 Other West Asia 4,480.33 2.88 4,986.73 2.94 11.30
4.5 NE Asia 18,311.27 11.79 21,889.09 12.93 19.54
4.6 South Asia 10,369.64 6.68 11,547.64 6.82 11.36
5) CIS & Baltics 1,562.51 1.01 1,756.18 1.04 12.39
5.1 CARs Countries 181.43 0.12 203.64 0.12 12.24
5.2 Other CIS Countries 1,381.08 0.89 1,552.54 0.92 12.41
6) Unspecified Region 2,621.72 1.69 1,469.30 0.87 -43.96
India’s Total Export 1,55,344.41 100.00 1,69,349.40 100.00 9.02 Source: DGCI&S, Kolkata (P: Provisional)

Monthly Bulletin on Foreign Trade November 2017 Page 28
Table 13: India’s Import by Region
(Value in US$ Million)
Region Apr-Oct, 16 % Share Apr-Oct, 17 % Share % Change
1) Europe 33,106.63 15.78 38,113.91 14.78 15.12
1.1 EU Countries 24,214.82 11.54 25,589.31 9.93 5.68
1.2 European Free Trade Association (EFTA) 8,138.65 3.88 11,792.96 4.57 44.90
1.3 Other European Countries 753.15 0.36 731.64 0.28 -2.86
2) Africa 15,186.64 7.24 20,470.34 7.94 34.79
2.1 Southern African Customs Union (SACU) 3,443.64 1.64 4,881.23 1.89 41.75
2.2 Other South African Countries 1,859.85 0.89 3,113.40 1.21 67.40
2.3 West Africa 7,313.90 3.49 9,322.31 3.62 27.46
2.4 Central Africa 250.11 0.12 262.74 0.10 5.05
2.5 East Africa 503.1 0.24 671.32 0.26 33.44
2.6 North Africa 1,816.04 0.87 2,219.34 0.86 22.21
3) America 25,311.59 12.06 30,451.50 11.81 20.31
3.1 North America 15,741.45 7.50 18,390.79 7.13 16.83
3.2 Latin America 9,570.14 4.56 12,060.71 4.68 26.02
4) Asia 1,27,070.66 60.56 1,55,938.00 60.49 22.72
4.1 East Asia (Oceania) 5,176.07 2.47 8,142.97 3.16 57.32
4.2 ASEAN 22,609.22 10.77 26,596.18 10.32 17.63
4.3 West Asia- GCC 30,388.94 14.48 35,116.87 13.62 15.56
4.4 Other West Asia 13,395.16 6.38 16,187.23 6.28 20.84
4.5 NE Asia 53,798.26 25.64 68,196.00 26.45 26.76
4.6 South Asia 1,703.01 0.81 1,698.76 0.66 -0.25
5) CIS & Baltics 4,531.00 2.16 7,325.84 2.84 61.68
5.1 CARs Countries 305.96 0.15 738.52 0.29 141.38
5.2 Other CIS Countries 4,225.04 2.01 6,587.31 2.56 55.91
6) Unspecified Region 4,628.45 2.21 5,500.79 2.13 18.85
India’s Total Import 2,09,834.98 100.00 2,57,800.39 100.00 22.86 Source: DGCI&S, Kolkata (P: Provisional)