monthly chart pack - banksa
TRANSCRIPT

MONTHLY CHART PACK BANKSA ECONOMICS May 2020
1
R200
G201
B199
BACKGROUND SHADING
IN PLACEHOLDERS
R242
G242
B242
PEERS
102
G102
B102
BANK SA
R44
G71
B158
ST.GEORGE
R120
G190
B32
RAMS
R0
G174
B239
BANK OF MELB
R127
G128
B189
AFS
R98
G26
B75
WESTPAC, WRBB, WNZ
R220
G36
B31
WIB
R157
G3
B42
BTFG
R0
G175
B215
R145
G163
B173
R64
G85
B97
R129
G130
B123
R229
G229
B229
R245
G150
B135
R220
G36
B31
R165
G165
B165
R165
G27
B23
R102
G102
B102
R207
G208
B206
R243
G173
B171
R94
G16
B14
Below is the chart colour sequence. If your chart has more than 12 series‘ you will need to manually colour the additional series.
This is the HIGHLIGHT colour .
2
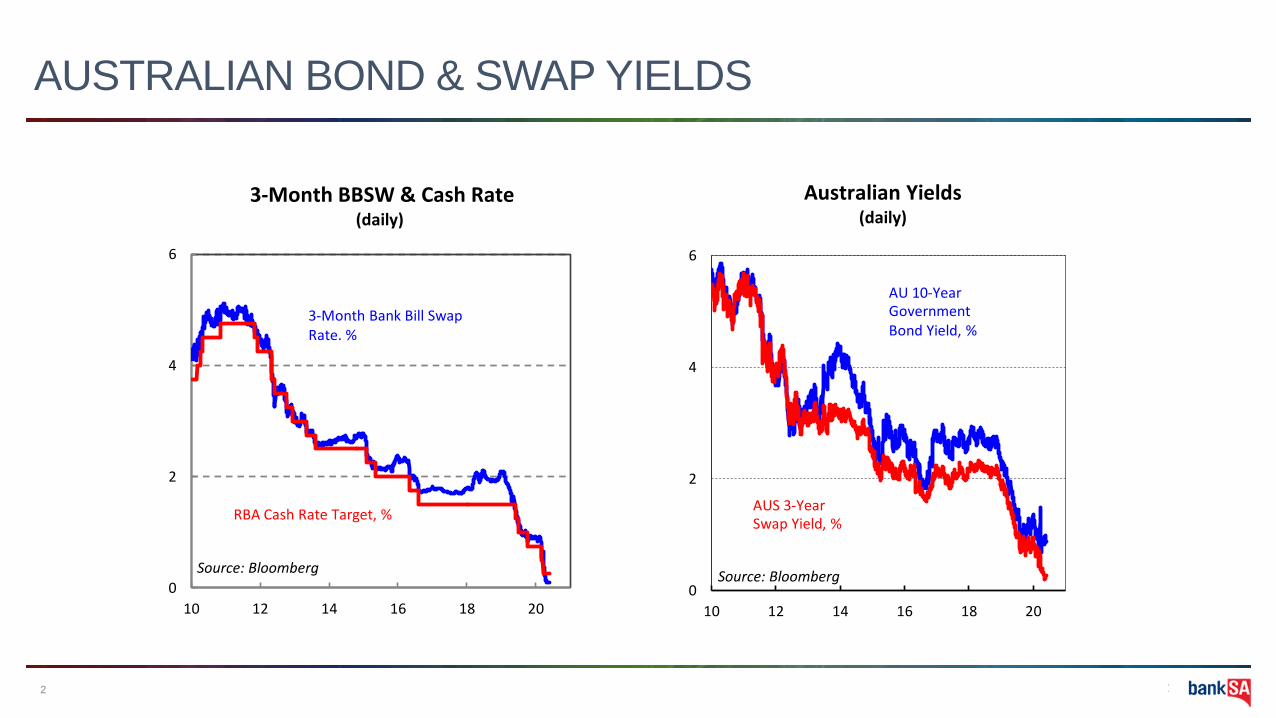
AUSTRALIAN BOND & SWAP YIELDS
0
2
4
6
10 12 14 16 18 20
Australian Yields(daily)
AU 10-Year Government Bond Yield, %
AUS 3-YearSwap Yield, %
Source: Bloomberg0
2
4
6
10 12 14 16 18 20
3-Month BBSW & Cash Rate(daily)
Source: Bloomberg
RBA Cash Rate Target, %
3-Month Bank Bill Swap Rate. %
R200
G201
B199
BACKGROUND SHADING
IN PLACEHOLDERS
R242
G242
B242
PEERS
102
G102
B102
BANK SA
R44
G71
B158
ST.GEORGE
R120
G190
B32
RAMS
R0
G174
B239
BANK OF MELB
R127
G128
B189
AFS
R98
G26
B75
WESTPAC, WRBB, WNZ
R220
G36
B31
WIB
R157
G3
B42
BTFG
R0
G175
B215
R145
G163
B173
R64
G85
B97
R129
G130
B123
R229
G229
B229
R245
G150
B135
R220
G36
B31
R165
G165
B165
R165
G27
B23
R102
G102
B102
R207
G208
B206
R243
G173
B171
R94
G16
B14
Below is the chart colour sequence. If your chart has more than 12 series‘ you will need to manually colour the additional series.
This is the HIGHLIGHT colour .
3
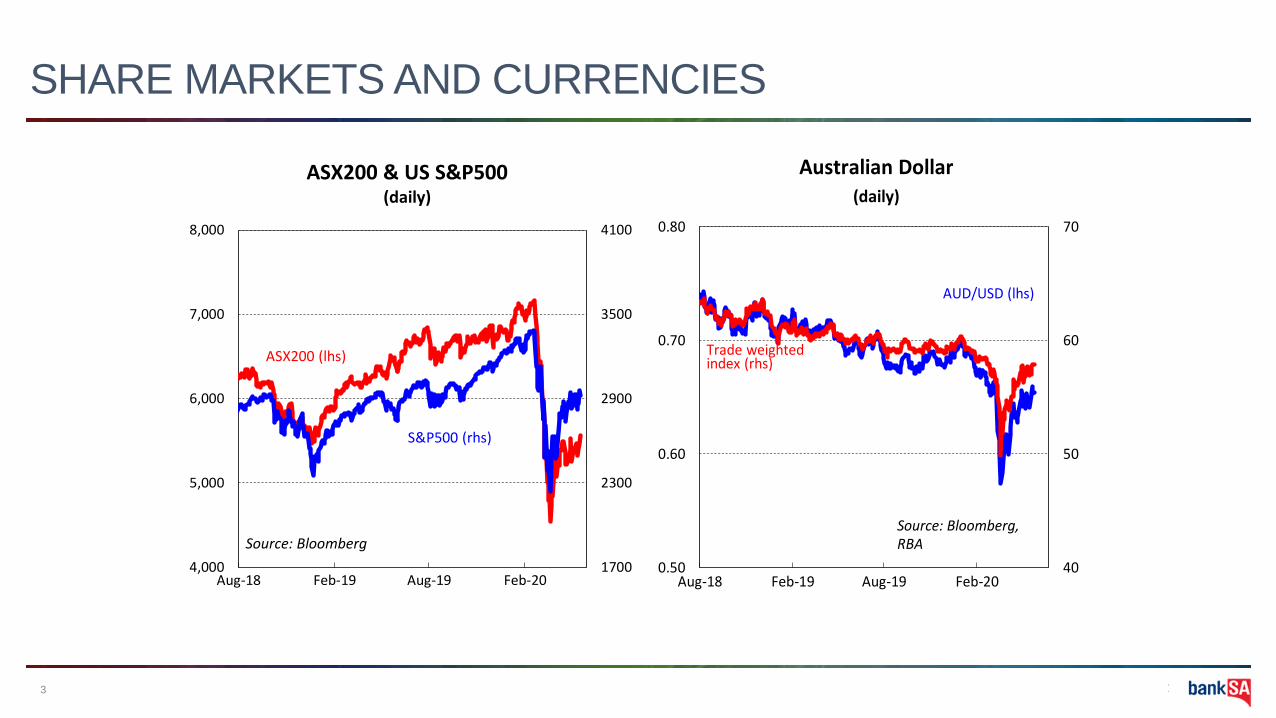
SHARE MARKETS AND CURRENCIES
1700
2300
2900
3500
4100
4,000
5,000
6,000
7,000
8,000
Aug-18 Feb-19 Aug-19 Feb-20
ASX200 & US S&P500(daily)
ASX200 (lhs)
S&P500 (rhs)
Source: Bloomberg
40
50
60
70
0.50
0.60
0.70
0.80
Aug-18 Feb-19 Aug-19 Feb-20
Australian Dollar(daily)
AUD/USD (lhs)
Trade weighted index (rhs)
Source: Bloomberg, RBA
R200
G201
B199
BACKGROUND SHADING
IN PLACEHOLDERS
R242
G242
B242
PEERS
102
G102
B102
BANK SA
R44
G71
B158
ST.GEORGE
R120
G190
B32
RAMS
R0
G174
B239
BANK OF MELB
R127
G128
B189
AFS
R98
G26
B75
WESTPAC, WRBB, WNZ
R220
G36
B31
WIB
R157
G3
B42
BTFG
R0
G175
B215
R145
G163
B173
R64
G85
B97
R129
G130
B123
R229
G229
B229
R245
G150
B135
R220
G36
B31
R165
G165
B165
R165
G27
B23
R102
G102
B102
R207
G208
B206
R243
G173
B171
R94
G16
B14
Below is the chart colour sequence. If your chart has more than 12 series‘ you will need to manually colour the additional series.
This is the HIGHLIGHT colour .
4
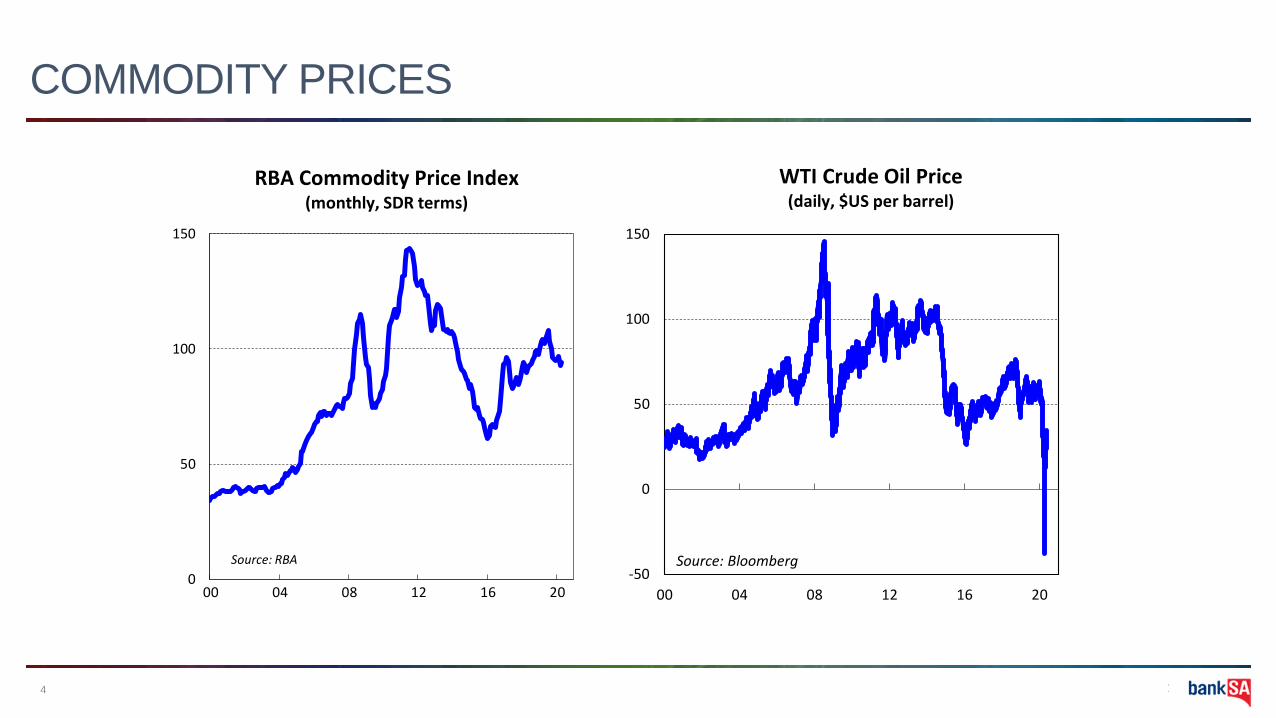
COMMODITY PRICES
0
50
100
150
00 04 08 12 16 20
RBA Commodity Price Index(monthly, SDR terms)
Source: RBA-50
0
50
100
150
00 04 08 12 16 20
WTI Crude Oil Price(daily, $US per barrel)
Source: Bloomberg
R200
G201
B199
BACKGROUND SHADING
IN PLACEHOLDERS
R242
G242
B242
PEERS
102
G102
B102
BANK SA
R44
G71
B158
ST.GEORGE
R120
G190
B32
RAMS
R0
G174
B239
BANK OF MELB
R127
G128
B189
AFS
R98
G26
B75
WESTPAC, WRBB, WNZ
R220
G36
B31
WIB
R157
G3
B42
BTFG
R0
G175
B215
R145
G163
B173
R64
G85
B97
R129
G130
B123
R229
G229
B229
R245
G150
B135
R220
G36
B31
R165
G165
B165
R165
G27
B23
R102
G102
B102
R207
G208
B206
R243
G173
B171
R94
G16
B14
Below is the chart colour sequence. If your chart has more than 12 series‘ you will need to manually colour the additional series.
This is the HIGHLIGHT colour .
5
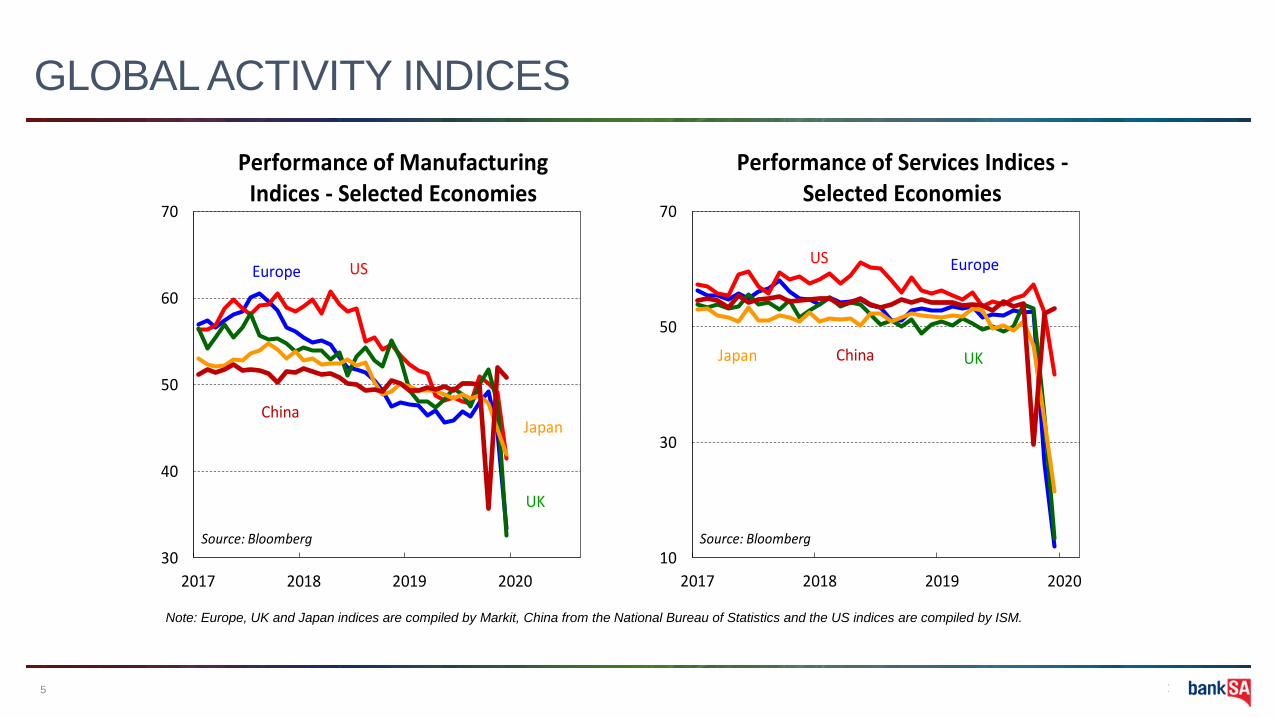
GLOBAL ACTIVITY INDICES
30
40
50
60
70
2017 2018 2019 2020
Performance of Manufacturing Indices - Selected Economies
Europe US
UK
JapanChina
Source: Bloomberg
10
30
50
70
2017 2018 2019 2020
Performance of Services Indices -Selected Economies
EuropeUS
UKJapan China
Source: Bloomberg
Note: Europe, UK and Japan indices are compiled by Markit, China from the National Bureau of Statistics and the US indices are compiled by ISM.
R200
G201
B199
BACKGROUND SHADING
IN PLACEHOLDERS
R242
G242
B242
PEERS
102
G102
B102
BANK SA
R44
G71
B158
ST.GEORGE
R120
G190
B32
RAMS
R0
G174
B239
BANK OF MELB
R127
G128
B189
AFS
R98
G26
B75
WESTPAC, WRBB, WNZ
R220
G36
B31
WIB
R157
G3
B42
BTFG
R0
G175
B215
R145
G163
B173
R64
G85
B97
R129
G130
B123
R229
G229
B229
R245
G150
B135
R220
G36
B31
R165
G165
B165
R165
G27
B23
R102
G102
B102
R207
G208
B206
R243
G173
B171
R94
G16
B14
Below is the chart colour sequence. If your chart has more than 12 series‘ you will need to manually colour the additional series.
This is the HIGHLIGHT colour .
6
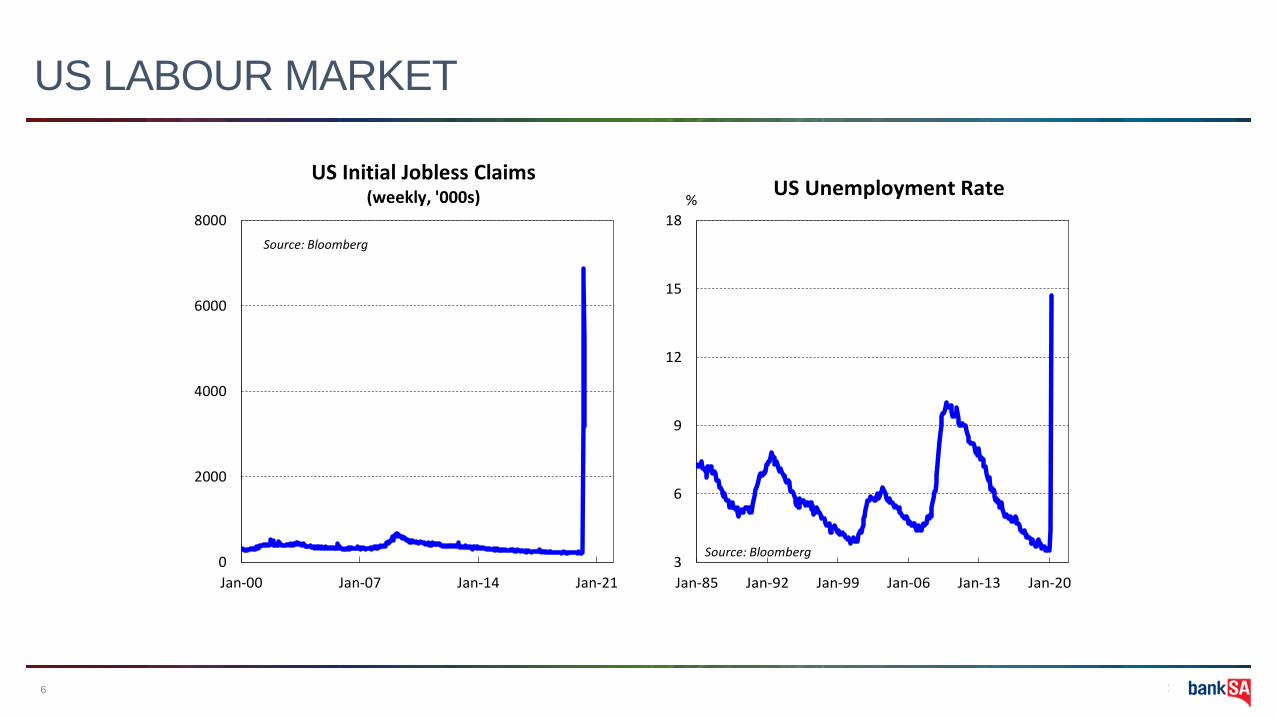
US LABOUR MARKET
3
6
9
12
15
18
Jan-85 Jan-92 Jan-99 Jan-06 Jan-13 Jan-20
US Unemployment Rate%
Source: Bloomberg0
2000
4000
6000
8000
Jan-00 Jan-07 Jan-14 Jan-21
US Initial Jobless Claims(weekly, '000s)
Source: Bloomberg
R200
G201
B199
BACKGROUND SHADING
IN PLACEHOLDERS
R242
G242
B242
PEERS
102
G102
B102
BANK SA
R44
G71
B158
ST.GEORGE
R120
G190
B32
RAMS
R0
G174
B239
BANK OF MELB
R127
G128
B189
AFS
R98
G26
B75
WESTPAC, WRBB, WNZ
R220
G36
B31
WIB
R157
G3
B42
BTFG
R0
G175
B215
R145
G163
B173
R64
G85
B97
R129
G130
B123
R229
G229
B229
R245
G150
B135
R220
G36
B31
R165
G165
B165
R165
G27
B23
R102
G102
B102
R207
G208
B206
R243
G173
B171
R94
G16
B14
Below is the chart colour sequence. If your chart has more than 12 series‘ you will need to manually colour the additional series.
This is the HIGHLIGHT colour .
7
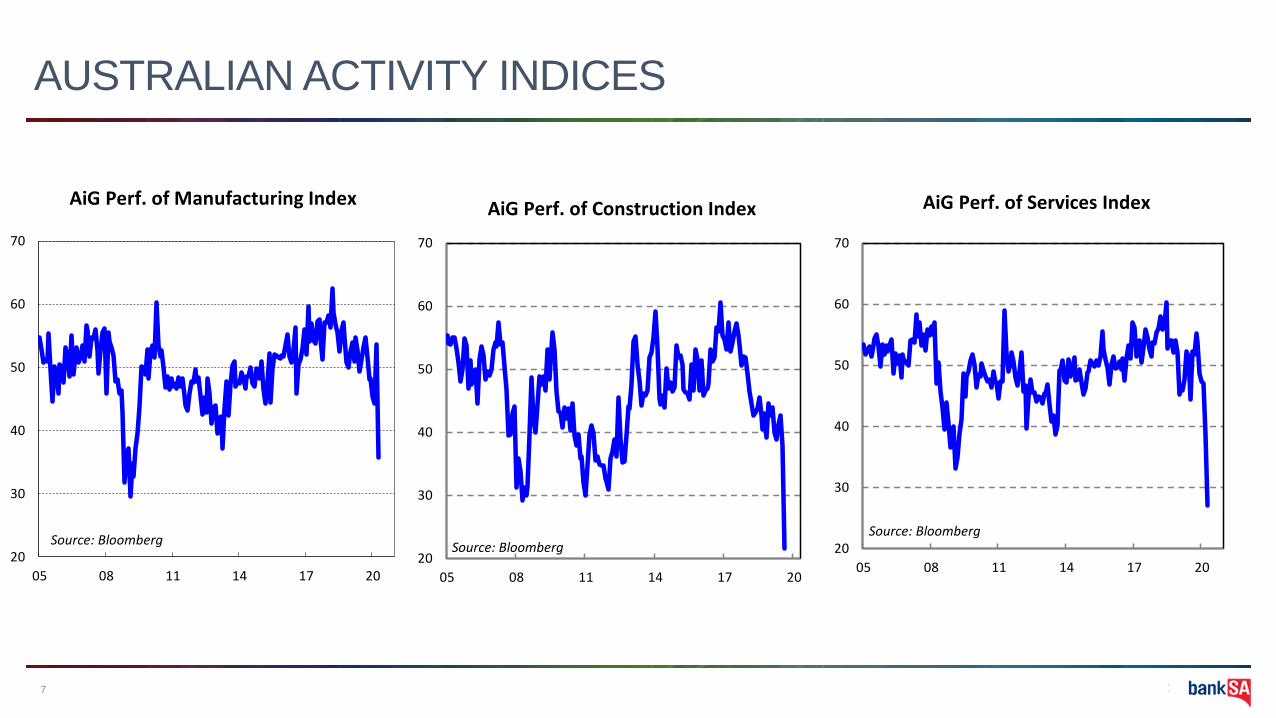
AUSTRALIAN ACTIVITY INDICES
20
30
40
50
60
70
05 08 11 14 17 20
AiG Perf. of Services Index
Source: Bloomberg
20
30
40
50
60
70
05 08 11 14 17 20
AiG Perf. of Construction Index
Source: Bloomberg20
30
40
50
60
70
05 08 11 14 17 20
AiG Perf. of Manufacturing Index
Source: Bloomberg
R200
G201
B199
BACKGROUND SHADING
IN PLACEHOLDERS
R242
G242
B242
PEERS
102
G102
B102
BANK SA
R44
G71
B158
ST.GEORGE
R120
G190
B32
RAMS
R0
G174
B239
BANK OF MELB
R127
G128
B189
AFS
R98
G26
B75
WESTPAC, WRBB, WNZ
R220
G36
B31
WIB
R157
G3
B42
BTFG
R0
G175
B215
R145
G163
B173
R64
G85
B97
R129
G130
B123
R229
G229
B229
R245
G150
B135
R220
G36
B31
R165
G165
B165
R165
G27
B23
R102
G102
B102
R207
G208
B206
R243
G173
B171
R94
G16
B14
Below is the chart colour sequence. If your chart has more than 12 series‘ you will need to manually colour the additional series.
This is the HIGHLIGHT colour .
8
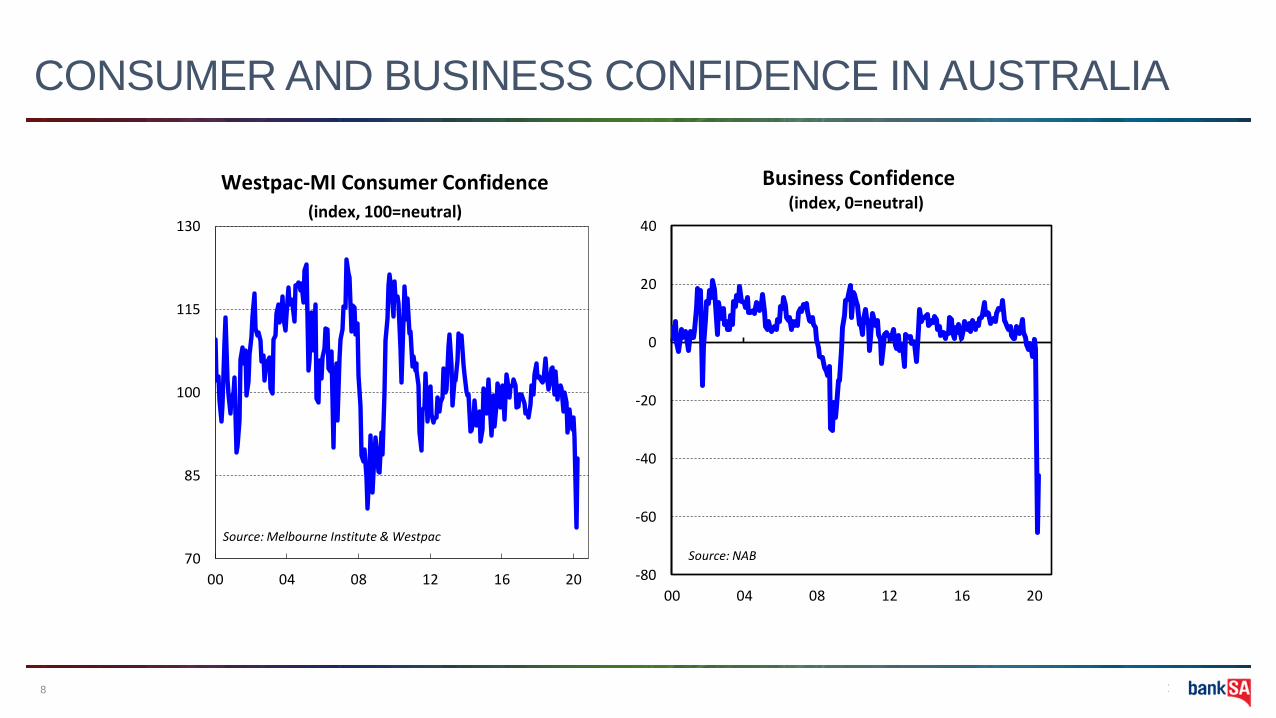
CONSUMER AND BUSINESS CONFIDENCE IN AUSTRALIA
70
85
100
115
130
00 04 08 12 16 20
Westpac-MI Consumer Confidence(index, 100=neutral)
Source: Melbourne Institute & Westpac
-80
-60
-40
-20
0
20
40
00 04 08 12 16 20
Business Confidence(index, 0=neutral)
Source: NAB
R200
G201
B199
BACKGROUND SHADING
IN PLACEHOLDERS
R242
G242
B242
PEERS
102
G102
B102
BANK SA
R44
G71
B158
ST.GEORGE
R120
G190
B32
RAMS
R0
G174
B239
BANK OF MELB
R127
G128
B189
AFS
R98
G26
B75
WESTPAC, WRBB, WNZ
R220
G36
B31
WIB
R157
G3
B42
BTFG
R0
G175
B215
R145
G163
B173
R64
G85
B97
R129
G130
B123
R229
G229
B229
R245
G150
B135
R220
G36
B31
R165
G165
B165
R165
G27
B23
R102
G102
B102
R207
G208
B206
R243
G173
B171
R94
G16
B14
Below is the chart colour sequence. If your chart has more than 12 series‘ you will need to manually colour the additional series.
This is the HIGHLIGHT colour .
9
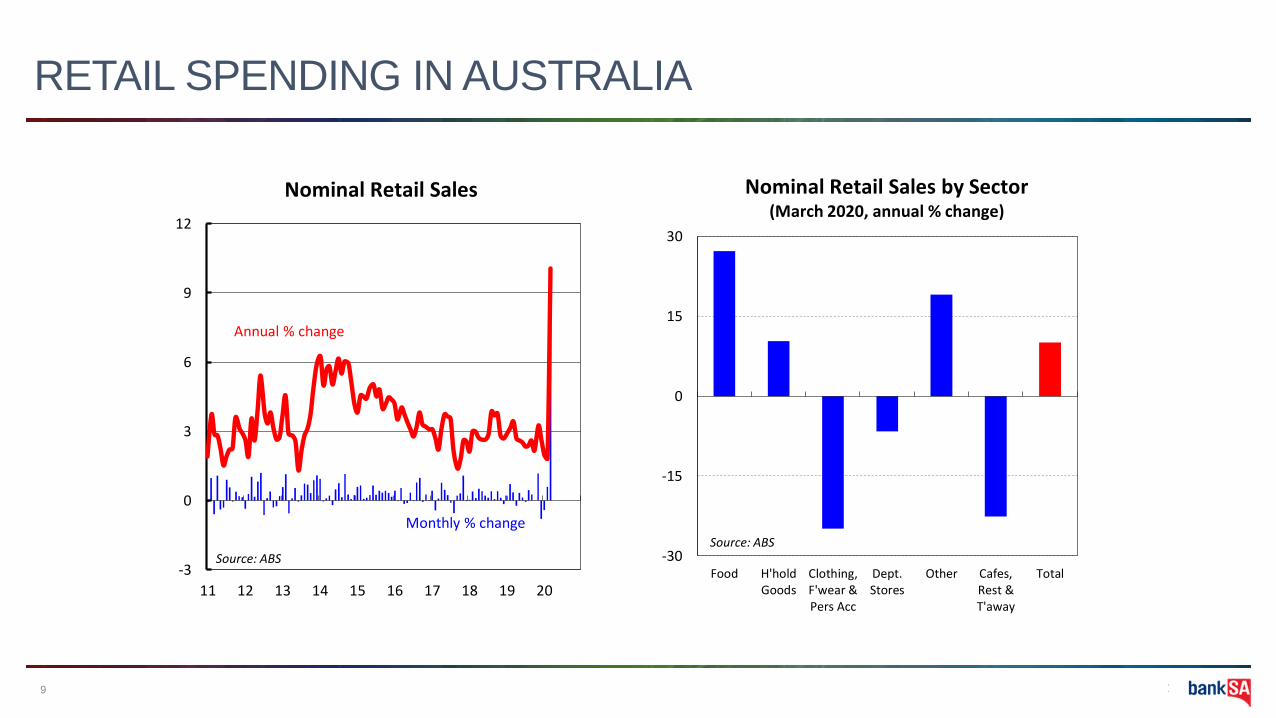
RETAIL SPENDING IN AUSTRALIA
-30
-15
0
15
30
Food H'holdGoods
Clothing,F'wear &Pers Acc
Dept.Stores
Other Cafes,Rest &T'away
Total
Nominal Retail Sales by Sector(March 2020, annual % change)
Source: ABS
-3
0
3
6
9
12
11 12 13 14 15 16 17 18 19 20
Nominal Retail Sales
Monthly % change
Annual % change
Source: ABS
R200
G201
B199
BACKGROUND SHADING
IN PLACEHOLDERS
R242
G242
B242
PEERS
102
G102
B102
BANK SA
R44
G71
B158
ST.GEORGE
R120
G190
B32
RAMS
R0
G174
B239
BANK OF MELB
R127
G128
B189
AFS
R98
G26
B75
WESTPAC, WRBB, WNZ
R220
G36
B31
WIB
R157
G3
B42
BTFG
R0
G175
B215
R145
G163
B173
R64
G85
B97
R129
G130
B123
R229
G229
B229
R245
G150
B135
R220
G36
B31
R165
G165
B165
R165
G27
B23
R102
G102
B102
R207
G208
B206
R243
G173
B171
R94
G16
B14
Below is the chart colour sequence. If your chart has more than 12 series‘ you will need to manually colour the additional series.
This is the HIGHLIGHT colour .
10
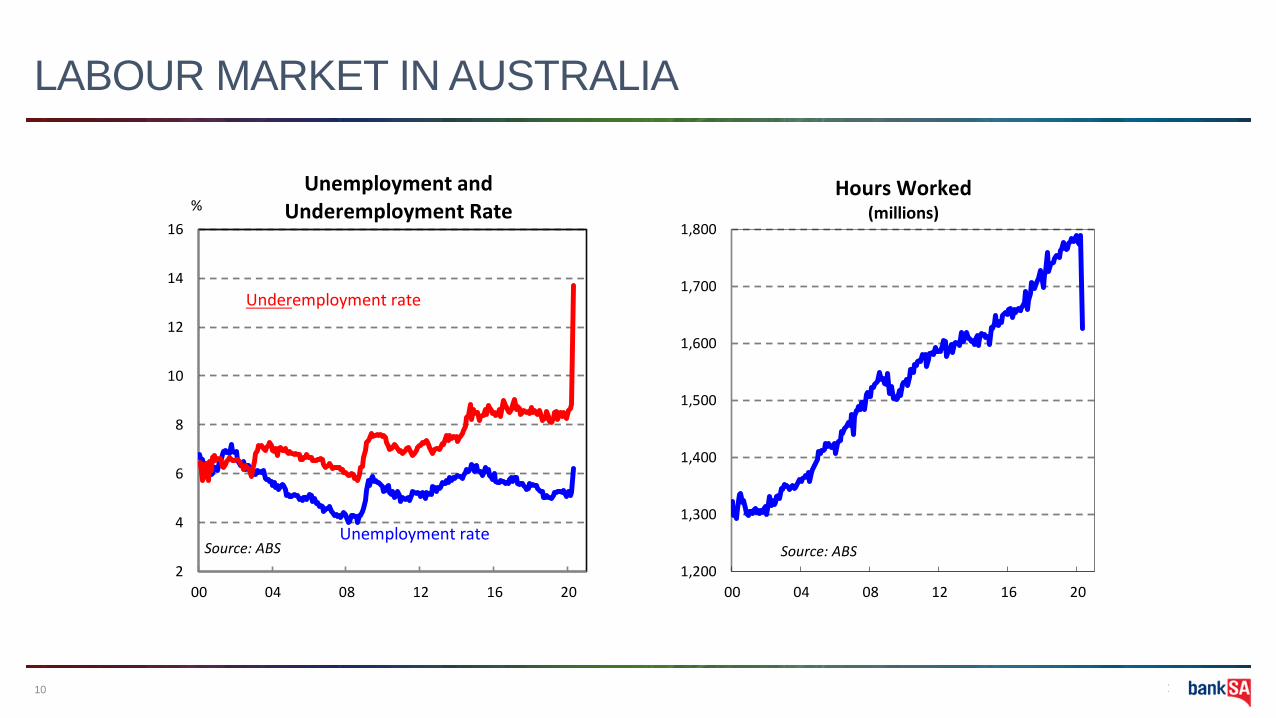
LABOUR MARKET IN AUSTRALIA
1,200
1,300
1,400
1,500
1,600
1,700
1,800
00 04 08 12 16 20
Tho
usa
nd
s
Hours Worked(millions)
Source: ABS
2
4
6
8
10
12
14
16
00 04 08 12 16 20
Unemployment and Underemployment Rate
Source: ABS
%
Underemployment rate
Unemployment rate
R200
G201
B199
BACKGROUND SHADING
IN PLACEHOLDERS
R242
G242
B242
PEERS
102
G102
B102
BANK SA
R44
G71
B158
ST.GEORGE
R120
G190
B32
RAMS
R0
G174
B239
BANK OF MELB
R127
G128
B189
AFS
R98
G26
B75
WESTPAC, WRBB, WNZ
R220
G36
B31
WIB
R157
G3
B42
BTFG
R0
G175
B215
R145
G163
B173
R64
G85
B97
R129
G130
B123
R229
G229
B229
R245
G150
B135
R220
G36
B31
R165
G165
B165
R165
G27
B23
R102
G102
B102
R207
G208
B206
R243
G173
B171
R94
G16
B14
Below is the chart colour sequence. If your chart has more than 12 series‘ you will need to manually colour the additional series.
This is the HIGHLIGHT colour .
11
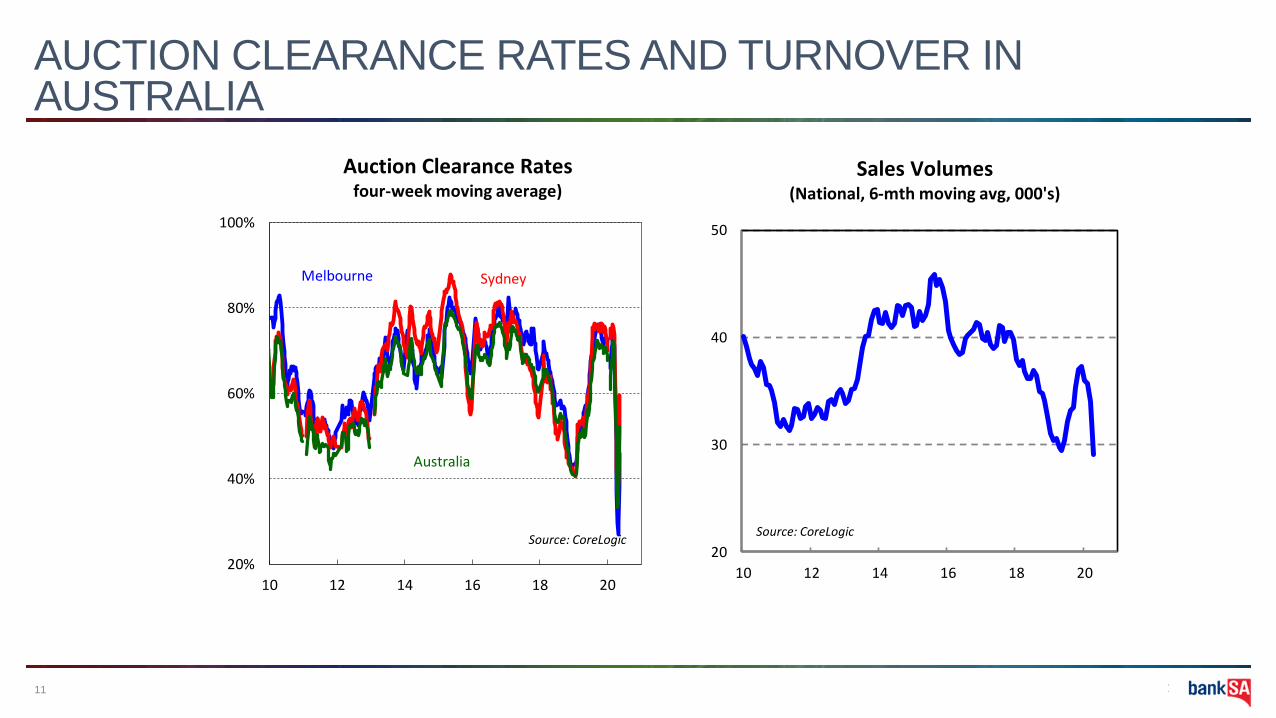
AUCTION CLEARANCE RATES AND TURNOVER IN AUSTRALIA
20
30
40
50
10 12 14 16 18 20
Sales Volumes(National, 6-mth moving avg, 000's)
Source: CoreLogic
20%
40%
60%
80%
100%
10 12 14 16 18 20
Auction Clearance Rates four-week moving average)
Source: CoreLogic
SydneyMelbourne
Australia
R200
G201
B199
BACKGROUND SHADING
IN PLACEHOLDERS
R242
G242
B242
PEERS
102
G102
B102
BANK SA
R44
G71
B158
ST.GEORGE
R120
G190
B32
RAMS
R0
G174
B239
BANK OF MELB
R127
G128
B189
AFS
R98
G26
B75
WESTPAC, WRBB, WNZ
R220
G36
B31
WIB
R157
G3
B42
BTFG
R0
G175
B215
R145
G163
B173
R64
G85
B97
R129
G130
B123
R229
G229
B229
R245
G150
B135
R220
G36
B31
R165
G165
B165
R165
G27
B23
R102
G102
B102
R207
G208
B206
R243
G173
B171
R94
G16
B14
Below is the chart colour sequence. If your chart has more than 12 series‘ you will need to manually colour the additional series.
This is the HIGHLIGHT colour .
12
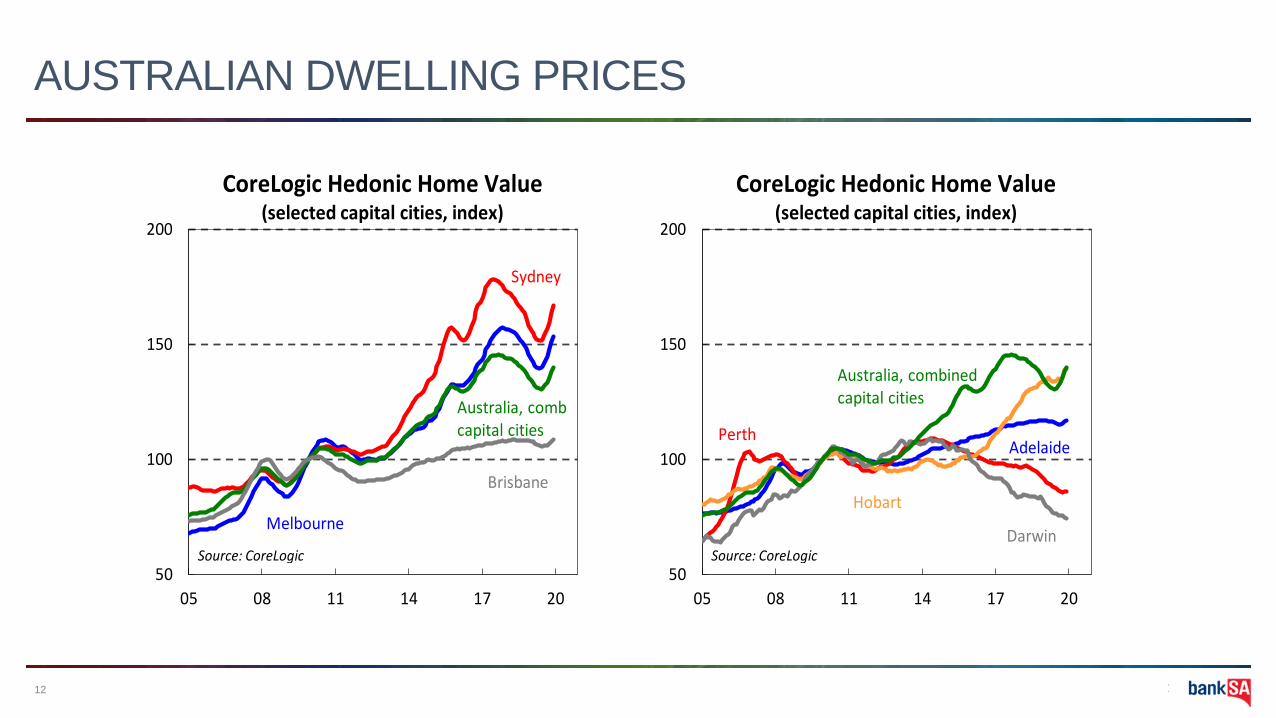
AUSTRALIAN DWELLING PRICES
50
100
150
200
05 08 11 14 17 20
CoreLogic Hedonic Home Value(selected capital cities, index)
Source: CoreLogic
Melbourne
Sydney
Australia, comb capital cities
Brisbane
50
100
150
200
05 08 11 14 17 20
CoreLogic Hedonic Home Value(selected capital cities, index)
Source: CoreLogic
AdelaidePerth
Australia, combined capital cities
Darwin
Hobart
R200
G201
B199
BACKGROUND SHADING
IN PLACEHOLDERS
R242
G242
B242
PEERS
102
G102
B102
BANK SA
R44
G71
B158
ST.GEORGE
R120
G190
B32
RAMS
R0
G174
B239
BANK OF MELB
R127
G128
B189
AFS
R98
G26
B75
WESTPAC, WRBB, WNZ
R220
G36
B31
WIB
R157
G3
B42
BTFG
R0
G175
B215
R145
G163
B173
R64
G85
B97
R129
G130
B123
R229
G229
B229
R245
G150
B135
R220
G36
B31
R165
G165
B165
R165
G27
B23
R102
G102
B102
R207
G208
B206
R243
G173
B171
R94
G16
B14
Below is the chart colour sequence. If your chart has more than 12 series‘ you will need to manually colour the additional series.
This is the HIGHLIGHT colour .
13
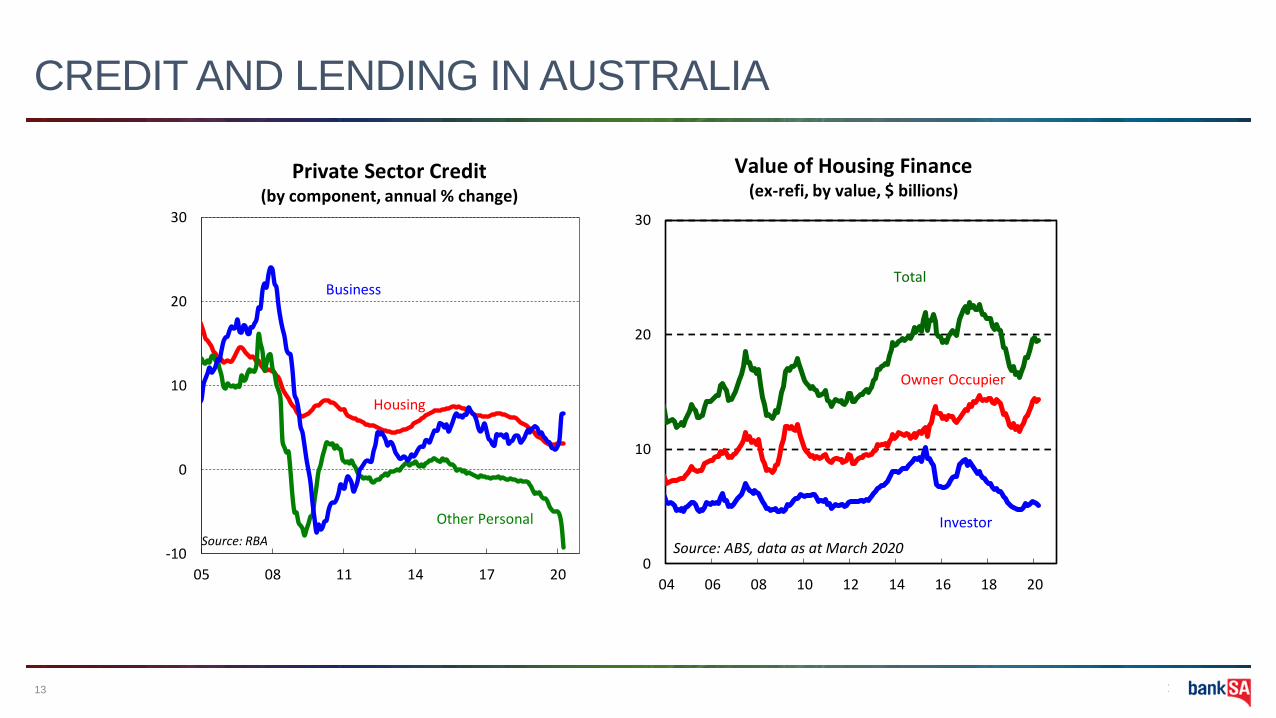
CREDIT AND LENDING IN AUSTRALIA
-10
0
10
20
30
05 08 11 14 17 20
Private Sector Credit (by component, annual % change)
BuH
Business
Housing
Other Personal
Source: RBA
0
10
20
30
04 06 08 10 12 14 16 18 20
Value of Housing Finance (ex-refi, by value, $ billions)
Owner Occupier
Investor
Total
Source: ABS, data as at March 2020
R200
G201
B199
BACKGROUND SHADING
IN PLACEHOLDERS
R242
G242
B242
PEERS
102
G102
B102
BANK SA
R44
G71
B158
ST.GEORGE
R120
G190
B32
RAMS
R0
G174
B239
BANK OF MELB
R127
G128
B189
AFS
R98
G26
B75
WESTPAC, WRBB, WNZ
R220
G36
B31
WIB
R157
G3
B42
BTFG
R0
G175
B215
R145
G163
B173
R64
G85
B97
R129
G130
B123
R229
G229
B229
R245
G150
B135
R220
G36
B31
R165
G165
B165
R165
G27
B23
R102
G102
B102
R207
G208
B206
R243
G173
B171
R94
G16
B14
Below is the chart colour sequence. If your chart has more than 12 series‘ you will need to manually colour the additional series.
This is the HIGHLIGHT colour .
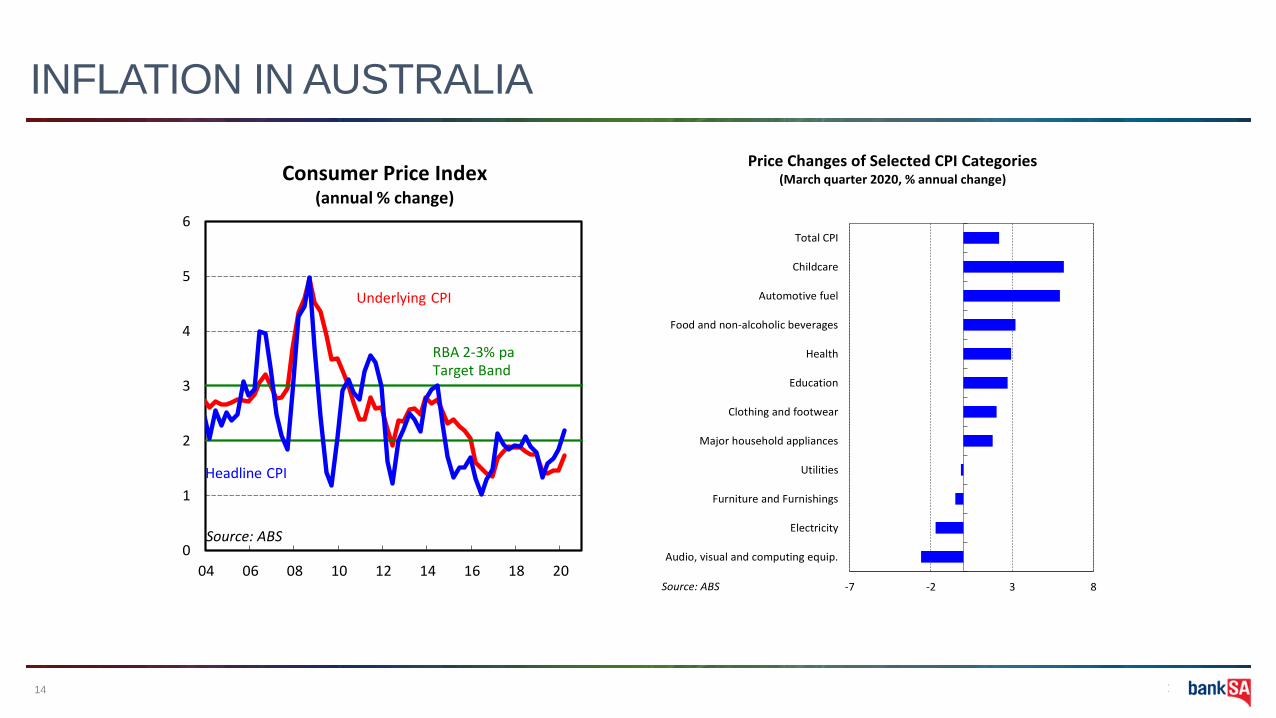
14
INFLATION IN AUSTRALIA
0
1
2
3
4
5
6
04 06 08 10 12 14 16 18 20
Consumer Price Index(annual % change)
Underlying CPI
Headline CPI
RBA 2-3% pa Target Band
Source: ABS
-7 -2 3 8
Audio, visual and computing equip.
Electricity
Furniture and Furnishings
Utilities
Major household appliances
Clothing and footwear
Education
Health
Food and non-alcoholic beverages
Automotive fuel
Childcare
Total CPI
Price Changes of Selected CPI Categories(March quarter 2020, % annual change)
Source: ABS
R200
G201
B199
BACKGROUND SHADING
IN PLACEHOLDERS
R242
G242
B242
PEERS
102
G102
B102
BANK SA
R44
G71
B158
ST.GEORGE
R120
G190
B32
RAMS
R0
G174
B239
BANK OF MELB
R127
G128
B189
AFS
R98
G26
B75
WESTPAC, WRBB, WNZ
R220
G36
B31
WIB
R157
G3
B42
BTFG
R0
G175
B215
R145
G163
B173
R64
G85
B97
R129
G130
B123
R229
G229
B229
R245
G150
B135
R220
G36
B31
R165
G165
B165
R165
G27
B23
R102
G102
B102
R207
G208
B206
R243
G173
B171
R94
G16
B14
Below is the chart colour sequence. If your chart has more than 12 series‘ you will need to manually colour the additional series.
This is the HIGHLIGHT colour .
15
CONTACTS
Chief Economist Senior Economist Economist
Besa Deda Janu Chan Nelson Aston
[email protected] [email protected] [email protected]
(02) 8254 3251 (02) 8253 0898 (02) 8254 1316
R200
G201
B199
BACKGROUND SHADING
IN PLACEHOLDERS
R242
G242
B242
PEERS
102
G102
B102
BANK SA
R44
G71
B158
ST.GEORGE
R120
G190
B32
RAMS
R0
G174
B239
BANK OF MELB
R127
G128
B189
AFS
R98
G26
B75
WESTPAC, WRBB, WNZ
R220
G36
B31
WIB
R157
G3
B42
BTFG
R0
G175
B215
R145
G163
B173
R64
G85
B97
R129
G130
B123
R229
G229
B229
R245
G150
B135
R220
G36
B31
R165
G165
B165
R165
G27
B23
R102
G102
B102
R207
G208
B206
R243
G173
B171
R94
G16
B14
Below is the chart colour sequence. If your chart has more than 12 series‘ you will need to manually colour the additional series.
This is the HIGHLIGHT colour .
16
DISCLAIMER
The information contained in this report (.the Information.) is provided for, and is only to be used by, persons in Australia. The information
may not comply with the laws of another jurisdiction. The Information is general in nature and does not take into account the particular
investment objectives or financial situation of any potential reader. It does not constitute, and should not be relied on as, financial or
investment advice or recommendations (expressed or implied) and is not an invitation to take up securities or other financial products or
services. No decision should be made on the basis of the Information without first seeking expert financial advice. For persons with whom
BankSA has a contract to supply Information, the supply of the Information is made under that contract and BankSA’s agreed terms of
supply apply. BankSA does not represent or guarantee that the Information is accurate or free from errors or omissions and BankSA
disclaims any duty of care in relation to the Information and liability for any reliance on investment decisions made using the Information.
The Information is subject to change. Terms, conditions and any fees apply to BankSA products and details are available. BankSA or its
officers, agents or employees (including persons involved in preparation of the Information) may have financial interests in the markets
discussed in the Information. BankSA owns copyright in the information unless otherwise indicated. The Information should not be
reproduced, distributed, linked or transmitted without the written consent of BankSA.
Any unauthorised use or dissemination is prohibited. Neither BankSA- A Division of Westpac Banking Corporation ABN 33 007 457 141
AFSL 233714 ACL 233714, nor any of Westpac's subsidiaries or affiliates shall be liable for the message if altered, changed or falsified.