monthly credit union estimates - cuna.org · individual retirement accounts (both rising 0.5%), and...
TRANSCRIPT
June 2018
MONTHLYCREDIT UNIONEST IMATES
Prepared August 1, 2018 by Credit Union National AssociationEconomics and Statistics Department
cuna.org/mcue
ii
Monthly Credit Union Estimates June 2018
PeriodYTD Growth
YTD Interest Rate Averages
Long-term Short-term Difference
Loans Savings 10-yr. TreasuryFederal Funds
Rate(Long-Short)
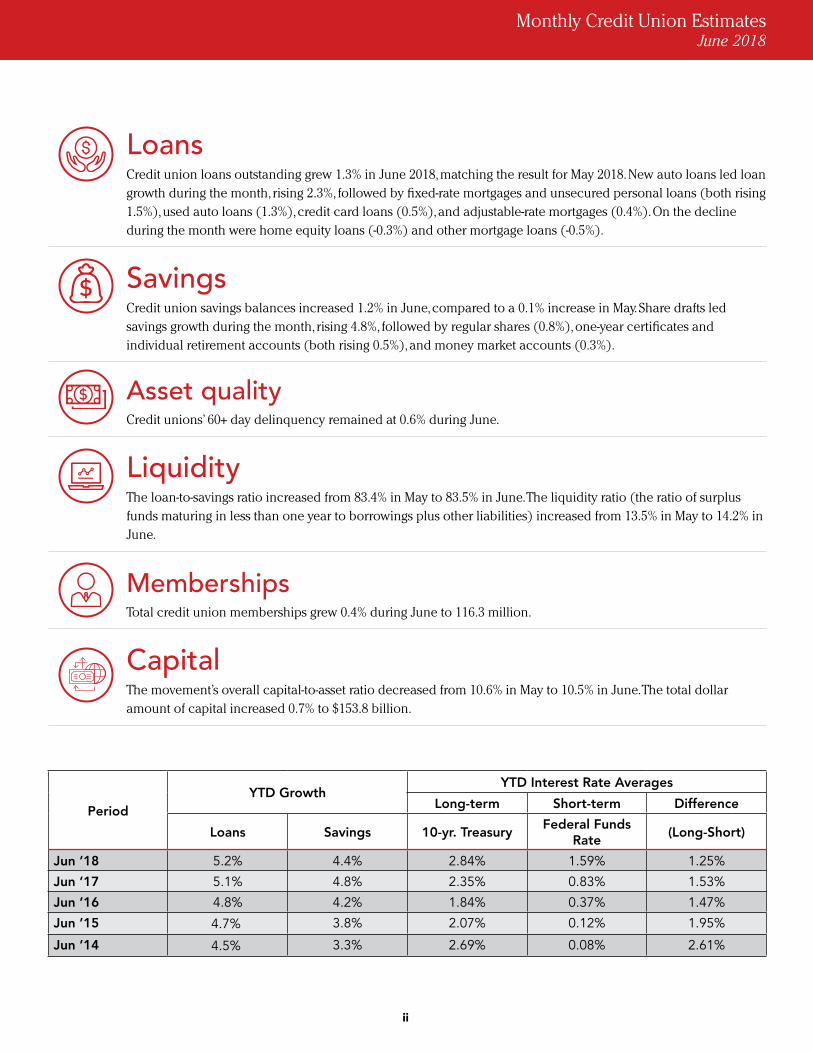
Jun ’18 5.2% 4.4% 2.84% 1.59% 1.25%
Jun ’17 5.1% 4.8% 2.35% 0.83% 1.53%
Jun ’16 4.8% 4.2% 1.84% 0.37% 1.47%
Jun ’15 4.7% 3.8% 2.07% 0.12% 1.95%
Jun ’14 4.5% 3.3% 2.69% 0.08% 2.61%
LoansCredit union loans outstanding grew 1.3% in June 2018, matching the result for May 2018. New auto loans led loan growth during the month, rising 2.3%, followed by fixed-rate mortgages and unsecured personal loans (both rising 1.5%), used auto loans (1.3%), credit card loans (0.5%), and adjustable-rate mortgages (0.4%). On the decline during the month were home equity loans (-0.3%) and other mortgage loans (-0.5%).
SavingsCredit union savings balances increased 1.2% in June, compared to a 0.1% increase in May. Share drafts led savings growth during the month, rising 4.8%, followed by regular shares (0.8%), one-year certificates and individual retirement accounts (both rising 0.5%), and money market accounts (0.3%).
Asset qualityCredit unions’ 60+ day delinquency remained at 0.6% during June.
LiquidityThe loan-to-savings ratio increased from 83.4% in May to 83.5% in June. The liquidity ratio (the ratio of surplus funds maturing in less than one year to borrowings plus other liabilities) increased from 13.5% in May to 14.2% in June.
Memberships Total credit union memberships grew 0.4% during June to 116.3 million.
CapitalThe movement’s overall capital-to-asset ratio decreased from 10.6% in May to 10.5% in June. The total dollar amount of capital increased 0.7% to $153.8 billion.

iii
Monthly Credit Union Estimates June 2018
CHARTS
Distribution of Credit Union Savings . . . . . . . . . . . . . . . 1
Distribution of Credit Union Loans . . . . . . . . . . . . . . . . 1
Credit Union Liquidity Flows . . . . . . . . . . . . . . . . . . . . . 2
Distribution of Surplus Funds . . . . . . . . . . . . . . . . . . . . 2
Credit Union Capital Ratio and Delinquency . . . . . . . . 2
Credit Union Auto Loan and Savings Rates . . . . . . . . . . 3
Non-revolving Loan Market Shares . . . . . . . . . . . . . . . . 3
Savings & Consumer Credit Markets . . . . . . . . . . . . . . . 3
TABLES
National Credit Union Aggregates . . . . . . . . . . . . . . . . 5
National Credit Union Ratios . . . . . . . . . . . . . . . . . . . . . 6
National Credit Union Loan Data . . . . . . . . . . . . . . . . . 7
National Credit Union Income and Expense Ratios . . . 8
Credit Union & Household Savings Market Data . . . . . 9
Credit Union & Consumer Credit Market Data . . . . . . 10
The estimates in this report are based on information from a monthly sample of credit unions and are revised whenever more complete data are available. The estimates have been revised to reflect benchmark data as of March 2018.
Look for the July 2018 edition of Monthly Credit Union Estimates during the last week of August.
© Copyright 2018 by Credit Union National Association Inc. All rights reserved. No part of this publication may be reproduced, stored in a retrieval system, or transmitted in any form or by any means, electronic, mechanical, photocopying, recording, or otherwise without the prior written permission of the copyright owner.

1
Monthly Credit Union Estimates June 2018
Distribution of credit union savings
Distribution of credit union loans
IRAs6.4%
MMAs21.8%
Certs18.1%
Share Drafts15.0%
Reg/Other38.6%
IRAs6.8%
MMAs22.4%
Certs17.9%
Share Drafts14.5%
Reg/Other38.3%
June ’18 Savings = $1,233.5 Billion June ’17 Savings = $1,167.8 Billion
June ’18 Loans = $1,029.4 Billion June ’17 Loans = $934.5 Billion
Other6.0%Home Equity
5.3%Sec Mort
2.9%
1st Mort Adj 11.8%
1st MortFixed 29.0%
Unsec 9.7%
Used Auto 21.2%
New Auto14.0%
Other6.3%Home Equity
5.6%Sec Mort
3.1%
1st Mort Adj 11.5%
1st MortFixed 28.9%
Unsec 9.9%
Used Auto21.1%
New Auto13.6%
(1) Some credit unions sweep share draft balances weekly to reduce reserve requirements. This causes a distortion (i.e. total share draft balances appear smaller than they otherwise would be) in months ending on Friday.

2
Monthly Credit Union Estimates June 2018
Maturity of surplus fundsMarch 2018 vs. March 2017(All Credit Unions)(sum of cash plus investments)
Credit union liquidity flowsChanges during the period
Capital ratio and delinquency
3-10 yrs26.5%
1-3 yrs21.9%
<1 yr(includes cash)
50.5%
>10 yrs1.1%
3-10 yrs26.0%
1-3 yrs22.8%
<1 yr (includes cash)
50.1%
>10 yrs1.1%
Mar ’18 Mar ’17
0
1
2
3
delinquency rate
Jun ’18May ’18Apr ’18Mar ’18Feb ’18Jan ’18Dec ’17Nov ’17Oct ’17Sep ’17Aug ’17Jul ’17Jun ’17
loan delinquency as % of total loans
0
1
2
3
4
5
6
7
8
9
10
11
12
capital/assets
% captial ratio (excl loss allowance)
10.6% 10.7 10.8 10.7 10.7 10.7 10.7 10.7 10.6 10.5 10.5 10.6 10.5%
0.75% 0.76 0.77 0.78 0.810.85 0.88
0.810.72
0.66 0.64 0.64% 0.65
-$20
0
20
40
60
80
$100
investmentssavingsloans
from 1 year agofrom 6 months agofrom 3 months ago
for complete data, see page 5
50.94 52.44
8.33
June ’18
Bill
ions
of
dol
lars
94.86
7.77
$36.97
65.73
-$10.88-15.72
National Totals
March 2018 Total Surplus Funds= $391.98 Billion March 2017 Total Surplus Funds= $404.81 Billion

3
Monthly Credit Union Estimates June 2018
Credit union auto loan and savings rates
Savings & Consumer Credit Market Share
0
2
4
6
8
10
12
savings market
Jun ’18May ’18Apr ’18Mar ’18Feb ’18Jan ’18Dec ’17Nov ’17Oct ’17Sep ’17Aug ’17Jul ’17Jun ’170
2
4
6
8
10
12
consumer creditfor complete data, see pages 9 & 10
10.0 10.1 10.0 9.9 10.0 9.9 9.9 9.9
11.111.010.911.110.911.010.9 10.911.011.010.8 11.0
10.1 10.3 10.2 10.2 10.3
savings market consumer credit
0.0
0.5
1.0
1.5
2.0
2.5
3.0
3.5
regular sharesone-year certificatesNew auto loan (4 yr fixed)
Jun’18
May’18
Apr’18
Mar’18
Feb’18
Jan’18
Dec’17
Nov’17
Oct’17
Sep’17
Aug’17
Jul’17
Jun’17
3.05 3.03 3.06 3.09 3.10 3.08 3.12 3.16 3.16 3.25 3.24 3.26
0.20 0.20 0.20 0.21 0.21 0.21 0.21 0.22 0.22 0.22 0.23 0.23 0.23
3.38
1.08 1.08 1.10 1.13 1.13 1.16 1.20 1.22 1.25 1.31 1.34 1.38 1.44
Non-Revolving loan market shares
Other43.1%
Fin Co17.7%
Banks+SavInst(2)25.1%
CUs14.1%
May ’18 Non-Revolving= $2,857.1 Billion
Other42.6%
Fin Co18.8%
Banks+SavInst(2)25.2%
CUs13.3%
June ’17 Non-Revolving= $2,740.4 Billion
“other” consists of securitized loans no longer held on lenders’ balance sheets

4
Monthly Credit Union Estimates June 2018
National Credit Union Aggregates ($ in billions)
Borrow & Number Memberships Date Loans Surplus Funds Assets Savings Capital (1) oth. liab of CUs (millions)
Jun 18 $1,029.4 $376.3 $1,465.4 $1,233.5 $153.8 $78.0 5,714 116.3Latest % chg, month 1.3% 2.5% 1.6% 1.2% 0.7% 9.1% -0.1% 0.4%month % chg, yr ago 10.2% -2.8% 6.5% 5.6% 5.8% 23.6% -3.8% 4.1% % chg, YTD 5.2% 2.3% 4.4% 4.4% 2.7% 6.7% -1.5% 2.4%
Surplus Funds May-18 $1,016.3 $367.2 $1,443.0 $1,218.7 $152.8 $71.5 5,722 115.9 Apr-18 $1,003.0 $377.4 $1,439.0 $1,217.5 $151.7 $69.8 5,724 115.4 Mar-18 $992.4 $392.0 $1,442.0 $1,225.7 $151.3 $65.0 5,759 115.0 Feb-18 $984.6 $376.1 $1,418.1 $1,197.8 $149.8 $70.5 5,789 114.6 Jan-18 $982.6 $359.7 $1,401.7 $1,170.9 $149.7 $81.1 5,790 114.1 Dec-17 $978.4 $367.9 $1,404.0 $1,181.0 $149.9 $73.1 5,800 113.6Previous Nov-17 $970.8 $369.4 $1,398.2 $1,170.3 $149.5 $78.5 5,839 113.3twelve Oct-17 $964.6 $368.1 $1,390.2 $1,165.7 $149.1 $75.3 5,848 112.9months Sep-17 $958.5 $375.1 $1,388.5 $1,172.1 $148.2 $68.2 5,873 112.8 Aug-17 $952.7 $367.2 $1,374.9 $1,160.2 $147.8 $66.8 5,894 112.6 Jul-17 $944.1 $373.9 $1,372.0 $1,159.6 $146.5 $65.9 5,917 112.1 Jun-17 $934.5 $387.1 $1,376.4 $1,167.8 $145.4 $63.1 5,942 111.7
2016 $889.5 $374.6 $1,317.7 $1,114.4 $139.4 $63.9 6,022 109.2 2015 $804.9 $369.2 $1,227.8 $1,036.3 $130.9 $60.6 6,236 105.0 2014 $728.9 $369.2 $1,144.7 $970.4 $123.5 $50.8 6,513 101.5 2013 $660.1 $381.0 $1,083.7 $929.2 $113.3 $41.1 6,795 98.4 2012 $615.1 $389.4 $1,043.1 $896.6 $108.7 $37.7 7,070 96.0 2011 $587.0 $359.4 $982.1 $845.3 $100.2 $36.5 7,351 94.0 2010 $580.3 $320.0 $934.1 $803.8 $93.2 $37.2 7,597 92.6 2009 $587.4 $284.3 $904.0 $769.4 $88.7 $45.9 7,831 92.0 2008 $580.5 $219.6 $832.5 $697.4 $89.8 $45.3 8,088 90.7 2007 $544.1 $200.9 $776.6 $652.3 $88.4 $35.9 8,396 89.3 2006 $511.1 $192.2 $732.5 $620.6 $83.8 $28.1 8,662 88.2 2005 $474.2 $200.1 $700.4 $596.1 $77.7 $26.6 9,015 87.0 2004 $428.6 $215.8 $668.1 $574.5 $72.9 $20.8 9,346 86.1 2003 $388.5 $219.2 $629.1 $545.0 $67.6 $16.5 9,709 84.9 2002 $355.2 $200.4 $574.7 $499.7 $62.4 $12.6 10,041 83.4 2001 $330.8 $166.9 $514.7 $448.6 $56.3 $9.8 10,356 81.6 2000 $309.3 $127.5 $449.8 $389.3 $51.4 $9.1 10,684 79.8 1999 $278.9 $129.9 $422.6 $366.7 $46.5 $9.4 11,016 77.5 Investments Cash
1998 $252.3 $125.9 $9.1 $398.9 $349.0 $43.6 $6.3 11,392 75.6 1997 $238.4 $105.4 $8.1 $360.6 $315.4 $40.0 $5.2 11,652 73.5 1996 $220.1 $101.0 $7.5 $336.4 $295.1 $36.3 $5.0 11,884 71.4 1995 $198.4 $103.6 $7.4 $316.4 $278.8 $32.7 $4.9 12,232 69.3 1994 $181.7 $104.7 $6.5 $298.9 $263.4 $28.6 $6.9 12,560 67.4 1993 $157.6 $116.5 $6.5 $286.6 $255.5 $25.8 $5.3 12,978 65.4 1992 $145.5 $111.8 $6.6 $269.3 $242.9 $21.8 $4.6 13,379 63.8Previous 1991 $143.1 $90.6 $5.4 $244.4 $221.3 $18.6 $4.5 13,974 62.4year-end 1990 $141.3 $70.0 $4.8 $221.4 $200.8 $16.7 $3.9 14,532 61.5totals 1989 $136.5 $59.3 $4.8 $205.8 $187.0 $15.1 $3.7 15,212 60.5 1988 $126.4 $61.0 $4.2 $196.2 $178.4 $13.5 $4.3 15,700 58.6 1987 $110.8 $63.0 $4.0 $181.7 $166.0 $11.9 $3.8 16,277 56.5 1986 $96.4 $61.9 $4.0 $166.1 $152.7 $10.4 $3.0 16,910 54.1

5
Monthly Credit Union Estimates June 2018
National Credit Union Ratios
Net Distribution of Surplus Funds (1) Surplus Loans/ Capital Corp Comm Banks Funds Date Savings /Assets US Govt Agencies CUs S&Ls & MSBs Other Liquid (2)
Jun 18 83.5% 10.5% 4.4% 43.9% 0.7% 8.8% 42.1% 48.9% May-18 83.4 10.6 4.6 45.3 0.7 9.2 40.1 46.9 Apr-18 82.4 10.5 4.4 44.3 0.7 9.2 41.4 48.1 Mar-18 81.0 10.5 4.2 42.2 0.8 8.7 44.0 50.5 Feb-18 82.2 10.6 4.4 43.7 0.8 9.0 42.1 49.4 Latest Jan-18 83.9 10.7 4.8 46.0 0.8 9.4 39.0 46.4 thirteen Dec-17 82.8 10.7 4.4 45.0 0.8 9.4 40.3 47.6 months Nov-17 83.0 10.7 4.3 45.4 0.9 9.5 39.9 47.4 Oct-17 82.7 10.7 4.2 46.1 0.9 9.7 39.2 47.2 Sep-17 81.8 10.7 4.1 45.4 0.9 9.7 40.0 48.0 Aug-17 82.1 10.8 4.3 47.5 0.9 10.1 37.3 45.7 Jul-17 81.4 10.7 4.3 46.9 0.9 10.0 37.9 46.3 Jun-17 80.0 10.6 4.0 45.5 0.9 9.8 39.8 48.1
Cash
2016 79.8% 10.6% 4.4% 45.4% 0.8% 10.4% 39.1% 47.3% 2015 77.7 10.7 4.8 46.3 0.8 11.0 37.2 44.3 2014 75.1 10.8 3.0 50.2 0.8 11.8 34.2 42.4 2013 71.0 10.5 2.5 51.6 1.0 12.1 32.8 42.5 2012 68.6 10.4 2.5 49.4 1.0 12.4 34.6 46.9 2011 69.4 10.2 2.3 49.1 1.8 12.5 34.3 47.4 2010 72.2 10.0 3.4 45.5 5.5 13.5 32.1 47.2 2009 76.3 9.8 2.5 38.5 12.0 13.3 33.7 53.6 2008 83.2 10.8 1.9 37.0 15.1 12.9 33.2 55.4 2007 83.4 11.4 2.4 33.0 19.7 8.4 36.5 60.9 2006 82.3 11.4 1.1 36.3 17.9 8.4 36.3 60.3 2005 79.5 11.1 1.3 42.0 16.1 10.7 29.9 55.3 2004 74.6 10.9 1.8 41.7 15.0 12.0 29.5 49.7 2003 71.3 10.7 1.8 41.5 13.9 12.3 30.5 49.0 2002 71.1 10.9 3.1 1.5 38.3 12.5 11.9 32.8 56.5 2001 73.7 10.9 3.3 1.8 36.0 10.8 11.4 36.7 59.0 2000 79.5 11.4 4.2 3.3 39.4 10.7 10.2 32.1 60.0 1999 76.1 11.0 20.3 4.6 38.1 17.4 12.3 7.3 58.1 1998 72.3 10.9 6.7 6.9 33.2 27.7 16.1 9.4 64.3 1997 75.6 11.1 7.1 10.5 35.4 23.7 15.0 8.3 63.0 Previous 1996 74.6 10.8 6.9 13.1 35.1 21.7 15.1 8.1 59.3 year-end 1995 71.1 10.3 6.6 13.0 33.6 23.1 15.4 8.3 63.9 totals 1994 69.0 9.6 5.3 16.5 32.8 22.3 14.8 8.3 58.9 1993 61.7 9.0 5.3 15.5 26.5 26.6 17.8 8.3 58.9 1992 59.9 8.1 5.6 14.8 22.2 30.4 19.1 7.9 62.9 1991 64.7 7.6 6.5 10.6 16.6 33.1 26.5 6.7 72.1 1990 70.4 7.6 7.4 9.7 16.6 28.2 30.5 7.5 78.2 1989 73.0 7.3 7.4 9.7 16.6 28.2 30.5 7.5 78.2 1988 70.9 6.8 6.4 12.8 16.8 21.2 35.7 7.2 71.2 1987 66.8 6.5 6.0 13.6 14.3 20.3 38.6 7.3 70.9 1986 63.1 6.2 6.1 10.8 12.7 22.0 39.0 9.3 74.7 1985 67.8 6.5 6.7 10.3 14.4 21.9 39.2 7.6 79.6 1984 73.6 6.7 7.4 9.6 17.2 20.7 38.7 6.4 78.0 1983 67.5 6.4 6.1 9.0 16.2 21.0 41.2 6.5 79.3 1982 68.8 6.8 6.3 4.5 15.4 26.2 38.8 8.6
(1) Surplus Funds = The sum of cash plus investments.(2) Liquid means maturing within one year.

6
Monthly Credit Union Estimates June 2018
National Credit Union Loan Data
Average Loan Rates Distribution of Loans
Loan New Used Credit Home New Used 1st Mort 1st Mort Sec Home Date Delinq Auto Auto Card Unsec Equity Auto Auto Unsec Fixed Adj Mort Equity Other
Jun 18 0.64% 3.4% 4.1% 10.8% 11.4% 4.7% 14.0% 21.2% 9.7% 29.0% 11.8% 2.9% 5.3% 6.0% May-18 0.64 3.3 3.9 10.8 11.3 4.7 13.9 21.2 9.8 28.9 11.9 3.0 5.4 5.9 Apr-18 0.66 3.2 3.9 10.8 11.2 4.6 13.8 21.2 9.8 29.2 11.8 3.0 5.4 5.9 Mar-18 0.65 3.2 3.9 10.8 11.3 4.7 13.8 21.1 9.9 29.5 11.6 3.0 5.4 5.8 Latest Feb-18 0.72 3.2 3.8 10.8 11.3 4.6 13.7 21.0 10.0 29.1 11.6 3.0 5.5 6.1 thirteen Jan-18 0.81 3.2 3.8 10.7 11.3 4.6 13.7 20.9 10.1 29.0 11.5 3.1 5.6 6.1 months Dec-17 0.88 3.1 3.8 10.7 11.3 4.5 13.7 20.8 10.2 29.1 11.5 3.1 5.5 6.0 Nov-17 0.85 3.1 3.8 10.7 11.3 4.4 13.6 20.9 10.1 29.1 11.4 3.1 5.6 6.1 Oct-17 0.81 3.1 3.8 10.7 11.3 4.4 13.6 20.9 10.0 28.9 11.6 3.1 5.6 6.2 Sep-17 0.78 3.1 3.8 10.7 11.3 4.4 13.6 21.0 10.0 29.1 11.5 3.1 5.5 6.2 Aug-17 0.77 3.1 3.7 10.6 11.3 4.3 13.6 21.1 10.0 28.9 11.5 3.1 5.6 6.3 Jul-17 0.76 3.0 3.7 10.6 11.3 4.2 13.6 21.1 10.0 29.0 11.4 3.1 5.6 6.3 Jun-17 0.75 3.0 3.7 10.5 11.3 4.1 13.6 21.1 9.9 28.9 11.5 3.1 5.6 6.3
2016 0.8% 2.9% 3.6% 10.1% 11.2% 4.5% 13.3% 20.8% 10.3% 28.8% 11.8% 3.2% 5.6% 6.1% 2015 0.8 3.0 3.6 10.0 11.2 4.1 12.6 20.5 10.6 28.7 12.2 3.6 5.8 6.0 2014 0.8 3.0 3.7 9.6 11.2 4.1 12.0 20.1 10.9 28.8 12.2 4.1 6.0 5.9 2013 1.0 3.1 3.8 9.8 11.3 4.2 11.0 19.6 11.1 29.8 11.7 4.8 6.1 5.8 2012 1.2 3.4 4.1 9.8 11.5 4.2 10.5 19.1 11.0 29.1 11.9 5.6 6.7 6.2 2011 1.6 4.0 4.6 10.0 11.6 4.3 10.1 18.5 10.9 28.4 12.2 6.7 7.3 5.9 2010 1.7 4.9 5.4 10.1 11.7 4.4 11.0 17.8 10.8 27.2 12.1 7.6 7.6 5.7 2009 1.8 5.6 6.1 10.3 11.6 4.5 13.1 17.0 10.5 26.1 11.7 8.6 7.5 5.5 2008 1.4 5.9 6.4 10.5 11.7 4.7 14.4 16.6 10.2 24.9 11.9 9.8 7.2 5.1 2007 0.9 6.4 7.0 11.0 12.2 7.3 16.4 16.9 10.3 22.6 11.6 10.4 6.9 4.9 2006 0.7 6.5 7.0 11.2 12.3 8.0 17.8 17.6 9.9 21.0 11.4 9.5 7.5 5.2 2005 0.7 5.8 6.4 11.1 12.1 6.9 18.2 18.9 9.8 20.9 10.8 7.7 8.3 5.5 2004 0.7 5.2 5.8 11.0 11.7 5.1 17.1 20.4 10.4 21.1 10.4 6.7 8.2 5.8 2003 0.8 5.2 5.7 11.1 11.8 4.5 16.8 21.5 11.3 22.6 8.7 6.3 7.0 5.9 2002 0.8 6.0 6.6 11.6 12.2 6.0 17.5 20.9 12.3 21.3 8.0 6.8 6.7 6.5 2001 0.8 6.8 7.4 11.9 12.6 6.0 18.6 20.5 13.5 20.1 7.7 7.1 6.1 6.4 2000 0.7 8.2 8.8 12.6 13.5 9.2 20.1 19.9 14.6 18.1 7.3 7.5 5.9 6.6 1999 0.8 7.5 8.3 12.5 13.1 8.2 19.3 20.1 15.6 19.2 7.0 6.6 5.6 6.6 1998 0.9 7.6 8.3 12.7 13.2 8.3 19.5 19.7 17.1 17.9 7.1 6.3 5.7 6.7 Previous 1997 1.0 7.9 8.7 12.9 13.4 8.8 21.2 18.7 18.3 14.6 7.8 6.3 6.1 7.0 year-end 1996 1.0 8.0 8.8 13.0 13.3 8.9 22.8 17.3 19.4 13.6 7.8 5.9 5.9 7.3 totals 1995 1.0 8.2 9.1 13.1 13.5 9.2 24.1 15.9 20.0 12.7 7.8 5.7 6.0 7.8 1994 0.9 7.9 8.8 13.2 13.3 9.2 23.4 15.1 20.3 13.0 8.3 5.4 6.2 8.3 1993 1.1 7.2 8.4 13.2 13.1 9.2 21.0 14.3 21.6 13.4 8.2 5.4 7.1 9.0 1992 1.3 8.3 9.5 13.9 13.6 8.7 20.8 12.5 21.6 12.7 8.5 6.2 8.1 9.6 1991 1.6 9.6 11.0 15.1 14.5 9.2 22.0 10.6 20.8 11.9 8.2 6.7 8.7 11.1 1990 1.7 10.6 12.1 15.2 15.1 11.2 23.0 10.2 20.4 11.1 8.4 7.0 7.9 12.0 1989 1.8 10.8 12.2 14.9 15.0 11.5 23.8 10.1 20.5 10.8 8.4 6.9 6.6 13.1 1988 1.8 10.5 15.1 14.7 24.1 20.4 1987 1.9 10.3 14.5 23.5 23.3 1986 2.2 10.8 14.8 25.6 22.5 1985 2.1 12.6 16.2 1984 2.0 13.5 16.6 1983 2.4 13.1 16.4 1982 3.8 15.1 15.9
* Beginning in June 2004 there is a break in this series. Prior to June 2004 adjustable mortgages were defined as those that called for a periodic interest rate adjustment. In 2004 and thereafter we define adjustable mortgages to also include balloon/hybrid mortgages that adjust in five years or less. Balloons/hybrids of this type were not separately reported on call reports prior to June 2004 so some were likely reported as fixed mortgages and some as adjustable.

7
Monthly Credit Union Estimates June 2018
National Credit Union Income and Expense Ratios (1)
Interest Div/Int Yield on Cost of Gross Other Operating Net Loss (2) Net Date Assets - Assets = Spread Income Expense Spread Prov Income (3)
First-Quarter 2018 3.63 0.60 303 142 308 137 48 90 Year-End 2017 3.53 0.56 297 135 307 125 47 77 Mid-Year 2017 3.44 0.53 291 132 304 119 43 76
2016 3.40 0.52 287 139 310 116 40 76 2015 3.36 0.52 285 136 311 109 34 75 2014 3.36 0.54 283 134 310 107 28 80 2013 3.36 0.59 278 139 314 103 26 83 2012 3.62 0.72 290 145 316 120 35 84 2011 4.05 0.92 312 131 326 117 50 68 2010 4.46 1.21 325 133 319 139 78 50 2009 4.91 1.73 318 161 315 165 111 18 2008 5.56 2.41 314 136 335 116 85 31 2007 5.89 2.78 310 136 338 107 43 64 2006 5.52 2.35 317 129 333 113 31 82 2005 4.97 1.73 324 125 324 125 39 85 2004 4.72 1.41 331 116 320 126 35 92 2003 5.03 1.65 338 114 319 132 34 98 2002 5.89 2.28 361 105 325 141 35 107 2001 6.93 3.35 358 105 335 128 33 95 2000 7.34 3.56 377 95 339 133 31 102Previous 1999 7.07 3.36 371 89 332 127 34 93year-end 1998 7.38 3.57 381 86 331 136 42 95totals 1997 7.54 3.61 393 81 329 145 43 102 1996 7.47 3.56 391 77 323 145 32 113 1995 7.39 3.54 385 70 317 139 26 113 1994 6.84 2.98 386 64 305 145 24 121 1993 7.04 3.07 397 71 301 167 28 139 1992 7.95 3.87 408 71 306 173 36 136 1991 9.16 5.27 389 65 314 139 45 94 1990 9.88 5.94 394 61 319 137 42 95 1989 10.00 6.02 398 58 319 137 43 94 1988 9.56 5.63 392 52 307 138 39 99 1987 9.43 5.56 387 45 300 131 37 94 1986 10.26 6.32 394 54 311 136 36 100 1985 11.43 7.10 433 48 336 145 29 116 1984 11.96 7.36 460 40 347 153 1983 11.65 7.04 461 35 368 128 1982 12.82 7.53 529 418 1981 12.31 7.22 509 400
(1) Interest yield and dividend/interest cost expressed as percent of average total assets, all other fiqures expressed in basis points (100 bp=1%) of avg assets.(2) For data through 1991, net loan chargeoffs are reported instead of loan loss provisions.(3) Net income is after the corporate stabilizatation expense
8
Monthly Credit Union Estimates June 2018
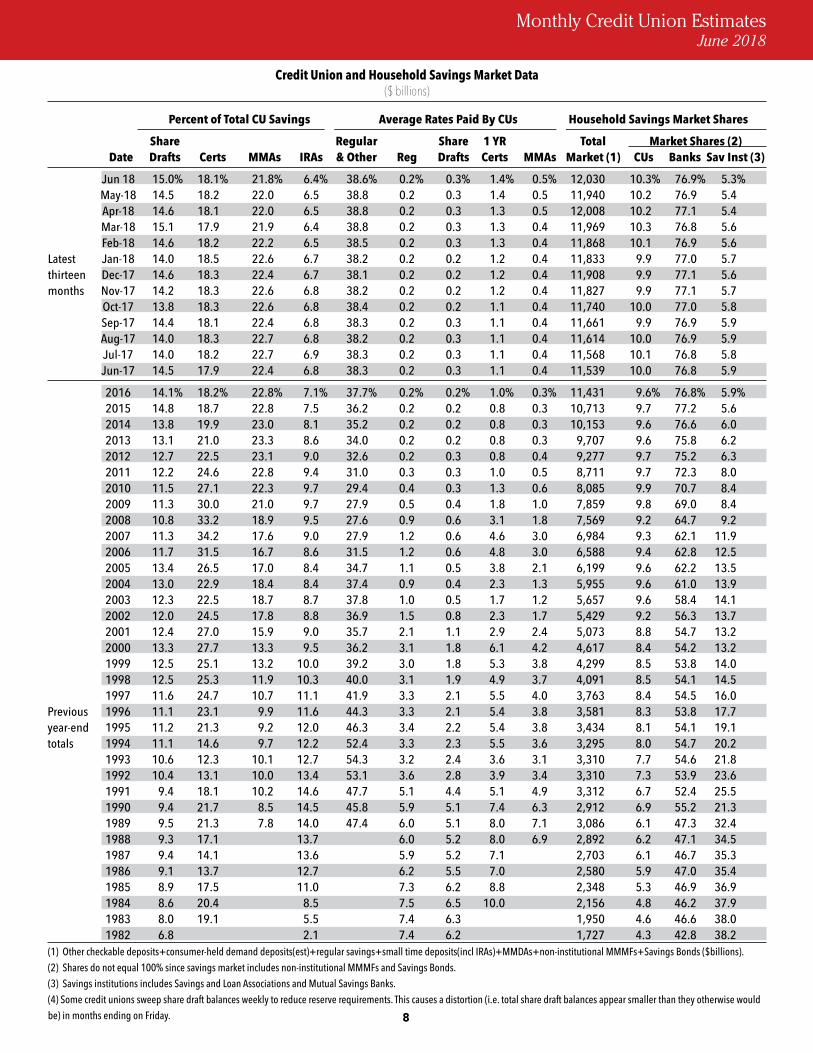
Credit Union and Household Savings Market Data($ billions)
Percent of Total CU Savings Average Rates Paid By CUs Household Savings Market Shares
Share Regular Share 1 YR Total Market Shares (2) Date Drafts Certs MMAs IRAs & Other Reg Drafts Certs MMAs Market (1) CUs Banks Sav Inst (3)
Jun 18 15.0% 18.1% 21.8% 6.4% 38.6% 0.2% 0.3% 1.4% 0.5% 12,030 10.3% 76.9% 5.3% May-18 14.5 18.2 22.0 6.5 38.8 0.2 0.3 1.4 0.5 11,940 10.2 76.9 5.4 Apr-18 14.6 18.1 22.0 6.5 38.8 0.2 0.3 1.3 0.5 12,008 10.2 77.1 5.4 Mar-18 15.1 17.9 21.9 6.4 38.8 0.2 0.3 1.3 0.4 11,969 10.3 76.8 5.6 Feb-18 14.6 18.2 22.2 6.5 38.5 0.2 0.3 1.3 0.4 11,868 10.1 76.9 5.6 Latest Jan-18 14.0 18.5 22.6 6.7 38.2 0.2 0.2 1.2 0.4 11,833 9.9 77.0 5.7 thirteen Dec-17 14.6 18.3 22.4 6.7 38.1 0.2 0.2 1.2 0.4 11,908 9.9 77.1 5.6 months Nov-17 14.2 18.3 22.6 6.8 38.2 0.2 0.2 1.2 0.4 11,827 9.9 77.1 5.7 Oct-17 13.8 18.3 22.6 6.8 38.4 0.2 0.2 1.1 0.4 11,740 10.0 77.0 5.8 Sep-17 14.4 18.1 22.4 6.8 38.3 0.2 0.3 1.1 0.4 11,661 9.9 76.9 5.9 Aug-17 14.0 18.3 22.7 6.8 38.2 0.2 0.3 1.1 0.4 11,614 10.0 76.9 5.9 Jul-17 14.0 18.2 22.7 6.9 38.3 0.2 0.3 1.1 0.4 11,568 10.1 76.8 5.8 Jun-17 14.5 17.9 22.4 6.8 38.3 0.2 0.3 1.1 0.4 11,539 10.0 76.8 5.9
2016 14.1% 18.2% 22.8% 7.1% 37.7% 0.2% 0.2% 1.0% 0.3% 11,431 9.6% 76.8% 5.9% 2015 14.8 18.7 22.8 7.5 36.2 0.2 0.2 0.8 0.3 10,713 9.7 77.2 5.6 2014 13.8 19.9 23.0 8.1 35.2 0.2 0.2 0.8 0.3 10,153 9.6 76.6 6.0 2013 13.1 21.0 23.3 8.6 34.0 0.2 0.2 0.8 0.3 9,707 9.6 75.8 6.2 2012 12.7 22.5 23.1 9.0 32.6 0.2 0.3 0.8 0.4 9,277 9.7 75.2 6.3 2011 12.2 24.6 22.8 9.4 31.0 0.3 0.3 1.0 0.5 8,711 9.7 72.3 8.0 2010 11.5 27.1 22.3 9.7 29.4 0.4 0.3 1.3 0.6 8,085 9.9 70.7 8.4 2009 11.3 30.0 21.0 9.7 27.9 0.5 0.4 1.8 1.0 7,859 9.8 69.0 8.4 2008 10.8 33.2 18.9 9.5 27.6 0.9 0.6 3.1 1.8 7,569 9.2 64.7 9.2 2007 11.3 34.2 17.6 9.0 27.9 1.2 0.6 4.6 3.0 6,984 9.3 62.1 11.9 2006 11.7 31.5 16.7 8.6 31.5 1.2 0.6 4.8 3.0 6,588 9.4 62.8 12.5 2005 13.4 26.5 17.0 8.4 34.7 1.1 0.5 3.8 2.1 6,199 9.6 62.2 13.5 2004 13.0 22.9 18.4 8.4 37.4 0.9 0.4 2.3 1.3 5,955 9.6 61.0 13.9 2003 12.3 22.5 18.7 8.7 37.8 1.0 0.5 1.7 1.2 5,657 9.6 58.4 14.1 2002 12.0 24.5 17.8 8.8 36.9 1.5 0.8 2.3 1.7 5,429 9.2 56.3 13.7 2001 12.4 27.0 15.9 9.0 35.7 2.1 1.1 2.9 2.4 5,073 8.8 54.7 13.2 2000 13.3 27.7 13.3 9.5 36.2 3.1 1.8 6.1 4.2 4,617 8.4 54.2 13.2 1999 12.5 25.1 13.2 10.0 39.2 3.0 1.8 5.3 3.8 4,299 8.5 53.8 14.0 1998 12.5 25.3 11.9 10.3 40.0 3.1 1.9 4.9 3.7 4,091 8.5 54.1 14.5 1997 11.6 24.7 10.7 11.1 41.9 3.3 2.1 5.5 4.0 3,763 8.4 54.5 16.0 Previous 1996 11.1 23.1 9.9 11.6 44.3 3.3 2.1 5.4 3.8 3,581 8.3 53.8 17.7 year-end 1995 11.2 21.3 9.2 12.0 46.3 3.4 2.2 5.4 3.8 3,434 8.1 54.1 19.1 totals 1994 11.1 14.6 9.7 12.2 52.4 3.3 2.3 5.5 3.6 3,295 8.0 54.7 20.2 1993 10.6 12.3 10.1 12.7 54.3 3.2 2.4 3.6 3.1 3,310 7.7 54.6 21.8 1992 10.4 13.1 10.0 13.4 53.1 3.6 2.8 3.9 3.4 3,310 7.3 53.9 23.6 1991 9.4 18.1 10.2 14.6 47.7 5.1 4.4 5.1 4.9 3,312 6.7 52.4 25.5 1990 9.4 21.7 8.5 14.5 45.8 5.9 5.1 7.4 6.3 2,912 6.9 55.2 21.3 1989 9.5 21.3 7.8 14.0 47.4 6.0 5.1 8.0 7.1 3,086 6.1 47.3 32.4 1988 9.3 17.1 13.7 6.0 5.2 8.0 6.9 2,892 6.2 47.1 34.5 1987 9.4 14.1 13.6 5.9 5.2 7.1 2,703 6.1 46.7 35.3 1986 9.1 13.7 12.7 6.2 5.5 7.0 2,580 5.9 47.0 35.4 1985 8.9 17.5 11.0 7.3 6.2 8.8 2,348 5.3 46.9 36.9 1984 8.6 20.4 8.5 7.5 6.5 10.0 2,156 4.8 46.2 37.9 1983 8.0 19.1 5.5 7.4 6.3 1,950 4.6 46.6 38.0 1982 6.8 2.1 7.4 6.2 1,727 4.3 42.8 38.2 (1) Other checkable deposits+consumer-held demand deposits(est)+regular savings+small time deposits(incl IRAs)+MMDAs+non-institutional MMMFs+Savings Bonds ($billions).(2) Shares do not equal 100% since savings market includes non-institutional MMMFs and Savings Bonds.(3) Savings institutions includes Savings and Loan Associations and Mutual Savings Banks.(4) Some credit unions sweep share draft balances weekly to reduce reserve requirements. This causes a distortion (i.e. total share draft balances appear smaller than they otherwise would be) in months ending on Friday.

9
Monthly Credit Union Estimates June 2018
Credit Union And Consumer Credit Market Data**($ billions)
Consumer Loan Market Shares Non-Revolving Consumer Loan Market Shares(3) Market Shares(1) Market Shares Total Banks+ Total Banks+ Date Market CUs Sav Inst(2) Fin Co Market CUs Sav Inst(2) Fin Co
Jun 18 N/A N/A% N/A% N/A% N/A N/A% N/A% N/A% May-18 3897.7 11.1 41.0 13.6 2857.1 14.1 25.1 17.7 Apr-18 3873.2 11.0 40.8 13.7 2851.6 13.7 25.0 17.7 Mar-18 3862.9 10.9 40.7 13.7 2844.3 13.6 25.0 17.8 Feb-18 3854.1 11.1 41.0 13.9 2839.9 13.6 25.0 17.9 Latest Jan-18 3842.9 11.0 41.6 14.0 2835.6 13.5 25.1 18.0 thirteen Dec-17 3831.0 10.9 42.2 14.1 2804.2 13.5 25.3 18.3 months Nov-17 3817.8 11.0 41.7 14.1 2801.7 13.5 25.2 18.3 Oct-17 3787.6 10.9 41.3 14.2 2794.7 13.4 25.2 18.4 Sep-17 3767.6 10.9 40.9 14.3 2784.7 13.3 25.3 18.4 Aug-17 3759.4 11.0 40.8 14.4 2774.3 13.4 25.2 18.5 Jul-17 3746.0 11.0 40.6 14.5 2751.9 13.3 25.3 18.7 Jun-17 3731.3 10.8 40.6 14.5 2740.4 13.3 25.2 18.8 2016 3645.2 10.4 42.0 15.0 2675.6 12.8 25.7 19.5 2015 3535.7 9.7 40.4 19.3 2597.9 11.7 24.7 24.1 2014 3317.2 9.1 40.5 20.6 2427.2 11.1 25.2 25.7 2013 3097.9 8.6 41.0 21.9 2240.3 10.3 25.8 27.3 Banks Sav Inst(2) Banks Sav Inst(2)
2012 2924.3 8.3 38.5 23.25 3.2 2078.5 10.1 24.6 29.3 1.5 2011 2631.5 8.5 41.8 26.24 3.5 1780.1 10.9 27.7 27.7 2.0 2010 2434.7 9.3 45.1 21.3 3.6 1606.8 12.1 31.7 26.2 2.3 2009 2478.9 9.6 34.5 19.7 3.1 1585.5 12.9 30.9 28.0 2.5 2008 2592.1 9.1 33.9 22.2 3.3 1605.3 12.7 30.3 31.5 2.8 2007 2551.9 9.2 31.5 22.9 3.6 1582.3 12.9 28.5 31.5 2.9 2006 2418.3 9.7 30.7 22.1 4.0 1513.2 13.8 27.4 29.9 3.5 2005 2326.5 9.8 30.4 22.2 4.7 1476.7 13.8 26.8 30.5 4.6 2004 2151.4 10.0 32.7 17.1 4.2 1323.5 14.5 29.4 24.7 4.8 2003 2050.1 10.0 32.2 14.4 3.8 1262.5 14.5 29.8 20.4 4.3 2002 1938.1 10.1 30.3 12.3 3.5 1194.9 14.5 29.8 16.6 4.4 2001 1856.7 10.2 30.1 12.8 3.7 1126.4 14.9 29.6 18.3 4.6 2000 1719.0 10.7 31.5 12.8 3.8 1034.6 15.7 31.3 17.7 4.6 1999 1542.4 10.9 32.4 13.1 4.0 928.4 15.8 33.4 18.2 4.9 1998 1430.6 10.9 35.6 12.8 3.6 844.1 16.1 35.4 17.9 4.6 1997 1333.8 11.4 38.4 12.6 3.5 789.3 16.8 37.1 16.5 4.5 Previous 1996 1271.7 11.3 41.4 12.2 3.5 749.4 16.9 39.8 16.4 4.6 year-end 1995 1168.0 11.3 43.0 13.0 3.4 703.9 16.5 41.4 17.6 4.5 totals 1994 1021.0 11.7 44.9 13.2 3.8 637.8 16.6 43.4 17.0 4.6 1993 886.2 11.5 44.7 13.1 4.3 561.2 16.0 43.8 16.5 4.9 1992 824.8 11.1 44.0 14.3 4.5 532.5 15.4 43.2 18.3 5.2 1991 815.6 11.1 45.4 14.9 5.2 538.5 15.4 43.1 19.2 6.3 1990 823.6 11.0 46.4 16.2 6.0 573.5 14.9 43.3 20.5 7.4 1989*** 807.7 11.2 47.5 17.2 7.7 587.0 14.5 43.0 21.4 9.4
**Total consumer installment credit is not seasonally adjusted;***There is a break in the series beginning in 1989, due to inclusion of securitized loans. (1)Shares do not total 100% since non-financials also have a share of the consumer credit market.(2)Saving Institutions includes Savings and Loan Associations and Mutual Savings Banks.(3)Source: Federal Reserve Statistical Release #G.19. (4)Prior to 1983, Total Consumer Credit Market and CU shares include CU 2nd mortgages.(5)Non-revolving loans include auto loans and all other loans not included in revolving credit. These may be secured or unsecured.