monthly economic and financial market outlook
TRANSCRIPT

Monthly Economic and Financial Market Outlook Nigerian Economy Shows Positive Outlook
April 2017
Monthly Economic & Financial Market Outlook: April 2017
FSDH Research www.fsdhgroup.com 2
Executive Summary
The Nigerian economy is showing signs of positive outlook on the back of increase
in oil price, oil production and increase in the supply of foreign exchange to both
retail and corporate users
The Federal Open Market Committee (FOMC) of the United States Federal
Reserve (The Fed) indicates that it may increase the interest rate further in 2017
The Organisation of Petroleum Exporting Countries (OPEC) maintains its global
economic growth forecast for 2017
The inflation rate dropped in February 2017 for the first time in 15 months. Our
forecast shows that it will drop further in March 2017
The external reserves continues to grow due to increase in oil production and price
The yield on the shortest tenor on the Nigerian Treasury Bill (NTB) dropped in
March 2017, while that of the longest tenor increased. The expected drop in
inflation rate may make it to drop further for all tenors. Meanwhile, the funding for
foreign exchange supply may drive up liquidity and limit the extent of the drop in
yield
Improved investors’ confidence may make the equity market to appreciate in April
2017.

Monthly Economic & Financial Market Outlook: April 2017
FSDH Research www.fsdhgroup.com 3
1.0 Global Developments:
In the countries we monitored, the prices of government bonds appreciated in more
countries in March 2017 than they depreciated. The 16.39% January 2022 Nigeria
Government Bond and the 7.60% April 2021 Russia Government Bond recorded the
highest month-on-month price increases of 1.35% and 1.28% to 102.41 and 99.05,
respectively. The 17% April 2022 Egypt Government Bond recorded a month-on-
month price decrease of 0.98% to 99.49. This was followed by the 8.80% September
2023 Turkey Government Bond with a marginal decrease of 0.77% to 90.80. The Egypt,
Nigeria, United States (U.S.) and Turkey Bonds closed the month at negative real yields.
Other bonds we monitored closed the month at positive real yields. The Russia
Government Bond offers the most attractive real yield amongst the selected bonds
in March 2017.
According to the final figures that the United States (U.S.) Bureau of Economic
Analysis released, the US economy grew by 2.1% in Q4 2016 (quarter-on-quarter),
higher than 1.9% in the previous estimates. Consumer spending and inventories
increased faster than anticipated while investment moderated lower and weighed down
growth. In 2016, the GDP grew by 1.6%, the lowest since 2011. The inflation rate in the
U.S stood at 2.7% (year-on-year) in February 2017, from 2.5% in January 2017 and in line
with market expectations. It was the highest inflation rate since March 2012, boosted by a
rise in gasoline prices. The Federal Open Market Committee (FOMC) of the U.S Federal
Reserves increased the Fed Rate by 0.25% to a range of 0.75%-1.00% in March 2017.
Table 1: Summary of Key Indicators
S/N Indicators China Egypt India Kenya Nigeria Russia South Africa Turkey USA
1 Bond Price 102.28 99.49 105.47 97.63 102.41 99.05 97.42 90.80 97.88
2 Bond Yield 3.09% 17.16% 6.87% 13.34% 15.64% 8.03% 8.31% 10.81% 2.12%
3 Bond Price MoM Change (0.37%) (0.98%) 0.31% 0.51% 1.35% 1.28% (0.03%) (0.77%) 0.17%
4 Bond Yield MoM Change 0.06% 0.31% (0.09%) (0.12%) (0.42%) (0.38%) 0.01% 0.19% (0.02%)
5 Bond Price YTD Change (1.38%) (2.00%) (1.01%) 0.51% 0.00% 0.87% 1.54% 1.79% 0.50%
6 Bond Yield YTD Change 0.24% 0.62% 0.18% (0.12%) (0.03%) (0.24%) (0.31%) (0.30%) (0.07%)
7 Real Yield 2.29% (13.04%) 3.22% 3.06% (2.14%) 3.43% 2.01% (0.48%) (0.58%)
8 Volatility 0.28 0.65 0.27 0.18 0.55 0.48 0.62 0.78 0.45
9 FX Rate MoM Change* 0.29% 13.04% (2.84%) 0.08% (0.31%) (3.80%) 2.13% 0.05% 0.71%
10 FX Rate YTD Change* (0.84%) 0.18% (4.74%) 0.46% (0.33%) (9.41%) (2.43%) 3.10% 1.27%
11 Inflation Rate 0.80% 30.20% 3.65% 10.28% 17.78% 4.60% 6.30% 11.29% 2.70%
12 Policy Rate 4.35% 14.75% 6.25% 10.00% 14.00% 9.75% 7.00% 8.00% 1.00%
13 Debt to GDP 43.90% 85.00% 69.00% 52.80% 11.50% 17.70% 50.10% 32.90% 104.00%
14 GDP Growth Rate 6.80% 2.30% 7.00% 5.70% (1.30%) 0.30% 0.70% 3.50% 2.00%
15 Nominal GDP (US$) 11,008bn 331bn 2,095bn 63.4bn 481bn 1,331bn 315bn 718bn 18,037bn
16 Current Acct to GDP 1.80% (3.40%) (1.25%) (11.40%) (3.80%) 1.80% (3.30%) (4.50%) (2.60%)
*-ve means appreciation while +ve means depreciation
Sources – Bloomberg, Central Banks, FSDH Research Analysis and Trading Economics
The prices of government bonds
appreciated in more countries in
March 2017 than they
depreciated.
The U.S economy grew by 2.1% in
Q4 2016 (quarter-on-quarter),
higher than 1.9% in the previous
estimates.

Monthly Economic & Financial Market Outlook: April 2017
FSDH Research www.fsdhgroup.com 4
.
1.1 The Global GDP:
The Organization of the Petroleum Exporting Countries (OPEC) maintained its global
growth forecast of 3.0% and 3.2% for 2016 and 2017, respectively in its monthly
report for March 2017. OPEC posited that global economic growth has stabilised and the
estimated growth dynamic is consistent with its previous views. It added that the
Organization for Economic Cooperation and Development (OECD) economies are
expected to grow by 1.9% in 2017. The OECD growth may come from fiscal stimulus in the
U.S but the magnitude and timeline of this remain uncertain.
OPEC noted that India and China will lead growth in the emerging and developing
economies. Growth in India may improve after the impact of demonetisation has been
digested. China has reiterated its intention to target a higher growth level than is currently
accommodated for in the global growth forecast. The stabilisation of the oil market is also
supporting global growth, as oil producers are now benefitting from a recovery in output
values and once again rising oil sector related investments.
The cartel however says that the policy issues across the globe and monetary policy
decisions of the major central banks are the major uncertainties the global economy faces.
It also noted that the monetary policy tightening will continue in the U.S. This may also
apply to other major central banks, though a relatively more accommodative stance is
expected from some central banks, particularly the European Central Bank (ECB) and the
Bank of Japan (BoJ). Global debt levels remain high in some key economies, an issue that
will probably require further attention as interest rates may rise gradually and the U.S
Dollar may continue to strengthen because of the rising inflation rate.
.
Table 2: Economic Growth Rate Forecast
2016E 2017F
World 3.0% 3.2%
OECD 1.7% 1.9%
USA 1.6% 2.2%
Japan 1.0% 1.1%
Euro-zone 1.7% 1.6%
China 6.7% 6.2%
India 7.5% 7.0%
Brazil (3.6%) 0.5%
Russia (0.5%) 1.0%
Source: OPEC Monthly Report, March 2017
OPEC indicated a global growth
forecast of 3.0% and 3.2% for
2016 and 2017, respectively in its
monthly report for March 2017.
Policy issues across the globe and
monetary policy decisions of the
major central banks are the major
uncertainties the global economy
faces.

Monthly Economic & Financial Market Outlook: April 2017
FSDH Research www.fsdhgroup.com 5
0.00%
0.50%
1.00%
1.50%
2.00%
2.50%
3.00%
3.50%
4.00%
4.50%
U.S Fed Rate (2003 - March 2017)
2.00
2.05
2.10
2.15
2.20
2.25
2.30
2.35
2.40
2.45
20-Dec-16 20-Jan-17 20-Feb-17 20-Mar-17
1.75% May 2023 U.S Government Treasury Note
1.2 FOMC Rate Decision:
The Federal Open Market Committee (FOMC) of the U.S. Federal Reserve (The Fed)
raised the Federal Funds Rate (Fed Rate) by 0.25% to 0.75%-1.0% at its March 2017
meeting and indicated an accelerated pace of increase over time. There are
indications that the FOMC will increase the Fed Rate further in 2017, as the Fed’s median
projection in 2017 is 1.4%. The implication of the rate hike in the U.S is that yields on
Dollar denominated fixed income securities may rise. This may lead to capital flight from
emerging markets to the U.S, and cause an appreciation in the value of the U.S Dollar.
This may also lead to a drop in the price of crude oil – Nigeria’s main foreign exchange
earner. The possible increase in shale oil production is another factor that may put
downward pressure on crude oil prices.
The implications of the rate hike in the U.S are highlighted below:
Flow of funds to the U.S. from emerging markets and developing countries.
Appreciation of the U.S. Dollar.
Downward pressure on commodity prices.
Increase in the yields on the Dollar denominated fixed income securities.
Increase in the cost of fund from the international debt market.
Drop in the global liquidity.
The U.S Fed raised the Federal
Funds Rate (Fed Rate) by 0.25%
to 0.75%-1.0% at its March 2017
meeting and indicated an
accelerated pace of increase over
time.
Monthly Economic & Financial Market Outlook: April 2017
FSDH Research www.fsdhgroup.com 6
7,229
8,930
2,895
-291 -2,000
0
2,000
4,000
6,000
8,000
10,000
2013 2014 2015 2016
Trade Balance (2013 - 2016) - Nbn
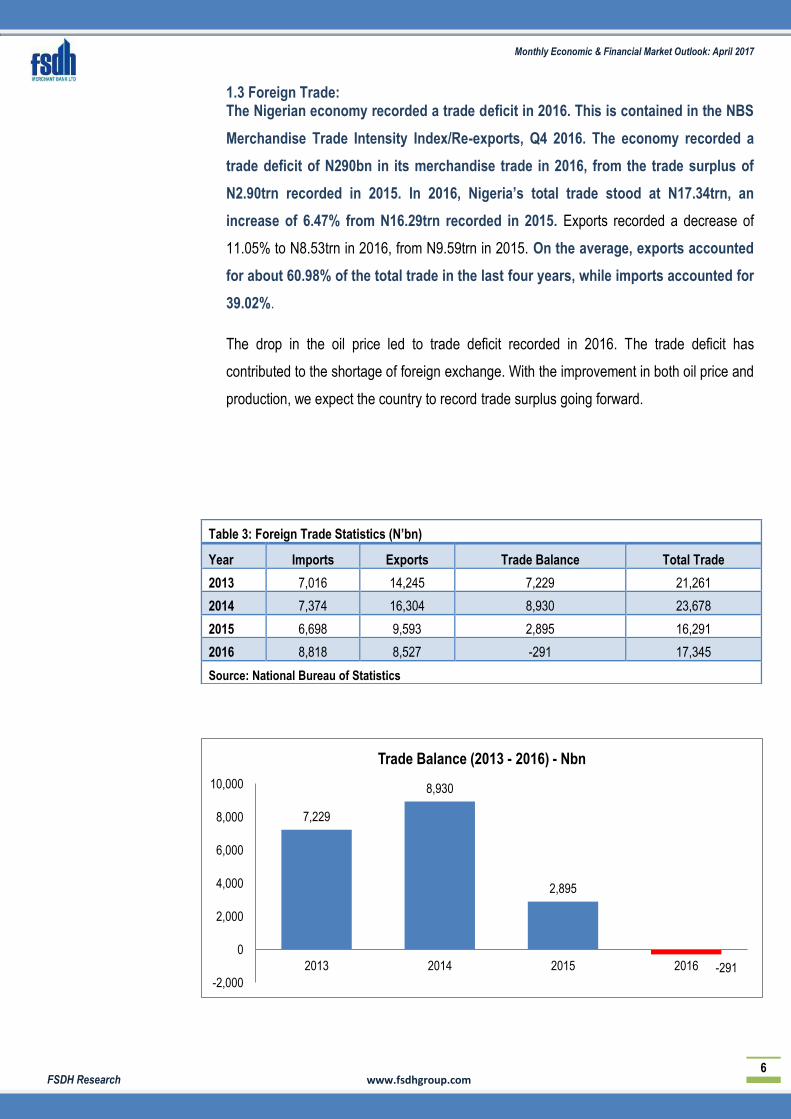
1.3 Foreign Trade: The Nigerian economy recorded a trade deficit in 2016. This is contained in the NBS
Merchandise Trade Intensity Index/Re-exports, Q4 2016. The economy recorded a
trade deficit of N290bn in its merchandise trade in 2016, from the trade surplus of
N2.90trn recorded in 2015. In 2016, Nigeria’s total trade stood at N17.34trn, an
increase of 6.47% from N16.29trn recorded in 2015. Exports recorded a decrease of
11.05% to N8.53trn in 2016, from N9.59trn in 2015. On the average, exports accounted
for about 60.98% of the total trade in the last four years, while imports accounted for
39.02%.
The drop in the oil price led to trade deficit recorded in 2016. The trade deficit has
contributed to the shortage of foreign exchange. With the improvement in both oil price and
production, we expect the country to record trade surplus going forward.
Table 3: Foreign Trade Statistics (N’bn)
Year Imports Exports Trade Balance Total Trade
2013 7,016 14,245 7,229 21,261
2014 7,374 16,304 8,930 23,678
2015 6,698 9,593 2,895 16,291
2016 8,818 8,527 -291 17,345
Source: National Bureau of Statistics

Monthly Economic & Financial Market Outlook: April 2017
FSDH Research www.fsdhgroup.com 7
1.4 Inflation Rate:
Whist the inflation rate dropped in February 2017 to 17.78% (the first drop in 15 months) as
a result of a base effect, we note that the month-on-month change of 1.49% was the
highest increase since July 2016. This means that inflationary pressure persists in Nigeria.
The inflation rate in February 2017 was driven by the faster growth in all major divisions of
the Headline Index. Year-on-year (y-o-y), the Food Price Index (FPI) increased by 18.53%
in February 2017, from 17.82% in January 2017. The FPI was driven by higher prices of
Bread and Cereals; Meat; Fish; Potatoes; yams and Other tubers; and wine. The Core
Index increased by 16% in February 2017, lower than 17.90% recorded in January 2017.
In February 2017, the largest increase in the Core Index were recorded in the Electricity;
Liquid and Solid Fuels; Fuels and Lubricants for Personal Transport; Clothing Materials;
Other Articles of Clothing and Clothing Accessories and; Book and Stationeries.
Notwithstanding the fact that our analysis shows that inflation rate may continue to drop
because of base effect; the decision of the Federal Government of Nigeria (FGN) regarding
the pump price of Petroleum Motor Sprit (PMS) and the electricity tariff will ultimately
determine the actual path that the inflation rate will follow in the short-term. We estimate
that the inflation rate would be at 16.52% in March 2017 as shown on table 4 below. This
may impact the yields on the fixed income securities.
Table 4: Inflation Rate Actual Vs Forecast
Month Jan-17
A Feb-17A
Mar-17F
Apr-17F
May-17F
Jun-17F
Jul- 17F
Aug-17F
Sep-17F
Oct-17F
Nov-17F
Dec-17F
Actual/Forecast 18.72% 17.78% 16.52% 15.57% 13.36% 12.31% 11.68% 11.31% 11.21% 11.04% 11.00% 10.87%
Source: National Bureau of Statistics and FSDH Research Analysis
We expect February inflation
rate at 16.52%.
The inflation rate stood at 17.78%
in March 2017, from 18.72%
recorded in January 2017.

Monthly Economic & Financial Market Outlook: April 2017
FSDH Research www.fsdhgroup.com 8
27.9 27.4
26.8 26.4 26.3
25.8
24.9 24.1 24.3
24.9
27.2
29.0
30.2
0
100
200
300
400
500
600
20.5
22.5
24.5
26.5
28.5
30.5
32.5
34.5
Mar-16 May-16 Jul-16 Sep-16 Nov-16 Jan-17 Mar-17
N/U
S$
US
$bn
External Reserves vs Foreign Exchange Rate (N/US$)
External Reserves Inter-bank FX Rate Parallel FX Rate
1.5 Movement in the External Reserves:
There was accretion to the external reserves in March 2017, with a slowdown in the
rate of growth towards the end of the month of March 2017. The improved production
of oil in the Niger Delta, as well as the OPEC and non-OPEC actions on stabilising oil price
boosted the external reserves. However, the CBN’s strategy to increase foreign exchange
supply had negative impact on the external reserves in March 2017. The 30-day moving
average external reserves increased by 2.19% to US$30.30bn as at end-March 2017, from
US$29.65bn at end-February 2017. The average external reserves stood at US$30.16bn in
March 2017, from US$28.96bn in February 2017.
The external reserves increased by
2.19% to US$30.30bn as at end-
March 2017, from US$29.65bn at
end-February 2017.

Monthly Economic & Financial Market Outlook: April 2017
FSDH Research www.fsdhgroup.com 9
35.00
45.00
55.00
Bonny Light Price (Monthly Average)
2.08 2.15 2.04 1.96 1.99 1.68 1.77 1.66 1.52 1.65 1.78 1.92
0.00
0.50
1.00
1.50
2.00
2.50
Dec
-15
Jan-
16
Feb
-16
Mar
-16
Apr
-16
May
-16
Jun-
16
Jul-1
6
Aug
-16
Sep
-16
Oct
-16
Nov
-16
Monthly Average Crude Oil Production
1.6 Crude Oil Market and Bonny Light Price:
The cooperation of OPEC and non-OPEC members to cut oil output has kept
average oil price at about US$50/b since December 2016. However, there has been
downward pressure on oil prices from the increased production in the U.S. The
current relatively high oil price is attractive for shale oil producers.
According to the data from Thomson Reuters, the Bonny Light oil price decreased by
2.73% to US$52.71/b as at end-March 2017, from end-February 2017. The average price
of Bonny Light was US$52.20/b in March 2017, a decrease of 5.95% from the average
price of US$55.50/b recorded in February 2017.
According to the U.S Energy Information Administration (EIA), the Brent crude oil
price should average US$55/b in 2017 and US$57/b in 2018.
Table 5: Nigeria’s Crude Oil and Condensate Production (mbd)
Joint Ventures
Production Sharing Contracts
Others
Total Production
Average Daily Production
Dec-15 18.91 28.33 17.33 64.57 2.08
Jan-16 20.02 28.70 17.91 66.63 2.15
Feb-16 20.52 25.42 13.27 59.21 2.04
Mar-16 20.33 27.68 12.68 60.68 1.96
Apr-16 20.24 27.86 11.48 59.57 1.99
May-16 14.30 27.37 10.50 52.17 1.68
Jun-16 14.59 27.35 11.13 53.07 1.77
Jul-16 16.09 27.22 8.07 51.37 1.66
Aug-16 12.79 28.19 6.28 47.26 1.52
Sep-16 14.52 27.73 7.20 49.46 1.65
Oct-16 16.91 28.66 9.62 55.19 1.78
Nov-16 18.38 27.25 11.93 57.56 1.92
Total 188.69 303.41 120.07 612.18 N/A
Source: NNPC Monthly Report, December 2016; N/A – Not Applicable
The average price of Bonny Light
was US$52.20/b in March 2017,
a decrease of 5.95% from the
average price of US$55.50/b
recorded in February 2017.

Monthly Economic & Financial Market Outlook: April 2017
FSDH Research www.fsdhgroup.com 10
1.7 Foreign Exchange Rate:
The recent efforts of the CBN to increase the supply of foreign exchange in the
interbank market have narrowed the gap between the official (inter-bank) and
parallel market exchange rates. The CBN was able to increase the supply of foreign
exchange in the interbank market because of accretion to external reserves. The
increase in average oil price to about US$50/bbl and increase in crude oil production in
Nigeria are the major drivers of the improvement in the external reserves.
Month-on-month, the parallel market appreciated by 13.42% to close at N395/US$ at end-
March 2017 from N448/US$ at end-February 2017. The average exchange rate at the
parallel market appreciated by 14.59% to stand at N434.78/US$ in March 2017, compared
with N498.23/US$ in February 2017.
The inter-bank market rate depreciated in March 2017. As at end-March 2017, the
value of the Naira closed at N306.35/US$ at the inter-bank market, a depreciation of 0.28%
from N305.50/US$ at end-February 2017.
The agreement between OPEC and Non-OPEC members to cut oil supply has led to
an increase in oil price at the international market. There is no guarantee that this
increase will be sustained. If it is not and the crude oil price drops faster than
growth in local crude oil production, Nigeria’s export earnings may drop. Such a
development would impede the ability of the CBN to sustain the improved supply of
foreign exchange.
The recent efforts of the CBN to
increase the supply of foreign
exchange in the interbank market
have narrowed the gap between
the official and parallel market
exchange rates.
The inter-bank market rate
depreciated in March 2017.

Monthly Economic & Financial Market Outlook: April 2017
FSDH Research www.fsdhgroup.com 11
0.00%
5.00%
10.00%
15.00%
20.00%
25.00%
91-Day 182-Day 364-Day
Average NTBs Yields March 2017 (Actual vs Forecast)
Actual Forecast
12.00%
13.00%
14.00%
15.00%
16.00%
17.00%
16.00% FGNJUN 2019
16.39% FGNJAN 2022
10.00% FGNJUL 2020
Average Bond Yields in March 2017 (Actual vs Forecast)
Actual Forecast
2.0 Interest Rate and Yield Analysis:
The yields in the fixed income market recorded mixed performance in March 2017
compared with February 2017. The major drivers of yields were:
Drop in the inflation rate
Drop of liquidity in the market because of foreign exchange supply
The improved confidence in the economy.
The fixed income market analysis in March 2017 shows a net outflow of about N351bn,
compared with a net outflow of about N198bn in February 2017. The major outflows in
March 2017 were the Primary NTBs of about N699bn; CBN’s Foreign Exchange Sale of
N368bn; Open Market Operations (OMO) and Repurchase Bills (REPO) of N134bn and
the bond auction of about N160bn. Meanwhile, in February 2017, the major outflows were
from the OMO and REPO of N605bn, Primary NTBs of about N505bn, CBN’s Foreign
Exchange Sale of N202bn; and the bond auction of about N160bn. The major inflows in
March 2017 were the matured NTBs of about N699bn, matured OMO and REPO Bills of
N71bn, and the Federation Account Allocation Committee (FAAC) injection of about
N240bn. In February 2017, matured OMO and REPO Bills of N533bn; matured NTBs of
about N505bn, and the FAAC injection of about N195bn were the major inflows.
At the NTBs auction, average yields at the shortest dated tenor NTB dropped while
the average yield on the longest dated NTB increased in the month of March 2017.
The average 91-day NTB yield stood at 14.08% in March, down from 14.23% in February.
The average 182-day NTB yield closed at 18.81%, same as in February. The average 364-
day NTB yield closed at 22.81%, up from 22.69% in February 2017. Meanwhile, the
average 30-day NIBOR closed at 16.73% in March 2017, marginally down from 16.90% in
February 2017. The average 90-day NIBOR increased to 20.47%, from 19.32% in the
preceding month.
The yields in the fixed income
market recorded mixed
performance in March 2017
compared with February 2017.
At the NTBs auction, average
yields at the shortest dated tenor
NTB dropped while the average
yield on the longest dated
increased in the month of March
2017.

Monthly Economic & Financial Market Outlook: April 2017
FSDH Research www.fsdhgroup.com 12
The yields on the FGN Bonds that we monitored closed marginally lower in March 2017
than in February 2017.
Table 7: Average Bond Yields
16.00% FGN JUN 2019 16.39% FGN JAN 2022 10.00% FGN July 2030
February 2017 16.02% 16.05% 16.19%
March 2017 15.79% 15.80% 15.90%
Change (0.23%) (0.25%) (0.29%)
Source: Financial Market Dealers Quotation
Table 8: Average Interest Rate and Yields
NIBOR Treasury Bill Yields
Call 30 Day 90 Day 180 Day 91-Day 182-Day 364-Day
February 2017 25.43% 16.89% 19.19% 23.14% 14.23% 18.81% 22.69%
March 2017 23.86% 16.73% 20.47% 23.14% 14.08% 18.81% 22.81%
Change (0.58%) (0.17%) 1.15% 0.01% (0.15%) (0.00%) 0.12%
Source: CBN and Financial Market Dealers Quotation
Table 6: Market Liquidity (N’bn)
February 2017 March 2017
Total Inflow Total Outflow Net flow Total Inflow Total Outflow Net Flow
Primary Market: NTB 505 505 0 699 699 0
Open Market Operations (OMO) & Rev Repo 533 605 (72) 71 134 (63)
BOND 0 160 (160) 0 160 (160)
FAAC 195 - 195 240 0 240
FX Market - 202 (202) - 368 (368)
CRR Debit/Credit - - - - - -
TSA Implementation 40 - 40 - - -
Total 1,273 1,472 (198) 1,010 1,361 (351)
Source: Central Bank of Nigeria and Federal Ministry of Finance
Monthly Economic & Financial Market Outlook: April 2017
FSDH Research www.fsdhgroup.com 13
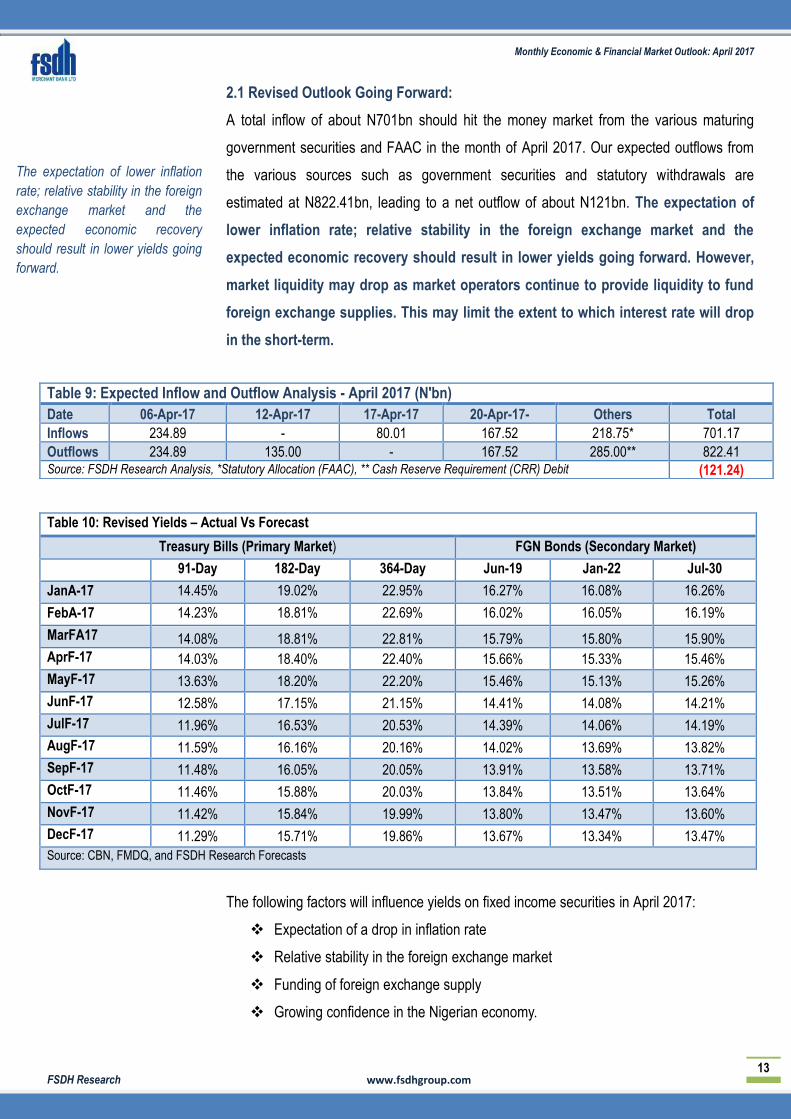
2.1 Revised Outlook Going Forward:
A total inflow of about N701bn should hit the money market from the various maturing
government securities and FAAC in the month of April 2017. Our expected outflows from
the various sources such as government securities and statutory withdrawals are
estimated at N822.41bn, leading to a net outflow of about N121bn. The expectation of
lower inflation rate; relative stability in the foreign exchange market and the
expected economic recovery should result in lower yields going forward. However,
market liquidity may drop as market operators continue to provide liquidity to fund
foreign exchange supplies. This may limit the extent to which interest rate will drop
in the short-term.
The following factors will influence yields on fixed income securities in April 2017:
Expectation of a drop in inflation rate
Relative stability in the foreign exchange market
Funding of foreign exchange supply
Growing confidence in the Nigerian economy.
Table 10: Revised Yields – Actual Vs Forecast
Treasury Bills (Primary Market) FGN Bonds (Secondary Market)
91-Day 182-Day 364-Day Jun-19 Jan-22 Jul-30
JanA-17 14.45% 19.02% 22.95% 16.27% 16.08% 16.26%
FebA-17 14.23% 18.81% 22.69% 16.02% 16.05% 16.19%
MarFA17 14.08% 18.81% 22.81% 15.79% 15.80% 15.90%
AprF-17 14.03% 18.40% 22.40% 15.66% 15.33% 15.46%
MayF-17 13.63% 18.20% 22.20% 15.46% 15.13% 15.26%
JunF-17 12.58% 17.15% 21.15% 14.41% 14.08% 14.21%
JulF-17 11.96% 16.53% 20.53% 14.39% 14.06% 14.19%
AugF-17 11.59% 16.16% 20.16% 14.02% 13.69% 13.82%
SepF-17 11.48% 16.05% 20.05% 13.91% 13.58% 13.71%
OctF-17 11.46% 15.88% 20.03% 13.84% 13.51% 13.64%
NovF-17 11.42% 15.84% 19.99% 13.80% 13.47% 13.60%
DecF-17 11.29% 15.71% 19.86% 13.67% 13.34% 13.47%
Source: CBN, FMDQ, and FSDH Research Forecasts
Table 9: Expected Inflow and Outflow Analysis - April 2017 (N'bn)
Date 06-Apr-17 12-Apr-17 17-Apr-17 20-Apr-17- Others Total
Inflows 234.89 - 80.01 167.52 218.75* 701.17
Outflows 234.89 135.00 - 167.52 285.00** 822.41 Source: FSDH Research Analysis, *Statutory Allocation (FAAC), ** Cash Reserve Requirement (CRR) Debit (121.24)
The expectation of lower inflation
rate; relative stability in the foreign
exchange market and the
expected economic recovery
should result in lower yields going
forward.
Monthly Economic & Financial Market Outlook: April 2017
FSDH Research www.fsdhgroup.com 14
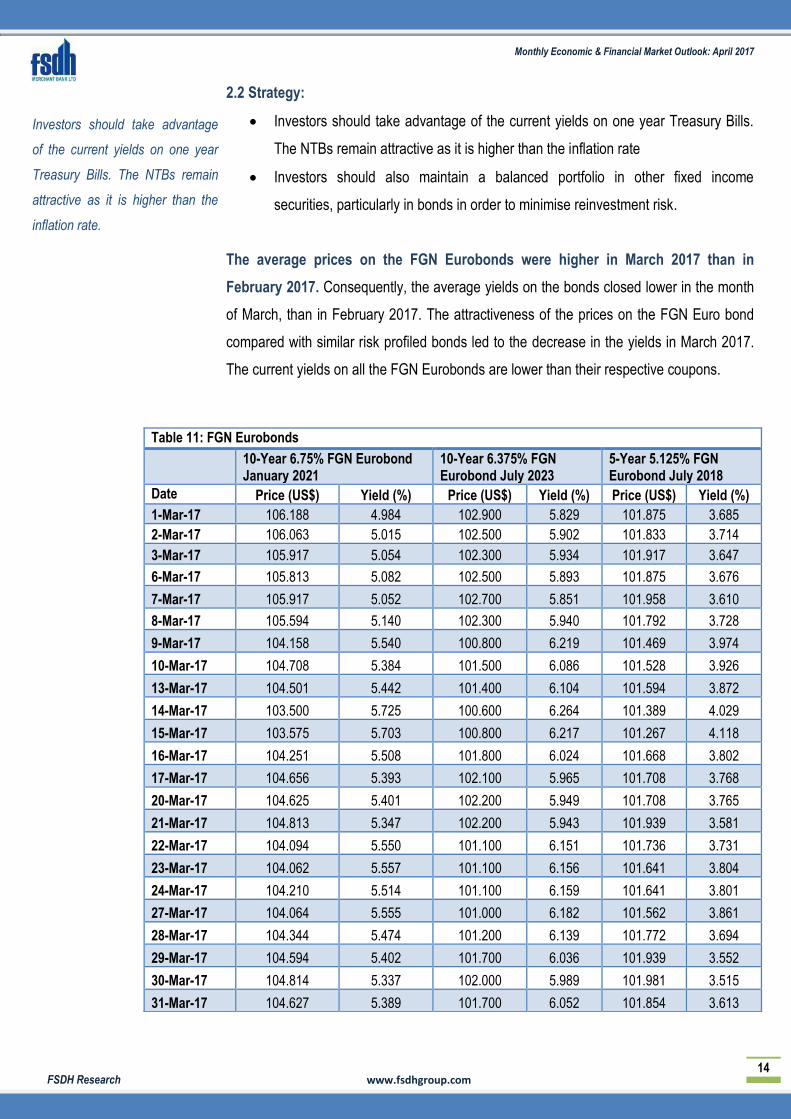
2.2 Strategy:
Investors should take advantage of the current yields on one year Treasury Bills.
The NTBs remain attractive as it is higher than the inflation rate
Investors should also maintain a balanced portfolio in other fixed income
securities, particularly in bonds in order to minimise reinvestment risk.
The average prices on the FGN Eurobonds were higher in March 2017 than in
February 2017. Consequently, the average yields on the bonds closed lower in the month
of March, than in February 2017. The attractiveness of the prices on the FGN Euro bond
compared with similar risk profiled bonds led to the decrease in the yields in March 2017.
The current yields on all the FGN Eurobonds are lower than their respective coupons.
Table 11: FGN Eurobonds
10-Year 6.75% FGN Eurobond January 2021
10-Year 6.375% FGN Eurobond July 2023
5-Year 5.125% FGN Eurobond July 2018
Date Price (US$) Yield (%) Price (US$) Yield (%) Price (US$) Yield (%)
1-Mar-17 106.188 4.984 102.900 5.829 101.875 3.685
2-Mar-17 106.063 5.015 102.500 5.902 101.833 3.714
3-Mar-17 105.917 5.054 102.300 5.934 101.917 3.647
6-Mar-17 105.813 5.082 102.500 5.893 101.875 3.676
7-Mar-17 105.917 5.052 102.700 5.851 101.958 3.610
8-Mar-17 105.594 5.140 102.300 5.940 101.792 3.728
9-Mar-17 104.158 5.540 100.800 6.219 101.469 3.974
10-Mar-17 104.708 5.384 101.500 6.086 101.528 3.926
13-Mar-17 104.501 5.442 101.400 6.104 101.594 3.872
14-Mar-17 103.500 5.725 100.600 6.264 101.389 4.029
15-Mar-17 103.575 5.703 100.800 6.217 101.267 4.118
16-Mar-17 104.251 5.508 101.800 6.024 101.668 3.802
17-Mar-17 104.656 5.393 102.100 5.965 101.708 3.768
20-Mar-17 104.625 5.401 102.200 5.949 101.708 3.765
21-Mar-17 104.813 5.347 102.200 5.943 101.939 3.581
22-Mar-17 104.094 5.550 101.100 6.151 101.736 3.731
23-Mar-17 104.062 5.557 101.100 6.156 101.641 3.804
24-Mar-17 104.210 5.514 101.100 6.159 101.641 3.801
27-Mar-17 104.064 5.555 101.000 6.182 101.562 3.861
28-Mar-17 104.344 5.474 101.200 6.139 101.772 3.694
29-Mar-17 104.594 5.402 101.700 6.036 101.939 3.552
30-Mar-17 104.814 5.337 102.000 5.989 101.981 3.515
31-Mar-17 104.627 5.389 101.700 6.052 101.854 3.613
Investors should take advantage
of the current yields on one year
Treasury Bills. The NTBs remain
attractive as it is higher than the
inflation rate.
Monthly Economic & Financial Market Outlook: April 2017
FSDH Research www.fsdhgroup.com 15
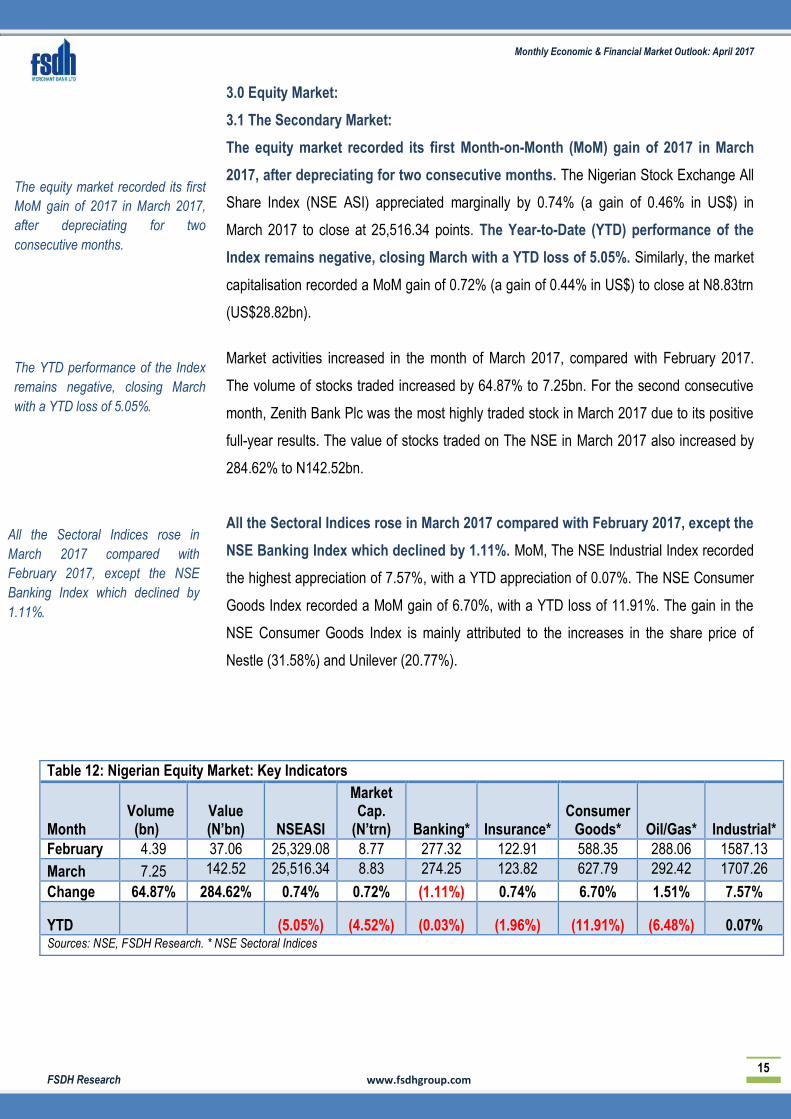
3.0 Equity Market:
3.1 The Secondary Market:
The equity market recorded its first Month-on-Month (MoM) gain of 2017 in March
2017, after depreciating for two consecutive months. The Nigerian Stock Exchange All
Share Index (NSE ASI) appreciated marginally by 0.74% (a gain of 0.46% in US$) in
March 2017 to close at 25,516.34 points. The Year-to-Date (YTD) performance of the
Index remains negative, closing March with a YTD loss of 5.05%. Similarly, the market
capitalisation recorded a MoM gain of 0.72% (a gain of 0.44% in US$) to close at N8.83trn
(US$28.82bn).
Market activities increased in the month of March 2017, compared with February 2017.
The volume of stocks traded increased by 64.87% to 7.25bn. For the second consecutive
month, Zenith Bank Plc was the most highly traded stock in March 2017 due to its positive
full-year results. The value of stocks traded on The NSE in March 2017 also increased by
284.62% to N142.52bn.
All the Sectoral Indices rose in March 2017 compared with February 2017, except the
NSE Banking Index which declined by 1.11%. MoM, The NSE Industrial Index recorded
the highest appreciation of 7.57%, with a YTD appreciation of 0.07%. The NSE Consumer
Goods Index recorded a MoM gain of 6.70%, with a YTD loss of 11.91%. The gain in the
NSE Consumer Goods Index is mainly attributed to the increases in the share price of
Nestle (31.58%) and Unilever (20.77%).
Table 12: Nigerian Equity Market: Key Indicators
Month
Volume (bn)
Value (N’bn)
NSEASI
Market Cap.
(N’trn)
Banking*
Insurance*
Consumer
Goods*
Oil/Gas*
Industrial*
February 4.39 37.06 25,329.08 8.77 277.32 122.91 588.35 288.06 1587.13
March 7.25 142.52 25,516.34 8.83 274.25 123.82 627.79 292.42 1707.26
Change 64.87% 284.62% 0.74% 0.72% (1.11%) 0.74% 6.70% 1.51% 7.57%
YTD
(5.05%) (4.52%) (0.03%) (1.96%) (11.91%) (6.48%) 0.07% Sources: NSE, FSDH Research. * NSE Sectoral Indices
All the Sectoral Indices rose in
March 2017 compared with
February 2017, except the NSE
Banking Index which declined by
1.11%.
The equity market recorded its first
MoM gain of 2017 in March 2017,
after depreciating for two
consecutive months.
The YTD performance of the Index
remains negative, closing March
with a YTD loss of 5.05%.

Monthly Economic & Financial Market Outlook: April 2017
FSDH Research www.fsdhgroup.com 16
Table 13: Major Earning Announcements in March 2017
Company and Result Turnover (Nm)
Change (%)
PBT (Nm)
Change (%)
PAT (Nm)
Change (%)
NESTLE NIGERIA PLC Full Year, Dec. 2016 181,911 20.25 21,548 -26.51 7,925 -66.61
ACCESS BANK NIGERIA PLC Full Year, Dec. 2016 381,321 13.02 90,339 20.39 71,439 8.46
GUARANTY TRUST BANK PLC ( GT Bank) Full Year, Dec 2016 414,616 37.36 165,136 36.82 132,281 33.03
TOTAL NIGERIA PLC Full Year, Dec. 2016 290,953 39.86 20,353 213.35 14,797 265.63
LAFARGE AFRICA PLC. Full Year, Dec. 2016 219,714 -17.78 -22,819 -22.09 16,899 -37.79
STANBIC IBTC HOLDINGS PLC Full Year Dec 2016 156,425 11.71 37,209 57.33 28,520 50.97
UNILEVER NIGERIA PLC Full Year, Dec. 2016 69,777 17.82 4,106 131.86 3,0272 157.63
UBA PLC. Full Year, Dec 2016 383,647 21.85 90,642 32.41 72,264 21.14
FCMB GROUP PLC Full Year, Dec. 2016 176,352 15.63 16,251 109.19 14,339 201.19
GLAXO SMITHKLINE CONSUMER NIG. PLC Full Year, Dec. 201 14,385 -6.54 186 -82.56 2,378 172.37
STERLING BANK PLC Full Year Dec. 2016 111,439 1.13 6,000 -45.54 5,162 -49.84
MOBIL OIL NIG PLC Full Year, Dec. 2016 94,108 46.54 12,020 74.04 8,154 67.34
U A C N PLC Full Year, Dec. 2016 84,607 14.69 7,775 0.54 5,667 9.76
DANGOTE SUGAR REFINERY Full Year, Dec 2016 169,725 67.95 19,614 21.41 14,396 29.20
Source: NSE Website
Table 14: Major Earning Announcements in March 2017
Company Result DPS(N) Bonus Ratio Closure Date Payment Date Interim/final
Access Bank Nigeria Plc Full Year, Dec. 2016 0.40 14-Mar-17 29-Mar-17 Final
Guaranty Trust Bank Plc ( GT Bank) Full Year, Dec. 2016 1.75 - 29-Mar-17 07-Apr-17 Final
Lafarge Africa Plc. Full Year, Dec. 2016 1.05 - 23-Jun-17 07-Jun-17 Final
UBA Plc. Full Year, Dec. 2016 0.55 - 03-Apr-17 10-Apr-17 Final
Unilever Plc Full Year, Dec. 2016 0.10 - 18-Apr-17 12-May-17 Final
Glaxo Smithkline Consumer Nig. Plc Full Year, Dec 2016 0.30 - 13-Apr-17 01-Jun-17 Final
U A C N Plc Full Year, Dec. 2016 1.00 - 15-May-17 15-Jun-17 Final
Mobil Oil Nig Plc Full Year, Dec. 2016 8.00 - 28-Apr-17 31-May-17 Final
Source: NSE Website

Monthly Economic & Financial Market Outlook: April 2017
FSDH Research www.fsdhgroup.com 17
Table 15 below shows the performance of some selected foreign equity markets
around the world. The CAC 40 Index (France) recorded the highest MoM
appreciation of 5.43%, with a YTD appreciation of 5.35%. This is followed by the
Nairobi All-Share Index (Kenya) with a MoM gain of 4.50%, and a YTD loss of 2.12%. The
Brazil Stock Market Index recorded the highest MoM depreciation of 2.52% MoM but a
YTD appreciation of 7.90%. This was followed by the NIKKEI 225 Index (Japan) with a
MoM loss of 1.10%, and a YTD loss of 1.07%.
Table 15: Foreign Equity Market Performance in February 2017
North/Latin America YTD Change Month-on-Month Change
Dow Jones Industrial Average 4.56% (0.72%)
S&P 500 Index 5.53% (0.04%)
NASDAQ Composite 9.82% 1.48%
Brazil Stock Market Index 7.90% (2.52%)
Europe
Swiss Market Index 5.34% 1.32%
FTSE 100 Index (UK) 2.52% 0.82%
CAC 40 Index (France) 5.35% 5.43%
DAX Index (Germany) 7.25% 4.04%
Africa
NSE All-Share Index (5.05%) 0.74%
FTSE/JSE Africa All Share Index 2.77% 1.78%
Nairobi All Share Index (Kenya) (2.12%) 4.50%
GSE All-Share Index (Ghana) 10.41% 0.57%
Asia/Pacific
NIKKEI 225 Index (Japan) (1.07%) (1.10%)
S&P BSE SENSEX Index (India) 11.24% 3.05%
Shanghai Stock Exchange Composite Index (China) 3.83% (0.59%)
Hang Seng Index (Hong Kong) 9.60% 1.56%
Source: Bloomberg
The CAC 40 Index (France)
recorded the highest MoM
appreciation of 5.43%, with a
YTD appreciation of 5.35%

Monthly Economic & Financial Market Outlook: April 2017
FSDH Research www.fsdhgroup.com 18
3.2. Outlook for the Month of April:
We expect to see some improvements in investors’ appetite for equity investment in April
2017. The following factors may drive performance:
Relatively stable foreign exchange market
Improved confidence on the outlook of the Nigerian economy
The increase in oil price and improved production
Expected decline in interest rate on fixed income securities
3.3. Strategies:
We recommend that investors should maintain a medium-to-long term position in
the equity market
We maintain that long-term investors should take long positions in stocks that have
strong fundamentals
The performance of the equity market in the last five years shows that the market recorded
negative performances between March and April. The equity market in the current year
may not follow historical trend as the economic outlook becomes increasingly
positive.
.
Table 16: Equity Market Trend Analysis (2011-2016) – NSE ASI Analysis
Year
Months 2012 2013 2014 2015 2016
March 20,652.47 33,536.24 38,748.01 31,744.82 25,306.22
April 22,045.66 33,440.57 38,492.13 34,708.11 25,062.41
% Change 6.75% (0.29%) (0.66%) 9.33% (0.96%)
Source: The Nigerian Stock Exchange (NSE) and FSDH Research Analysis
The performance of the equity
market in the last five years
shows that the market recorded
negative performances between
March and April

Monthly Economic & Financial Market Outlook: April 2017
FSDH Research www.fsdhgroup.com 19
Table 17: Revised Asset Allocation
Asset Class Fund Allocation
Equities 25%
Fund Placement 15%
Treasury Bills 15%
Real Estate Investment Trust (REIT) 5%
Bonds 20%
Collective Investment Schemes 20% Source: FSDH Research
Table 18 One Year Target Price
Stocks Max Entry
Price 52 Week
Low 52 Week
High Trailing
EPS Trailing PE Ratio
Target Price
Dangote Cement 164.32 149.26 203.96 3.41 47.24 193.32
Dangote Sugar 7.42 5.17 7.19 1.20 5.83 8.83
FBNH 3.35 2.95 4.39 0.21 14.94 3.98
Flour Mills 19.44 16.20 24.99 7.85 2.29 23.13
NASCON 6.49 6.01 8.70 1.19 5.07 7.72
Nigerian Breweries 135.00 102.50 150.00 3.58 34.88 148.75
Stanbic IBTC 19.44 13.00 18.50 2.85 6.32 22.53
Total Nigeria 280.80 140.06 345.00 43.58 5.97 334.15
UACN 16.33 12.02 22.00 2.95 5.13 18.25
UBA 5.59 3.08 5.77 1.99 2.60 7.07
United Capital 3.22 1.40 3.82 1.15 2.59 3.83
Zenith Bank 15.16 10.50 17.70 4.13 3.46 18.00
Source: FSDH Research
Table 19: Bond Recommendation
S/N
Security Description
Tenor To Maturity (Yrs)
Coupon
Current Price (N)
Current Yield
Modified Duration
1 16.00% FGN JUN 2019 2.23 16.00% 100.35 15.77% 1.75
2 15.54% FGN FEB 2020 2.86 15.54% 99.30 15.83% 2.19
3 14.50% FGN JUL 2021 4.28 14.50% 95.95 15.82% 2.97
4 16.39% FGN JAN 2022 4.81 16.39% 102.45 15.63% 3.18
Source: FSDH Research. Prices and yields as at April 05, 2017

Monthly Economic & Financial Market Outlook: April 2017
FSDH Research www.fsdhgroup.com 20
The prices of the Eurobonds of the following companies are trading at huge
discounts to their face values: Fidelity Bank, Diamond Bank, Access Bank, First
Bank and Ecobank. Investments in them may generate good returns for investors
who have U.S. Dollar holdings and can take the associated risks.
Table 20: Attractive Fixed Income Securities Trading on the FMDQ as at March 02, 2017
Issuer Description Coupon
Maturity Date TTM (Years) * Current Yield Price
State Bonds
Lagos 14.50% LAGOS 22-NOV-2019 14.50% 22-Nov-19 2.63 17.84% 93.15
Lagos 13.50% LAGOS 27-NOV-2020 13.50% 27-Nov-20 3.65 17.09% 90.50
Corporate Bonds
UBA 14.00% UBA II 30-SEP-2018 14.00% 30-Sep-18 1.49 21.28 91.12
FCMB 15.00% FCMB 6-NOV-2020 15.00% 06-Nov-20 3.59 20.26 86.96
Lafarge Africa Plc 14.25% LAFARGE 15-JUN-2019 14.25% 15-Jun-19 2.19 17.43 94.33
NAHCO 15.75% NAHCO II 14-NOV-2020 15.75% 14-Nov-20 3.61 16.79 95.90
Transcorp Hotels Plc 15.50% TRANSCORP 4-DEC-2020 15.50% 04-Dec-20 2.11 20.15 92.61
Lafarge Africa Plc 14.75% LAFARGE 15-JUN-2021 14.75% 15-Jun-21 4.19 16.73 94.15
FCMB 14.25% FCMB I 20-NOV-2021 14.25% 20-Nov-21 4.63 18.20 87.96
UBA 16.45% UBA I 30-DEC-2021 16.45% 30-Dec-21 4.74 16.69 99.16
Fidelity Bank 16.48% FIDELITY 13-MAY-2022 16.48% 13-May-22 5.10 16.67 99.31
Transcorp Hotels 16.00% TRANSCORP 26-OCT-2022 16.00% 26-Oct-22 3.77 18.59 94.18
Stanbic IBTC 182D T.bills+1.20% STANBIC IA 30-SEP-
2024 16.29% 30-Sep-24 7.49 16.70 98.25
Stanbic IBTC 13.25% STANBIC IB 30-SEP-2024 13.25% 30-Sep-24 7.49 16.70 85.53
Supranational Bonds
AfDB 11.25% AFDB 1-FEB-2021 11.25% 01-Feb-21 2.07 15.16 93.49
Corporate Eurobonds
Access Bank Plc 7.25% JUL 25, 2017 7.25% 25-Jul-17 - 5.48 100.50
Fidelity Bank Plc 6.88% MAY 09, 2018 6.88% 02-May-18 - 16.72 90.60
GT Bank Plc 6.00% NOV 08, 2018 6.00% 08-Nov-18 - 4.51 102.26
Zenith Bank Plc 6.25% APR 22, 2019 6.25% 22-Apr-19 - 5.89 100.68
Diamond Bank Plc 8.75% May 21, 2019 8.75% 21-May-19 - 16.76 86.14
First Bank Plc 8.25% AUG 07, 2020 8.25% 07-Aug-20 - 12.50 89.01
Access Bank Plc II 9.25%/6M USD LIBOR+7.677% JUN 24, 2021 9.25% 24-Jun-21 - 11.22 94.09
First Bank Ltd. 8.00%/2Y USD SWAP+6.488% JUL 23 2021 8.00% 23-Jul-21 - 13.02 83.95
Ecobank Nig. Ltd 8.75% AUG 14, 2021 8.75% 14-Aug-21 - 13.25 85.51
Commercial Paper
Issuer Description Yield@Issue Maturity Date DTM (Years) ** Valuation Yield (%)
Discount Rate (%)
FSDH Merchant Bank Ltd FSDH CP II 26-MAY-17 21.89% 26-May-17 51 17.57% 17.15%
Access Bank Plc ACCESS CP II 30-MAY-17 4.22% 30-May-17 55 16.36% 15.97%
Access Bank Plc ACCESS CP II 25-AUG-17 22.33% 25-Aug-17 142 19.72% 18.32%
*TTM – Tenor to Maturity; ** DTM – Day to Maturity Source: FMDQ

Monthly Economic & Financial Market Outlook: April 2017
FSDH Research www.fsdhgroup.com 21
For enquiries please contact us at our offices:
Lagos Office: 5th-8th floors UAC House, 1/5 Odunlami Street, Lagos. Tel: 234-1-2702880-2;
234-1-2702887
Port Harcourt Office: 2nd Floor, Skye Bank Building (Former Mainstreet Bank Building) 5 Trans Amadi Road, Port Harcourt. Tel: 234-8024081331
Abuja Office: Leadway House (First Floor), Plot 1061 Herbert Macaulay way, Central Business District, Abuja-Nigeria. Tel.: 234-9-2918821
Website: www.fsdhgroup.com email: [email protected]
Our Reports and Prices are also Available on Bloomberg {FSDH<GO>}
Disclaimer Policy This publication is produced by FSDH Merchant Bank Limited solely for the information of users who are
expected to make their own investment decisions without undue reliance on any information or opinions
contained herein. The opinions contained in the report should not be interpreted as an offer to sell, or a
solicitation of any offer to buy any investment. FSDH Merchant Bank Limited may invest substantially in
securities of companies using information contained herein and may also perform or seek to perform
investment services for companies mentioned herein. Whilst every care has been taken in preparing this
document, no responsibility or liability is accepted by any member of the FSDH Merchant Bank Limited for
actions taken as a result of information provided in this publication.
Table 21: Select Global Bonds Issue
Country Bond TTM*
China 3.52% February 21, 2023 8
Egypt 17% April 03, 2022 7
India 8.15% June 11, 2022 7
Kenya 12.705% June 13, 2022 7
Nigeria 16.39% FGN January 2022 7
Russia 7.60% April 14, 2021 6
South Africa 7.75% February 28, 2023 8
United States 1.75% May 15, 2023 8
*TTM – Tenor to maturity
Sources: Bloomberg