monthly economic research.isbank review - ekonomi.isbank · by 2.3 billion try yoy to 4.3 billion...
TRANSCRIPT

research.isbank
Global Economy
In its World Economic Outlook report, IMF cut global growth forecasts from 3.9% to 3.7% for 2018 and 2019. IMF, decreasing 2018 growth forecast from 4.2% to 3.5% for Turkey, estimates that Turkey’s growth will be 0.4% in 2019.
Trump-Xi meeting, scheduled to be held at the end of November, is crucial for the future course of trade wars. On the other hand, US government is planning to start trade negotiations with EU, Japan and UK.
US economy kept its strong performance and grew by 3.5% in the third quarter. In this period, while consumption expenditures played an important role in growth performance, net exports gave the highest negative contribution to the growth in 34 years.
Resilient economic data in the US and “hawkish” statements of Fed Chairman Powell supported Treasury bond yields.
In Euro Area, Italy’s budget and Brexit negotiations are high on the agenda. Macroeconomic data in the region signal loss of momentum in economic activity. On the other hand, ECB kept interest rates on hold and declined asset purchase program to 15 billion euros per month as previously projected.
In the third quarter, Chinese economy grew by 6.5%, below the expectations.
The expectations that oil supply will not face any problem despite the US sanctions on Iran and that oil demand will diminish in coming period lead a decline in oil prices.
Turkish Economy
Unemployment rate was realized as 10.8% in July. Seasonally adjusted employment figures continued to deteriorate and came in at 11%.
Calendar adjusted industrial production expanded below the market expectations by 1.7% yoy. Manufacturing PMI posted a limited increase in October to 44.3 and have remained below the threshold for seventh consecutive months, showing the slowdown in sector’s activity.
In September, export volume increased by 22.4% yoy while import volume declined by 18.3%. Thus, foreign trade deficit narrowed by 77.1% yoy. According to the provisionary foreign trade data released by the Ministry of Trade, foreign trade deficit trade deficit declined by 92.8% yoy in October.
In August, current account balance posted a surplus of 2.6 billion USD thanks to rising tourism revenues and rapid recovery in foreign trade deficit.
Central government budget gave 6 billion TRY deficit in September. During January-September period, budget deficit increased by 79.4% yoy to 56.7 billion TRY.
In October, CPI rose above market expectations by 2.67% on a monthly basis. Besides, monthly increase in D-PPI was 0.91%, the slowest monthly increase in 2018. Annual CPI inflation was realized as 25.24% in October, while annual increase in D-PPI (45.01%) decreased slightly.
In its meeting on October 25th, CBRT kept the policy rate (one week repo rate) unchanged at 24%.
November 2018
Monthly Economic Review
Economic Research Division İzlem Erdem Chief Economist [email protected]
Alper Gürler Unit Manager [email protected]
H. Erhan Gül Asst. Manager [email protected]
İlker Şahin Economist [email protected]
Gamze Can Economist [email protected]
Ayşim Kalkan Asst. Economist [email protected]
Turkish Economy ...……………………..…..………. 2
Financial Markets …………...…...…..…...………...5
Banking Sector.….…..………...…………………………….6
Concluding Remarks.………………………………7
Graphs……………………………………………..…………..…..………. 8
Tables………………………………………………………….…………...10
research.isbank
November 2018 2
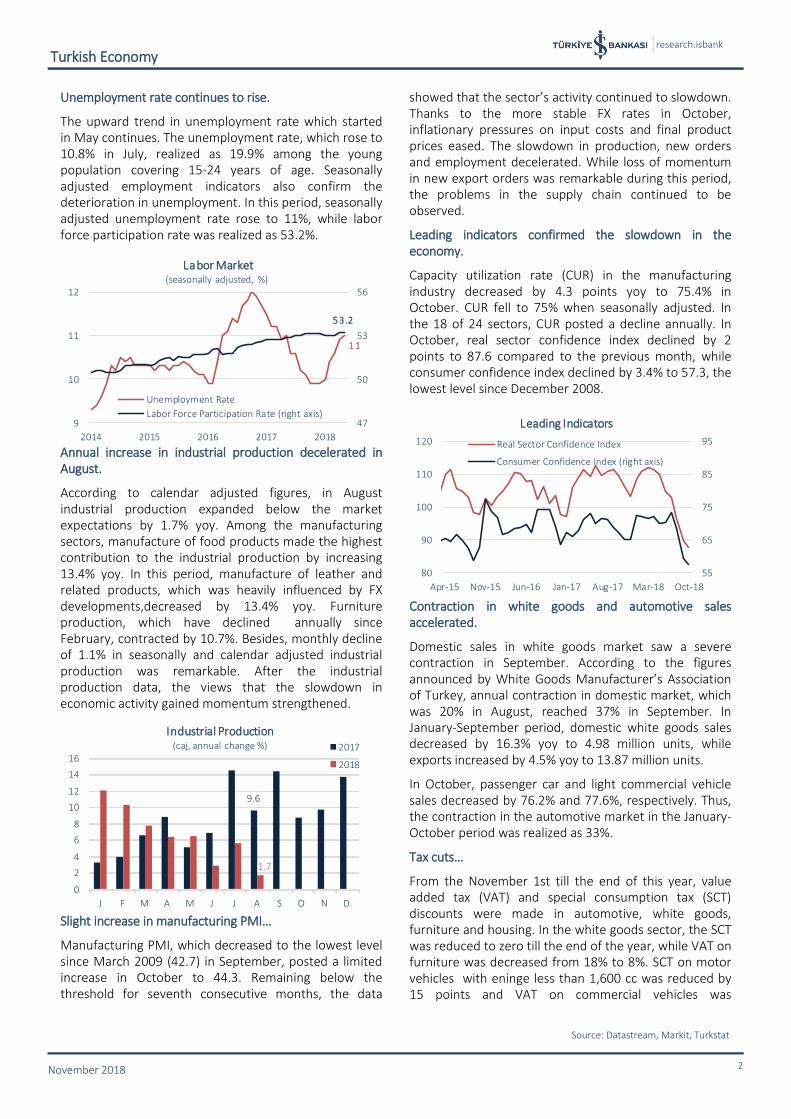
Unemployment rate continues to rise.
The upward trend in unemployment rate which started in May continues. The unemployment rate, which rose to 10.8% in July, realized as 19.9% among the young population covering 15-24 years of age. Seasonally adjusted employment indicators also confirm the deterioration in unemployment. In this period, seasonally adjusted unemployment rate rose to 11%, while labor force participation rate was realized as 53.2%.
Annual increase in industrial production decelerated in August.
According to calendar adjusted figures, in August industrial production expanded below the market expectations by 1.7% yoy. Among the manufacturing sectors, manufacture of food products made the highest contribution to the industrial production by increasing 13.4% yoy. In this period, manufacture of leather and related products, which was heavily influenced by FX developments,decreased by 13.4% yoy. Furniture production, which have declined annually since February, contracted by 10.7%. Besides, monthly decline of 1.1% in seasonally and calendar adjusted industrial production was remarkable. After the industrial production data, the views that the slowdown in economic activity gained momentum strengthened.
Slight increase in manufacturing PMI…
Manufacturing PMI, which decreased to the lowest level since March 2009 (42.7) in September, posted a limited increase in October to 44.3. Remaining below the threshold for seventh consecutive months, the data
showed that the sector’s activity continued to slowdown. Thanks to the more stable FX rates in October, inflationary pressures on input costs and final product prices eased. The slowdown in production, new orders and employment decelerated. While loss of momentum in new export orders was remarkable during this period, the problems in the supply chain continued to be observed.
Leading indicators confirmed the slowdown in the economy.
Capacity utilization rate (CUR) in the manufacturing industry decreased by 4.3 points yoy to 75.4% in October. CUR fell to 75% when seasonally adjusted. In the 18 of 24 sectors, CUR posted a decline annually. In October, real sector confidence index declined by 2 points to 87.6 compared to the previous month, while consumer confidence index declined by 3.4% to 57.3, the lowest level since December 2008.
Contraction in white goods and automotive sales accelerated.
Domestic sales in white goods market saw a severe contraction in September. According to the figures announced by White Goods Manufacturer’s Association of Turkey, annual contraction in domestic market, which was 20% in August, reached 37% in September. In January-September period, domestic white goods sales decreased by 16.3% yoy to 4.98 million units, while exports increased by 4.5% yoy to 13.87 million units.
In October, passenger car and light commercial vehicle sales decreased by 76.2% and 77.6%, respectively. Thus, the contraction in the automotive market in the January-October period was realized as 33%.
Tax cuts…
From the November 1st till the end of this year, value added tax (VAT) and special consumption tax (SCT) discounts were made in automotive, white goods, furniture and housing. In the white goods sector, the SCT was reduced to zero till the end of the year, while VAT on furniture was decreased from 18% to 8%. SCT on motor vehicles with eninge less than 1,600 cc was reduced by 15 points and VAT on commercial vehicles was
Turkish Economy
Source: Datastream, Markit, Turkstat
9.6
1.7
0
2
4
6
8
10
12
14
16
J F M A M J J A S O N D
Industrial Production(caj, annual change %) 2017
2018
55
65
75
85
95
80
90
100
110
120
Apr-15 Nov-15 Jun-16 Jan-17 Aug-17 Mar-18 Oct-18
Leading Indicators
Real Sector Confidence Index
Consumer Confidence Index (right axis)
11
53.2
47
50
53
56
9
10
11
12
2014 2015 2016 2017 2018
Labor Market(seasonally adjusted, %)
Unemployment Rate
Labor Force Participation Rate (right axis)

research.isbank
November 2018 3
decreased to from 18%1%. Besides, reduction in VAT to 8% in house sales and deed fee rates to 3%, which are being applied since May, decided to be extended till the end of year.
Central government budget posted a deficit of 6 billion TRY.
Central government budget deficit decreased by 7% compared to the same month of the previous year and was realized as 6 billion TRY thanks to the positive performance of budget revenues in September. During this period, budget revenues increased by 27.4% to 61.1 billion TRY, while expenditures increased by 23.3% to 67 billion TRY. In September, the primary surplus expanded by 2.3 billion TRY yoy to 4.3 billion TRY.
In January-September period, on the other hand, deterioration in budget performance was remarkable. The central government budget deficit, which was 31.6 billion TRY in the first three quarters of the previous year, expanded by 79.4% and reached 56.7 billion TRY in the same period of this year. Besides, the rise in borrowing costs also had a negative impact on budget performance. As a matter of fact, the primary surplus, which was 15 billion TRY in the first 9 months of 2017, was decreased to 3.7 billion TRY in the same period of this year. This development was mainly driven by the increase in interest expenditures which was 13.8 billion TRY in the first three quarters.
The narrowing in foreign trade deficit gained momentum.
Export volume increased by 22.4% yoy to 14.5 billion USD in September while the import volume declined by 18.3% to 16.3 billion USD. Thus, falling for the fourth consecutive month, foreign trade deficit narrowed by 77.1% compared to the same period of the previous year. Import coverage ratio, which was 59.1% in September 2017, increased to 88.5% in the same month of this year.
According to the 12-month cumulative figures, the downward trend in foreign trade deficit on a monthly basis has continued in September. Export volume increased by 1.6% mom to 165 billion USD, while import volume decreased by 1.5% to 239 billion USD.
Having declined for six months in a row, the annual fall in imports of consumption goods became 41.2% in September. Due to the recent downward trend, the share of consumption goods in total imports fell to 8.5%, the lowest since January 2002. In this period, capital goods and intermediate goods imports contracted by 26% yoy and 13.3% yoy, respectively. This performance weighed on prospects for economic activity.
According to the provisionary foreign trade data released by the Ministry of Trade, contraction in foreign trade deficit accelerated in October. In this period, trade deficit declined by 92.8% yoy. While exports increased by 13.1% yoy, imports contracted by 23.5% yoy during this period.
Current account balance posted a surplus in August.
Current account balance posted a surplus of 2.6 billion USD in August due to the cooling economic activity. Market expectation was a surplus of 2.5 billion USD. The improvement in current account balance continued in the third consecutive month thanks to the rapid contraction in foreign trade deficit and recovery in tourism revenues. In this period, while foreign trade deficit contracted by 70.5% yoy, non-monetary gold trade gave a surplus for the first time since January 2017. Besides, tourism revenues increased by 11.9% yoy to 4.1 billion USD in August.
12-month cumulative current account deficit fell to 51.1 billion USD in August, the lowest level since December 2017. Excluding net energy trade, current account deficit declines to the lowest level since November 2017 with 13.1 billion USD.
Official reserves stood out on the financing side of the balance of payments by declining 8.1 billion USD. Fall in reserve assets reached 13.4 billion USD in January-August period. Net errors and omissions recorded significant capital inflows by 3.7 billion USD in August and
Turkish Economy
Source: Turkstat, Datastream, CBRT, Ministry of Trade, Ministry of Treasury and Finance
Central Government Budget
%
2017 2018 Change
Expenditures 488.2 603.5 23.6
Interest Expenditures 46.6 60.4 29.7
Non-Interest Expenditures 441.6 543.1 23.0
Revenues 456.6 546.8 19.8
Tax Revenues 385.3 459.4 19.2
Other Revenues 71.3 87.5 22.7
Budget Balance -31.6 -56.7 79.4
Primary Balance 15.0 3.7 -75.3
January-September
Foreign Trade Balance
∆ ∆
2017 2018 (%) 2017 2018 (%)
Exports 13.9 15.7 13.1 129.0 138.8 7.6
Imports 21.3 16.3 -23.5 190.2 190.4 0.1
Foreign Trade Balance -7.4 -0.5 -92.8 -61.3 -51.6 -15.7
Import Coverage (%) 65.4 96.7 - 67.8 72.9 -
Jan.- Oct.October
(USD billion)
-41.8
-11.1
-32.9
-100
-80
-60
-40
-20
0
20
2012 2013 2014 2015 2016 2017 2018
Current Account Balance
(12-month cumulative, USD billion)
Current Account BalanceCAB (Excluding Net Energy Trade)CAB (Excluding Net Gold Trade)

research.isbank
November 2018 4
by 15.1 billion USD in January-August period. Thus, 93.3% (28.5 billion USD) of the current account deficit, which was 30.6 billion USD in the first 8 months of the year, financed by reserve assets and net errors and omissions.
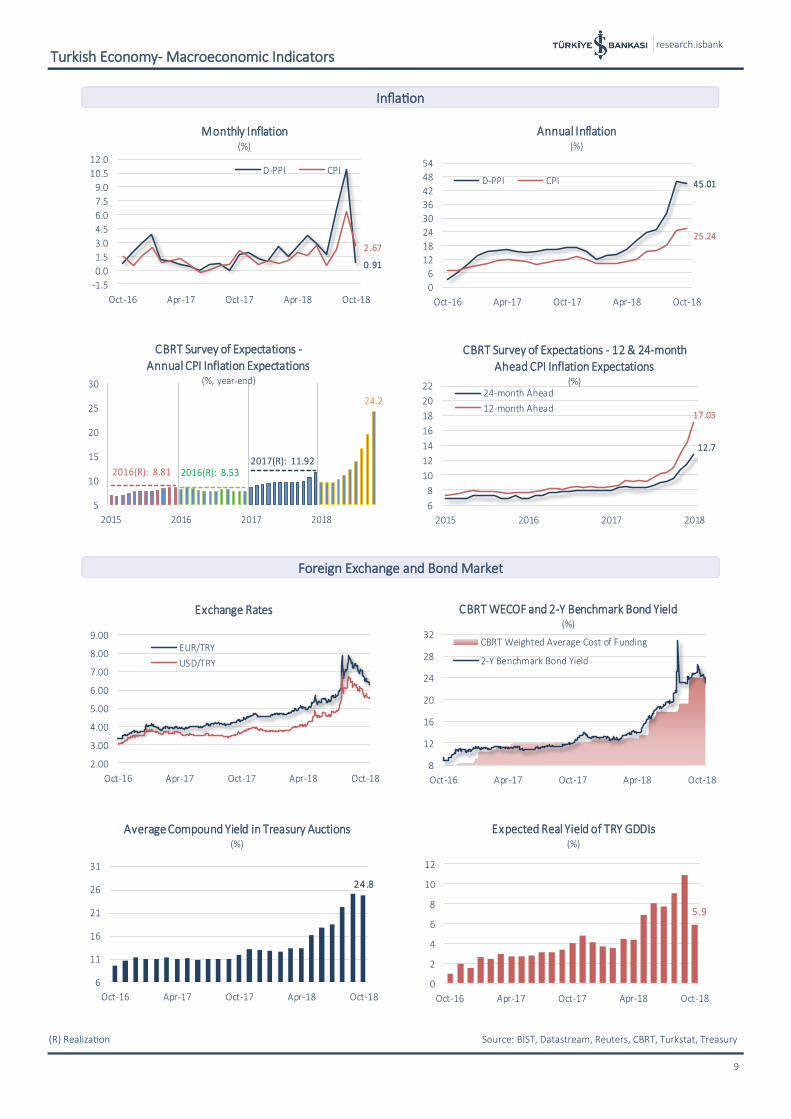
Inflation came in above expectations.
In October, CPI rose above market expectations by 2.67% on a monthly basis. According to the CBRT’s Survey of Expectations, CPI was expected to increase by 2% mom. In this period, domestic PPI (D-PPI) rose by 0.91%, mom the slowest pace in 2018.
Annual inflation continued its upward trend in October, albeit losing some momentum. In this period, annual inflation was realized as 25.24%, the new highest level of 2003 based series, while annual D-PPI inflation (45.01%) posted a slight decrease compared to the previous month for the first time in 2018.
In October, prices increased in all major expenditure groups except for the transportation. The clothing and footwear group, in which prices increased by 12.74% on a monthly basis due to seasonal factors, made the highest contribution to October inflation by 80 bps. Unlike the global trend, domestic food prices show an upward trend, which pushes inflation up. Indeed, the food and non-alcoholic beverages group made the second highest contribution to the monthly inflation by 75 bps, bringing the annual inflation up by 661 bps.
The deterioration in B and C core inflation indicators, which are closely monitored by the CBRT, continued in October with a momentum loss. Annual increases in B and C indices were 24.37% and 24.34%, respectively.
October inflation was higher than market expectations due to strong increases in clothing and food prices. We expect that in addition to the appreciation in TL, tax cuts
might have an impact on inflation in November. The course of core inflation indicators, which have been deteriorating, and the impact of recent measures on inflation expectations are important for inflation prospects.
Turkish Economy
Source: Turkstat, Datastream, CBRT
October
(change %) 2017 2018 2017 2018
Monthly 2.08 2.67 1.71 0.91
Year-to-Date 9.52 22.56 11.66 40.22
Annual 11.90 25.24 17.28 45.01
Annual Average 10.37 14.90 14.47 23.73
D-PPICPI
-20
-10
0
10
20
30
40
Oct-15 Apr-16 Oct-16 Apr-17 Oct-17 Apr-18 Oct-18
Food Prices and CPI(annual, %)
Global Food Inflation
Domestic Food Inflation
CPI

research.isbank
November 2018 5
Recovery in international relations supported domestic markets.
Global markets were under pressure in October due to the mounting worries about US-China trade war tensions, IMF’s downward revision of global growth forecasts for the first time in more than two years, Trump's criticism on the Fed and disappointing earnings of some companies in the US. Although negative course in global markets weighed on the domestic markets occasionally, recovery signs in Turkey-US relations supported them.
BIST-100 index…
Following a volatile course until the mid-October, BIST-100 index recorded rapid decline in the second half of the month, parallel with selling pressure in global markets. The index fell by 9.8% compared to the end of September to 90,201 as of October 31.
Having posted a rapid fall in September, Turkey's 5-year CDS premiums increased in the first days of October as risk perception towards domestic markets deteriorated after the September inflation data which was well above expectations. In the following days, CDS premiums decreased slightly and became 385 bps as of 31 October.
Strong demand for Treasury’s Eurobond issuance…
2-year benchmark bond compound yield, which continued to increase in the first half of October albeit a momentum loss, decreased in the following days after reaching 27% on October 10 and ended the month at 24.42%. Thus, the decline in bond yield reached 140 bps compared to the end of September. On the other hand, Turkish Treasury issued USD-denominated Eurobond with a nominal amount of 2 billion USD with 5 year
maturity. Demand for Eurobond issuance was more than 3 times higher than the auction amount which positively affected the risk perception towards domestic markets.
Rapid recovery in TRY…
In September, TRY appreciated thanks to CBRT's bold interest rate hike and New Economy Program, which met markets expectations to a great extent. In October, improvement in US-Turkey relations after Pastor Brunson's trial and strong demand to Eurobond issuance of the Treasury were effective on the strong course of TRY. As of October 31, USD/TRY and EUR/TRY declined by 7.9% and 10.1% compared the end of September, respectively.
CBRT kept its monetary policy.
In its meeting on October 25, CBRT kept the policy rate (one week repo rate) unchanged at 24%. In its statement published after the meeting, CBRT noted that the recent data show that rebalancing trend in the economy became more noticeable. Citing the significant risks to price stability due to the latest developments regarding inflation figures, CBRT emphasized that although weaker domestic demand conditions would mitigate the deterioration in the inflation outlook to some extent; upside risks on the pricing behaviour would continue. While announcing that the tight monetary policy stance will be maintained, CBRT repeated its statement indicating additional tightening will be implemented if needed.
CBRT’s year-end inflation forecast is 23.5%.
CBRT, in its Inflation Report which was published on October 31, raised its year-end inflation forecast for 2018 by 10.1 compared to its forecast in July from 13.4% to 23.5%. Rise in TRY denominated import prices was the main driver of this revision. In addition, food inflation and deteriorating pricing behavior were effective on the upward revision. CBRT anticipated that inflation will decrease to 15.2% in 2019 and to 9.3% in 2020. It will stabilize around 5% in medium term. CBRT governor Çetinkaya stated that monetary policy stance must be cautious considering the risks and it would be maintained for a long time.
Financial Markets
Source: CBRT, Datastream, Reuters, BIST
3.6
4.1
4.6
5.1
5.6
6.1
6.6
7.1
7.6
Feb-18 Apr-18 Jun-18 Aug-18 Oct-18
FX Rates
USD/TRY
EUR/TRY
Currency Basket
150
200
250
300
350
400
450
500
550
600
85
95
105
115
125
May-18 Jun-18 Jul-18 Aug-18 Sep-18 Oct-18
CDS and BIST-100 BIST-100 (thousandpoints)5-year CDS (rightaxis)
28/Sep 31/Oct
5-Y CDS (basis points) 372 385 13 bps ▲
TR 2-Y Benchmark Yield 25.82% 24.42% -140 bps ▼
BIST-100 99,957 90,201 -9.8% ▼
USD/TRY 6.0550 5.5793 -7.9% ▼
EUR/TRY 7.0251 6.3144 -10.1% ▼
Currency Basket* 6.5401 5.9469 -9.1% ▼(*) (0.5 USD/TL + 0.5 EUR/TL)
Change

research.isbank
November 2018 6
Deposit volume at 2,218 billion TRY…
According to the Weekly Bulletin published by the BRSA, as of October 26, deposits expanded by 23.1% compared to the end of 2017 and reached 2,218 billion TRY. FX adjusted deposits on the other hand increased by 2.7%. In this period, TRY deposits surged up by 11.3% to 1,088 billion TRY. FX deposits in USD terms continued to decrease albeit with a momentum loss. As of October 26, year-to-date decline was 7.5%.
Comparing to the same period of the previous year, rise in deposit volume lost some momentum due to the appreciation of TL. Annual increase in deposit volume, which reached 40% at the end of August, was realized as 23.7% as of October 26. While TRY deposit volume posted 10.5% annual increase, FX deposits in USD terms contracted by 5.5% yoy.
Increase in annual credit volume decelerated.
As of October 26, total credit volume expanded by 19.5% compared to the year-end to 2,550 billion TRY. In this period, while TRY loans expanded by 5.0% to 1,503 billion TRY, FX loans in USD terms increased by 0.4% to 187 billion USD. On annual basis, increase in credit volume was realized as 22.4% as of October 26. In this period, FX adjusted credit volume rose by 6.1%.
Contraction in vehicle loans accelerated.
Parallel to the contraction in the automotive market, vehicle loans continued to decline. As of October 26, vehicle loans contracted by 6.3% yoy. In this period, annual increase in housing and personal finance loans was realized as 3.0% and 7.8%, respectively.
Rapid increase in NPL..
Having followed an upward course since August, NPL ratio reached its highest level since February 2011 with 3.40% as of October 26. In the same period, this ratio was 3.50% for consumer loans and 3.48% for commercial loans.
Net foreign currency position…
As of October 26, banks’ on-balance sheet FX position was (-) 29,367 million USD, while off-balance sheet FX position was (+) 31,681 million USD. Hence, banking sector’s net FX position was realized as (+) 2,314 million USD.
Banking Sector
Source: BRSA Weekly Bulletin
-10
0
10
20
30
40
50
60
Jan-18 Apr-18 Jul-18 Oct-18
Deposit(ytd change, %)
TRY Deposits
FX Deposits
FX Adjusted Deposit
0
20
40
60
80
100
Oct.17 Dec.17 Feb.18 Apr.18 Jun.18 Aug.18 Oct.18
Loan Volume(annual change, %)
TRY
FX
FX Adjusted
Total
-3
-2
-1
0
1
2
3
4
-60
-40
-20
0
20
40
60
80
Oct-17 Jan-18 Apr-18 Jul-18 Oct-18
Net FX Position(USD billion)
Net Position
On-Balance Sheet
Off-Balance Sheet
3.40
3,503.48
2.5
3.0
3.5
4.0
4.5
5.0
2012 2013 2014 2015 2016 2017 2018
NPL Ratio(%)
Retail
Vehicle
Commercial
-10
0
10
20
30
2016 2017 2018
Consumer Loans(annual % change)
Housing Vehicle
Personal Finance Consumer Loans
research.isbank
November 2018 7
Trade war concerns, tightened financial conditions, and increased geopolitical risks continue to exert pressure on global economic activity, which had recorded a broad-based strong growth performance in 2017. Growth concerns, which rose to the top of the agenda due to IMF’s downward revisions for growth forecasts in its recent World Economic Outlook report, have deepened with the latest GDP and manufacturing PMIs in the Euro Area and China. On the other hand, US economy keeps its strong performance. These concerns on global growth and the deepening trade war fears between China and the US put pressure on global equity markets in October.
In recent months, major central banks’ meetings did not surprise the markets, but the expectations for the upcoming period are closely monitored. Fed is expected to deliver its fourth rate hike of this year at its December meeting, while Trump's criticism of the Fed's decisions, in contrast to the political tradition in the US, put some pressure on the US dollar. ECB, which reduced its asset purchases in October in line with the previous assessments, is likely to increase interest rates in the second half of next year. In December, ECB will end its asset purchase program, which started in March 2015.
CBRT's higher-than-expected interest rate hike and the New Economy Program satisfying the market expectations in general had led TL to appreciate in September. In October, recovery in international relations, successful Eurobond issuance of the Treasury and the news that Turkey would be exempted from Iran sanctions have supported the appreciation trend in Turkish lira.
While domestic financial markets move towards normalization, economic activity continues to give signals of cooling. The fall in seasonally and calendar adjusted industrial production in August and the course of manufacturing PMI data indicate that the loss of momentum in the economy has become more concrete. The current account surplus in August is also a result of this development. On the other hand, it is observed that “All-out War Against Inflation Program” had a limited impact on October inflation figures. We expect the appreciation of the Turkish lira and the latest tax cuts to reflect on inflation in November. The ongoing deterioration in core inflation indicators, albeit with a momentum loss, indicates that inflation will continue to be closely monitored.
Concluding Remarks
F orecasts (%) 2018 2019
Growth 3.0 1.5
Current Account Deficit/GDP 4.8 2.9
Inflation (year-end) 25.0 16.0

research.isbank
16 (CA) Calendar adjusted Source: Datastream, CBRT, Turkstat
Turkish Economy- Macroeconomic Indicators
8
Growth
Leading Indicators
Labor Market
Foreign Trade and Current Account Balance
-6-4-202468
101214
2014 2015 2016 2017 2018
Contributions to GDP Growth(% point)Private Consumption
Public ConsumptionInvestmentNet ExportsChange in Stocks
2018 Q2 GDP
Growth:
5.2%
0
4
8
12
16
0
200
400
600
800
1,000
2005 2007 2009 2011 2013 2015 2017
GDPGDP (USD billion) GDP Per Capita (USD thousand, right axis)
72
74
76
78
80
82
0
4
8
12
16
Oct-16 Apr-17 Oct-17 Apr-18 Oct-18
Industrial Production and Capacity Utilization
CA Industrial Production (annual % change)
Manufacturing Industry CUR (%, right axis)
56
60
64
68
72
76
84
90
96
102
108
114
120
Oct-16 Apr-17 Oct-17 Apr-18 Oct-18
Confidence Indices
Real Sector Confidence Consumer Confidence (right axis)
53.2
11
8
9
10
11
12
51
52
53
54
Jul-16 Jan-17 Jul-17 Jan-18 Jul-18
Employment Indicators(seasonally adjusted)
Labor Force Participation Ratio (%)
Unemployment Rate (%, right axis)
28.7
26.0
26.5
27.0
27.5
28.0
28.5
29.0
29.5
Jul-16 Nov-16 Mar-17 Jul-17 Nov-17 Mar-18 Jul-18
Bin
ler
Employment(seasonally adjusted, million persons)
-18.3
22.4
-40
-20
0
20
40
60
Sep-16 Jan-17 May-17 Sep-17 Jan-18 May-18 Sep-18
Foreign Trade(annual % change )
Imports Exports
2.6
-51.1
-9
-6
-3
0
3
6
9
-75
-60
-45
-30
-15
0
Aug-16 Dec-16 Apr-17 Aug-17 Dec-17 Apr-18 Aug-18
Bin
ler
Current Account Balance(USD billion)
Monthly (right axis) 12-month Cumulative
research.isbank
16 (R) Realization Source: BİST, Datastream, Reuters, CBRT, Turkstat, Treasury
Turkish Economy- Macroeconomic Indicators
9
Inflation
Foreign Exchange and Bond Market
0.91
2.67
-1.5
0.0
1.5
3.0
4.5
6.0
7.5
9.0
10.5
12.0
Oct-16 Apr-17 Oct-17 Apr-18 Oct-18
Monthly Inflation(%)
D-PPI CPI45.01
25.24
0
6
12
18
24
30
36
42
48
54
Oct-16 Apr-17 Oct-17 Apr-18 Oct-18
Annual Inflation(%)
D-PPI CPI
24.2
5
10
15
20
25
30
2015 2016 2017 2018
CBRT Survey of Expectations -Annual CPI Inflation Expectations
(%, year-end)
2017(R): 11.922016(R): 8.532016(R): 8.81
12.7
17.03
6
8
10
12
14
16
18
20
22
2015 2016 2017 2018
CBRT Survey of Expectations - 12 & 24-month Ahead CPI Inflation Expectations
(%)24-month Ahead
12-month Ahead
2.00
3.00
4.00
5.00
6.00
7.00
8.00
9.00
Oct-16 Apr-17 Oct-17 Apr-18 Oct-18
Exchange Rates
EUR/TRY
USD/TRY
8
12
16
20
24
28
32
Oct-16 Apr-17 Oct-17 Apr-18 Oct-18
CBRT WECOF and 2-Y Benchmark Bond Yield(%)
CBRT Weighted Average Cost of Funding
2-Y Benchmark Bond Yield
24.8
6
11
16
21
26
31
Oct-16 Apr-17 Oct-17 Apr-18 Oct-18
Average Compound Yield in Treasury Auctions(%)
5 .9
0
2
4
6
8
10
12
Oct-16 Apr-17 Oct-17 Apr-18 Oct-18
Expected Real Yield of TRY GDDIs(%)

research.isbank
16 Aralık 2017 Source: CBRT, Datastream, Ministry of Finance and Treasury , Reuters, Turkstat
Turkish Economy - Macroeconomic Indicators
10
Growth 2013 2014 2015 2016 2017 18-Q1 18-Q2 18-Q3
GDP (USD billion) 950 935 862 863 851 208 204
GDP (TRY billion) 1,810 2,045 2,339 2,609 3,107 793 884
GDP Growth Rate (%) 8.5 5.2 6.1 3.2 7.4 7.4 5.2
Inflation (%) Aug-18 Sep-18 Oct-18
CPI (annual) 7.40 8.17 8.81 8.53 11.92 17.90 24.52 25.24
Domestic PPI (annual) 6.97 6.36 5.71 9.94 15.47 32.13 46.15 45.01
May-18 Jun-18 Jul-18
Unemployment Rate (%) 9.1 10.3 10.2 12.0 9.9 10.6 10.9 11.0
Labor Force Participation Rate (%) 48.5 51.0 51.7 52.4 53.1 53.0 53.2 53.2
Aug-18 Sep-18 Oct-18
CPI Based Real Effective Exchange Rate 100.6 105.4 98.1 92.3 85.2 64.9 61.5 69.0
USD/TRY 2.1485 2.3378 2.9189 3.5176 3.7916 6.6223 6.0073 5.6033
EUR/TRY 2.9605 2.8288 3.1708 3.7102 4.5530 7.7050 6.9775 6.3488
Currency Basket (0.5*EUR+0.5*USD) 2.5545 2.5833 3.0448 3.6139 4.1723 7.1636 6.4924 5.9761
Jul-18 Aug-18 Sep-18
Exports 151.8 157.6 143.8 142.5 157.0 163.2 162.3 165.0
Imports 251.7 242.2 207.2 198.6 233.8 247.0 242.7 239.0
Foreign Trade Balance -99.9 -84.6 -63.4 -56.1 -76.8 -83.8 -80.3 -74.0
Import Coverage Ratio (%) 60.3 65.1 69.4 71.8 67.1 66.1 66.9 69.0
Jun-18 Jul-18 Aug-18
Current Account Balance -63.6 -43.6 -32.1 -33.1 -47.5 -57.6 -54.6 -51.1
Capital and Financial Accounts -62.7 -42.6 -22.4 -22.1 -46.7 -42.4 -36.7 -31.1
Direct Investments (net) -9.9 -6.1 -12.9 -10.2 -8.3 -7.8 -7.4 -7.4
Portfolio Investments (net) -24.0 -20.2 15.7 -6.3 -24.5 -6.9 -6.1 -2.0
Other Investments (net) -38.7 -15.9 -13.3 -6.5 -5.7 -14.2 -14.5 -1.5
Reserve Assets (net) 9.9 -0.5 -11.8 0.8 -8.2 -13.6 -8.7 -20.2
Net Errors and Omissions 1.0 1.1 9.8 11.0 0.7 15.1 17.9 20.0
Current Account Balance/GDP (%) -6.7 -4.7 -3.7 -3.8 -5.6 - - -
Jul-18 Aug-18 Sep-18
Expenditures 408.2 448.8 506.3 584.1 678.3 460.4 536.5 603.5
Interest Expenditures 50.0 49.9 53.0 50.2 56.7 42.0 50.2 60.4
Non-interest Expenditures 358.2 398.8 453.3 533.8 621.6 418.5 486.3 543.1
Revenues 389.7 425.4 482.8 554.1 630.5 415.4 485.7 546.8
Tax Revenues 326.2 352.5 407.8 459.0 536.6 349.2 410.1 459.4
Budget Balance -18.5 -23.4 -23.5 -29.9 -47.8 -45.0 -50.8 -56.7
Primary Balance 31.4 26.5 29.5 20.3 8.9 -3.0 -0.6 3.7
Budget Balance/GDP (%) -1.0 -1.1 -1.0 -1.1 -1.5 - - -
Jul-18 Aug-18 Sep-18
Domestic Debt Stock 403.0 414.6 440.1 468.6 535.4 571.3 579.4 587.0
External Debt Stock 183.2 197.9 238.1 291.3 341.0 438.3 574.1 534.2
Total Debt Stock 586.2 612.5 678.2 760.0 876.5 1009.6 1,153.5 1,121.2
(1) 12-month cumulative(2) Year-to-date cumulative(3) According to Central Government Budget
Central Government Debt Stock (TRY billion)
Seasonally Adjusted Labor Market Figures
FX Rates
Foreign Trade Balance (1) (USD billion)
Balance of Payments (1) (USD billion)
Budget (2) (3) (TRY billion)
research.isbank
16 Aralık 2017
Source: BRSA, Turkstat
11
Turkish Economy - Banking Sector Outlook
(TRY billion) 2013 2014 2015 2016 2017 Aug.18 Sep.18 Change( 1 )
TOTAL ASSETS 1,732 1,994 2,357 2,731 3,258 4,490 4,211 29.3
Loans 1,047 1,241 1,485 1,734 2,098 2,703 2,588 23.3
TRY Loans 753 881 1,013 1,131 1,414 1,508 1,492 5.5
Share (%) 71.9 71.0 68.2 65.2 67.4 55.8 57.7 -
FX Loans 295 360 472 603 684 1,195 1,096 60.2
Share (%) 28.1 29.0 31.8 34.8 32.6 44.2 42.3 -
Non-performing Loans 29.6 36.4 47.5 58.2 64.0 79.5 86.2 34.7
Non-performing Loan Rate (%) 2.8 2.9 3.1 3.2 3.0 2.9 3.2 -
Securities 287 302 330 352 402 481 489 21.9
TOTAL LIABILITIES 1,732 1,994 2,357 2,731 3,258 4,490 4,211 29.3
Deposits 946 1,053 1,245 1,454 1,711 2,226 2,137 24.9
TRY Deposits 594 661 715 845 955 1,035 1,035 8.4
Share (%) 62.8 62.8 57.4 58.1 55.8 46.5 48.4 -
FX Deposits 352 391 530 609 756 1,191 1,102 45.6
Share (%) 37.2 37.2 42.6 41.9 44.2 53.5 51.6 -
Securities Issued 61 89 98 116 145 225 205 40.7
Payables to Banks 254 293 361 418 475 780 686 44.4
Funds from Repo Transactions 119 137 157 138 99 212 144 46.1
SHAREHOLDERS' EQUITY 194 232 262 300 359 396 409 13.9
Profit (Loss) of the Period 24.7 24.6 26.1 37.5 49.1 38.0 42.2 -
RATIOS (%)
Loans/GDP 57.9 60.7 63.5 66.5 67.6
Loans/Assets 60.5 62.2 63.0 63.5 64.4 60.2 61.5 -
Securities/Assets 16.6 15.2 14.0 12.9 12.3 10.7 11.6 -
Deposits/Liabilities 54.6 52.8 52.8 53.2 52.5 49.6 50.7 -
Loans/Deposits 110.7 117.9 119.2 119.3 122.6 121.4 121.1 -
Capital Adequacy (%) 15.3 16.3 15.6 15.6 16.9 17.3 18.1 -
(1) Year-to-date % change
BANKING SECTOR ACCORDING TO BRSA's MONTHLY BULLETIN FIGURES
LEGAL NOTICE
This report has been prepared by Türkiye İş Bankası A.Ş. economists and analysts by using the information from publicly available sources believed to be reliable, solely for information purposes; and they are not intended to be construed as an offer or solicitation for the purchase or sale of any financial in-strument or the provision of an offer to provide investment services. The views, opinions and analyses expressed do not represent the official standing of Türkiye İş Bankası A.Ş. and are personal views and opinions of the analysts and economists who prepare the report. No representation or warranty, express or implied, is made as to the accuracy or completeness of the information contained in this report. All information contained in this report is subject to change without notice, Türkiye İş Bankası A,Ş, accepts no liability whatsoever for any direct or consequential loss arising from any use of this report or its contents.
This report is copyright-protected. Reproducing, publishing and/or distributing this report in whole or in part is therefore prohibited. All rights reserved.
Our reports are available on our website https://research.isbank.com.tr