monthly golf statistics recreation centers of sun city
TRANSCRIPT

RECREATION CENTERS OF SUN CITY WEST, INC.Monthly Golf Statistics
March Golf Report
March 44,540 rounds are above prior year by 5,888 (15%) and above budget by 1,166 rounds (3%).
Regulation courses were up 4,524 rounds vs. prior year and up 1,371 rounds vs. budget Executive courses were up 1,364 rounds vs. prior year and down 205 rounds vs. budget
Member rounds were up 4,589 rounds vs. prior year and up 2,380 vs. budget Member Guest rounds were up 280 rounds vs. prior year and down (1,293) vs. budget Public rounds were up 1,022 rounds vs. prior year and up 36 vs. budget Employee rounds were down (3) rounds vs. prior year and up 43 vs. budget. Unlimited Cards sales are up 5 vs. prior year and up 4 vs. budget Kachina Cards sales are up 30 vs. prior year and up 26 vs. budget Coyote Cards sales are up 25 vs. prior year and up 17 vs. budget Range Ball Key sales are up 46 vs. prior year and up 96 vs. budget See charts that follow for further details
RECREATION CENTERS OF SUN CITY WEST, INC.Monthly Golf Sta�s�cs
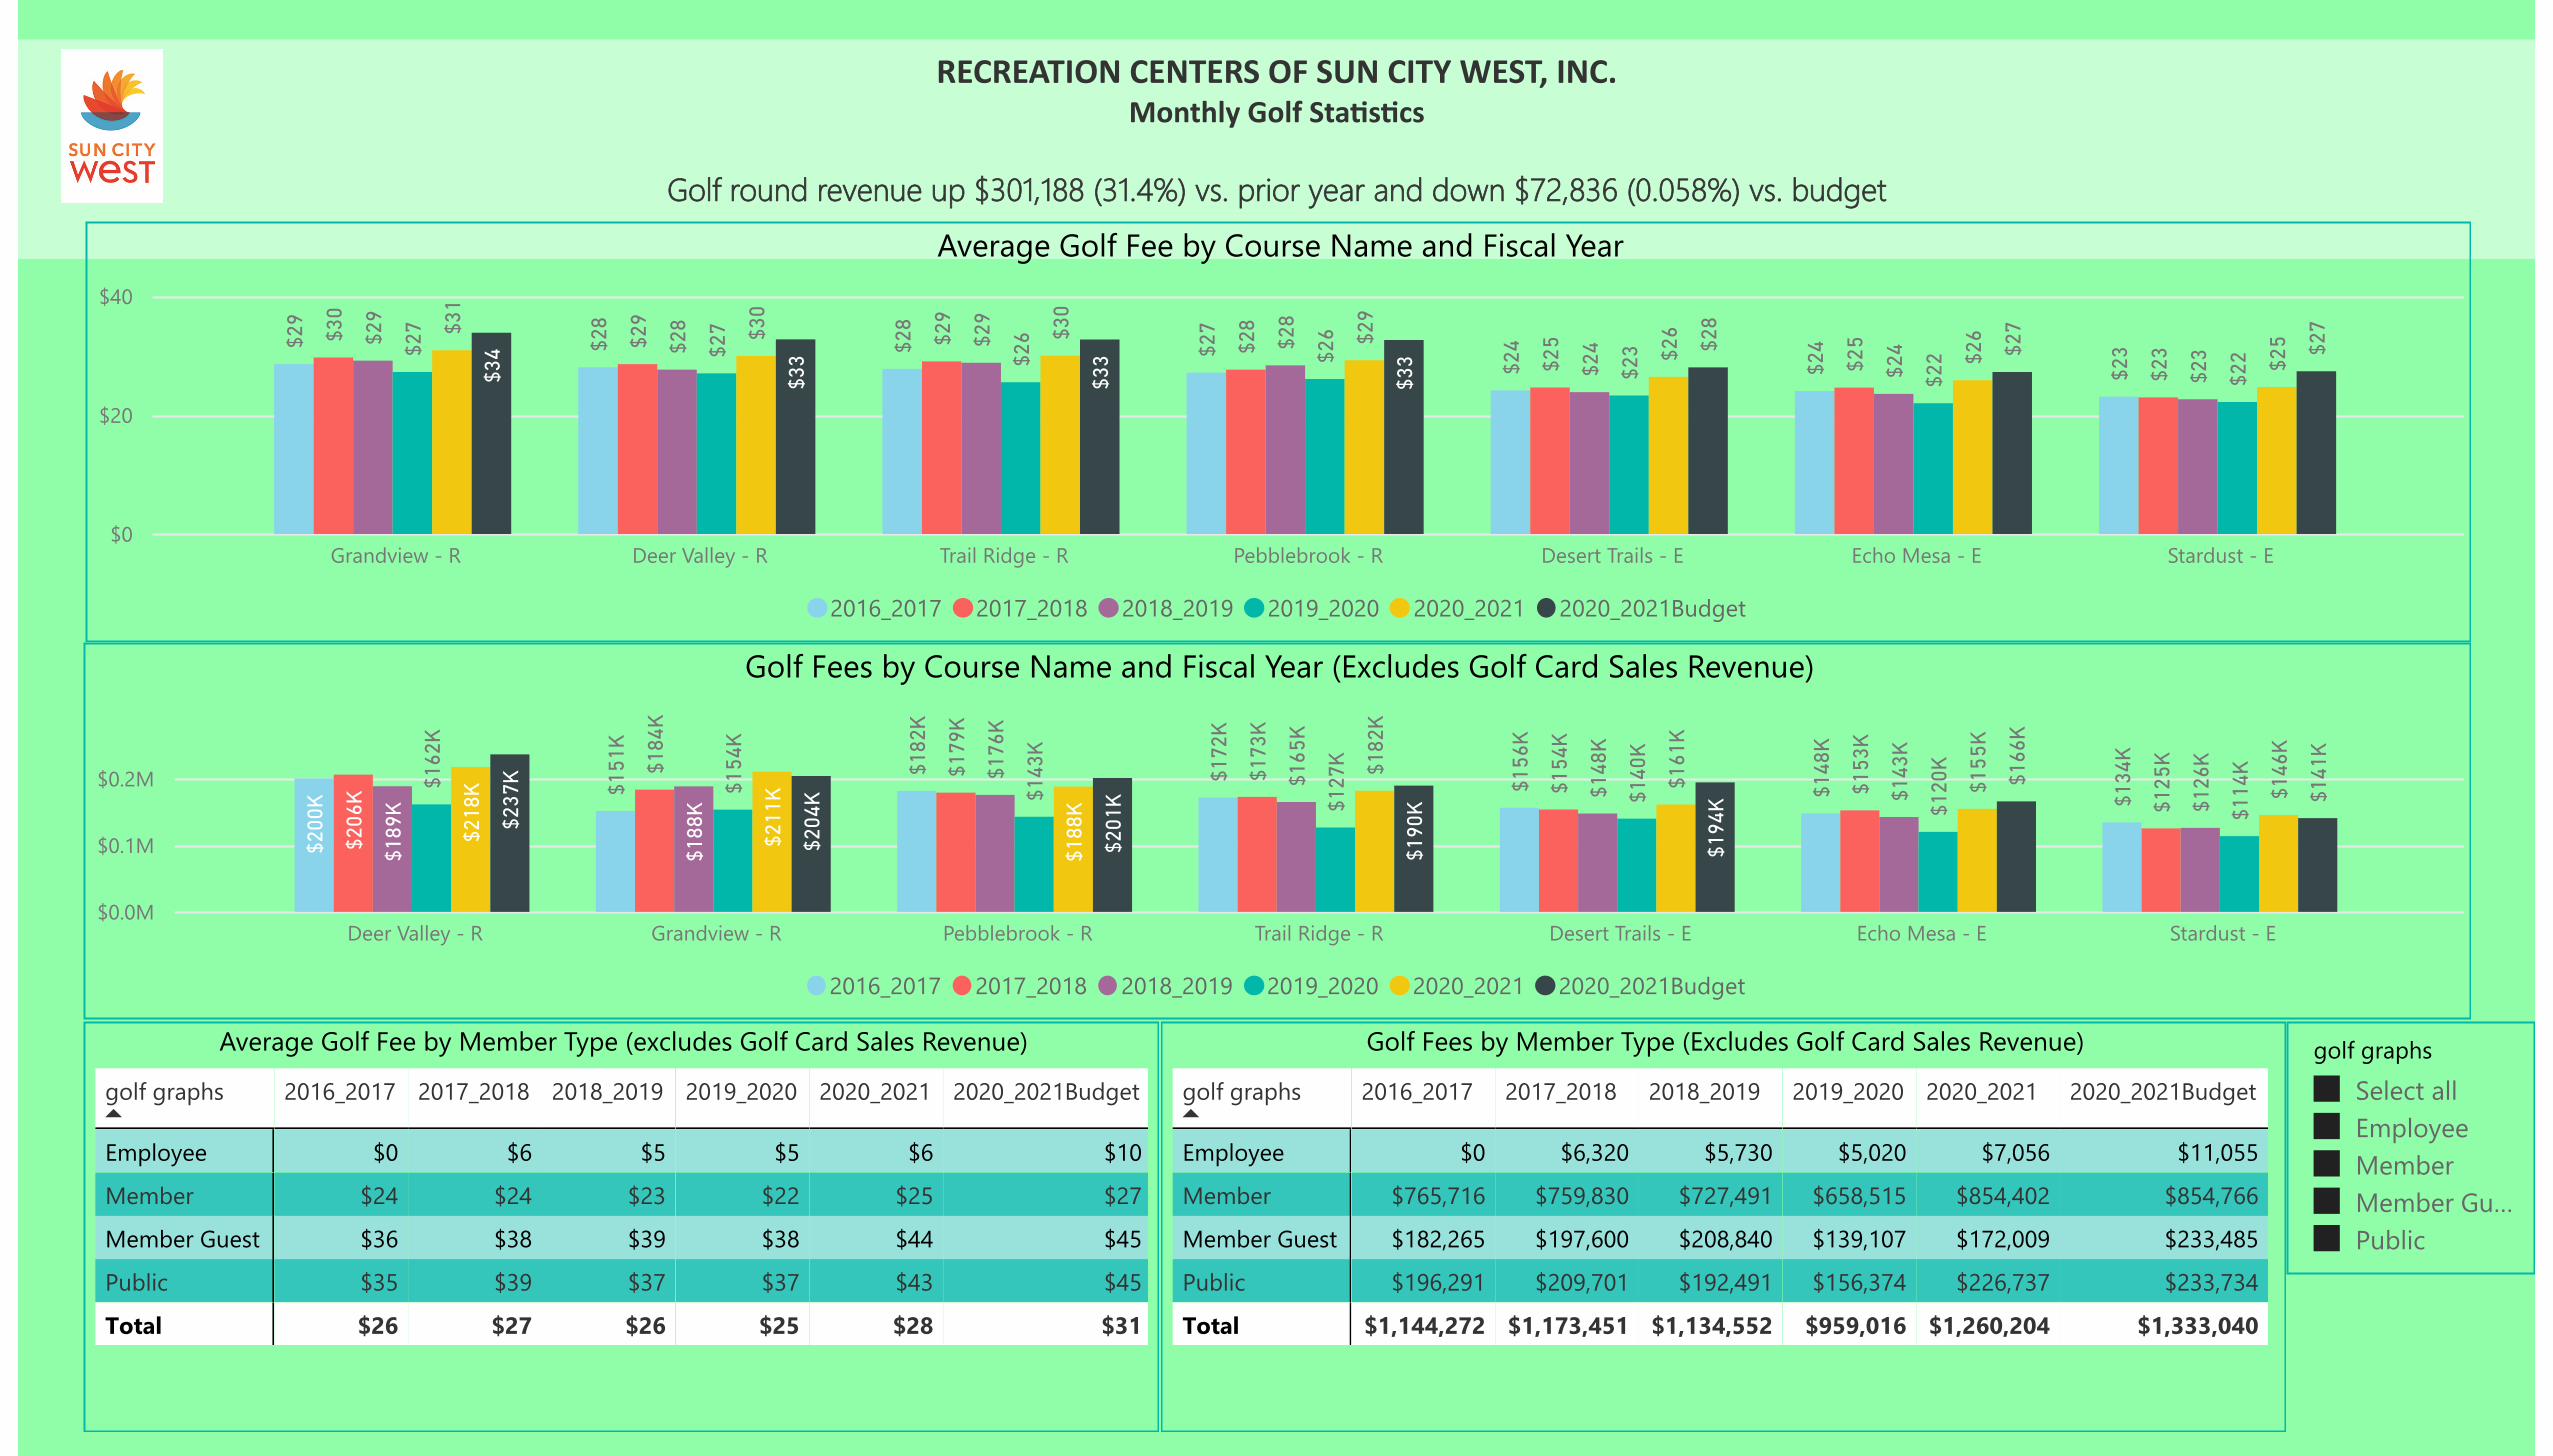
Golf round revenue up $301,188 (31.4%) vs. prior year and down $72,836 (0.058%) vs. budget
Average Golf Fee by Course Name and Fiscal Year
$0
$20
$40
Grandview - R Deer Valley - R Trail Ridge - R Pebblebrook - R Desert Trails - E Echo Mesa - E Stardust - E
$29
$28
$28
$27
$24
$24
$23
$30
$29
$29
$28
$25
$25
$23
$29
$28
$29
$28
$24
$24
$23$2
7
$27
$26
$26
$23
$22
$22
$31
$30
$30
$29
$26
$26
$25
$34
$33
$33
$33
$28
$27
$27
2016_2017 2017_2018 2018_2019 2019_2020 2020_2021 2020_2021Budget
Average Golf Fee by Member Type (excludes Golf Card Sales Revenue)
golf graphs
2016_2017
2017_2018
2018_2019
2019_2020
2020_2021
2020_2021Budget
Employee
Member
Member Guest
Public
$0
$24
$36
$35
$6
$24
$38
$39
$5
$23
$39
$37
$5
$22
$38
$37
$6
$25
$44
$43
$10
$27
$45
$45
Total $26 $27 $26 $25 $28 $31
golf graphs
Select all Employee Member Member Gu… Public
Golf Fees by Member Type (Excludes Golf Card Sales Revenue)
golf graphs
2016_2017
2017_2018
2018_2019
2019_2020
2020_2021
2020_2021Budget
Employee
Member
Member Guest
Public
$0
$765,716
$182,265
$196,291
$6,320
$759,830
$197,600
$209,701
$5,730
$727,491
$208,840
$192,491
$5,020
$658,515
$139,107
$156,374
$7,056
$854,402
$172,009
$226,737
$11,055
$854,766
$233,485
$233,734
Total $1,144,272 $1,173,451 $1,134,552 $959,016 $1,260,204 $1,333,040
Golf Fees by Course Name and Fiscal Year (Excludes Golf Card Sales Revenue)
$0.0M
$0.1M
$0.2M
Deer Valley - R Grandview - R Pebblebrook - R Trail Ridge - R Desert Trails - E Echo Mesa - E Stardust - E
$200
K $151
K
$182
K
$172
K
$156
K
$148
K
$134K
$206
K
$184
K
$179
K
$173
K
$154
K
$153
K
$125
K
$189
K
$188
K
$176
K
$165
K
$148
K
$143K
$126K
$162
K
$154
K
$143K
$127K
$140K
$120K
$114K
$218
K
$211
K
$188
K
$182
K
$161
K
$155
K
$146K
$237
K
$204
K
$201
K
$190
K
$194
K
$166
K
$141K
2016_2017 2017_2018 2018_2019 2019_2020 2020_2021 2020_2021Budget

RECREATION CENTERS OF SUN CITY WEST, INC.Monthly Golf Sta�s�cs
Round Count by Member Card Type
0K
5K
10K
15K
20K
RESIDENT - NO CARD COYOTE CARD KACHINA CARD PUBLIC MEMBER GUEST UNLIMITED CARD EMPLOYEE TWILIGHT CARD CNPFPC
18,964
6,022
4,830
5,51
5
5,133
2,164
1,082
41
18,724
5,687
5,385
5,365
5,175
2,032
1,098
229
5
18,124
5,471
5,52
3
5,104
5,392
1,899
1,067
343
81
16,998
4,95
8
5,219
4,194
3,664
2,039
1,112
430
38
18,173
6,315
6,677
5,149
3,944
2,449
1,109
619
105
18,844
5,730
5,361
5,181
5,237
1,789
1,066
129
37
2016_2017 2017_2018 2018_2019 2019_2020 2020_2021 2020_2021Budget
golf graphs
Select all Employee Member Member Guest Public
Regulation Courses are surpassing prior year and budget round counts; Executive Courses have surpassed the prior year but are just shy of the budget round counts;
Prime had the most rounds, however, twilight was the time that passed both prior year and budget.
Round Count by Course Type
0K
10K
20K
30K
Regulation Executive
25,313 18,438
25,815
17,885
25,205
17,79922
,054
16,598
26,578
17,962
25,207
18,167
2016_2017 2017_2018 2018_2019 2019_2020 2020_2021 2020_2021Budget
Round Count by Time Played
0K
10K
20K
30K
Prime Twilight Super Twilight
33,745
7,04
8
2,95
8
33,598
7,45
7
2,64
5
32,206
6,96
0
3,83
8
27,315
6,93
7
4,40
0
32,770
7,40
8
4,36
2
33,668
6,79
3
2,91
3
2016_2017 2017_2018 2018_2019 2019_2020 2020_2021 2020_2021Budget

RECREATION CENTERS OF SUN CITY WEST, INC.Monthly Golf Sta�s�cs
We are seeing 62% male golfers vs. 38% female golfers during this period.
Round Count by Golf Course
0K
2K
4K
6K
8K
Deer Valley - R Desert Trails - E Pebblebrook - R Grandview - R Echo Mesa - E Trail Ridge - R Stardust - E
7,13
8 6,47
3
6,69
2
5,29
6 6,15
1
6,18
7
5,81
4
7,21
1 6,24
2
6,47
6
6,18
1
6,19
1
5,94
7
5,45
2
6,82
4 6,18
7
6,19
2
6,46
2
6,04
7
5,72
7
5,56
5
5,97
8
6,01
3
5,47
8
5,63
2
5,45
9
4,96
6
5,12
6
7,26
6
6,09
7
6,43
8
6,81
2 5,98
0
6,06
2
5,88
5
7,22
7
6,93
5 6,16
1
6,02
4
6,09
1
5,79
5
5,14
1
2016_2017 2017_2018 2018_2019 2019_2020 2020_2021 2020_2021Budget
Course Type 2016_2017
2017_2018
2018_2019
2019_2020
2020_2021
2020_2021Budget
Executive
Regulation
18,438
25,313
17,885
25,815
17,799
25,205
16,598
22,054
17,962
26,578
18,167
25,207
Total 43,751 43,700 43,004 38,652 44,540 43,374
golf graphs
Select all Employee Member Member Guest Public
golf graphs
2016_2017
2017_2018
2018_2019
2019_2020
2020_2021
2020_2021Budget
Employee
Member
Member Guest
Public
1,082
31,980
5,133
5,556
1,098
32,057
5,175
5,370
1,067
31,360
5,392
5,185
1,112
29,644
3,664
4,232
1,109
34,233
3,944
5,254
1,066
31,853
5,237
5,218
Total 43,751 43,700 43,004 38,652 44,540 43,374
golf graphs
FY 19-20 FY 20-21 CY vs PY % CY vs PY FY 20-21 Budget CY vs Budget % CY vs Budget
Employee
Member
Member Guest
Public
1,112
29,644
3,664
4,232
1,109
34,233
3,944
5,254
-3
4,589
280
1,022
-0%
15%
8%
24%
1,066
31,853
5,237
5,218
43
2,380
-1,293
36
4%
7%
-25%
1%
Total 38,652 44,540 5,888 15% 43,374 1,166 3%
Male 62%
Female 38%
Gender Male Female NA
RECREATION CENTERS OF SUN CITY WEST, INC.Monthly Golf Sta�s�cs
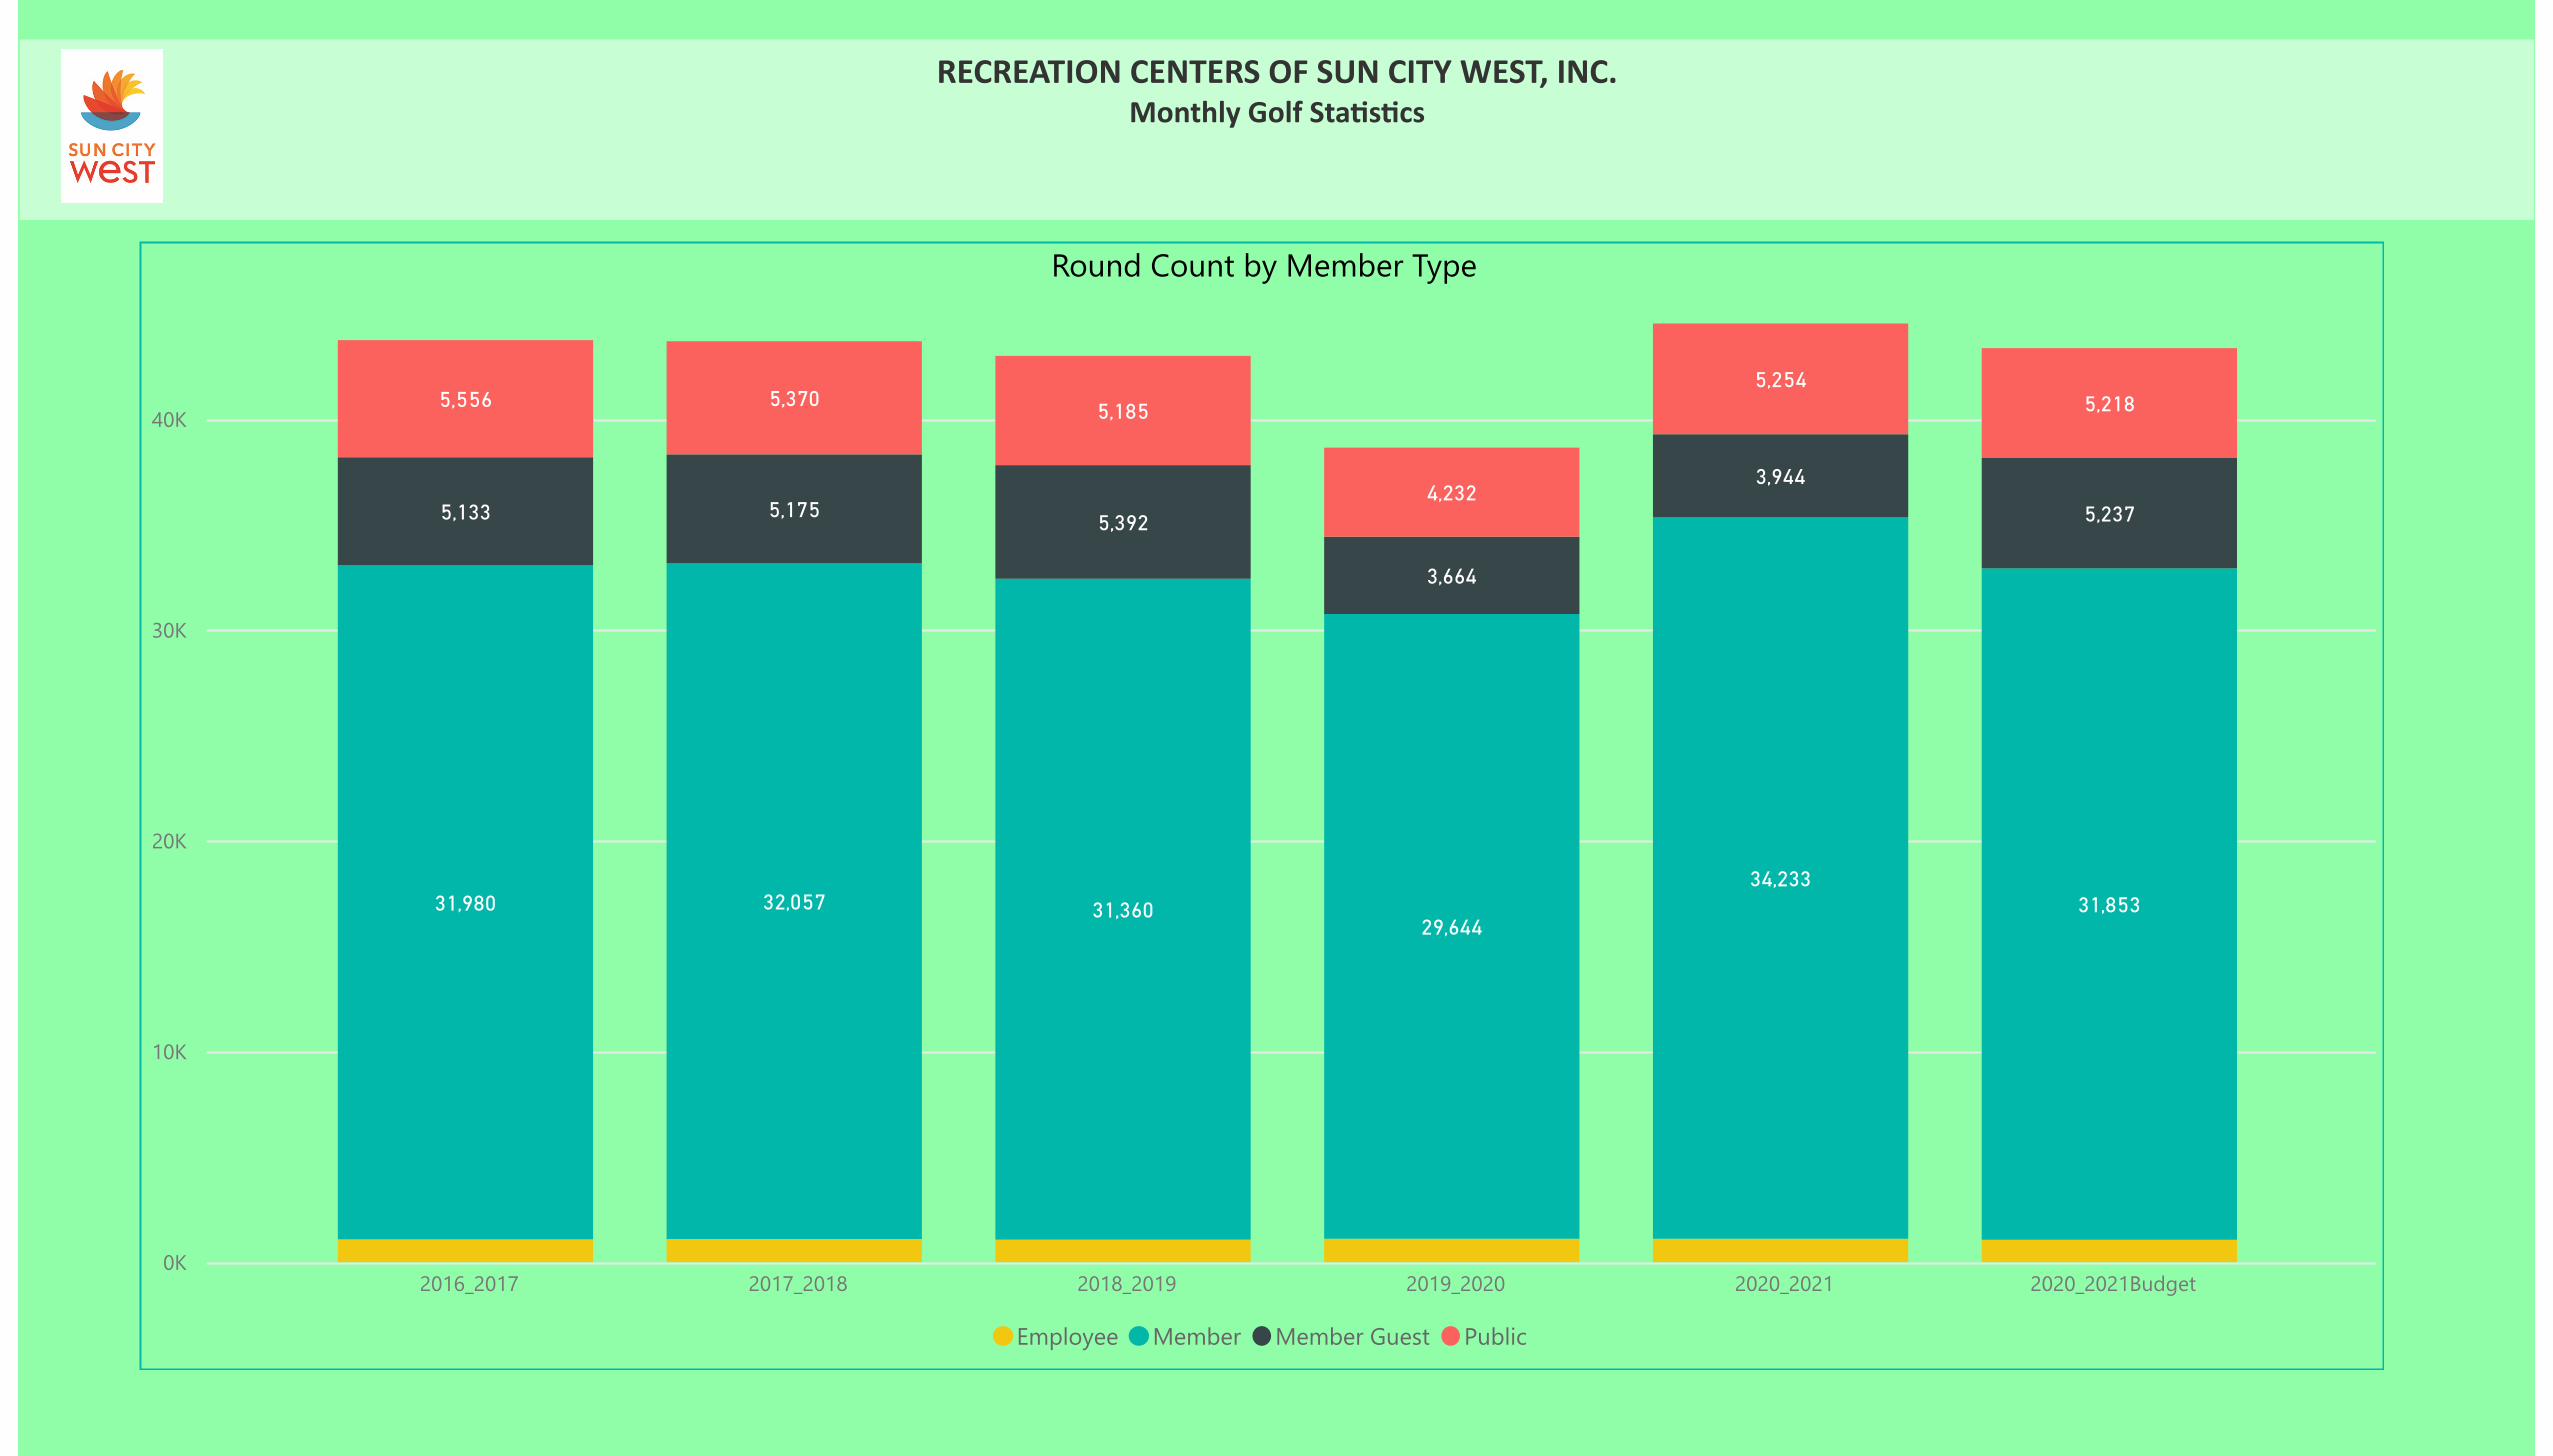
Round Count by Member Type
0K
10K
20K
30K
40K
2016_2017 2017_2018 2018_2019 2019_2020 2020_2021 2020_2021Budget
31,980 32,057 31,36029,644
34,23331,853
5,133 5,175 5,392
3,664
3,944
5,237
5,556 5,370 5,185
4,232
5,2545,218
Employee Member Member Guest Public
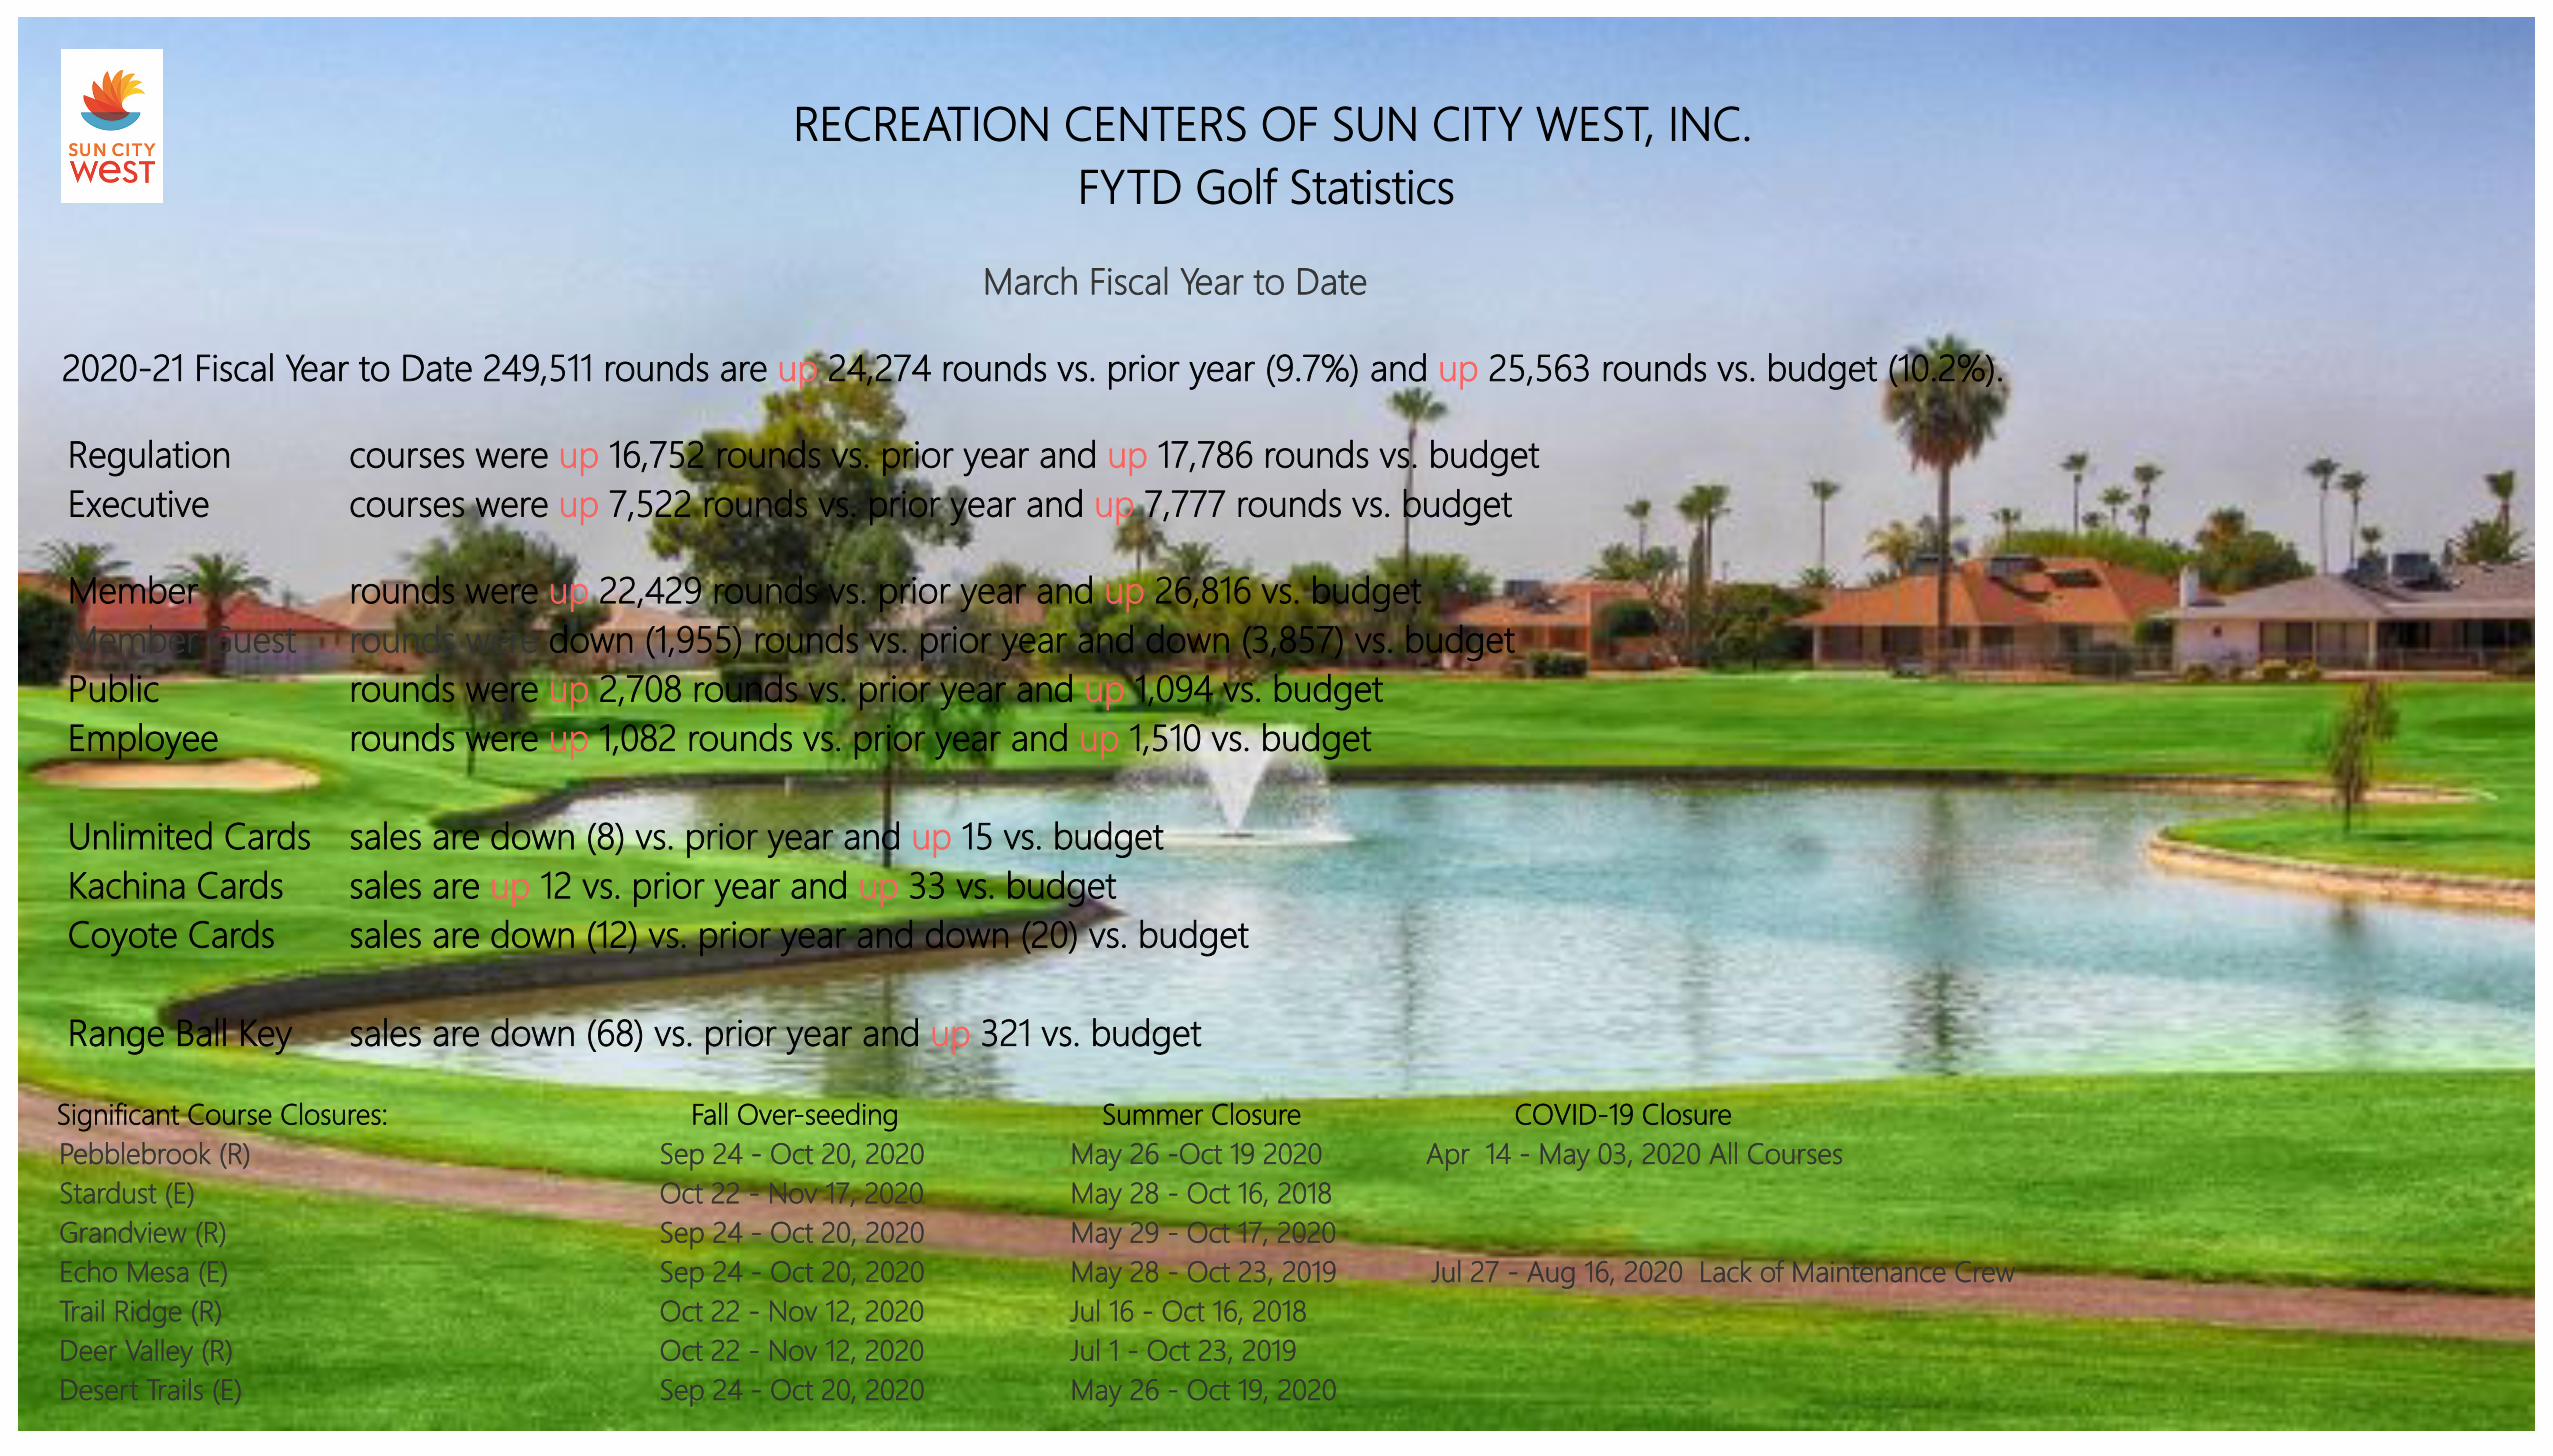
RECREATION CENTERS OF SUN CITY WEST, INC.FYTD Golf Statistics
March Fiscal Year to Date 2020-21 Fiscal Year to Date 249,511 rounds are up 24,274 rounds vs. prior year (9.7%) and up 25,563 rounds vs. budget (10.2%). Regulation courses were up 16,752 rounds vs. prior year and up 17,786 rounds vs. budget Executive courses were up 7,522 rounds vs. prior year and up 7,777 rounds vs. budget Member rounds were up 22,429 rounds vs. prior year and up 26,816 vs. budget Member Guest rounds were down (1,955) rounds vs. prior year and down (3,857) vs. budget Public rounds were up 2,708 rounds vs. prior year and up 1,094 vs. budget Employee rounds were up 1,082 rounds vs. prior year and up 1,510 vs. budget Unlimited Cards sales are down (8) vs. prior year and up 15 vs. budget Kachina Cards sales are up 12 vs. prior year and up 33 vs. budget Coyote Cards sales are down (12) vs. prior year and down (20) vs. budget Range Ball Key sales are down (68) vs. prior year and up 321 vs. budget Significant Course Closures: Fall Over-seeding Summer Closure COVID-19 Closure Pebblebrook (R) Sep 24 - Oct 20, 2020 May 26 -Oct 19 2020 Apr 14 - May 03, 2020 All Courses Stardust (E) Oct 22 - Nov 17, 2020 May 28 - Oct 16, 2018 Grandview (R) Sep 24 - Oct 20, 2020 May 29 - Oct 17, 2020 Echo Mesa (E) Sep 24 - Oct 20, 2020 May 28 - Oct 23, 2019 Jul 27 - Aug 16, 2020 Lack of Maintenance Crew Trail Ridge (R) Oct 22 - Nov 12, 2020 Jul 16 - Oct 16, 2018 Deer Valley (R) Oct 22 - Nov 12, 2020 Jul 1 - Oct 23, 2019 Desert Trails (E) Sep 24 - Oct 20, 2020 May 26 - Oct 19, 2020

RECREATION CENTERS OF SUN CITY WEST, INC.FYTD Golf Sta�s�cs
Average Golf Fee by Course Name and Fiscal Year
$0
$20
Grandview - R Pebblebrook - R Deer Valley - R Trail Ridge - R Desert Trails - E Echo Mesa - E Stardust - E
$24
$23
$23
$23
$20 $22
$20
$26
$22 $23
$23
$22
$20
$20$2
3
$23
$23
$24
$20
$19 $21
$21 $23
$24
$20
$20
$20
$18
$25 $27
$23
$23 $25
$22
$20
$27
$29
$26
$26
$26
$22
$22
2016_2017 2017_2018 2018_2019 2019_2020 2020_2021 2020_2021Budget
Average Golf Fee by Member Type (excludes Golf Card Sales Revenue)
golf graphs
2016_2017
2017_2018
2018_2019
2019_2020
2020_2021
2020_2021Budget
Employee
Member
Member Guest
Public
$0
$21
$34
$31
$3
$20
$37
$34
$3
$20
$37
$33
$3
$19
$37
$33
$3
$21
$42
$39
$6
$23
$43
$39
Total $22 $22 $22 $21 $24 $25
golf graphs
Employee Member Member Guest Public
Golf Fees by Member Type (Excludes Golf Card Sales Revenue)
golf graphs
2016_2017
2017_2018
2018_2019
2019_2020
2020_2021
2020_2021Budget
Public
Member Guest
Member
Employee
$1,051,583
$771,183
$4,489,469
$0
$1,029,404
$826,841
$4,586,371
$35,490
$983,707
$854,247
$4,440,071
$32,890
$837,367
$657,696
$4,345,018
$28,550
$988,528
$612,830
$4,232,435
$32,346
$1,249,248
$971,355
$5,058,567
$60,021
Total $6,312,235 $6,478,106 $6,310,914 $5,868,631 $5,866,139 $7,339,191
Golf Fees by Course Name and Fiscal Year (Excludes Golf Card Sales Revenue)
$0M
$1M
Deer Valley - R Grandview - R Pebblebrook - R Trail Ridge - R Desert Trails - E Echo Mesa - E Stardust - E
$1,169K
$934K
$882K
$925
K
$873K
$789K
$741K
$1,168K
$974K
$966K
$923K
$846K
$857
K
$746K
$1,148K
$1,006K
$929K
$853
K
$871K
$786K
$719K
$978K
$945
K
$853
K
$821K
$765
K
$760K
$745
K
$1,012K
$979K
$812K
$827K
$746K
$772K
$719K
$1,333K
$1,152
K
$997K
$1,075
K
$976K
$965
K
$843K
2016_2017 2017_2018 2018_2019 2019_2020 2020_2021 2020_2021Budget

RECREATION CENTERS OF SUN CITY WEST, INC.FYTD Golf Sta�s�cs
Round Count by Member Card Type
0K
50K
100K
RESIDENT - NO CARD KACHINA CARD COYOTE CARD PUBLIC MEMBER GUEST UNLIMITED CARD EMPLOYEE TWILIGHT CARD CNPFPC
113,405
42,292
41,271
33,862
22,374
21,519
10,478
487
114,107
48,306
40,871
29,985
22,462
21,008
10,935
1,896
255
110,385
51,026
39,632
28,780
23,185
19,106
10,646
3,336
585
111,85
4
50,763
38,190
25,320
17,820
21,341
11,099
4,372
444
92,506
47,384
36,273
24,989
14,656
19,190
9,304
4,621
588
113,766
49,666
40,742
31,404
22,821
19,102
10,566
1,309
442
2016_2017 2017_2018 2018_2019 2019_2020 2020_2021 2020_2021Budget
golf graphs
Select all Employee Member Member Guest Public
Round Count by Course Type
0K
50K
100K
150K
Regulation Executive
168,11
7
117,57
1
170,79
8
119,02
7
168,17
7
118,50
4
164,15
9
117,04
4
148,27
1
101,24
0
169,45
4
120,36
4
2016_2017 2017_2018 2018_2019 2019_2020 2020_2021 2020_2021Budget
Round Count by Time Played
0.0M
0.1M
0.2M
Prime Twilight Super Twilight
225,12
1
45,821
14,746
227,66
2
47,638
14,525
219,36
4
47,241
20,076
211,45
5
47,140
22,608
186,29
4
42,686
20,531
227,97
1
44,426
17,421
2016_2017 2017_2018 2018_2019 2019_2020 2020_2021 2020_2021Budget

RECREATION CENTERS OF SUN CITY WEST, INC.FYTD Golf Sta�s�cs
Round Count by Golf Course
0K
20K
40K
Deer Valley - R Grandview - R Echo Mesa - E Trail Ridge - R Desert Trails - E Stardust - E Pebblebrook - R
50,457
39,458
36,185 40
,436 43,902
37,484
37,766
50,158
37,491
43,364
39,387
38,350
37,313
43,762
49,435 43,139
40,398
35,003
43,416
34,690
40,600
41,434 44,627
37,639 40,511
37,615 41,790
37,58743
,069
39,333
35,545
35,884
29,915
35,780
29,985
50,473
42,919
43,821
41,498
38,270
38,273
34,564
2016_2017 2017_2018 2018_2019 2019_2020 2020_2021 2020_2021Budget
Course Type 2016_2017
2017_2018
2018_2019
2019_2020
2020_2021
2020_2021Budget
Executive
Regulation
117,571
168,117
119,027
170,798
118,504
168,177
117,044
164,159
101,240
148,271
120,364
169,454
Total 285,688 289,825 286,681 281,203 249,511 289,818
golf graphs
Select all Employee Member Member Guest Public
golf graphs
2016_2017
2017_2018
2018_2019
2019_2020
2020_2021
2020_2021Budget
Employee
Member
Member Guest
Public
10,478
218,487
22,374
34,349
10,935
226,188
22,462
30,240
10,646
223,485
23,185
29,365
11,099
226,520
17,820
25,764
9,304
199,974
14,656
25,577
10,566
224,585
22,821
31,846
Total 285,688 289,825 286,681 281,203 249,511 289,818

RECREATION CENTERS OF SUN CITY WEST, INC.FYTD Golf Sta�s�cs
Round Count by Member Type
0K
50K
100K
150K
200K
250K
300K
2016_2017 2017_2018 2018_2019 2019_2020 2020_2021 2020_2021Budget10,478 10,935 10,646 11,099 9,304 10,566
218,487 226,188 223,485 226,520
199,974
224,585
22,37422,462 23,185 17,820
14,656
22,821
34,34930,240 29,365 25,764
25,577
31,846
Employee Member Member Guest Public
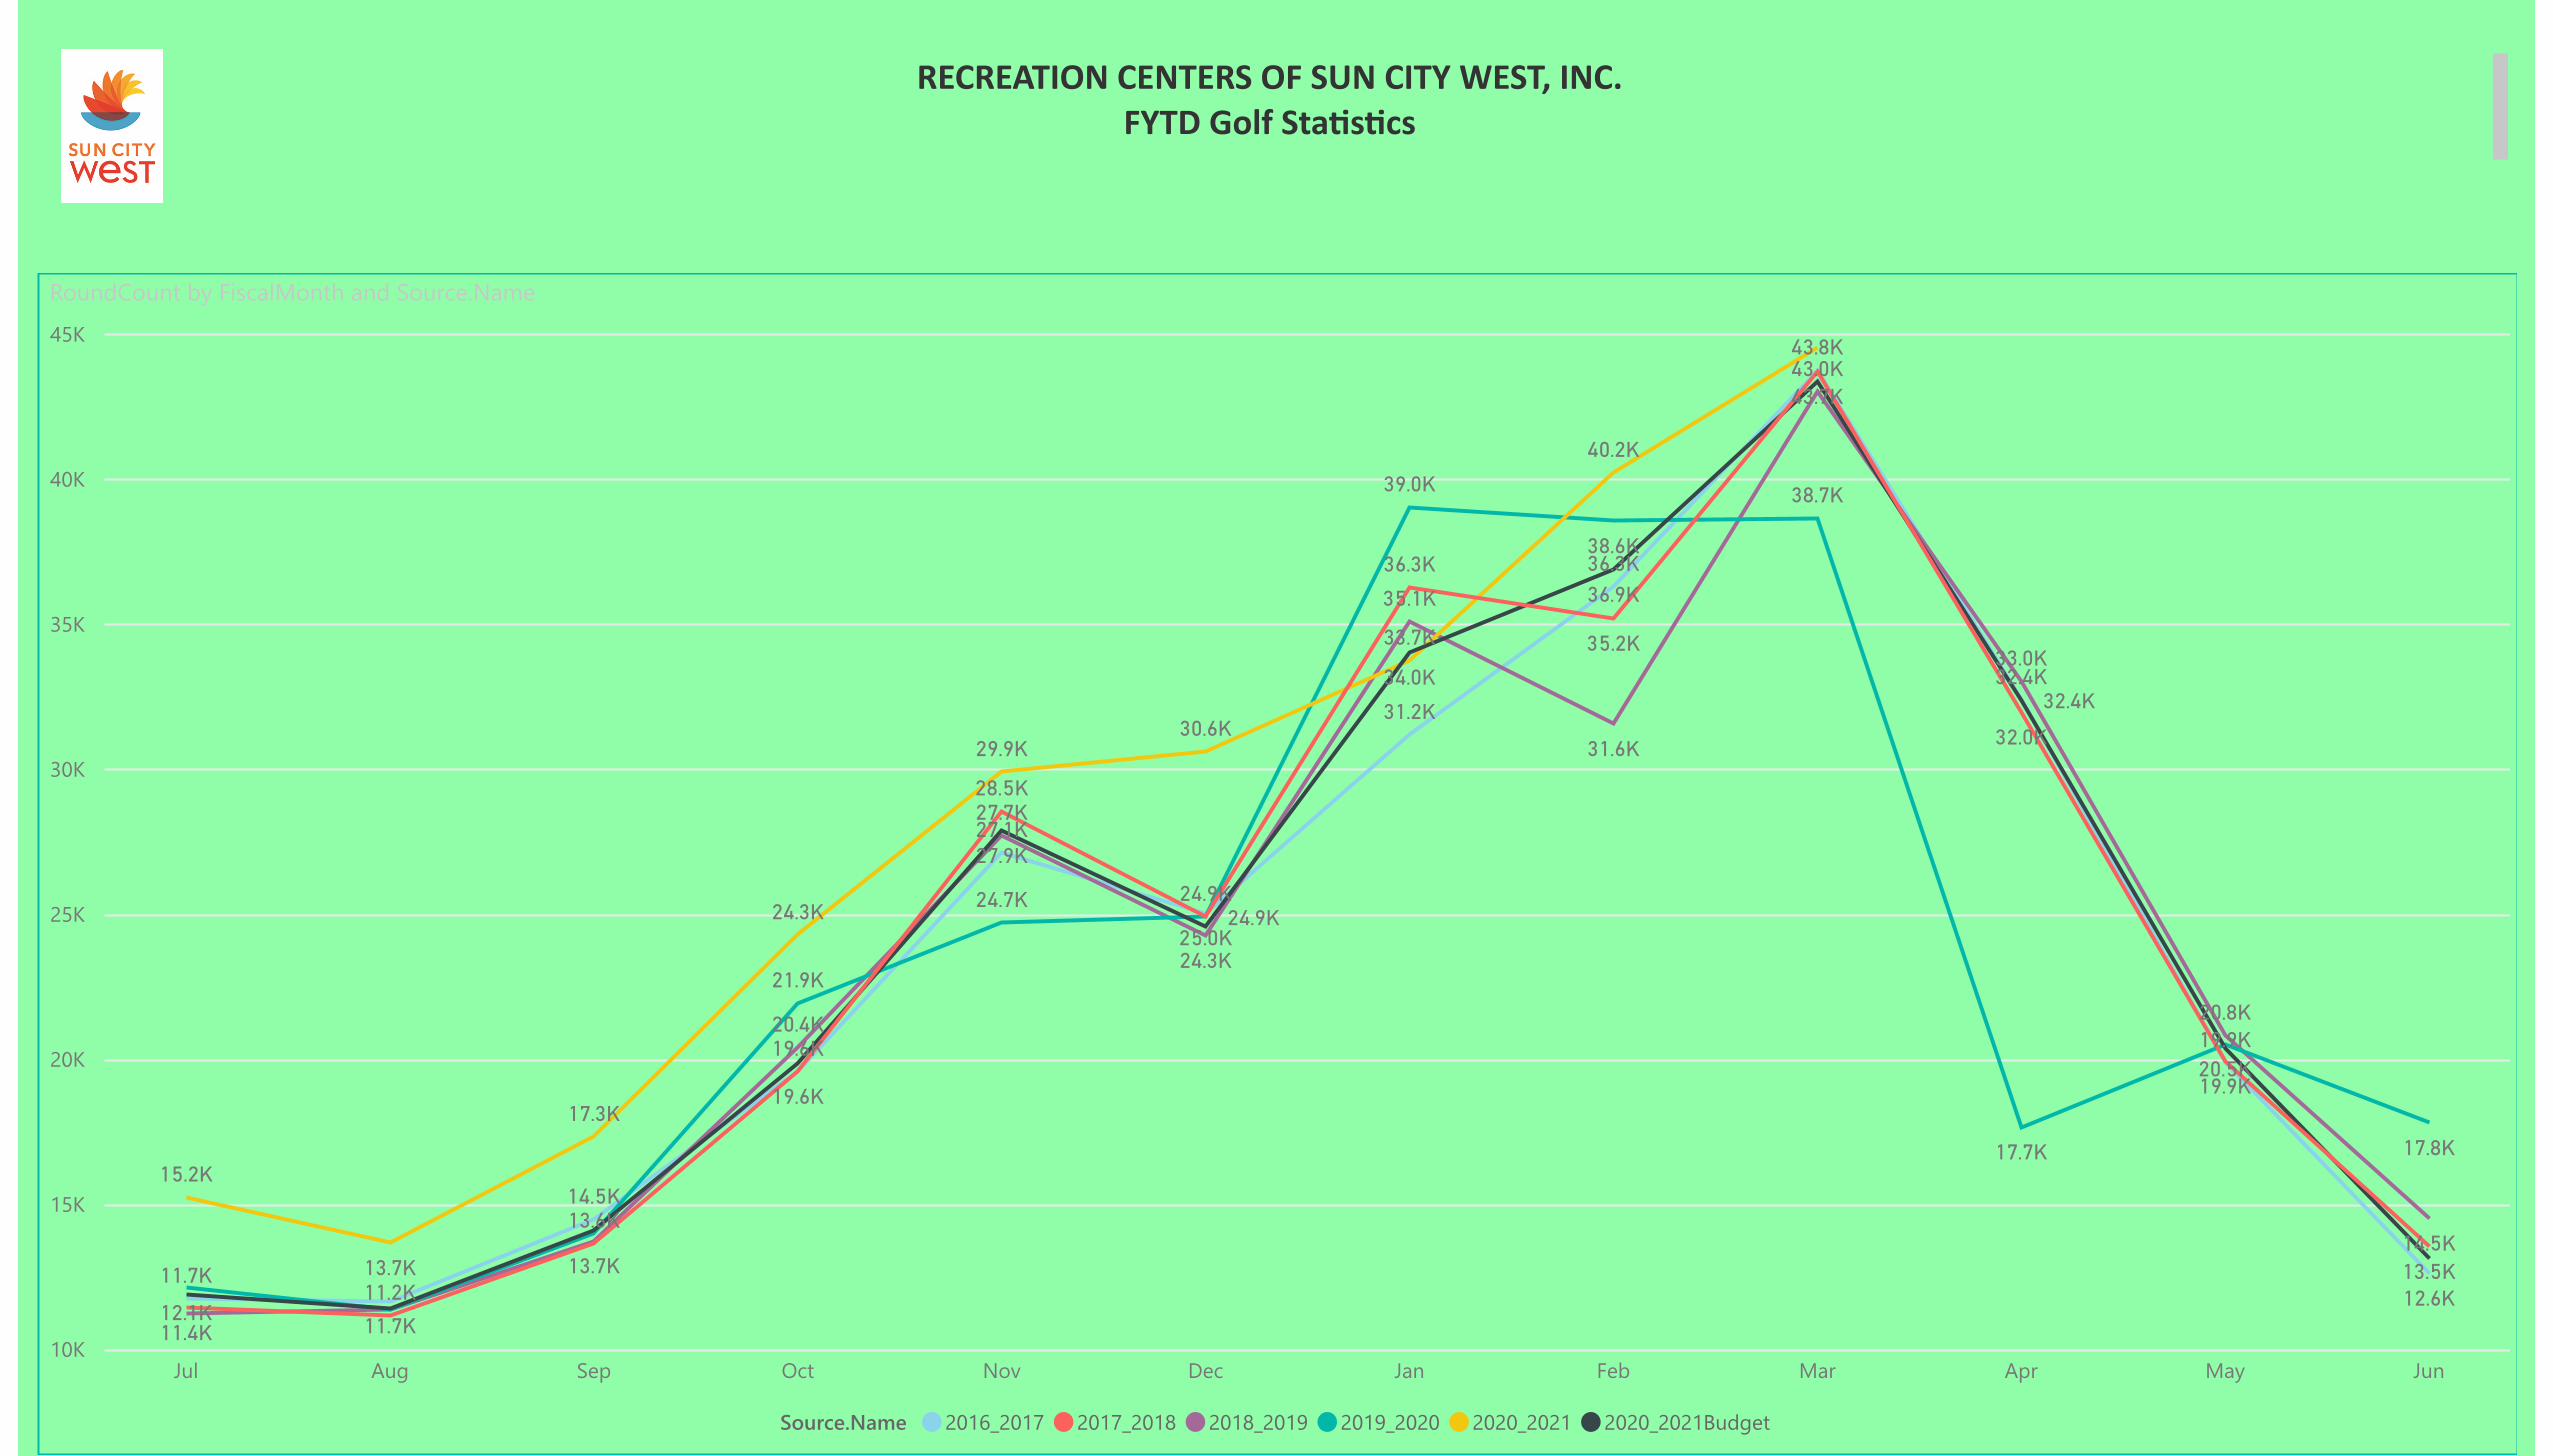
RECREATION CENTERS OF SUN CITY WEST, INC.FYTD Golf Sta�s�cs
RoundCount by FiscalMonth and Source.Name
10K
15K
20K
25K
30K
35K
40K
45K
Jul Aug Sep Oct Nov Dec Jan Feb Mar Apr May Jun
11.7K12.6K
43.8K
11.7K
25.0K
27.1K
19.6K
36.3K
19.9K
14.5K
31.2K
32.4K
11.4K
13.5K
43.7K
11.2K
28.5K
24.9K
36.3K
35.2K
19.6K 19.9K
13.6K
32.0K
14.5K
43.0K
27.7K
31.6K
35.1K
24.3K
13.7K
20.8K20.4K
33.0K
12.1K
17.8K
39.0K
17.7K
38.7K
20.5K
38.6K
24.7K
21.9K
24.9K
15.2K
13.7K
30.6K
24.3K
40.2K
17.3K
29.9K
33.7K
27.9K
36.9K
34.0K32.4K
Source.Name 2016_2017 2017_2018 2018_2019 2019_2020 2020_2021 2020_2021Budget

RECREATION CENTERS OF SUN CITY WEST, INC.FYTD Golf Sta�s�cs
CardCount by Card Type and FiscalYear
0
500
1,000
1,500
CNP Frequent Play Card Coyote Card Kachina Card Range Ball Key Twilight Card Unlimited Card
4
651
455
1,174
129
3
627
502
1,325
23
120
5
634
536
1,336
31
117
4
625
525
1,730
36
138
12
613
537
1,662
42
124
3
633
504
1,341
26
125
FiscalYear FY 2016-17 FY 2017-18 FY 2018-19 FY 2019-20 FY 2020-21 FY 2020-21 Bud
ItemDescription
Select all CNP Frequent Play Card Coyote Card Kachina Card Range Ball Key Twilight Card Unlimited Card
Range Ball Key Program was introduced in October 2016
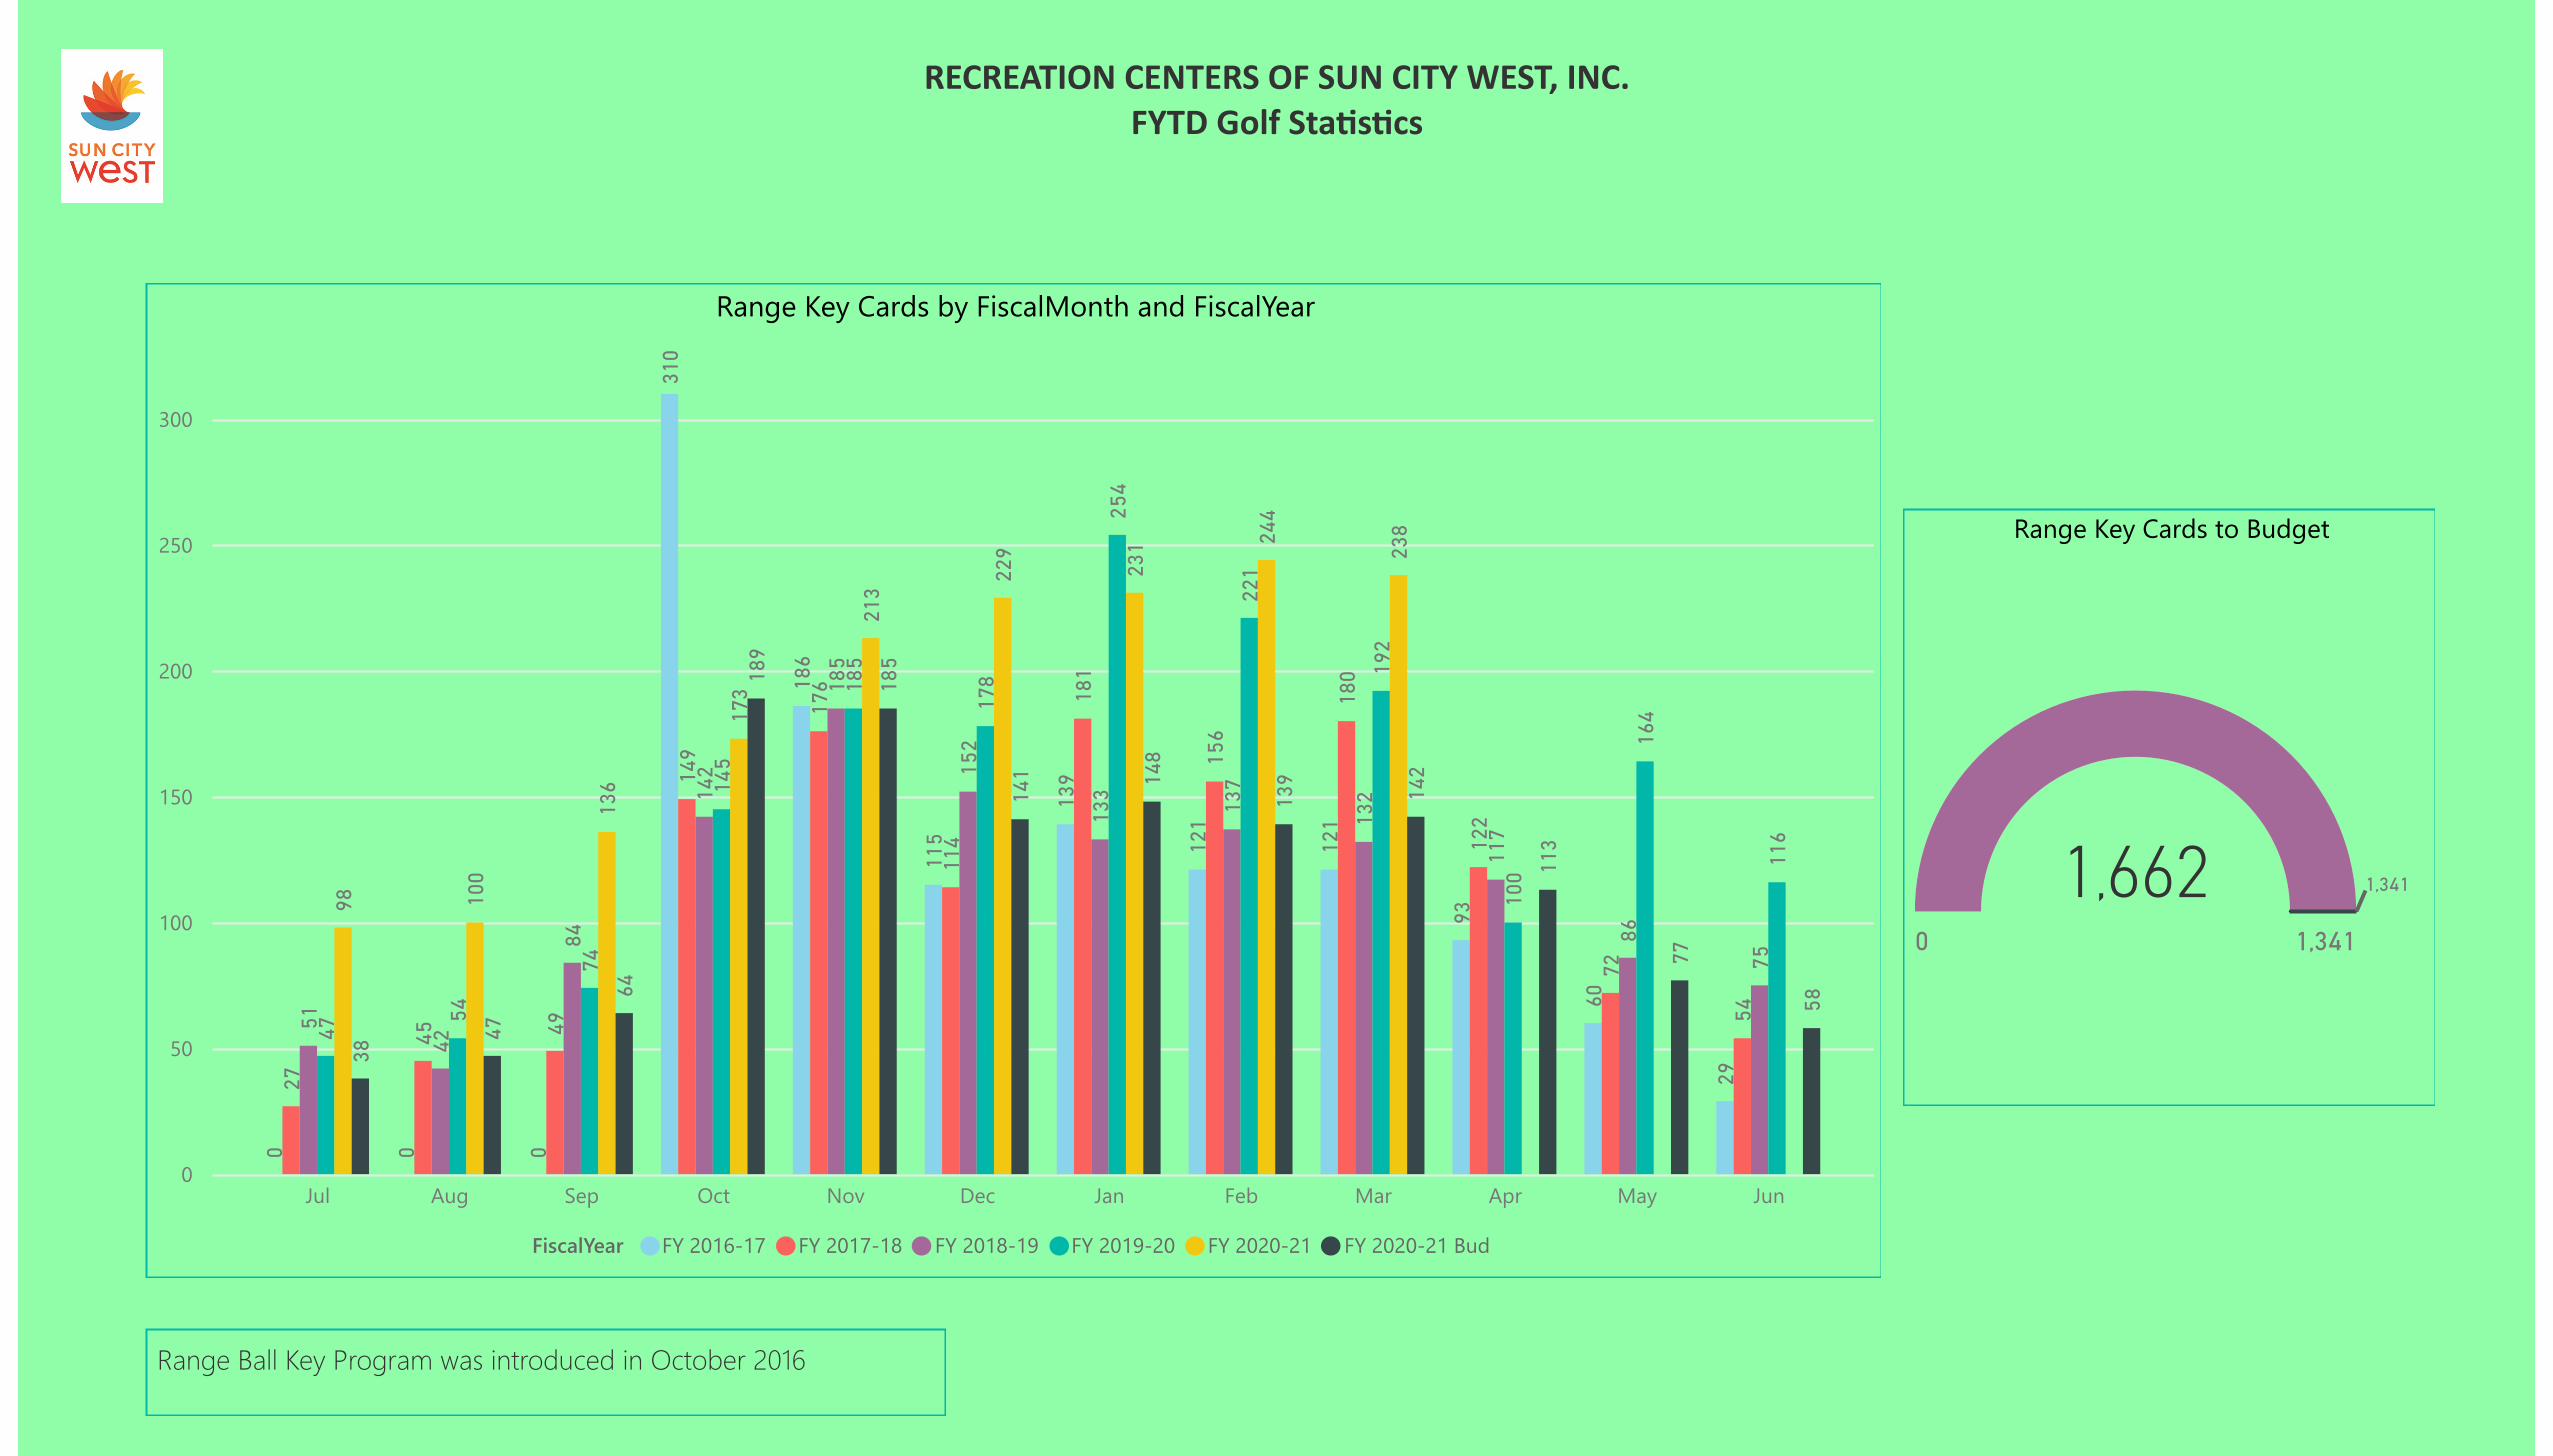
RECREATION CENTERS OF SUN CITY WEST, INC.FYTD Golf Sta�s�cs
Range Key Cards by FiscalMonth and FiscalYear
0
50
100
150
200
250
300
Jul Aug Sep Oct Nov Dec Jan Feb Mar Apr May Jun
0 0 0
310
186
115
139
121
121
93
60
2927
45 49
149
176
114
181
156
180
122
72
5451
42
84
142
185
152
133 137
132
117
86
75
47
54
74
145
185
178
254
221
192
100
164
116
98 100
136
173
213
229
231 24
4
238
38
47
64
189
185
141 148
139
142
113
77
58
FiscalYear FY 2016-17 FY 2017-18 FY 2018-19 FY 2019-20 FY 2020-21 FY 2020-21 Bud
Range Key Cards to Budget
1,341
0 1,341
1,662
Range Ball Key Program was introduced in October 2016
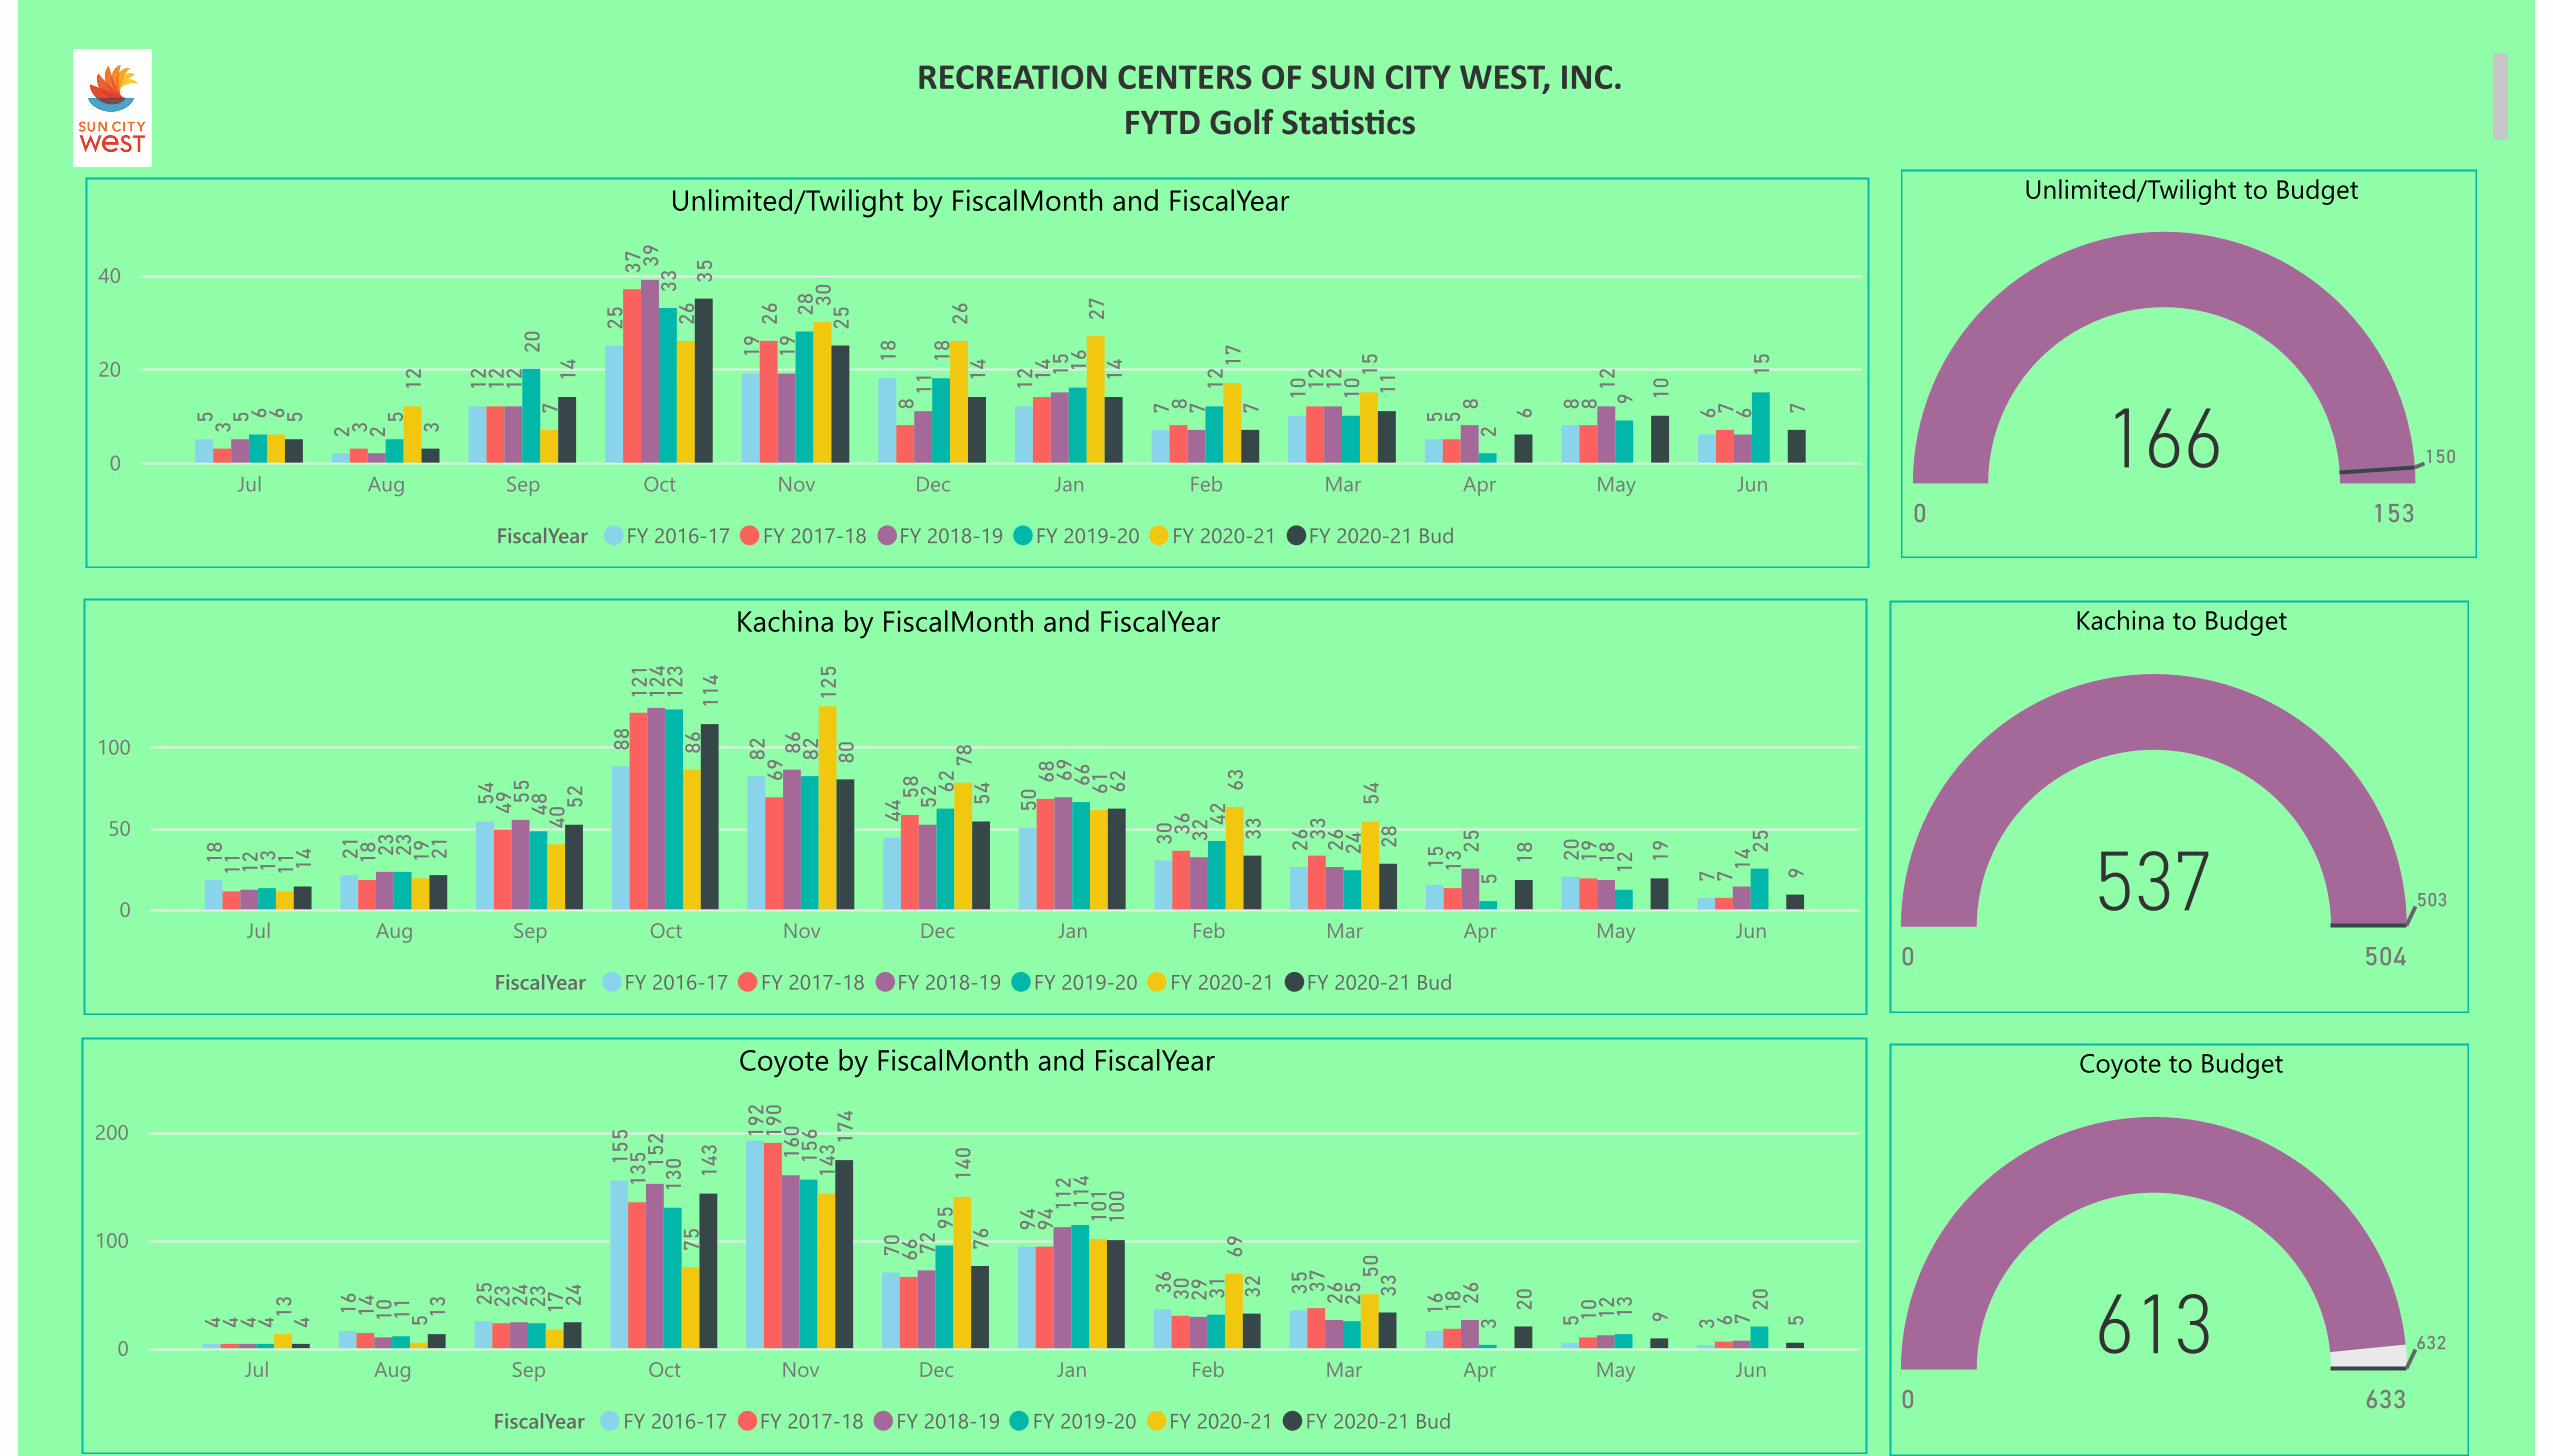
RECREATION CENTERS OF SUN CITY WEST, INC.FYTD Golf Sta�s�cs
Unlimited/Twilight by FiscalMonth and FiscalYear
0
20
40
Jul Aug Sep Oct Nov Dec Jan Feb Mar Apr May Jun
5
2
12
25
19 18
12
7
10
5
8 6
3 3
12
37
26
8
14
8
12
5
8 75
2
12
39
19
11
15
7
12
8
12
66 5
20
33
28
18 16
12 10
2
9
15
6
12
7
26
30
26 27
17 15
5 3
14
35
25
14 14
7
11
6
10
7
FiscalYear FY 2016-17 FY 2017-18 FY 2018-19 FY 2019-20 FY 2020-21 FY 2020-21 Bud
Kachina by FiscalMonth and FiscalYear
0
50
100
Jul Aug Sep Oct Nov Dec Jan Feb Mar Apr May Jun
18 21
54
88 82
44 50
30 26
15 20
711 18
49
121
69
58
68
36 33
13 19
712
23
55
124
86
52
69
32 26 25 18 1413
23
48
123
82
62 66
42
24
5 12
25
11 19
40
86
125
78
61 63
54
14 21
52
114
80
54 62
33 28
18 19
9
FiscalYear FY 2016-17 FY 2017-18 FY 2018-19 FY 2019-20 FY 2020-21 FY 2020-21 Bud
Coyote by FiscalMonth and FiscalYear
0
100
200
Jul Aug Sep Oct Nov Dec Jan Feb Mar Apr May Jun
4 16 25
155 19
2
70
94
36 35
16 5 34 14 23
135
190
66
94
30 37
18 10 64 10
24
152
160
72
112
29 26 26
12 74 11 23
130 15
6
95
114
31 25
3 13 2013 5 17
75
143
140
101
69
50
4 13 24
143 17
4
76
100
32 33
20 9 5
FiscalYear FY 2016-17 FY 2017-18 FY 2018-19 FY 2019-20 FY 2020-21 FY 2020-21 Bud
Unlimited/Twilight to Budget
150
0 153
166
Kachina to Budget
503
0 504
537
Coyote to Budget
632
0 633
613