monthly market commentary
TRANSCRIPT

Monthly Market CommentaryAugust 2021
DoubleLine Capital || 333 S. Grand Ave., 18th Floor || Los Angeles, CA 90071 || (213) 633-8200 || doubleline.com
OverviewRisk assets were undeterred by potential volatility in August. The U.S. Treasury yield curve modestly steepened month-over-month (MoM) as yields for the two-year note rose 3 basis points (bps) and the 10-year note rose 9 bps. U.S. equities, as measured by the S&P 500 Index, returned 3.04%, and ended the month near record highs. Market participants looked to the Federal Reserve Bank of Kansas City’s annual Jackson Hole Economic Symposium for clues regarding the central bank’s plans to taper its purchasing program for Treasuries and Agency mortgage-backed securities. Fed Chair Jerome Powell in his speech commended the central bank’s efforts to support the labor market since the outbreak of the pandemic while downplaying inflationary pressures that have been building throughout the year.1 He acknowledged that in regard to the Fed’s dual mandate of price stability and maximum sustainable employment, “substantial further progress” had only been made on price stability, a key criterion for tightening monetary policy. Conversely, the Federal Open Market Committee would like to see labor markets further recover before a change in policy. Powell also set out to clarify in his speech the Fed’s plans by stating, “The timing and pace of the coming reduction in asset purchases will not be intended to carry a direct signal regarding the timing of interest rate liftoff.”
1 “Monetary Policy in the Time of COVID,” Federal Reserve Chair Jerome H. Powell, Aug. 27, 2021.
3.04%1.92% 2.18% 2.63%
-0.19% -0.18% -0.16% -0.30%
0.51% 0.47% 1.03% 0.49%
-0.30%
21.57%
9.73%
16.44%
2.92%
-0.69%-1.43%
-0.31% -0.22%
4.55%3.76%
0.08%
2.99%
23.01%
-5%
0%
5%
10%
15%
20%
25% August 2021 Year-to-Date
Source: Bloomberg, DoubleLine
August and 2021 Year-to-Date Performance of Asset Classes | As of August 31, 2021

Monthly Market CommentaryAugust 2021
2
Overview (cont’d)
On the fiscal policy front, the U.S. Senate passed a $1 trillion bipartisan infrastructure bill on Aug. 10, which includes provisions for electrical grid updates, broadband investment, water systems, storage expansion, and passenger and freight rail.2 The bill faces an uncertain path in the House of Representatives, as progressive Democrats intend to tie the bill’s future to a broader $3.5 trillion budget resolution.
COVID-19 cases rose sharply in August fueled by the Delta variant despite the U.S. reaching the milestone of half its population being fully vaccinated. By month-end, the seven-day moving average of cases reached 150,000 nationwide, with some states, including Florida, Tennessee, Louisiana and Oregon, experiencing weekly average caseloads above the highs of the winter wave.3
Concerns surrounding the Delta variant and inflation contributed to the Conference Board Consumer Confidence Index declining to 113.8 in August from 125.1 in July. The drop in consumer confidence was also reflected in the August decline of the University of Michigan Consumer Sentiment Index. The Consumer Price Index (CPI) rose 0.5% MoM in July, the latest month for which data was available, and 5.4% year-over-year (YoY). CPI categories that are viewed as experiencing more-transitory inflation factors such as used cars, transportation services and airfares exhibited significant moderation while components such as shelter continued to increase MoM. While the U-3 unemployment rate fell to 5.2% in August from 5.4% in July, nonfarm payroll data showed waning momentum for the labor market. For August, seasonally adjusted nonfarm payroll employment rose 235,000 versus median market expectations of 733,000, with weak prints from sectors that are more COVID-19 sensitive such as leisure, hospitality and retail.
On the international front, while the Delta variant continued to spread across the globe, the U.K. lifted the last of its domestic COVID-19 restrictions. August’s IHS Markit/CIPS Flash U.K. Composite Purchasing Managers’ Index (PMI) suggested that the U.K. might be past its peak rate of growth, with manufacturing steady at 60.1 while services softened slightly to 55.5 as supply chain and labor constraints continued to limit activity.
Economic data was strong across Europe in August, with the IHS Markit Flash Eurozone Composite PMI printing 61.5 for manufacturing and 59.5 for services, and the eurozone’s Harmonized Index of Consumer Prices coming in at 3.0% YoY. Similar to the U.S., the spread of the Delta variant impacted consumer confidence. However, Europe has over 70% of its population vaccinated, and hospitalization rates have remained much lower than previous waves. In Asia, a tougher stance from Chinese regulators and virus concerns led to increased volatility at the beginning of the month, but an eventual rebound led to a 2.6% return in August for emerging market equities, as measured by the Morgan Stanley Capital International Emerging Markets Index.
Moving into the remainder of the year, risk appetite could be driven by global economies’ ability to navigate potential new waves of COVID-19, changes to monetary policy and historically high valuations of risk assets. As risk asset returns have generally climbed this summer, seasonality could also be a factor, possibly leading to increased volatility as the seasonal doldrums end.
2 "The Senate Approves the $1 Trillion Bipartisan Bill in a Historic Vote,” NPR.com, Aug. 10, 20213 COVID Data Tracker. Centers for Disease Control and Prevention. https://covid.cdc.gov/covid-data-tracker/

Monthly Market CommentaryAugust 2021
3
U.S. Government SecuritiesAugust was a quiet month in the U.S. Treasury market. Yields rose modestly as the 10-year yield broke out of a decline that began in May. Intermediate-maturity issues moved the most, with the five-, seven- and 10-year yields rising 9 basis points. As in April and May, the market moved into wait-and-see mode. Realized and implied volatility decreased in August, with yields trading in a narrowing range as the month progressed.
U.S. Treasury Yield Curve
7/30/2021 8/31/2021 Change3 Months 0.04% 0.04% 0.00%6 Months 0.05% 0.05% 0.00%1 Year 0.06% 0.06% 0.00%2 Years 0.18% 0.21% 0.03%3 Years 0.34% 0.40% 0.06%5 Years 0.69% 0.78% 0.09%10 Years 1.22% 1.31% 0.09%30 Years 1.89% 1.93% 0.04%
Source: Bloomberg
Uncertainty about a labor market recovery, the resolution of supply chain disruptions and the course of the pandemic kept position-taking in check. Many real money accounts remained short of their benchmark durations. The slow-moving wave of short covering that aided the rally in June and July ebbed, with many managers still committed to a rising-rate view. The Federal Reserve’s Jackson Hole Economic Symposium in late August deterred further portfolio shifts, as the event ended with little new insight into Fed policy. The exact timing of a Fed taper became less critical with the Treasury’s August refunding announcement, which heralded an imminent start of gradual cuts in auction sizes on the heels of the end of most emergency pandemic programs.
Inflation expectations were unchanged to moderately lower in August, with investors oddly sanguine about future inflation despite recent surges in almost all metrics. The two-year breakeven inflation rate fell from 2.83% at the end of July to a low of 2.37% in mid-August before ending the month at 2.54%. Five- and 10-year breakevens declined modestly across the month while the 30-year breakeven barely budged.
The Bloomberg US Treasury Index returned negative 0.17% for the month, bringing the year-to-date (YTD) return to negative 1.43%. The Bloomberg US Long Treasury Index returned negative 0.21% for the month and negative 4.77% YTD. The Bloomberg US Treasury Inflation-Protected Securities Index returned negative 0.18% for the month and 4.16% YTD.
Even allowing for increased uncertainty in the outlook, we view the current low levels of real and nominal yields as not reflective of economic fundamentals. Most indicators should support somewhat higher rates through the remainder of year, but with the clear possibility rates will remain range-bound near current levels.
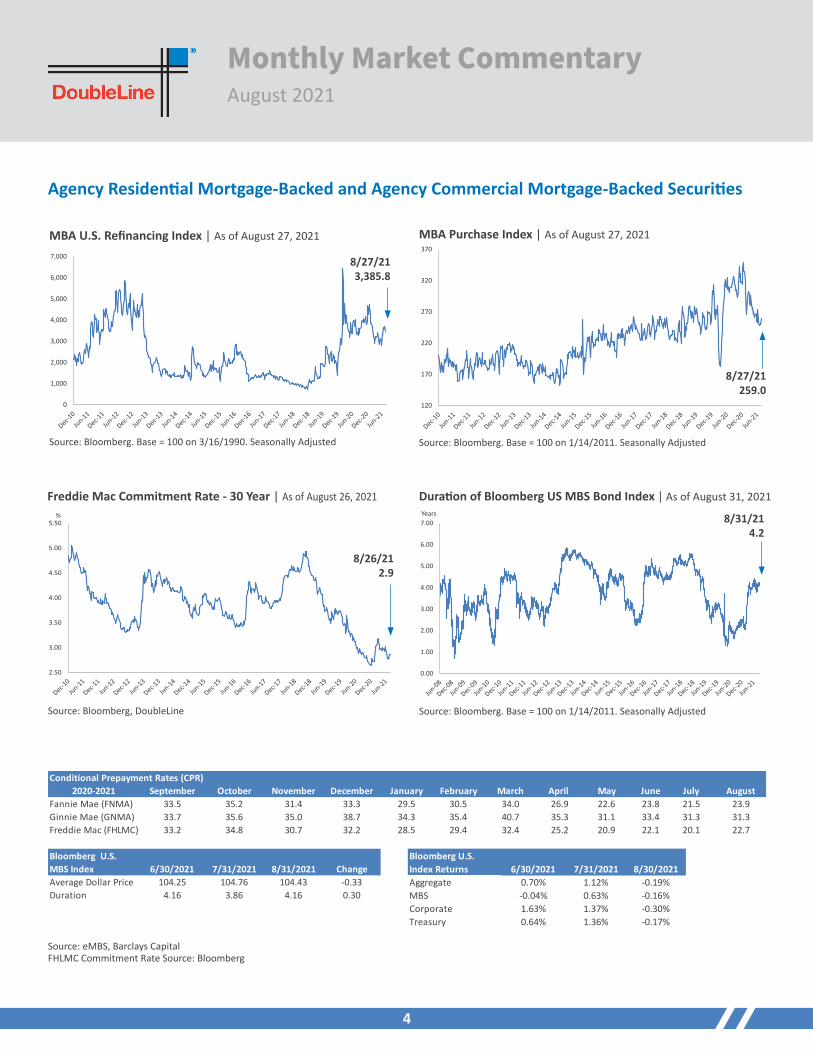
Agency Residential Mortgage-Backed and Agency Commercial Mortgage-Backed SecuritiesThe Agency mortgage market marked an expected pickup in prepayment speeds in August, driven by a higher day count and persistently low mortgage rates. Thirty-year Fannie Mae prepays increased month-over-month (MoM) to 23.9 Constant Prepayment Rate (CPR) from 21.5 CPR, 30-year Freddie Mac prepays increased to 22.7 CPR from 20.1 CPR, and 30-year Ginnie Mae II prepays remained steady at 31.3 CPR. Mortgage rates in July experienced a decline of roughly 20 basis points (bps), but the effects of this rally did not fully materialize until August with some residual effects possible in September.
The Freddie Mac U.S. Mortgage Market Survey 30-Year Homeowner Commitment National Index kept relatively stable at around 2.85% across August, ending the month at 2.87%. As of month-end, 60% of the 30-year conventional universe had an incentive of at least 50 bps to refinance at a 2.75% mortgage rate. This was a sharp decline from the beginning of the year, when, at the same mortgage rate, around 80% of the universe had a refi incentive of 50 bps. In the same eight-month period, total origination capacity in the mortgage industry increased around 5%.
Aggregate rates for 30-day-plus delinquencies for Agency residential mortgage-backed securities (RMBS) continued to decline in August. The rate for 30-year Freddie Mac loans decreased MoM to 1.83% from 1.95% while the rate for 30-year Fannie Mae loans decreased to 2.16% from 2.25%. One development with potentially negative implications for delinquencies is Hurricane Ida, which swept through Louisiana, Mississippi and Alabama at the end of the month causing widespread property destruction and power outages. As many homeowners tend to make their mortgage payment toward month’s end, impact from the hurricane was slightly evident in the latest delinquency data. Although the difference might not be very large now, we should prepare to see divergence in the rates for 30-day-plus delinquencies between the Ida-impacted states and other states.
Monthly Market CommentaryAugust 2021
4
Agency Residential Mortgage-Backed and Agency Commercial Mortgage-Backed Securities
120
170
220
270
320
370
Mortgage Bankers Association Purchase Index
0
1,000
2,000
3,000
4,000
5,000
6,000
7,000
Mortgage Bankers Association Refi Index
MBA U.S. Refinancing Index | As of August 27, 2021
Source: Bloomberg. Base = 100 on 3/16/1990. Seasonally Adjusted
8/27/21 3,385.8
MBA Purchase Index | As of August 27, 2021
8/27/21 259.0
Source: Bloomberg. Base = 100 on 1/14/2011. Seasonally Adjusted
0.00
1.00
2.00
3.00
4.00
5.00
6.00
7.00Years
Duration of Barclays US MBS Bond Index
2.50
3.00
3.50
4.00
4.50
5.00
5.50%
Freddie Mac Commitment Rate - 30 YearDuration of Bloomberg US MBS Bond Index | As of August 31, 2021
Source: Bloomberg. Base = 100 on 1/14/2011. Seasonally Adjusted
8/31/21 4.2
Freddie Mac Commitment Rate - 30 Year | As of August 26, 2021
8/26/21 2.9
Source: Bloomberg, DoubleLine
Source: eMBS, Barclays Capital FHLMC Commitment Rate Source: Bloomberg
Conditional Prepayment Rates (CPR)2020-2021 September October November December January February March April May June July August
Fannie Mae (FNMA) 33.5 35.2 31.4 33.3 29.5 30.5 34.0 26.9 22.6 23.8 21.5 23.9Ginnie Mae (GNMA) 33.7 35.6 35.0 38.7 34.3 35.4 40.7 35.3 31.1 33.4 31.3 31.3Freddie Mac (FHLMC) 33.2 34.8 30.7 32.2 28.5 29.4 32.4 25.2 20.9 22.1 20.1 22.7
Bloomberg U.S. MBS Index 6/30/2021 7/31/2021 8/31/2021 ChangeAverage Dollar Price 104.25 104.76 104.43 -0.33Duration 4.16 3.86 4.16 0.30
Bloomberg U.S. Index Returns 6/30/2021 7/31/2021 8/30/2021Aggregate 0.70% 1.12% -0.19%MBS -0.04% 0.63% -0.16%Corporate 1.63% 1.37% -0.30%Treasury 0.64% 1.36% -0.17%

Monthly Market CommentaryAugust 2021
5
Agency Residential Mortgage-Backed and Agency Commercial Mortgage-Backed Securities (cont'd)August’s gross issuance of Agency RMBS was roughly $283 billion, up from July’s roughly $250 billion. Net issuance also increased MoM, going to $68 billion from $53 billion, driven in large part by Freddie Mac issuance. Gross issuance for Agency commercial mortgage-backed securities (CMBS) came in slightly lower MoM at roughly $11.4 billion versus $11.6 billion.
Agency CMBS and Agency RMBS spreads remained unchanged to slightly tighter in August, with Agency RMBS retracing its recent widening toward the end of the month. Agency RMBS posted a negative return but outperformed U.S. Treasuries as measured by the Bloomberg US Treasury Index and corporate credit as measured by the Bloomberg US Credit Index. The Bloomberg US Mortgage-Backed Securities Index returned negative 0.16%, and the index’s duration increased MoM to 4.16 years from 3.86 years.
Non-Agency Residential Mortgage-Backed SecuritiesNon-Agency residential mortgage-backed securities (RMBS)performed positively in August, according to Citi Research, despite rising U.S. Treasury yields and spreads remaining unchanged. The mortgage forbearance rate for private-label RMBS fell by 40 basis points to finish the month at 4.0%, according to real estate lending data firm Black Knight.
New issuance totaled $13.1 billion, up from $10.3 billion in July, according to Bloomberg. Prime collateral comprised the largest segment at 27% of August’s new-issue volume, followed by Agency-eligible collateral and single-family rental deals.
Home prices in June, the most recent reading available for the S&P CoreLogic Case-Shiller home price series, were up 2% month-over-month (MoM) and 19.1% year-over-year (YoY), as measured by that series’ 20-City Composite Home Price NSA Index. Existing-home sales increased for the second straight month in July, rising 2.0%, the most recent month for which data was available as measured by the National Association of Realtors Existing-Home Sales Report. Starting in February, the monthly mortgage payment on the median-priced home has risen approximately $250, a 24% increase in five months. The increase in home prices along with the rising cost of affordability has torpedoed consumer interest in purchasing a home, with that interest reaching its lowest point in July since the early 1980s, according to data from the University of Michigan and Morgan Stanley Research. The supply of new homes was firmly positive on a YoY basis in July, per data from the National Association of Realtors and Morgan Stanley Research, while existing inventory was down around 12.0% YoY.
Non-Agency Commercial Mortgage-Backed SecuritiesThe new-issue non-Agency commercial mortgage-backed securities (CMBS) market priced $5.5 billion of deals in August: one conduit deal totaling $1.4 billion, seven single asset, single borrower deals totaling $3.3 billion, one commercial real estate (CRE) collateralized loan obligation totaling $653 million and one small-balance commercial deal totaling $195 million. Demand remained robust throughout the month, with many deals multiple times oversubscribed and heavily tested across the capital stack. While the outstanding private-label CMBS universe decreased to $637.7 billion in August, the universe remained up 9.09% YoY.
Investors are expecting a busy third quarter, with as many as 29 deals totaling $25.5 billion expected to come to market through the end of November. As a further sign of strength, the Mortgage Bankers Association released data in August indicating commercial loan originations more than doubled in the second quarter year-over-year (YoY), with life insurance companies posting a notable uptick in originations.
CRE prices continued to post normalized growth in July, the latest month for which data was available, with the RCA U.S. All-Property Commercial Property Price Index gaining 1.20% month-over-month (MoM) and 11.78% YoY. This was the largest MoM increase since October 2005 and the largest YoY increase since June 2006. Apartment property prices surged, gaining 1.57% MoM and 13.52% YoY. The industrial sector remained one of the most stable of the national property types, gaining 0.89% MoM and 9.10% YoY. The retail sector was a strong performer, with prices up 1.18% MoM and 7.48% YoY. The suburban office sector gained 1.28% MoM and 11.69% YoY while its central business office counterpart fell 0.12% MoM and 4.62% YoY. CRE transaction volume declined to $38.8 billion, down 43% MoM but up 74% YoY. While all major sectors saw lower transaction volume MoM, the largest decline occurred in the hotel sector, which posted $2.4 billion in transactions, down 78% MoM but up 252% YoY.
Monthly Market CommentaryAugust 2021
6
Non-Agency Commercial Mortgage-Backed Securities (cont’d)
Non-Agency CMBS secondary market spreads were mixed in August despite relative strength in the new-issue market. AAA last cash flows (LCFs) tightened by 1 basis point (bp) to swaps +67 bps and BBB- spreads widened by 28 bps to swaps +295 bps. While subordinate spreads were wider on the month in aggregate, attributed to intramonth volatility associated with the Delta variant and slowing trade volume heading into the end of the summer, higher-quality risk remained well bid throughout the month. Lower-quality risk and CMBX Index spreads moved wider on idiosyncratic credit events while CMBX spreads were also impacted by macro risks associated with the Delta variant. With subdued trade volume, investors remained focused on less expensive U.S. dollar-priced paper, seeking convexity plays and compression trades. As a result, CMBX 2012-2018 AAA reference indexes widened by 1 bp and BBB- reference indexes widened by 66 bps.
Delinquencies among CMBS loans continued to stabilize, with the 30-day-plus delinquency rate falling 47 bps to 5.64%, the 14th consecutive month of decline. The percentage of loans considered seriously delinquent (60 days or longer, in foreclosure, real estate owned or non-performing) fell to 5.23%, down 37 bps from July, and the special servicing rate fell 35 bps to 7.79%. Loans in the grace period but less than 30 days delinquent decreased 51 bps to 2.42%.
Asset-Backed SecuritiesReturns for asset-backed securities (ABS) were roughly flat in August, as sector spreads remained unchanged and front-end yield curve movements were minimal. The broader market for investment grade assets lost 0.19% on the month, as measured by the Bloomberg US Aggregate Bond Index, as seven- and 10-year U.S. Treasury yields rose 9 basis points. By comparison, the Bloomberg US Asset-Backed Securities Index lost 0.01% while the ICE Bank of America U.S. Fixed-Rate Miscellaneous ABS Index gained 0.02%.
Throughout the month, fixed income investors wrestled with forecasts for when the Federal Reserve will begin tapering its asset purchases, but the ABS market progressed relatively unscathed as it was never a major beneficiary of the Fed’s open market operations.
Despite what is typically a slow summer month for ABS issuance, the primary markets remained relatively active as 26 transactions priced for $20 billion in gross issuance. This brought the 2021 year-to-date total to about $187 billion, well above the comparable period in 2020.
Investment Grade CreditU.S. investment grade (IG) credit experienced low volatility in August. U.S. IG credit spreads, as measured by the Bloomberg US Credit Index, widened by 1 basis point (bp) to 82 bps, with zero excess return versus duration-matched U.S. Treasuries. The index’s return was negative 0.24%, as Treasury yields moved modestly higher for the month, with the five- and 10-year Treasuries up 9 bps and the 30-year up 4 bps.
Returns continued to be driven by moves in the Treasury market. Therefore, short-duration credit outperformed the index, posting a return of 0.03%, as did intermediate-duration credit with negative 0.16%. Long-duration credit returned negative 0.37%. At the ratings level, bonds rated AAA outperformed, posting a return of negative 0.14%, as did bonds rated BBB with negative 0.21%. Bonds rated AA returned negative 0.25% while bonds rated A returned negative 0.29%.
Cyclical and defensive names outperformed. The best-performing sectors were sovereigns, packaging, supermarkets, airlines and financial (other). Energy-related sectors underperformed, hit by the decline in crude oil prices. The worst performers were utility (other), refining, electric, oil field services and railroads.
U.S. dollar-denominated IG new issuance was weaker than in recent months, with $88.3 billion of gross issuance and $17.8 billion of net issuance, according to Barclays. On a gross issuance basis, the August print was the first sub-$100 billion month in 2021. IG fund flows remained robust, with inflows of $22.9 billion for August, according to data from financial data firm EPFR Global as reported by Wells Fargo.

Monthly Market CommentaryAugust 2021
7
Investment Grade Credit (cont’d)
Collateralized Loan ObligationsAugust was a banner month for the primary market for U.S. collateralized loan obligations (CLOs) as 35 deals posted a record $19.2 billion. New issuance for the year remains on a historic pace, with $111.6 billion in issuance across 226 deals so far. The record for annual issuance is 2018’s $128.9 billion. CLO refinancing (refi) and reset volumes are also on pace for a record year after 10 refi transactions and 18 resets were priced in August.
In the secondary market, trading volumes remained muted relative to the first half of 2021. Investment grade (IG) trading volume rose 11% in August to $8.8 billion while below-IG volume was flat at $3.6 billion, per Trade Reporting and Compliance Engine data. The volume of global bids wanted in competition dropped 32% to $1.8 billion.
Fundamentals mostly improved in August, with average weighted average rating factors moving lower, junior overcollateralization cushions increasing and equity net asset values improving. The last 12-month U.S. leveraged loan default rate by principal amount ended August at 0.47%, a drop of 11 basis points month-over-month and the lowest reading since March 2012. The percentage of assets in CLOs trading below the warning metric of $90 remained low in August at less than 3%.
CLO spreads finished modestly wider, driven in part by an influx of supply that priced throughout the month. The J.P. Morgan Collateralized Loan Obligation Total Return Index gained 0.19%, bringing the year-to-date return to 1.90%.
0
50
100
150
200
250
Billi
ons o
f U.S
. Dol
lars
Total Fixed-Rate Investment Grade Supply
-3.0%
-2.0%
-1.0%
0.0%
1.0%
2.0%
3.0%
4.0%
5.0%
Performance of Select Barclays Indices Last 12 Months
U.S. High YieldU.S. CreditU.S. Aggregate
Performance of Select Bloomberg Indexes Last 12 Months
Total Fixed-Rate Investment Grade Supply As of August 31, 2021
Source: Barclays Live
CLO New Issuance | September 2012 to August 2021
Last 12 Months Issuance | September 2020 to August 2021
Source: Bloomberg, DoubleLine
0510152025303540
$0
$5
$10
$15
$20
$25$ Billions
CLO New Issuance
Volume ($B) Count
0510152025303540
$0
$5
$10
$15
$20
$25$ Billions
Last 12 Months Issuance
Volume ($B) Count

Monthly Market CommentaryAugust 2021
8
Bank LoansAfter a lackluster July, the bank loan market rallied in August, as strong demand for collateralized loan obligations (CLOs) and a late-summer lull in new issuance created a positive technical outlook at month-end. Bank loans returned 0.47%, as measured by the S&P/LSTA Leveraged Loan Index, bringing the year-to-date return to 3.76%. Beyond the positive technical outlook, bank loans also benefited from a strong tone in risk markets generally, with the S&P 500 Index rising 3.04%. The weighted average bid price of the leveraged loan index rose 21 basis points (bps) to $98.25, with outperformance from lower-rated loans. Loans rated CCC rose 0.95%, followed by loans rated B, up 0.45%, and loans rated BB, up 0.41%.
The default backdrop has remained benign. The trailing 12-month principal default rate fell to 0.47% at month-end, the lowest level in over nine years. There was one new default in August after five months with no defaults. Second quarter earnings broadly exceeded expectations, leading to a sharp drop in the average trailing 12-month leverage of the market.
The primary market met strong investor demand in August, with a record-setting pace of CLO new issuance as 35 deals priced for a total deal volume of $19.2 billion. Retail inflows continued apace: Financial data firm Leveraged Commentary & Data estimated that retail loan funds took in $2.2 billion. On the supply side, after record-breaking merger and acquisition deal volume in June and July, M&A new issuance slowed in August, particularly in the latter half of the month. The constructive technical picture was supportive of market prices.
The bank loan market ended August with a yield to maturity of 4.27% for the S&P/LSTA Leveraged Loan Index and a discounted spread to maturity of LIBOR +405 bps. With increased talk about the timing of the Federal Reserve tapering asset purchases, bank loans offer reasonable interest income and remain an attractive asset class to position for higher interest rates.
High YieldHigh yield (HY) corporate bonds returned 0.51% in August, as measured by the Bloomberg US Corporate High Yield Index. The index yield fell 1 basis point (bp) to 3.87% while the spread contracted 6 bps to 288 bps.
Bonds rated BB modestly outperformed the index, increasing 0.56%. Bonds rated CCC followed, up 0.49%, and bonds rated B returned 0.41%. The three best-performing sectors were independent energy (+1.33%), construction machinery (+1.06%) and media entertainment (+0.89%). The worst performers were electric utility (-0.04%), wirelines (+0.02%) and finance companies (+0.05%).
There were no HY defaults in August, as reported by J.P. Morgan, and the par-weighted, 12-month default rate declined to 1.06%, as compared to 6.17% at the end of 2020. Year-to-date (YTD), only seven HY companies have defaulted for a total of $4.1 billion in bonds. The current HY default rate compares to a 20-year average of 3.04%.
The August upgrade-to-downgrade ratio was 5.9x after the month posted $112.8 billion of upgrades (the second highest monthly upgrade volume on record) versus $19.2 billion of downgrades, as reported by J.P. Morgan, bringing the YTD mark to 3.1x on $466.6 billion of upgrades against $151.0 billion of downgrades. August activity for rising stars and fallen angels picked up, with $6.7 billion of rising stars compared to $1.9 billion of fallen angels, as reported by J.P. Morgan, bringing the YTD totals to $26.2 billion of rising stars compared to $7.0 billion of fallen angels. 2020 registered the all-time record for fallen angels of $237.5 billion.
HY issuance declined seasonally in August, with $34.4 billion pricing, though this still exceeded the average issuance of $21.1 billion for the month since 2010. YTD, total issuance was up 22% to $364.3 billion, and refinancing volume was up 27% to $238.1 billion. 2020’s total issuance was up 57% year-over-year to $449.9 billion, surpassing the record high of $398.5 billion in 2013.
The HY sector reported an inflow of $344.1 million in August, according to Lipper data as reported by J.P. Morgan, just the second inflow of 2021. This brought YTD outflows to $14.0 billion. 2020 inflow totaled $44.8 billion, compared to an inflow of $18.8 billion in 2019.

Monthly Market CommentaryAugust 2021
9
CommoditiesThe broad commodity market edged lower in August, with the Bloomberg Commodity Index down 0.30% and the energy-heavy S&P GSCI down 2.31%.
Energy was the weakest-performing sector, falling 4.11%, with Brent crude down 4.47% and WTI crude down 7.10%. Natural gas, up 11.44%, was the lone winner across the sector. Industrial metals edged up 0.21% with dispersed performance as aluminum rose 4.51% while copper declined 2.10% and nickel was flat.
Precious metals dipped 0.63% as gold inched up 0.05% while silver dropped 6.24%. The agriculture sector (+0.28%) was a mixed bag, with soybeans (-4.21%) and corn (-2.97%) declining while sugar (+10.78%), coffee (+7.28%), Kansas wheat (+4.03%) and wheat (+0.84%) were up.
Emerging Markets Fixed IncomeEmerging markets (EM) sovereign external bonds posted positive performance in August, driven primarily by tightening credit spreads and accrued interest. EM corporate external bonds posted a slightly smaller positive performance. The credit spread tightened by 12 basis points (bps) for the J.P. Morgan Emerging Markets Bond Index Global Diversified (EMBI GD), which tracks sovereign bonds, while the credit spread tightened by 14 bps for the J.P. Morgan Corporate Emerging Markets Bond Index Broad Diversified (CEMBI BD), which tracks corporate bonds. The U.S. Treasury yield curve steepened, with the two-year yield up 3 bps and the 10-year yield up 9 bps.
Performance across all regions was positive in both the EMBI GD and CEMBI BD. Africa was the best-performing region in the EMBI GD while Latin America was the best performer in the CEMBI BD. The Middle East was the laggard in both indexes. The EMBI GD slightly outperformed the CEMBI BD. The high yield subindex outperformed the investment grade subindex in both indexes.
In our view, risk appetite for the remainder of 2021 will continue to be driven by the spread of coronavirus variants as well as the global availability and deployment of vaccines. Other factors could include rising geopolitical tensions, falling global growth expectations, increasing Treasury yields and inflation expectations, the potential tapering of monetary accommodation by global central banks and sentiment for risk assets, which as of this writing was generally near all-time highs.
International SovereignGlobal government bonds, as measured by the FTSE World Government Bond Index, posted negative performance in August, driven by foreign currency losses against the U.S. dollar and a rise in global rates.
The U.S. dollar, as measured by the U.S. Dollar Index (DXY), strengthened against most of its G-10 peers amid a backdrop of mixed risk sentiment. Investors weighed concerns about a potential slowdown in U.S. economic growth amid a resurgence in COVID-19 cases and the impact the slowdown might have on monetary stimulus. Monetary policy was in the spotlight in the face of elevated inflation, a better than expected June payroll report and the release of Federal Open Market Committee meeting minutes indicating that a decision to start tapering the Federal Reserve’s bond- and mortgage-buying program could come by year-end. In his much anticipated Jackson Hole Economic Symposium speech in August, Fed Chair Jerome H. Powell signaled that the withdrawal of stimulus would be gradual and there would be no rush to begin raising interest rates. While this dovish tilt helped the dollar retrace some of its prior gains, the DXY posted a positive return for the month.
-4%
-3%
-2%
-1%
0%
1%
2%
3%
4%
5%
6%
JP Morgan Emerging Markets Bond Index PerformanceLast 12 Months
JPM Emerging Markets Bond Global Diversified Index (EMBI)
JPM Corporate Emerging Markets Bond Broad Diversified Index (CEMBI)
JPM Government Bond Emerging Markets Global Diversified Index (GBI-EM)
J.P. Morgan Emerging Markets Bond Index Performance September 30, 2020 to August 31, 2021
Source: J.P. Morgan

Monthly Market CommentaryAugust 2021
10
International Sovereign (cont’d)
The euro weakened against the dollar, as data showed eurozone business activity expanding despite concerns about the Delta variant. The IHS Markit Flash Eurozone Composite Purchasing Managers’ Index eased to 59.5 in August from 60.2 in July, mainly driven by a lower reading in the manufacturing sector. The number was still indicative of a strong overall rate of expansion. Meanwhile, the eurozone’s Harmonized Index of Consumer Prices exceeded expectations, coming in at 3% year-over-year in August. This print drove speculation that the European Central Bank might start to slow its bond-buying program amid the strong economic rebound. Despite these seemingly euro-positive events, it was the dollar’s performance that drove the negative return for the euro.
The Japanese yen weakened slightly versus the dollar over the month amid concerns that a surge in virus cases in Japan could weigh on the country’s economic recovery after the government extended emergency restrictions to at least early September. After contracting in the first quarter, the economy registered a relatively weak growth rebound of 1.3% quarter-over-quarter annualized in preliminary GDP data in the second quarter, which experienced a sharp rise in virus cases. Economists warned of a risk of contraction in the third quarter.
InfrastructureThe infrastructure debt market generated slightly negative returns in August, marking its first monthly decline since March. Performance was roughly in line with the Bloomberg US Aggregate Bond Index, which lost 0.19%, and slightly ahead of the Bloomberg US Corporate Bond Index, which lost 0.30%. The primary driver of performance was duration, as seven- and 10-year U.S. Treasury yields rose 9 basis points, and credit spreads were broadly unchanged. Infrastructure assets at the five-to-seven-year portion of the yield curve, such as solar and telecom asset-backed securities (ABS), experienced the largest declines while lower-duration sectors with high levels of interest income, such as aircraft ABS, were still able to generate slightly positive returns.
On the fiscal policy side, the U.S. Senate passed a $1 trillion infrastructure spending bill on Aug. 10 with bipartisan support. As of month-end, the legislation remained in limbo in the House, where Democratic lawmakers vowed to vote on it no later than Sept. 27. The bill prioritizes clean energy infrastructure, which could serve as a nice tailwind for infrastructure debt investing as a whole.
U.S. Equities The large-cap U.S. equity market continued to surge in August, with the S&P 500 Index up 3.04% and the Dow Jones Industrial Average up 1.50%. The strongest-performing sectors were financials (+5.14%), utilities (+3.98%) and communication services (+3.90%). The laggards were energy (-1.92%), industrials (+1.15%) and consumer staples (+1.17%). Small-cap stocks, as tracked by the Russell 2000 Index, increased 2.23%. Value stocks, as measured by the Russell 1000 Value Index, were up 1.98%.
Global EquitiesGlobal equities delivered another positive monthly performance in August, with the Morgan Stanley Capital International (MSCI) All Country World Index up 2.54%. U.S. equities slightly outperformed the global index, with the S&P 500 Index up 3.04% and the Nasdaq Composite Index up 4.09%. The Dow Jones Industrial Average rose 1.50% while the Russell 2000 Index, which tracks small caps, was up 2.23%.
European equities performed in line with the broader market, with the Euro Stoxx 50 Index rising 2.63%. The DAX of German blue chips was up 1.87% while the French CAC 40 rose 1.02%. On the periphery, Italian stocks rose 2.55%, as measured by the FTSE Milano Indice di Borsa, while Spain’s IBEX was up 1.99%. U.K. equities rose 2.06%, as measured by the FTSE 100 Index.
Asian equities also mostly performed in line with the broader market. Japanese equities rose 3.00%, as measured by the Nikkei. As measured by the Shanghai Stock Exchange Composite Index, Chinese equities were up 4.43% while Hong Kong’s Hang Seng Index was down 0.05%. South Korea’s KOSPI was down 0.10% while Taiwan’s TAIEX rose 2.26%.
Emerging markets equities followed in line with the broader market, with the MSCI Emerging Markets Index up 2.63%. Brazil’s Ibovespa was down 2.48% while Chilean equities rose 4.72%, as measured by MSCI Chile. Russian equities were up 3.58%, as measured by MSCI Russia.

11
Basis Points (BPS) – Basis points (or basis point (bp)) refer to a common unit of measure for interest rates and other percentages in finance. One basis point is equal to 1/100th of 1%, or 0.01% or 0.0001, and is used to denote the percentage change in a financial instrument. The relationship between percentage changes and basis points can be summarized as: 1% change = 100 basis points; 0.01% = 1 basis point.
Below Investment Grade/Non-Investment Grade – Term indicating a security is rated below investment grade (IG). These securities are seen as having higher default risk or being prone to other adverse credit events. They typically pay higher yields than higher-quality bonds in order to make them attractive. They are less likely than IG bonds to pay back 100 cents on the dollar.
Bid Wanted in Competition (BWIC) – Formal request for bids on a package of securities that is submitted by an institutional investor to a number of securities dealers. The dealers are being invited to submit bids on the listed securities.
Bloomberg US Aggregate Bond Index – This index, known as “the Agg,” represents securities that are SEC registered, taxable and dollar denominated. It covers the U.S. investment grade, fixed-rate bond market, with components for government and corporate securities, mortgage pass-through securities and asset-backed securities. These major sectors are subdivided into more specific indexes that are calculated and reported on a regular basis.
Bloomberg US Asset-Backed Securities (ABS) Index – This index is the ABS component of the Bloomberg US Aggregate Bond Index, a flagship measure of the U.S. investment grade, fixed-rate bond market. The ABS index has three subsectors: credit and credit cards, autos and utility.
Bloomberg US Corporate Bond Index – This index measures the investment grade, fixed-rate taxable corporate bond market. It includes U.S. dollar-denominated securities publicly issued by U.S. and non-U.S. industrial, utility and financial issuers.
Bloomberg US Corporate High Yield (HY) Index – This index measures the U.S. dollar-denominated HY fixed-rate corporate bond market. Securities are classified as HY if the respective middle ratings of Moody’s, Fitch and S&P are Ba1, BB+ or BB+ or below. The Bloomberg US HY Long Index, including bonds with maturities of 10 years or greater, and the Bloomberg US HY Intermediate Index, including bonds with maturities of 1 to 9.999 years, are subindexes of the Bloomberg US Corporate HY Index.
Bloomberg US Credit Index – This index is the U.S. credit component of the Bloomberg US Government/Credit Index. It consists of publicly issued U.S. corporate and specified foreign debentures and secured notes that meet the specified maturity, liquidity and quality requirements. To qualify, bonds must be SEC registered. The US Credit Index is the same as the former Bloomberg US Corporate Index.
Bloomberg US Long Treasury Index – This index includes all publicly issued U.S. Treasury securities that have a remaining maturity of 10 or more years, are rated investment grade, and have $250 million or more of outstanding face value.
Bloomberg US Mortgage-Backed Securities (MBS) Index – This index measures the performance of investment grade, fixed-rate mortgage-backed pass-through securities of the government-sponsored enterprises (GSEs): Federal Home Loan Mortgage Corp. (Freddie Mac), Federal National Mortgage Association (Fannie Mae) and Government National Mortgage Association (Ginnie Mae).
Bloomberg US Treasury Index – This index measures U.S. dollar-denominated, fixed-rate nominal debt issued by the U.S. Treasury with a remaining maturity of one year or more. Treasury bills are excluded by the maturity constraint but are part of a separate Short Treasury Index.
Bloomberg US Treasury Inflation-Protected Securities (TIPS) Index – This index comprises all publicly issued U.S. Treasury inflation-protected securities (TIPS) denominated in U.S. dollars and traded intraday.
Bloomberg Commodity (BCOM) Index – This index is calculated on an excess return basis and reflects the price movements of commodity futures. It rebalances annually, weighted two-thirds by trading volume and one-third by world production, and weight caps are applied at the commodity, sector and group levels for diversification. The roll period typically occurs from the sixth to 10th business day based on the roll schedule.
Brent Crude Oil – Major trading classification of sweet light crude oil that serves as a benchmark price for purchases of oil worldwide. Brent is known as a light, sweet oil because it contains 0.24% sulfur, making it “sweet,” and has a low density, making it “light.”
CMBX Index – This index, or, more accurately, this series of indexes, is designed to reflect the creditworthiness of commercial mortgage-backed securities (CMBS).
Collateralized Loan Obligation (CLO) – Single security backed by a pool of debt.
Conduit Bond – Type of municipal bond sold by a governmental entity for the purpose of making proceeds available to a private entity usually in furtherance of a public purpose. An example would be bonds in connection with nonprofit hospitals or affordable housing.
Conference Board Consumer Confidence Index (CCI) – This index (published the last Tuesday of every month) measures U.S. consumers’ optimism in the economy based on their saving and spending activity.
Constant Prepayment Rate (CPR) – Metric (also known as “Conditional Prepayment Rate”) that indicates a loan prepayment rate at which the outstanding principal of a pool of loans, such as mortgage backed securities (MBS), is paid off. The higher the CPR, the more prepayments are anticipated and thus the lower the duration of the note. This is called “prepayment risk.”
Consumer Price Index (CPI) – This index, compiled by the U.S. Bureau of Labor Statistics, examines the weighted average of the prices of a basket of consumer goods and services, such as transportation, food and medical care. It is calculated by averaging price changes for each item in the basket. Changes in the CPI are used to assess price changes associated with the cost of living. The CPI is one of the most frequently used statistics for identifying periods of inflation or deflation.
Cotation Assistee en Continu (CAC) 40 – This stock market index tracks the 40 largest French stocks based on Euronext Paris market capitalization.
Deutsche Aktien Index (DAX) – This blue-chip stock market index comprises the 30 major German companies trading on the Frankfurt Stock Exchange.
Dow Jones Industrial Average (DJIA) – This index tracks 30 large publicly owned companies trading on the New York Stock Exchange and the Nasdaq.

12
Earnings Per Share – Calculated as a company’s profit divided by the outstanding shares of its common stock. The resulting number serves as an indicator of a company’s profitability.
Euro Stoxx 50 Index – This index of 50 eurozone stocks provides a blue-chip representation of supersector leaders in the eurozone.
Fallen Angel – A bond that was initially given an investment grade rating but has since been reduced to junk-bond status. The downgrade is caused by a deterioration in the financial condition of the issuer.
Fannie Mae (FNMA) – The Federal National Mortgage Association (Fannie Mae) is a government-sponsored enterprise (GSE) chartered by Congress in 1938 during the Depression to stimulate home ownership and provide liquidity to the mortgage market. Its purpose is to help moderate- to low-income borrowers obtain financing for a home.
Federal Open Market Committee (FOMC) – Branch of the Federal Reserve System that determines the direction of monetary policy specifically by directing open market operations. The FOMC comprises the seven board governors and five (out of 12) Federal Reserve Bank presidents.
Freddie Mac (FHLMC) – The Federal Home Loan Mortgage Corp. (Freddie Mac) is a stockholder-owned, government-sponsored enterprise (GSE) chartered by Congress in 1970 to keep money flowing to mortgage lenders in support of homeownership and rental housing for middle-income Americans. Freddie Mac purchases, guarantees and securitizes mortgages to form mortgage-backed securities (MBS).
Freddie Mac U.S. Mortgage Market Survey 30-Year Homeowner Commitment National Index – This index tracks the 30-year, fixed-rate mortgages component of the Freddie Mac Primary Mortgage Market Survey (PMMS).
FTSE Milano Indice di Borsa (FTSE MIB) – This benchmark index for the Borsa Italian, the Italian stock exchange, comprises the 40-most traded stock classes on the exchange.
FTSE 100 Index – This index tracks the 100 companies with the highest market capitalization on the London Stock Exchange.
FTSE World Government Bond Index (WGBI) – This broad index measures the performance of fixed-rate, local-currency, investment grade sovereign bonds. It is a widely used benchmark that comprises sovereign debt from more than 20 countries that is denominated in a variety of currencies.
G-10 (Group of Ten) – The G10 comprises 11 industrialized nations that meet on an annual basis, or more frequently as needed, to consult each other, debate and cooperate on international financial matters. The member countries are: Belgium, Canada, France, Germany, Italy, Japan, the Netherlands, Sweden, Switzerland, the United Kingdom and the United States.
Ginnie Mae (GNMA) – The Government National Mortgage Association (Ginnie Mae) is a federal government corporation that guarantees the timely payment of principal and interest on mortgage-backed securities (MBS) issued by approved lenders. Ginnie Mae’s guarantee allows mortgage lenders to obtain a better price for MBS in the capital markets.
Ginnie Mae II – This class of pass-through investments is issued by the Government National Mortgage Association (GNMA), known as Ginnie Mae, and draws income from pools of Federation Housing Administration and Department of Veterans Affairs mortgages. Ginnie Mae II securities pay principal and interest on the 20th every month (in contrast to the 15th for Ginnie Mae I) and have a maximum maturity of 30 years.
Hang Seng Index – This free-float-capitalization-weighted index tracks a selection of companies on the Stock Exchange of Hong Kong. The index has four subindexes: finance, utilities, properties, finance, and commerce and industry.
Harmonized Index of Consumer Prices (HICP) – This index comprises consumer price indexes produced by each European Union member state to measure inflation and to guide the European Central Bank in formulating monetary policy. Each country’s HICP measures the change over time in the prices of a basket of goods and services acquired, used or paid for by households within that country.
Ibovespa Index – This gross-return index is weighted by trade volume and comprises the most-liquid stocks on Brazil’s Sao Paulo Stock Exchange.
ICE Bank of America (BofA) U.S. Fixed-Rate Asset-Backed Securities (ABS) Index – This index tracks the performance of U.S. dollar-denominated, investment grade (IG), asset-backed securities publicly issued in the U.S. domestic market. Qualifying securities must have an IG rating based on an average of Moody’s, S&P and Fitch.
ICE Bank of America (BofA) U.S. Fixed-Rate Miscellaneous Asset-Backed Securities (ABS) Index – A subset of the ICE BofA U.S. Fixed-Rate ABS Index, including all ABS collateralized by anything other than auto loans, home equity loans, manufactured housing, credit card receivables and utility assets.
IHS Markit/CIPS Flash U.K. Composite Purchasing Managers’ Index (PMI) – This “Flash” index is based on preliminary data compiled from monthly surveys of purchasing executives at over 600 industrial companies. The PMI is based on five individual indexes: new orders (30%), output (25%), employment (20%), suppliers’ delivery times (15%) and stock of items purchased (10%), with the delivery times index inverted to move in a comparable direction. A reading above 50 indicates an expansion of the sector, a reading below 50 represents a contraction, and 50 indicates no change.
IHS Markit Flash Eurozone Composite Purchasing Managers’ Index (PMI) – This index is based on preliminary survey data collected from a representative panel of around 5,000 companies based in the eurozone manufacturing and service sectors. National manufacturing data is included for Germany, France, Italy, Spain, the Netherlands, Austria, the Republic of Ireland and Greece. National services data is included for Germany, France, Italy, Spain and the Republic of Ireland. The “Flash” estimate is typically based on approximately 85% to 90% of total PMI survey responses each month and is designed to provide an accurate advance indication of the final PMI data.
Indice Bursatil Espanol (IBEX) – This official index of the Spanish Continuous Market comprises the 35 most-liquid stocks traded on the market.
J.P. Morgan Collateralized Loan Obligation (CLO) Total Return Index – This index is a total return subindex of the J.P. Morgan Collateralized Loan Obligation Index (CLOIE), which is a market value-weighted index consisting of U.S. dollar-denominated CLOs.

13
J.P. Morgan Corporate Emerging Markets Bond Index Broad Diversified (CEMBI BD) – This index is a uniquely weighted version of the CEMBI, which is a market capitalization-weighted index consisting of U.S. dollar-denominated emerging markets corporate bonds. It limits the weights of index countries with larger debt stocks by only including specified portions of those countries’ eligible current face amounts of debt outstanding.
J.P. Morgan Emerging Markets Bond Index Global Diversified (EMBI GD) – This index is a uniquely weighted version of the EMBI, which tracks emerging markets (EM) bonds and comprises sovereign debt and EM corporate bonds. It limits the weights of index countries with larger debt stocks by only including specified portions of those countries’ eligible current face amounts of debt outstanding.
Korean Composite Stock Price Index (KOSPI) – This index comprises all common stocks traded on the stock market division of the Korea Exchange. It is the representative stock market index in South Korea, like the S&P 500 Index in the U.S.
Last Cash Flow (LCF) – Last revenue stream paid to a bond over a given period.
Morgan Stanley Capital International All Country World Index (MSCI ACWI) – This market capitalization-weighted index is designed to provide a broad measure of stock performance throughout the world. It comprises stocks from 23 developed countries 24 and emerging markets.
Morgan Stanley Capital International (MSCI) Chile Index – This index measures the performance of the large- and midcap segments of the Chilean market. With 16 constituents, the index covers approximately 85% of the Chilean equity universe.
Morgan Stanley Capital International Emerging Markets Index (MSCI EMI) – This index captures large- and midcap representation across 26 emerging markets (EM) countries. With 1,385 constituents, the index covers approximately 85% of the free-float-adjusted market capitalization in each country.
Morgan Stanley Capital International (MSCI) Russia Index – This index measures the performance of the large- and midcap segments of the Russian market. The index covers approximately 85% of the free-float-adjusted market capitalization in Russia.
Nasdaq Composite Index – This index (“the Nasdaq”) comprises the more than 3,000 common stocks and similar securities (e.g., American depository receipts (ADRs), tracking stocks, limited-partnership interests) listed on the Nasdaq exchange. The index, which includes U.S. and non-U.S. companies, is highly followed in the U.S. as an indicator of the stock performance of technology companies and growth companies.
National Association of Realtors Existing-Home Sales Report – This report tracks sales and prices of existing single-family homes for the nation overall, and gives breakdowns for the West, Midwest, South and Northeast regions of the country. These figures include condos and co-ops in addition to single-family homes.
Net Asset Value (NAV) – Net value of an entity calculated as the total value of the entity’s assets minus the total value of its liabilities. Most commonly used in the context of a mutual fund or an exchange-traded fund (ETF), the NAV represents the per share/unit price of the fund at a specific date or time.
Nikkei 225 Index – This price-weighted index (“the Nikkei”) comprises Japan’s top 225 blue-chip companies on the Tokyo Stock Exchange. The Nikkei is equivalent to the Dow Jones Industrial Average Index in the U.S.
Non-Performing Loan (NPL) – Loan in which the borrower is in default due to the fact that they have not made the scheduled payments for a specified period. Although the exact elements of non-performing status can vary depending on the specific loan’s terms, “no payment” is usually defined as zero payments of either principal or interest.
Overcollateralization (OC) – Provision of collateral that is worth more than enough to cover potential losses in cases of default.
Prime – Classification of borrowers, rates or holdings in the lending market that are considered to be of high quality. This classification often refers to loans made to high-quality “prime” borrowers that are offered “prime” or relatively low interest rates.
RCA Commercial Property Price Index (CPPI) – This index describes various nonresidential property types for the U.S. (10 monthly series from 2000). It is a periodic same-property, round-trip investment, price-change index of the U.S. commercial investment property market. The dataset contains 20 monthly indicators.
RCA U.S. All-Property Commercial Property Price Index (CPPI) – This index is a component of the suite of price indexes that comprise the RCA CPPI.
Real Estate Owned (REO) – Property owned by a lender, such as a bank, that has not been successfully sold at a foreclosure auction. A lender – often a bank or quasi-governmental entity such as Fannie Mae or Freddie Mac – takes ownership of a foreclosed property when it fails to sell at the amount sought to cover the loan.
Real Money – Term used in the financial markets to denote a fully funded, long-only traditional asset manager. Real money managers are often referred to as “institutional investors.” The term “real money” means the money is managed on an unlevered basis. This contrasts with hedge funds, which often manage money using borrowed funds or leverage.
Rising Star – Bonds that were considered speculation grade when issued but have since improved their financials, reducing the risk of default. These bonds are now closer to the security of an investment grade bond. So while rising stars are still junk bonds, there’s a chance they will not always remain junk bonds.
Russell 1000 Value Index – This index measures the performance of the large-cap value segment of the U.S. equity universe. It includes Russell 1000 Index companies with lower price-to-book ratios and lower expected growth values.
Russell 2000 Index – This market capitalization-weighted index comprises 2,000 small-cap U.S. companies and is considered a bellwether index for small-cap investing.
S&P CoreLogic Case-Shiller 20-City Composite Home Price NSA Index – This index measures the value of residential real estate in 20 major U.S. metropolitan areas: Atlanta; Boston; Charlotte; Chicago; Cleveland; Dallas; Denver; Detroit; Las Vegas; Los Angeles; Miami; Minneapolis; New York City; Phoenix; Portland, Oregon; San Diego; San Francisco; Seattle; Tampa; and Washington, D.C.
S&P 500 Index – This unmanaged capitalization-weighted index of the stocks of the 500 largest publicly traded U.S. companies is designed to measure performance of the broad domestic economy through changes in the aggregate market value of the 500 stocks, which represent all major industries.

14
S&P GSCI – This index (formerly the Goldman Sachs Commodity Index) measures investment in the commodity markets and commodity market performance over time.
S&P/LSTA Leveraged Loan Index – This index tracks the market-weighted performance of institutional weighted loans based on market weightings, spreads and interest payments.
Shanghai Stock Exchange Composite Index – This capitalization-weighted index, developed in December 1990 with a base value of 100, tracks the daily performance of all A shares and B shares listed on the Shanghai Stock Exchange.
Spread – Difference between yields on differing debt instruments, calculated by deducting the yield of one instrument from another. The higher the yield spread, the greater the difference between the yields offered by each instrument. The spread can be measured between debt instruments of differing maturities, credit ratings or risk.
Spread to Maturity (STM) – Measure of return from a floating-rate note relative to that from its index or reference rate, such as the London interbank offered rate (LIBOR), calculated by discounting future cash flows on a bond basis.
TAIEX Index – This index tracks companies traded on the Taiwan Stock Exchange. The index covers all listed stocks excluding preferred, full-delivery and newly listed stocks, which are listed for less than one calendar month.
Trade Reporting and Compliance Engine (TRACE) – Financial Industry Regulatory Authority (FINRA)-developed vehicle that facilitates the mandatory reporting of over-the-counter secondary market transactions in eligible fixed-income securities.
U-3 Unemployment Rate – Officially recognized rate of unemployment, compiled and released monthly by the U.S. Bureau of Labor Statistics, measuring the number of unemployed people as a percentage of the labor force.
University of Michigan Consumer Sentiment Index – This index rates the relative level of current and future economic conditions through monthly surveys of about 500 U.S. households (ex Alaska and Hawaii). There are two versions of this data released two weeks apart, preliminary and revised. The preliminary data tends to have greater impact. A higher-than-expected reading should be taken as positive/bullish for the U.S. dollar; a lower-than-expected reading should be taken as negative/bearish.
Upgrade-to-Downgrade Ratio – A ratio between bond upgrades (when a rating agency raises a bond’s rating) and bond downgrades (when a rating agency lowers a bond’s rating).
U.S. Dollar Index (DXY) – A weighted geometric mean of the U.S. dollar’s value relative to a basket of six major foreign currencies: the euro, Japanese yen, British pound, Canadian dollar, Swedish krona and Swiss franc.
Weighted Average Rating Factor (WARF) – Used by credit rating companies to indicate the credit quality of a portfolio. This measure aggregates the credit ratings of a portfolio’s assets into a single rating.
West Text Intermediate Crude Oil (WTI) – Specific grade of crude oil and one of the main three benchmarks, along with Brent and Dubai Crude, in oil pricing. WTI is known as a light sweet oil because it contains 0.24% sulfur, making it “sweet,” and has a low density, making it “light.” It is the underlying commodity of the New York Mercantile Exchange’s (NYMEX) oil futures contract and is considered a high-quality oil that is easily refined.
Yield to Maturity (YTM) – The total return anticipated on a bond if the bond is held until it matures. Yield to maturity is considered a long-term bond yield but is expressed as an annual rate.
You cannot invest directly in an index.

15
Important Information Regarding This MaterialIssue selection processes and tools illustrated throughout this presentation are samples and may be modified periodically. These are not the only tools used by the investment teams, are extremely sophisticated, may not always produce the intended results and are not intended for use by non-professionals.
DoubleLine has no obligation to provide revised assessments in the event of changed circumstances. While we have gathered this information from sourc-es believed to be reliable, DoubleLine cannot guarantee the accuracy of the information provided. Securities discussed are not recommendations and are presented as examples of issue selection or portfolio management processes. They have been picked for comparison or illustration purposes only. No security presented within is either offered for sale or purchase. DoubleLine reserves the right to change its investment perspective and outlook without notice as market conditions dictate or as additional information becomes available. This material may include statements that constitute “forward-looking statements” under the U.S. securities laws. Forward-looking statements include, among other things, projections, estimates, and information about possible or future results related to a client’s account, or market or regulatory developments.
Important Information Regarding Risk FactorsInvestment strategies may not achieve the desired results due to implementa-tion lag, other timing factors, portfolio management decision-making, economic or market conditions or other unanticipated factors. The views and forecasts expressed in this material are as of the date indicated, are subject to change without notice, may not come to pass and do not represent a recommendation or offer of any particular security, strategy, or investment. All investments in-volve risks. Please request a copy of DoubleLine’s Form ADV Part 2A to review the material risks involved in DoubleLine’s strategies. Past performance is no guarantee of future results.
Important Information Regarding DoubleLineTo receive a copy of DoubleLine’s current Form ADV (which contains import-ant additional disclosure information, including risk disclosures), please contact DoubleLine’s Client Services.
Important Information Regarding DoubleLine’s Investment StyleDoubleLine seeks to maximize investment results consistent with our interpreta-tion of client guidelines and investment mandate. DoubleLine cannot guarantee that DoubleLine will outperform a client’s specified benchmark or the market or that DoubleLine’s risk management techniques will successfully mitigate losses. Additionally, the nature of portfolio diversification implies that certain holdings and sectors in a client’s portfolio may be rising in price while others are falling or that some issues and sectors are outperforming while others are underperform-ing. Such out or underperformance can be the result of many factors, such as, but not limited to, duration/interest rate exposure, yield curve exposure, bond sector exposure, or news or rumors specific to a single name.
DoubleLine is an active manager and will adjust the composition of clients’ portfolios consistent with our investment team’s judgment concerning market conditions and any particular sector or security. The construction of DoubleLine portfolios may differ substantially from the construction of any of a variety of market indices. As such, a DoubleLine portfolio has the potential to underper-form or outperform a bond market index. Since markets can remain inefficiently priced for long periods, DoubleLine’s performance is properly assessed over a full multi-year market cycle.
CFA® is a registered trademark owned by CFA Institute.
DoubleLine Group is not an investment adviser registered with the Securities and Exchange Commission (SEC).
DoubleLine® is a registered trademark of DoubleLine Capital LP.
© 2021 DoubleLine Capital LP

16
For Investors in ChileIf any products are offered within Chile, they will be offered and sold only pur-suant to General Rule 336 of the SVS, an exemption to the registration require-ments, or in circumstances which do not constitute a public offer of securities in Chile within the meaning of Article 4 of the Chilean Law No. 18,045 on Securities Market.
This communication is addressed only to “Qualified Investors” (as defined in SVS General Rule No. 216).
Si algunos valores son ofrecidos dentro de Chile, serán ofrecidos y colocados sólo de acuerdo a la Norma de Carácter General 336 de la SVS, una excepción a la obligación de registro, o en circunstancias que no constituyan una oferta pública de valores en Chile según lo definido por el Artículo 4 de la Ley 18.045 de Mercado de Valores de Chile.
Esta comunicación está dirigida a “Inversionistas Calificados” (según se define en la Norma de Carácter General N° 216 de la SVS).
For Investors in PeruAll content in this document is for information or general use only. The informa-tion contained in this document is referential and may not be construed as an offer, invitation or recommendation, nor should be taken as a basis to take (or stop taking) any decision.
This neither is an offer or an invitation to offer nor authorizes such sales or invita-tions in places where such offers or invitations are contrary to the corresponding applicable.
This communication is not intended for any person who is not qualified as an institutional investor, in accordance with provisions set forth in SMV Resolution Nº 021-2013-SMV-01, and as subsequently amended. No legal, financial, tax or any other kind of advice is hereby being provided.
Todo lo contenido en este documento es sólo para fines informativos o de uso general. La información contenida en este documento es referencial y no puede interpretarse como una oferta, invitación o recomendación, ni debe consider-arse como fundamento para tomar (o dejar de tomar) alguna decisión.
La presente no constituye una oferta ni una invitación a ofertar ni autoriza tales ventas o invitaciones en los lugares donde tales ofertas o invitaciones sean con-trarias a las respectivas leyes aplicables.
Esta comunicación no está dirigida a ninguna persona que no califique como un inversionista institucional, de conformidad con lo dispuesto en la Resolución SMV Nº 021-2013-SMV-01, así como pueda ser modificada en el futuro. Por medio de la presente comunicación no se le está proveyendo de consejo legal, financiero, tributario o de cualquier otro tipo.
For Investors in Latin America and the Middle EastThis material has not been registered with, or approved or passed on in any way, by any regulatory body or authority in any jurisdiction. This material is for the information of prospective investors only and nothing in this material is intended to endorse or recommend a particular course of action. By receiving this materi-al, the person or entity to whom it has been issued understands, acknowledges and agrees that neither this material nor the contents therein shall be deemed as an offer to sell or a solicitation of an offer to buy, or a recommendation of any security or any other product, strategy or service by DoubleLine or any other third party.
For Investors in Japan (Discretionary Investment Manager (DIM) & Non- Dis-cretionary Investment Manager (Non-DIM)DoubleLine Investment Management Asia Ltd. (“DoubleLine Asia”) is registered with the Kanto Local Finance Bureau as an Investment Advisory and Agency (“IAA”) operator in Japan (Registration No. 2986). However, DoubleLine Asia only conducts the agency business under its IAA registration. Under its agen-cy business, DoubleLine Asia is authorized to intermediate in the execution of investment advisory and investment management contracts between its affili-ates which are registered investment managers outside of Japan (“Foreign In-vestment Managers”) and discretionary investment managers and trust banks conducting the investment management business (together the “Japan DIMs”) registered in Japan.
DoubleLine Asia is not permitted to market or solicit any securities or other in-vestment products, nor is it able to provide any direct investment advisory or investment management services in Japan or elsewhere.
While discussions with Japan DIMs may involve its agency business of interme-diating investment advisory and investment management arrangements, all dis-cussions with persons other than Japan DIMs are necessarily limited to general information about DoubleLine Asia and its affiliates and nothing herein should be read to suggest a solicitation of products or services inconsistent with such regulatory status.