monthly market outlook-march_2015
TRANSCRIPT

Market Outlook Presentation- March 2015
Global Update
Indian Equity Market Update and Budget Features
Indian Debt Market Update
Outlook & Recommendations
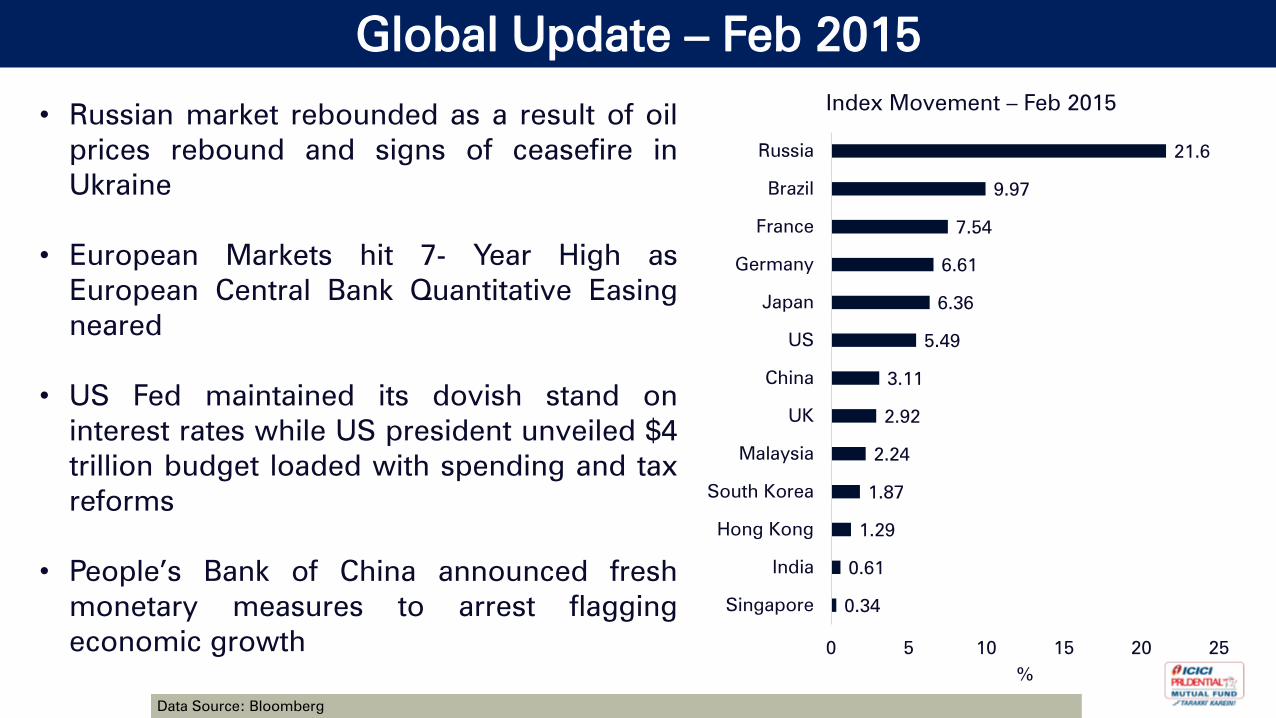
Global Update – Feb 2015
• Russian market rebounded as a result of oil
prices rebound and signs of ceasefire in
Ukraine
• European Markets hit 7- Year High as
European Central Bank Quantitative Easing
neared
• US Fed maintained its dovish stand on
interest rates while US president unveiled $4
trillion budget loaded with spending and tax
reforms
• People’s Bank of China announced fresh
monetary measures to arrest flagging
economic growth
0.34
0.61
1.29
1.87
2.24
2.92
3.11
5.49
6.36
6.61
7.54
9.97
21.6
0 5 10 15 20 25
Singapore
India
Hong Kong
South Korea
Malaysia
UK
China
US
Japan
Germany
France
Brazil
Russia
%
Index Movement – Feb 2015
Data Source: Bloomberg
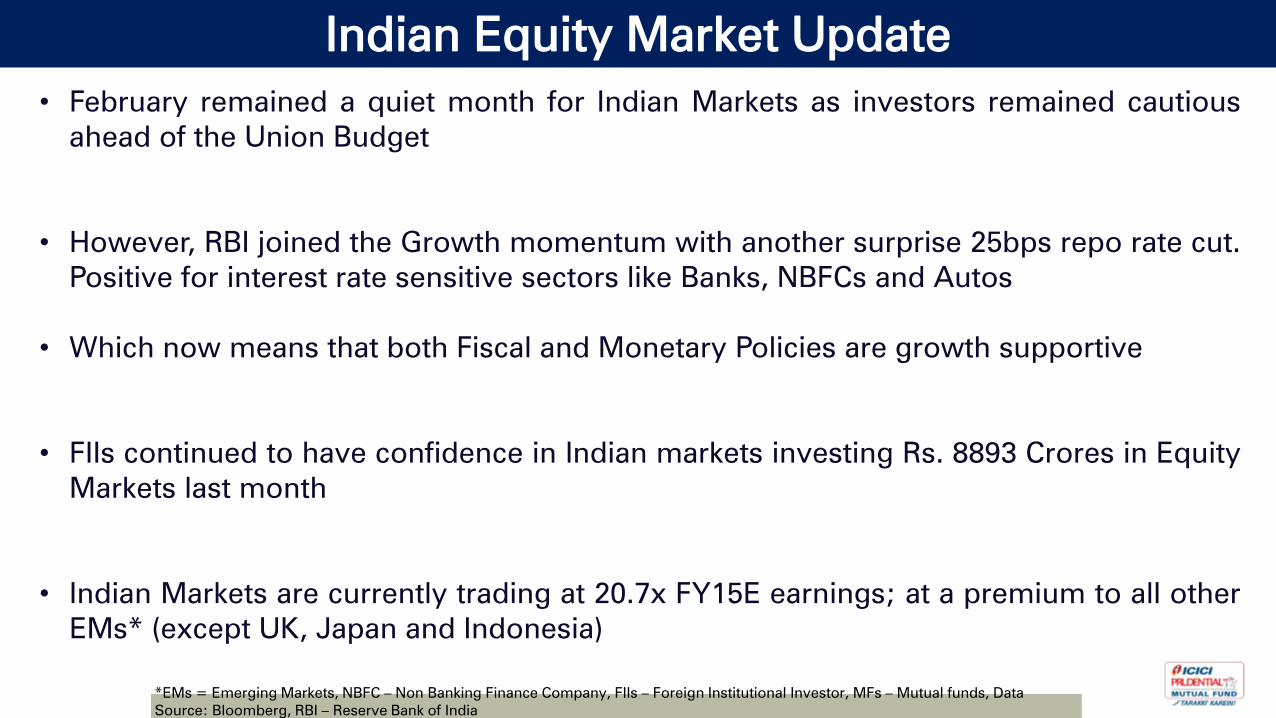
Indian Equity Market Update
• February remained a quiet month for Indian Markets as investors remained cautious
ahead of the Union Budget
• However, RBI joined the Growth momentum with another surprise 25bps repo rate cut.
Positive for interest rate sensitive sectors like Banks, NBFCs and Autos
• Which now means that both Fiscal and Monetary Policies are growth supportive
• FIIs continued to have confidence in Indian markets investing Rs. 8893 Crores in Equity
Markets last month
• Indian Markets are currently trading at 20.7x FY15E earnings; at a premium to all other
EMs* (except UK, Japan and Indonesia)
*EMs = Emerging Markets, NBFC – Non Banking Finance Company, FIIs – Foreign Institutional Investor, MFs – Mutual funds, Data
Source: Bloomberg, RBI – Reserve Bank of India
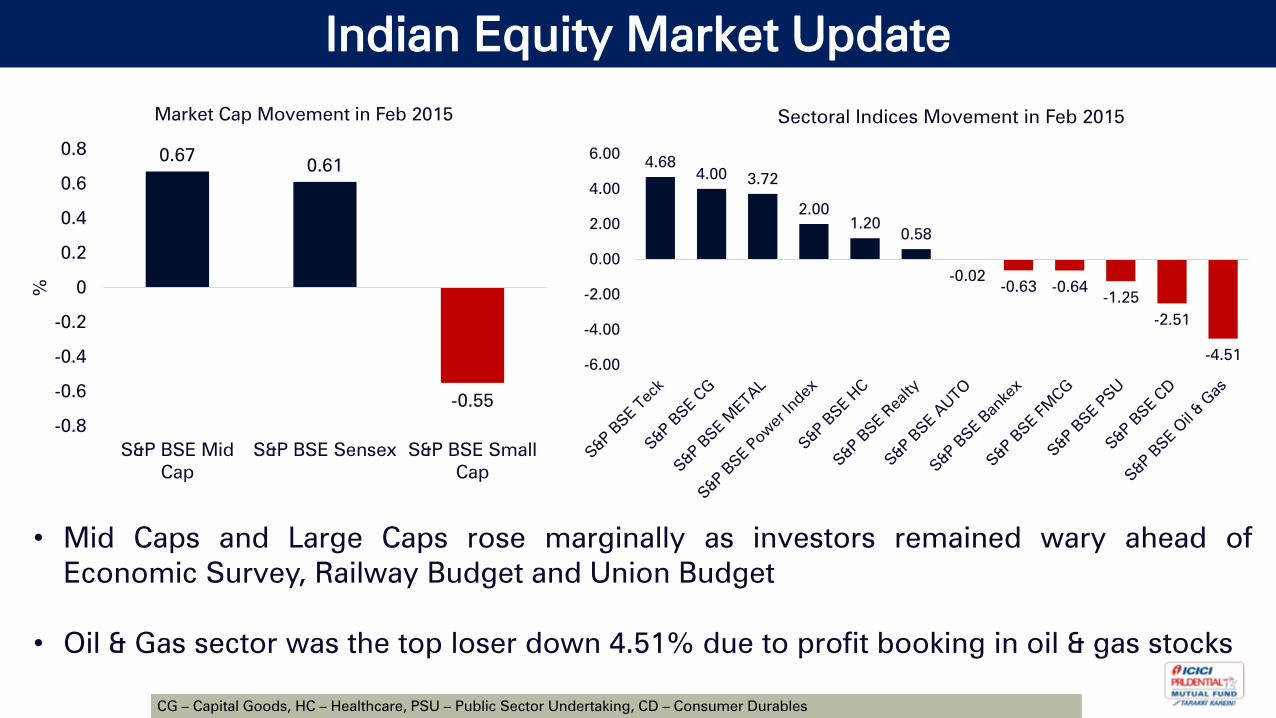
Indian Equity Market Update
0.670.61
-0.55
-0.8
-0.6
-0.4
-0.2
0
0.2
0.4
0.6
0.8
S&P BSE Mid
Cap
S&P BSE Sensex S&P BSE Small
Cap
%
Market Cap Movement in Feb 2015
4.68
4.003.72
2.00
1.20
0.58
-0.02
-0.63 -0.64
-1.25
-2.51
-4.51-6.00
-4.00
-2.00
0.00
2.00
4.00
6.00
Sectoral Indices Movement in Feb 2015
• Mid Caps and Large Caps rose marginally as investors remained wary ahead of
Economic Survey, Railway Budget and Union Budget
• Oil & Gas sector was the top loser down 4.51% due to profit booking in oil & gas stocks
CG – Capital Goods, HC – Healthcare, PSU – Public Sector Undertaking, CD – Consumer Durables
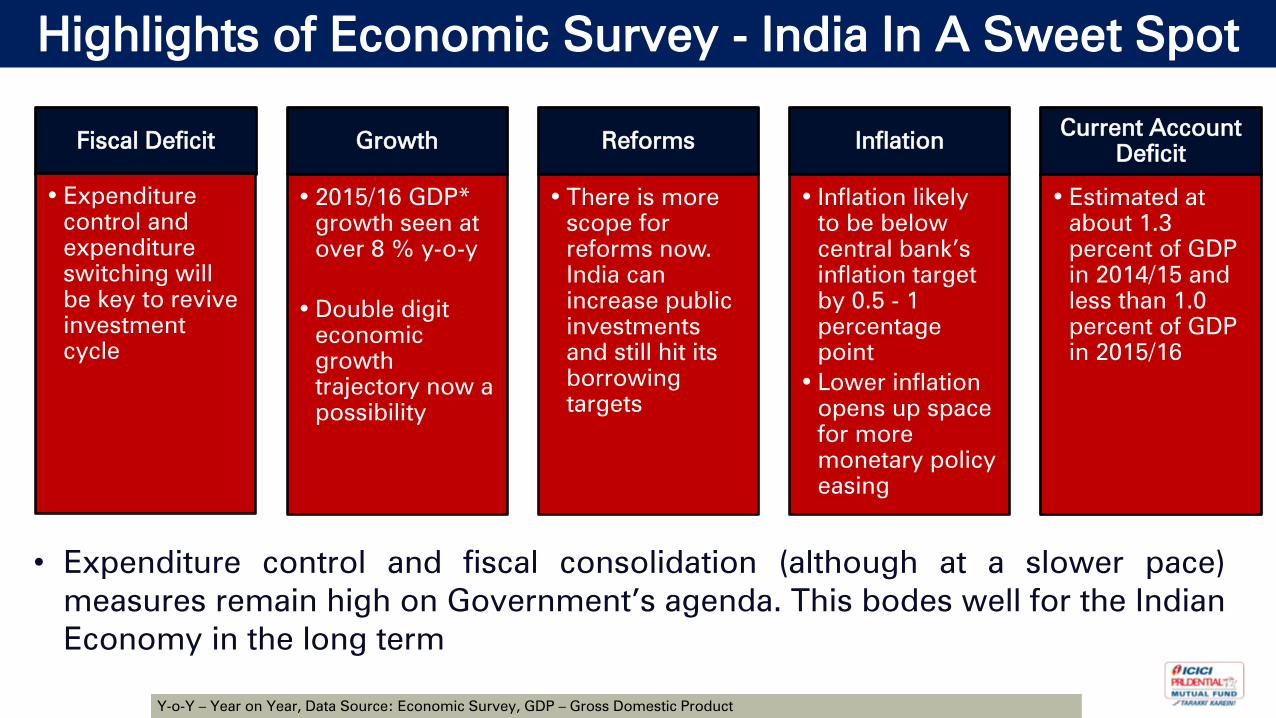
Highlights of Economic Survey - India In A Sweet Spot
Fiscal Deficit
• Expenditure
control and
expenditure
switching will
be key to revive
investment
cycle
Growth
• 2015/16 GDP*
growth seen at
over 8 % y-o-y
• Double digit
economic
growth
trajectory now a
possibility
Reforms
• There is more
scope for
reforms now.
India can
increase public
investments
and still hit its
borrowing
targets
Inflation
• Inflation likely
to be below
central bank’s
inflation target
by 0.5 - 1
percentage
point
• Lower inflation
opens up space
for more
monetary policy
easing
Current Account
Deficit
• Estimated at
about 1.3
percent of GDP
in 2014/15 and
less than 1.0
percent of GDP
in 2015/16
• Expenditure control and fiscal consolidation (although at a slower pace)
measures remain high on Government’s agenda. This bodes well for the Indian
Economy in the long term
Y-o-Y – Year on Year, Data Source: Economic Survey, GDP – Gross Domestic Product
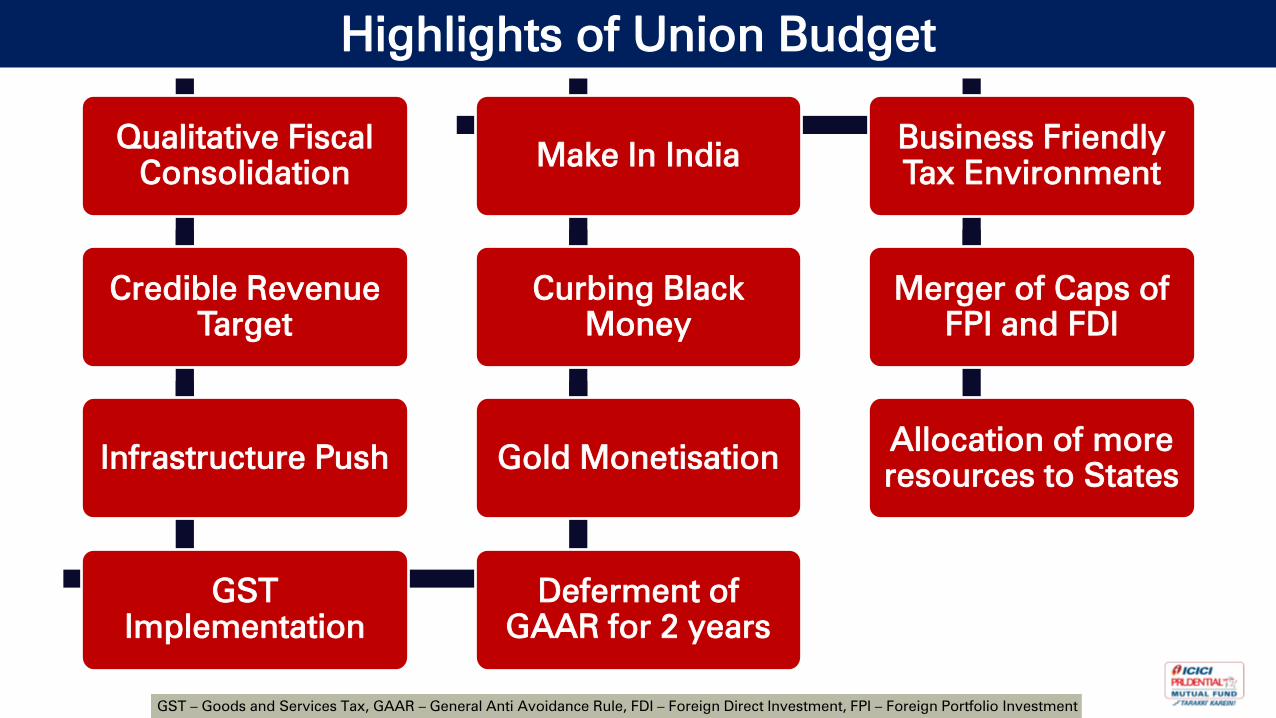
Highlights of Union Budget
Qualitative Fiscal
Consolidation
Credible Revenue
Target
Infrastructure Push
GST
Implementation
Deferment of
GAAR for 2 years
Gold Monetisation
Curbing Black
Money
Make In IndiaBusiness Friendly
Tax Environment
Merger of Caps of
FPI and FDI
Allocation of more
resources to States
GST – Goods and Services Tax, GAAR – General Anti Avoidance Rule, FDI – Foreign Direct Investment, FPI – Foreign Portfolio Investment
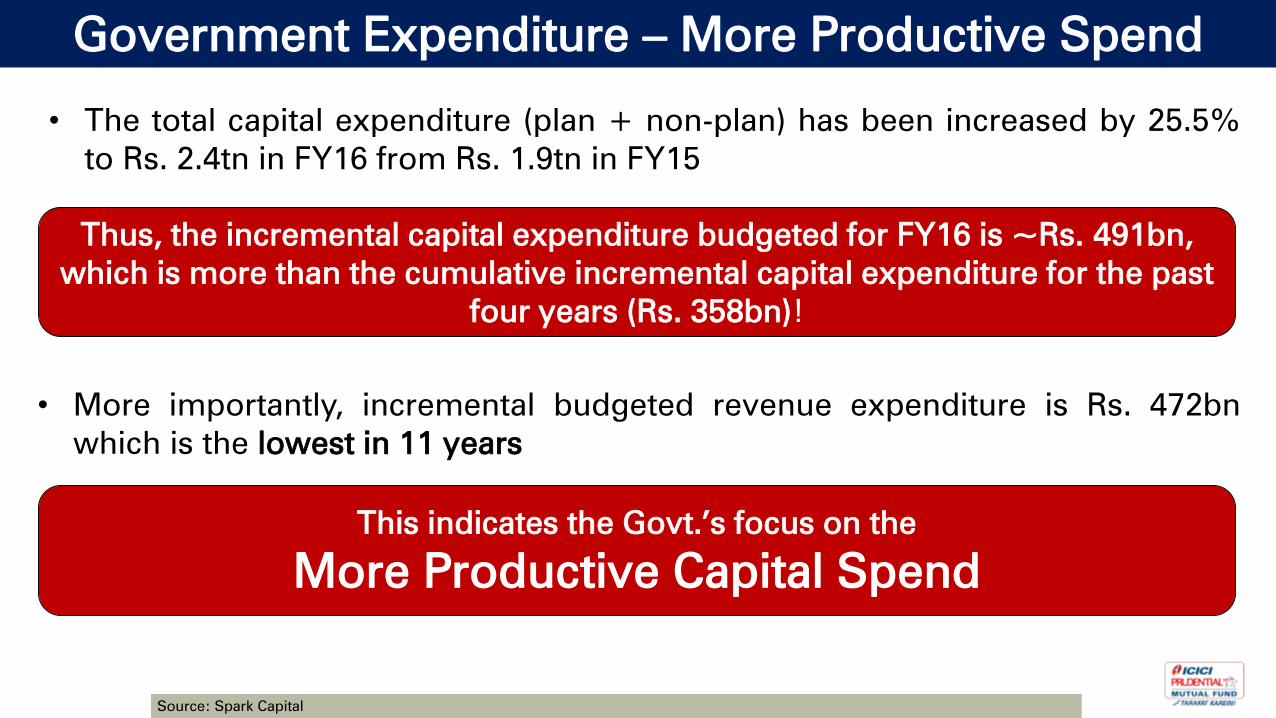
Government Expenditure – More Productive Spend
Source: Spark Capital
• The total capital expenditure (plan + non-plan) has been increased by 25.5%
to Rs. 2.4tn in FY16 from Rs. 1.9tn in FY15
Thus, the incremental capital expenditure budgeted for FY16 is ~Rs. 491bn,
which is more than the cumulative incremental capital expenditure for the past
four years (Rs. 358bn)!
This indicates the Govt.’s focus on the
More Productive Capital Spend
• More importantly, incremental budgeted revenue expenditure is Rs. 472bn
which is the lowest in 11 years
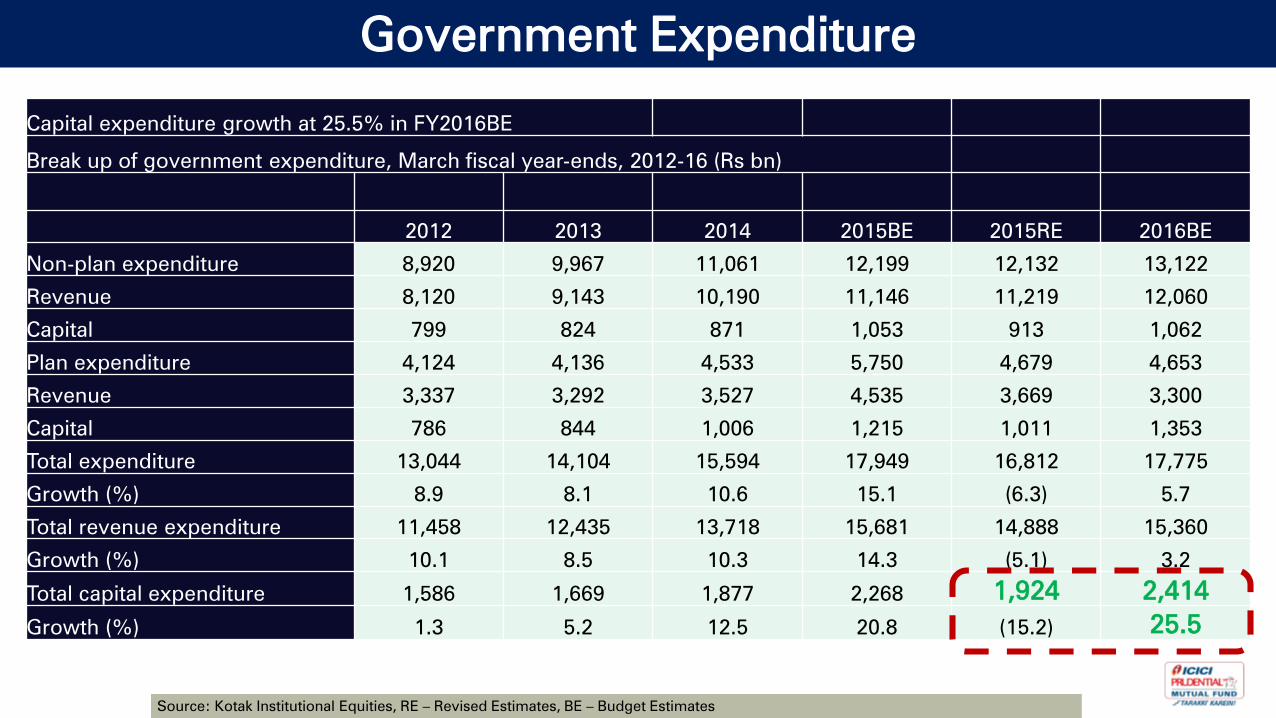
Government Expenditure
Source: Kotak Institutional Equities, RE – Revised Estimates, BE – Budget Estimates
Capital expenditure growth at 25.5% in FY2016BE
Break up of government expenditure, March fiscal year-ends, 2012-16 (Rs bn)
2012 2013 2014 2015BE 2015RE 2016BE
Non-plan expenditure 8,920 9,967 11,061 12,199 12,132 13,122
Revenue 8,120 9,143 10,190 11,146 11,219 12,060
Capital 799 824 871 1,053 913 1,062
Plan expenditure 4,124 4,136 4,533 5,750 4,679 4,653
Revenue 3,337 3,292 3,527 4,535 3,669 3,300
Capital 786 844 1,006 1,215 1,011 1,353
Total expenditure 13,044 14,104 15,594 17,949 16,812 17,775
Growth (%) 8.9 8.1 10.6 15.1 (6.3) 5.7
Total revenue expenditure 11,458 12,435 13,718 15,681 14,888 15,360
Growth (%) 10.1 8.5 10.3 14.3 (5.1) 3.2
Total capital expenditure 1,586 1,669 1,877 2,268 1,924 2,414
Growth (%) 1.3 5.2 12.5 20.8 (15.2) 25.5
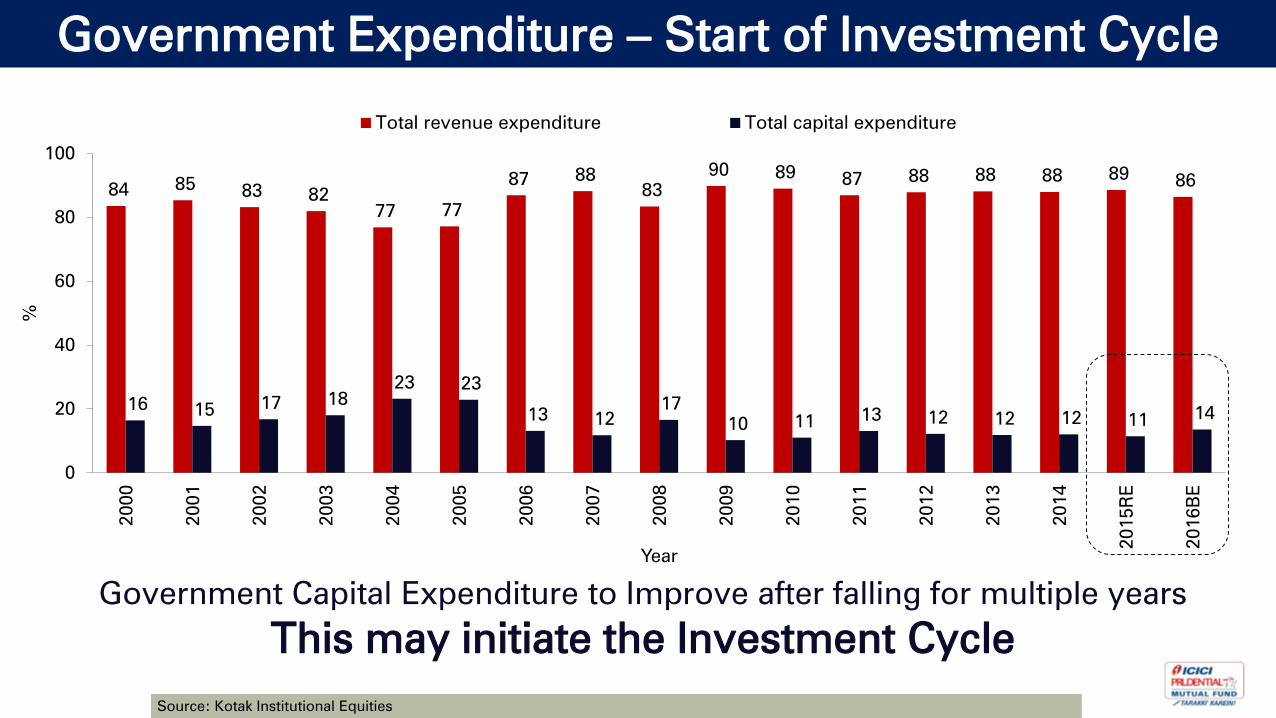
Government Expenditure – Start of Investment Cycle
Source: Kotak Institutional Equities
Government Capital Expenditure to Improve after falling for multiple years
This may initiate the Investment Cycle
84 85
83 82
77 77
87 88
83
90 89 87 88 88 88 89
86
16 15
17 18
23 23
13 12
17
10 11 13 12 12 12 11
14
0
20
40
60
80
100
2000
2001
2002
2003
2004
2005
2006
2007
2008
2009
2010
2011
2012
2013
2014
2015R
E
2016B
E
%
Year
Total revenue expenditure Total capital expenditure
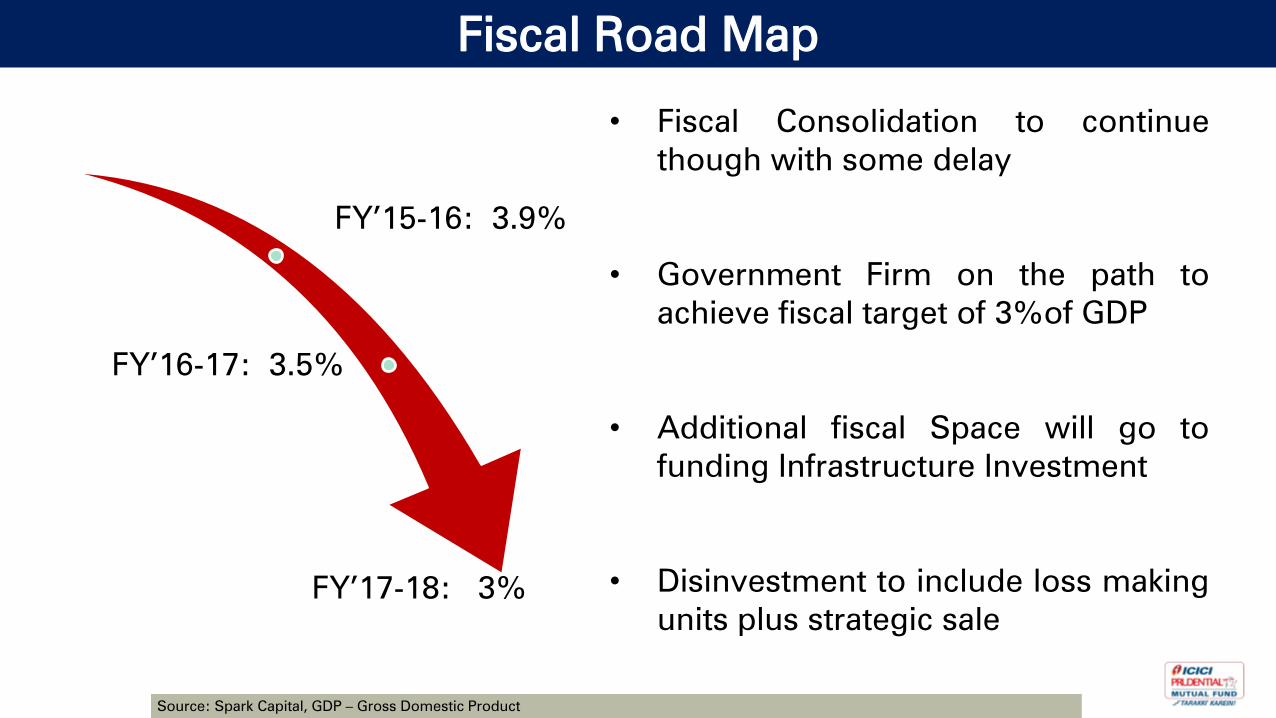
Fiscal Road Map
Source: Spark Capital, GDP – Gross Domestic Product
FY’15-16: 3.9%
FY’16-17: 3.5%
FY’17-18: 3%
• Fiscal Consolidation to continue
though with some delay
• Government Firm on the path to
achieve fiscal target of 3%of GDP
• Additional fiscal Space will go to
funding Infrastructure Investment
• Disinvestment to include loss making
units plus strategic sale
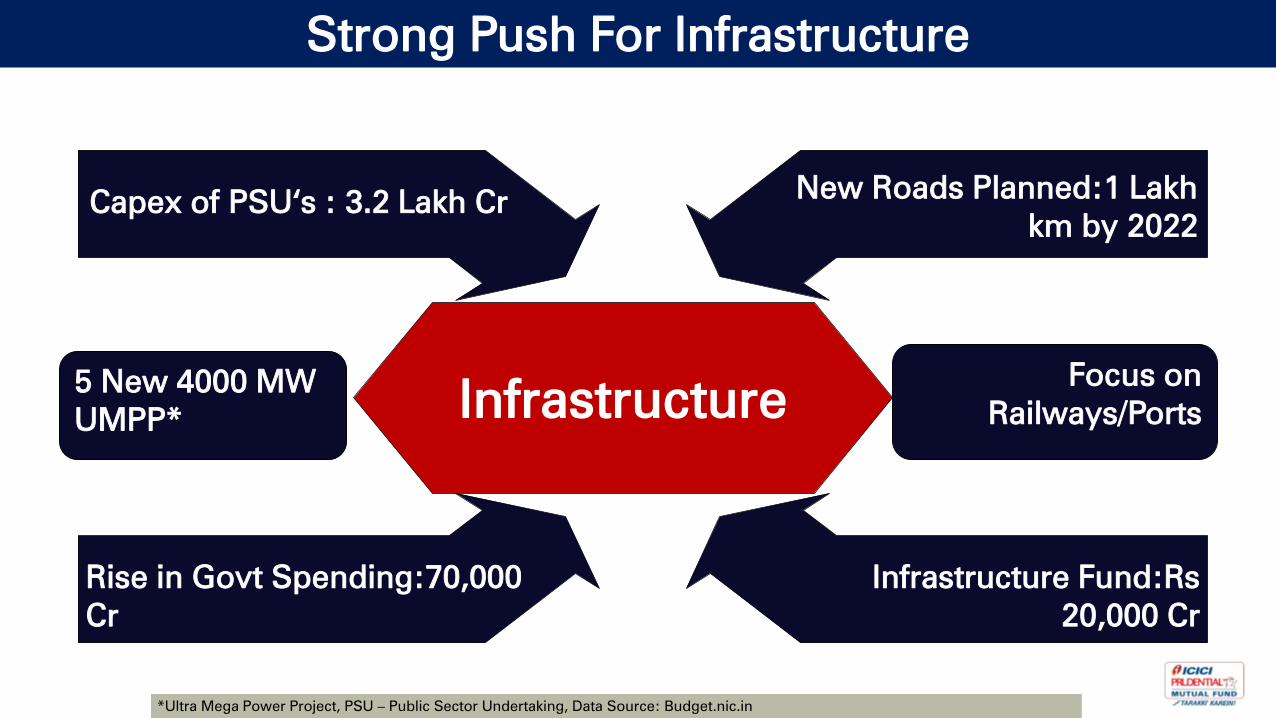
Strong Push For Infrastructure
Infrastructure
Capex of PSU‘s : 3.2 Lakh Cr
Rise in Govt Spending:70,000
Cr
Infrastructure Fund:Rs
20,000 Cr
New Roads Planned:1 Lakh
km by 2022
5 New 4000 MW
UMPP*
Focus on
Railways/Ports
*Ultra Mega Power Project, PSU – Public Sector Undertaking, Data Source: Budget.nic.in
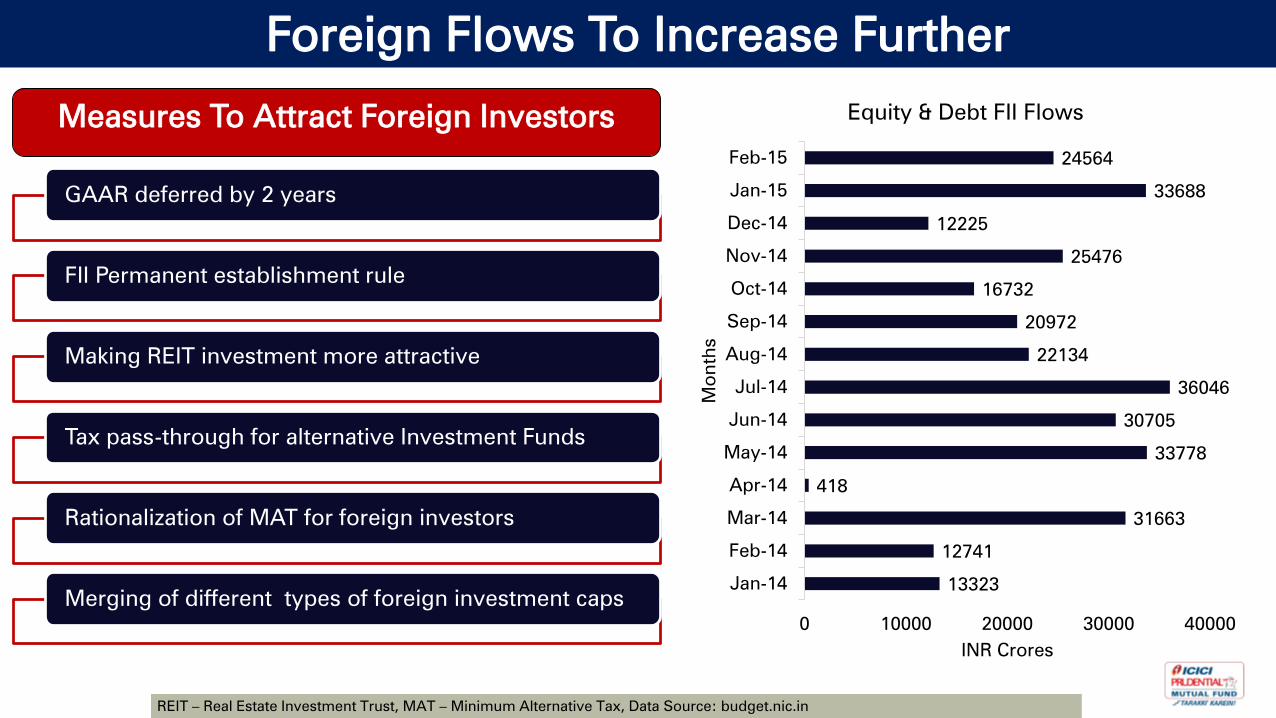
Foreign Flows To Increase Further
Measures To Attract Foreign Investors
GAAR deferred by 2 years
FII Permanent establishment rule
Making REIT investment more attractive
Tax pass-through for alternative Investment Funds
Rationalization of MAT for foreign investors
Merging of different types of foreign investment caps
13323
12741
31663
418
33778
30705
36046
22134
20972
16732
25476
12225
33688
24564
0 10000 20000 30000 40000
Jan-14
Feb-14
Mar-14
Apr-14
May-14
Jun-14
Jul-14
Aug-14
Sep-14
Oct-14
Nov-14
Dec-14
Jan-15
Feb-15
INR Crores
Mo
nth
s
Equity & Debt FII Flows
REIT – Real Estate Investment Trust, MAT – Minimum Alternative Tax, Data Source: budget.nic.in
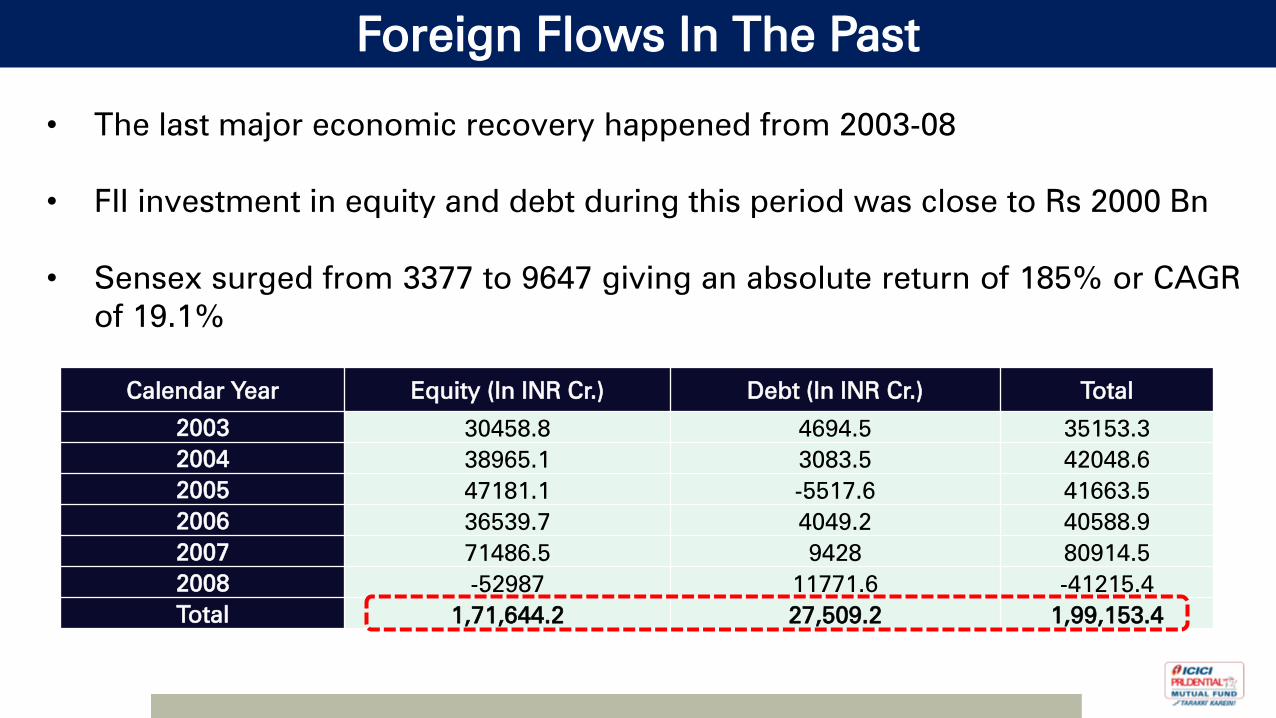
Foreign Flows In The Past
• The last major economic recovery happened from 2003-08
• FII investment in equity and debt during this period was close to Rs 2000 Bn
• Sensex surged from 3377 to 9647 giving an absolute return of 185% or CAGR
of 19.1%
Calendar Year Equity (In INR Cr.) Debt (In INR Cr.) Total
2003 30458.8 4694.5 35153.3
2004 38965.1 3083.5 42048.6
2005 47181.1 -5517.6 41663.5
2006 36539.7 4049.2 40588.9
2007 71486.5 9428 80914.5
2008 -52987 11771.6 -41215.4
Total 1,71,644.2 27,509.2 1,99,153.4
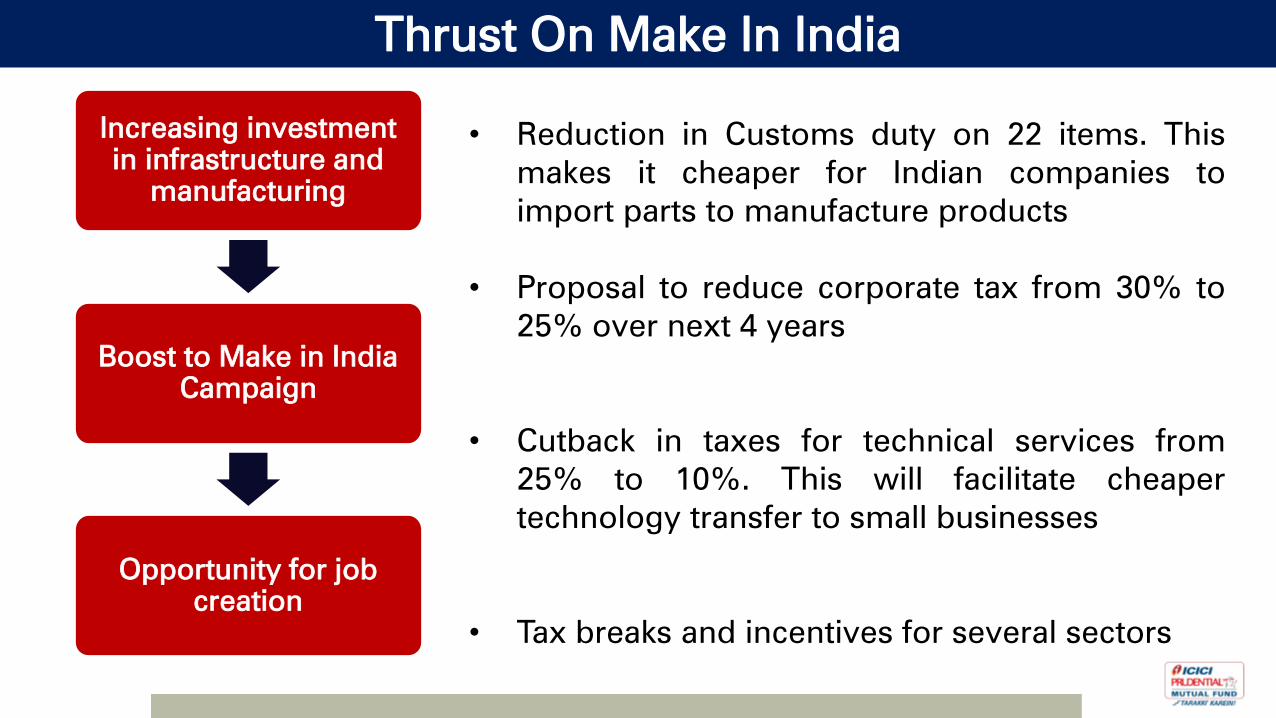
Thrust On Make In India
Increasing investment
in infrastructure and
manufacturing
Boost to Make in India
Campaign
Opportunity for job
creation
• Reduction in Customs duty on 22 items. This
makes it cheaper for Indian companies to
import parts to manufacture products
• Proposal to reduce corporate tax from 30% to
25% over next 4 years
• Cutback in taxes for technical services from
25% to 10%. This will facilitate cheaper
technology transfer to small businesses
• Tax breaks and incentives for several sectors

Our View On The Union Budget
• The Union budget has come out with clear long term vision for recovery of
Indian Economy
• It is well balanced in terms of managing expenditures and revenues
• While it gives impetus to long term growth it also lays a credible road map
for fiscal consolidation
• The budget aims to ramp up growth, increase allocation towards infra
spending and a bundle of tax measures to put private domestic and foreign
capital to work
• The direction of the budget is right and the vision is clear
0.00
20.00
40.00
60.00
80.00
100.00
120.00
140.00
160.00
180.00
Ju
n-04
Oct-0
4
Feb
-05
Ju
n-05
Oct-0
5
Feb
-06
Ju
n-06
Oct-0
6
Feb
-07
Ju
n-07
Oct-0
7
Feb
-08
Ju
n-08
Oct-0
8
Feb
-09
Ju
n-09
Oct-0
9
Feb
-10
Ju
n-10
Oct-1
0
Feb
-11
Ju
n-11
Oct-1
1
Feb
-12
Ju
n-12
Oct-1
2
Feb
-13
Ju
n-13
Oct-1
3
Feb
-14
Ju
n-14
Oct-1
4
Feb
-15
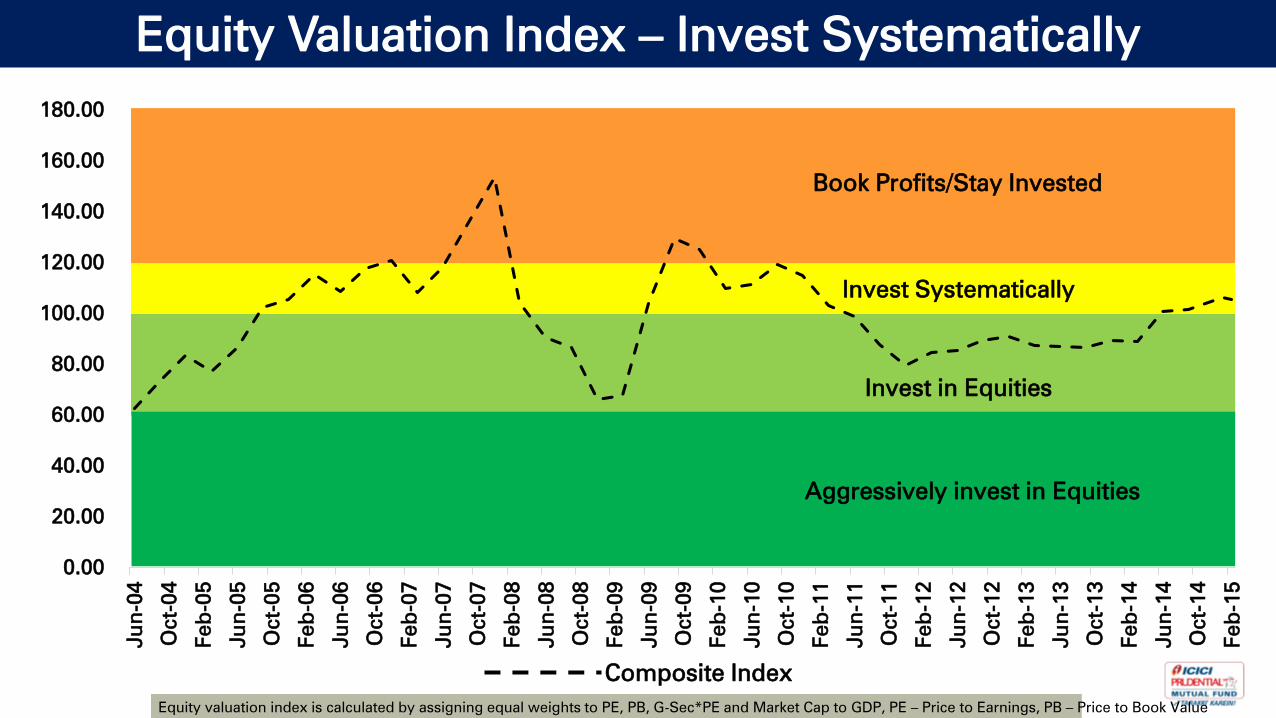
Equity Valuation Index – Invest Systematically
Book Profits/Stay Invested
Invest Systematically
Invest in Equities
Aggressively invest in Equities
Equity valuation index is calculated by assigning equal weights to PE, PB, G-Sec*PE and Market Cap to GDP, PE – Price to Earnings, PB – Price to Book Value
Composite Index
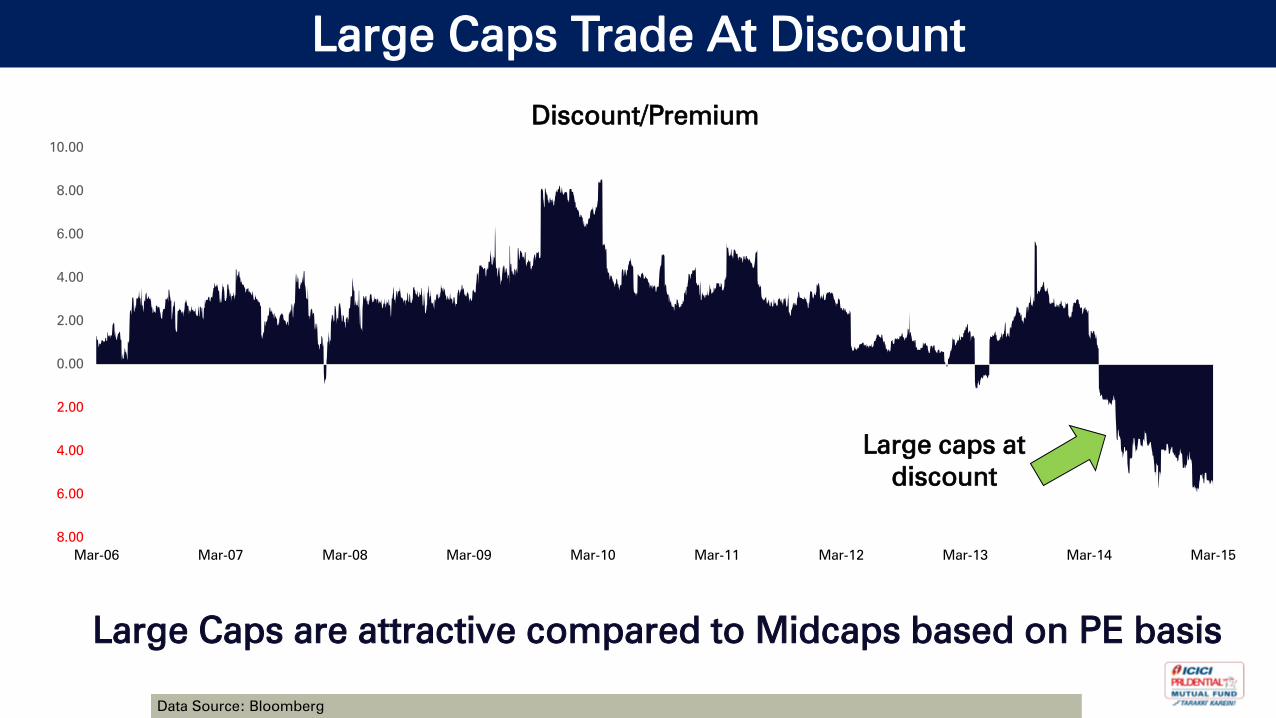
Large Caps Trade At Discount
8.00
6.00
4.00
2.00
0.00
2.00
4.00
6.00
8.00
10.00
Mar-06 Mar-07 Mar-08 Mar-09 Mar-10 Mar-11 Mar-12 Mar-13 Mar-14 Mar-15
Discount/Premium
Large caps at
discount
Large Caps are attractive compared to Midcaps based on PE basis
Data Source: Bloomberg

Sector Valuations
PE PB
Sector Current 10 Yr Avg Prem/Disc (%) Current 10 Yr Avg Prem/Disc (%)
Retail 31.3 32.7 -4% 9.4 4.6 104%
Consumer 35.3 25.6 38% 12.9 8.9 45%
Healthcare 26.8 22 22% 5.7 4.2 36%
Banks - Private 18.7 15.6 20% 3.2 2.4 33%
Media 23.9 22.3 7% 5.3 4 33%
NBFC 14.1 11.9 18% 2.8 2.3 22%
Auto 14 12.7 10% 3.2 2.9 10%
Technology 19.6 17 15% 5.1 5 2%
Cement 23 14.8 55% 2.4 2.4 0%
Banks - PSU 7.7 7.2 7% 1 1.1 -9%
Capital Goods 33.6 22.3 51% 3.8 4.5 -16%
Utilities 13.1 15.1 -13% 1.4 1.8 -22%
Oil & Gas 10.9 11.5 -5% 1.3 1.7 -24%
Real Estate 24.1 23.1 4% 1 1.4 -29%
Telecom 24.7 23.3 6% 1.7 2.4 -29%
Metals 11.1 10 11% 0.9 1.7 -47%
Cyclicals remain at discount on PB Basis
Source: Motilal Oswal, Prem/Disc – Premium/Discount
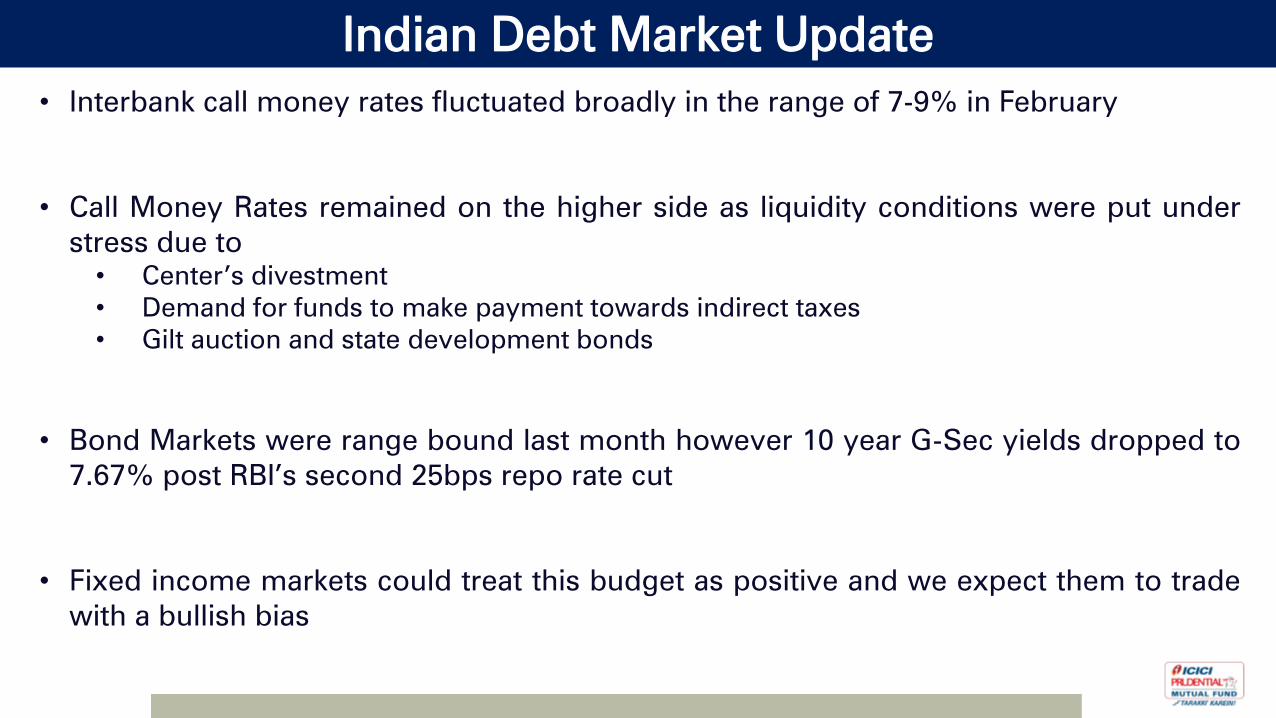
Indian Debt Market Update
• Interbank call money rates fluctuated broadly in the range of 7-9% in February
• Call Money Rates remained on the higher side as liquidity conditions were put under
stress due to
• Center’s divestment
• Demand for funds to make payment towards indirect taxes
• Gilt auction and state development bonds
• Bond Markets were range bound last month however 10 year G-Sec yields dropped to
7.67% post RBI’s second 25bps repo rate cut
• Fixed income markets could treat this budget as positive and we expect them to trade
with a bullish bias
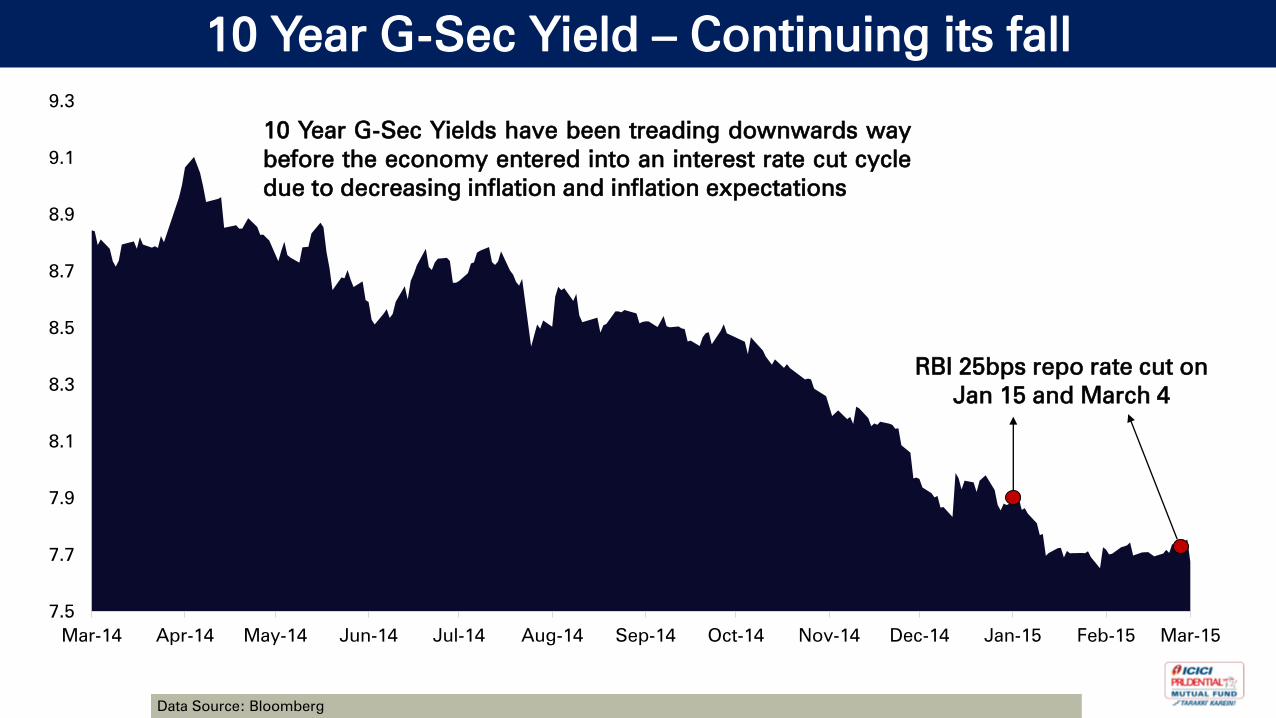
10 Year G-Sec Yield – Continuing its fall
7.5
7.7
7.9
8.1
8.3
8.5
8.7
8.9
9.1
9.3
Mar-14 Apr-14 May-14 Jun-14 Jul-14 Aug-14 Sep-14 Oct-14 Nov-14 Dec-14 Jan-15 Feb-15 Mar-15
10 Year G-Sec Yields have been treading downwards way
before the economy entered into an interest rate cut cycle
due to decreasing inflation and inflation expectations
RBI 25bps repo rate cut on
Jan 15 and March 4
Data Source: Bloomberg
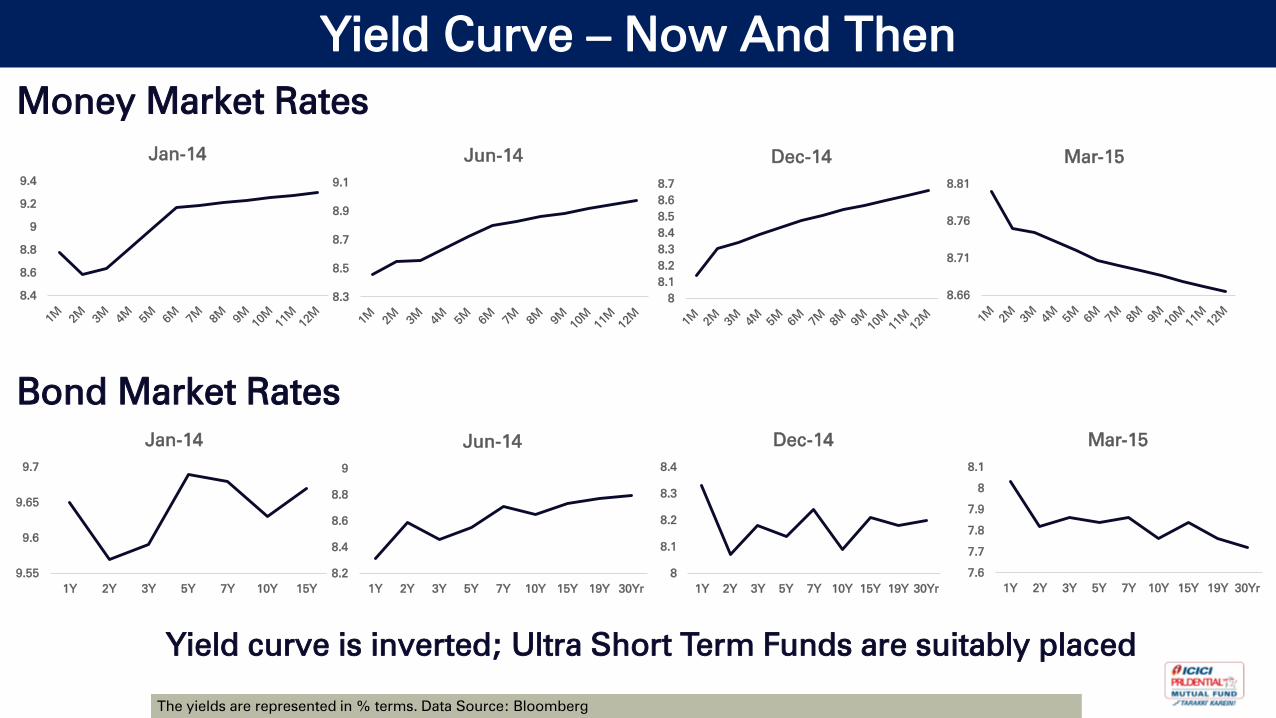
Yield Curve – Now And Then
8.4
8.6
8.8
9
9.2
9.4
Jan-14
8.3
8.5
8.7
8.9
9.1
Jun-14
8
8.1
8.2
8.3
8.4
8.5
8.6
8.7
Dec-14
8.66
8.71
8.76
8.81
Mar-15
Money Market Rates
Bond Market Rates
9.55
9.6
9.65
9.7
1Y 2Y 3Y 5Y 7Y 10Y 15Y
Jan-14
8.2
8.4
8.6
8.8
9
1Y 2Y 3Y 5Y 7Y 10Y 15Y 19Y 30Yr
Jun-14
8
8.1
8.2
8.3
8.4
1Y 2Y 3Y 5Y 7Y 10Y 15Y 19Y 30Yr
Dec-14
7.6
7.7
7.8
7.9
8
8.1
1Y 2Y 3Y 5Y 7Y 10Y 15Y 19Y 30Yr
Mar-15
Yield curve is inverted; Ultra Short Term Funds are suitably placed
The yields are represented in % terms. Data Source: Bloomberg
Future Course of Rate Cuts
• Further rate cuts are dependent on two main considerations:
1. Inflation Trajectory
2. Qualitative Fiscal Consolidation
• CPI Inflation has remained stable even post the new series
• While the Union Budget has highlighted the government’s focus on fiscal prudence
• Hence we believe that bond markets may continue to price in subsequent rate cuts
and 10 year G-Sec yields may trade below the repo rate of 7.50%
• Under such a scenario medium term duration funds are a suitable investment choice
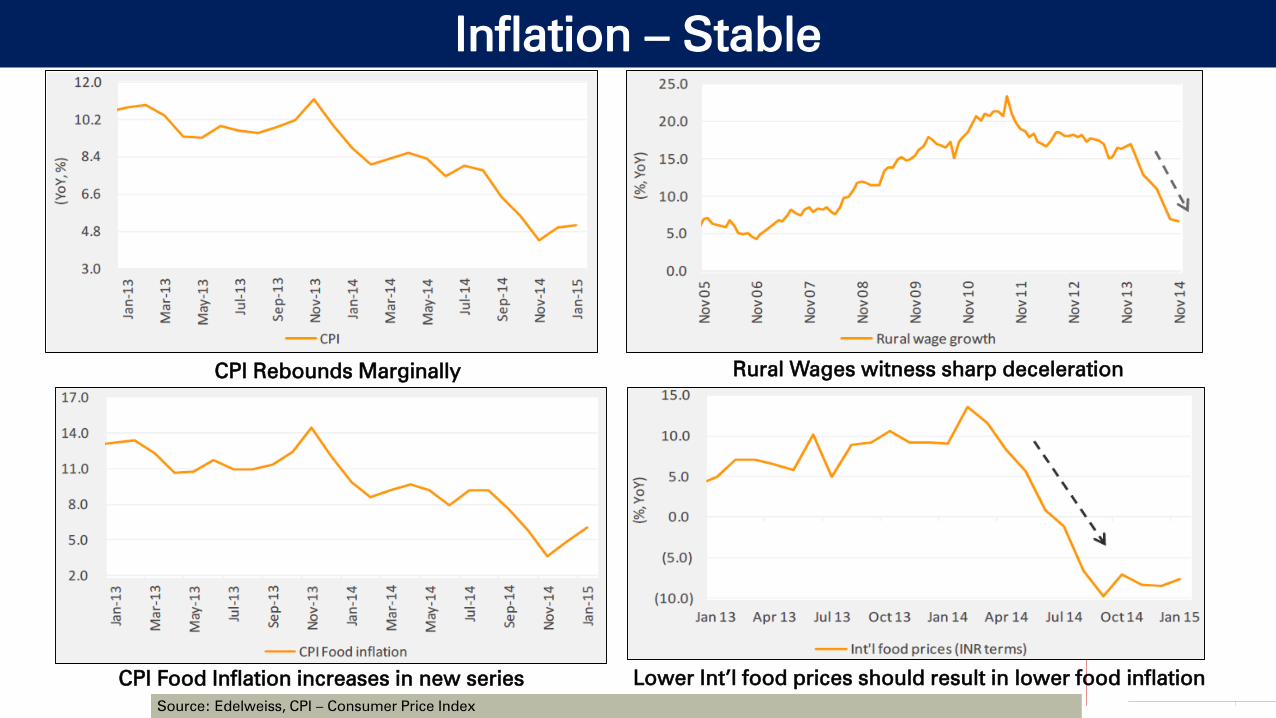
Inflation – Stable
CPI Rebounds Marginally Rural Wages witness sharp deceleration
CPI Food Inflation increases in new series Lower Int’l food prices should result in lower food inflation
Source: Edelweiss, CPI – Consumer Price Index
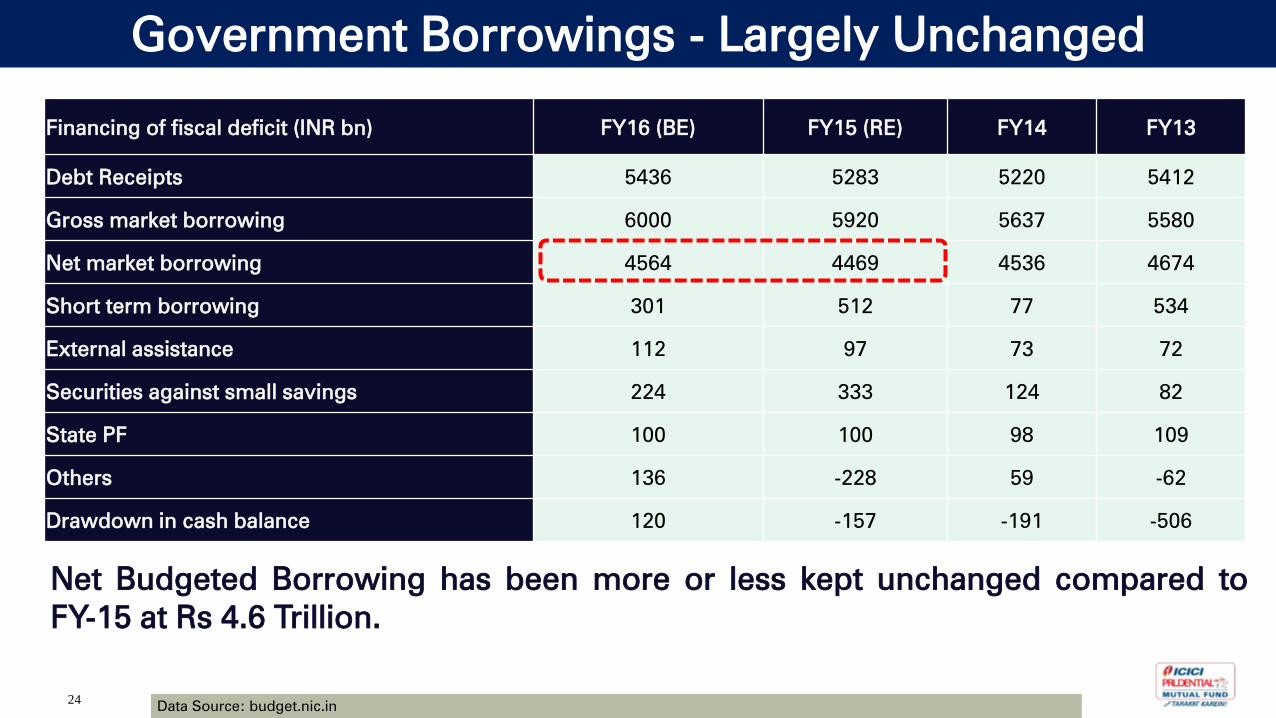
24
Net Budgeted Borrowing has been more or less kept unchanged compared to
FY-15 at Rs 4.6 Trillion.
Government Borrowings - Largely Unchanged
Financing of fiscal deficit (INR bn) FY16 (BE) FY15 (RE) FY14 FY13
Debt Receipts 5436 5283 5220 5412
Gross market borrowing 6000 5920 5637 5580
Net market borrowing 4564 4469 4536 4674
Short term borrowing 301 512 77 534
External assistance 112 97 73 72
Securities against small savings 224 333 124 82
State PF 100 100 98 109
Others 136 -228 59 -62
Drawdown in cash balance 120 -157 -191 -506
Data Source: budget.nic.in
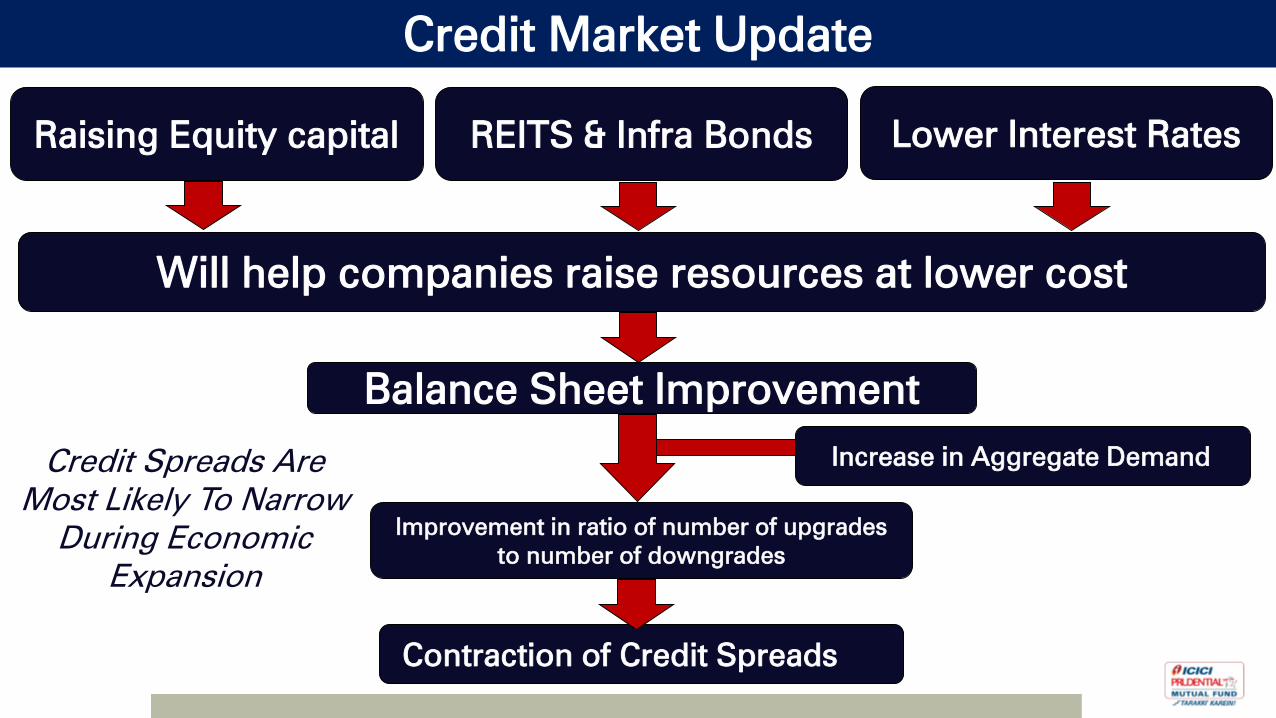
Credit Market Update
Raising Equity capital
Will help companies raise resources at lower cost
Balance Sheet Improvement
Improvement in ratio of number of upgrades
to number of downgrades
Contraction of Credit Spreads
Credit Spreads Are
Most Likely To Narrow
During Economic
Expansion
REITS & Infra Bonds Lower Interest Rates
Increase in Aggregate Demand
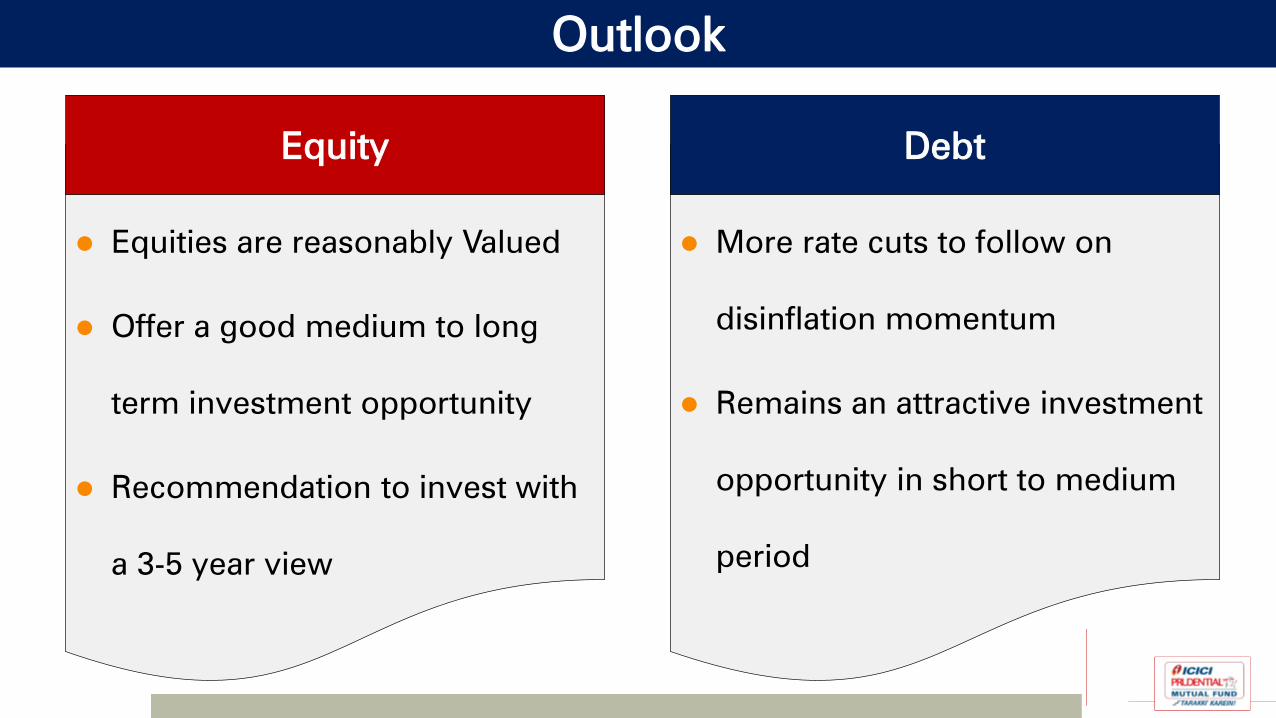
Outlook
Equities are reasonably Valued
Offer a good medium to long
term investment opportunity
Recommendation to invest with
a 3-5 year view
More rate cuts to follow on
disinflation momentum
Remains an attractive investment
opportunity in short to medium
period
Debt Equity
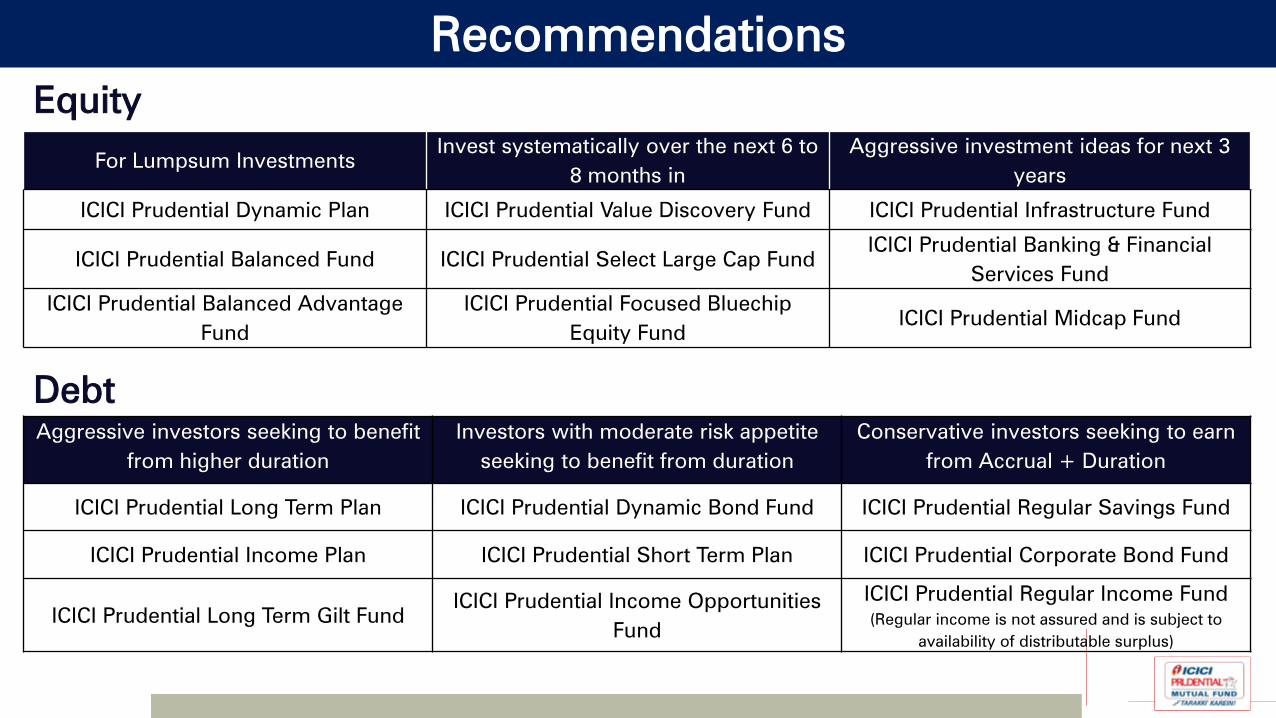
Recommendations
Equity
Debt
For Lumpsum Investments
Invest systematically over the next 6 to
8 months in
Aggressive investment ideas for next 3
years
ICICI Prudential Dynamic Plan ICICI Prudential Value Discovery Fund ICICI Prudential Infrastructure Fund
ICICI Prudential Balanced Fund ICICI Prudential Select Large Cap Fund
ICICI Prudential Banking & Financial
Services Fund
ICICI Prudential Balanced Advantage
Fund
ICICI Prudential Focused Bluechip
Equity Fund
ICICI Prudential Midcap Fund
Aggressive investors seeking to benefit
from higher duration
Investors with moderate risk appetite
seeking to benefit from duration
Conservative investors seeking to earn
from Accrual + Duration
ICICI Prudential Long Term Plan ICICI Prudential Dynamic Bond Fund ICICI Prudential Regular Savings Fund
ICICI Prudential Income Plan ICICI Prudential Short Term Plan ICICI Prudential Corporate Bond Fund
ICICI Prudential Long Term Gilt Fund
ICICI Prudential Income Opportunities
Fund
ICICI Prudential Regular Income Fund
(Regular income is not assured and is subject to
availability of distributable surplus)
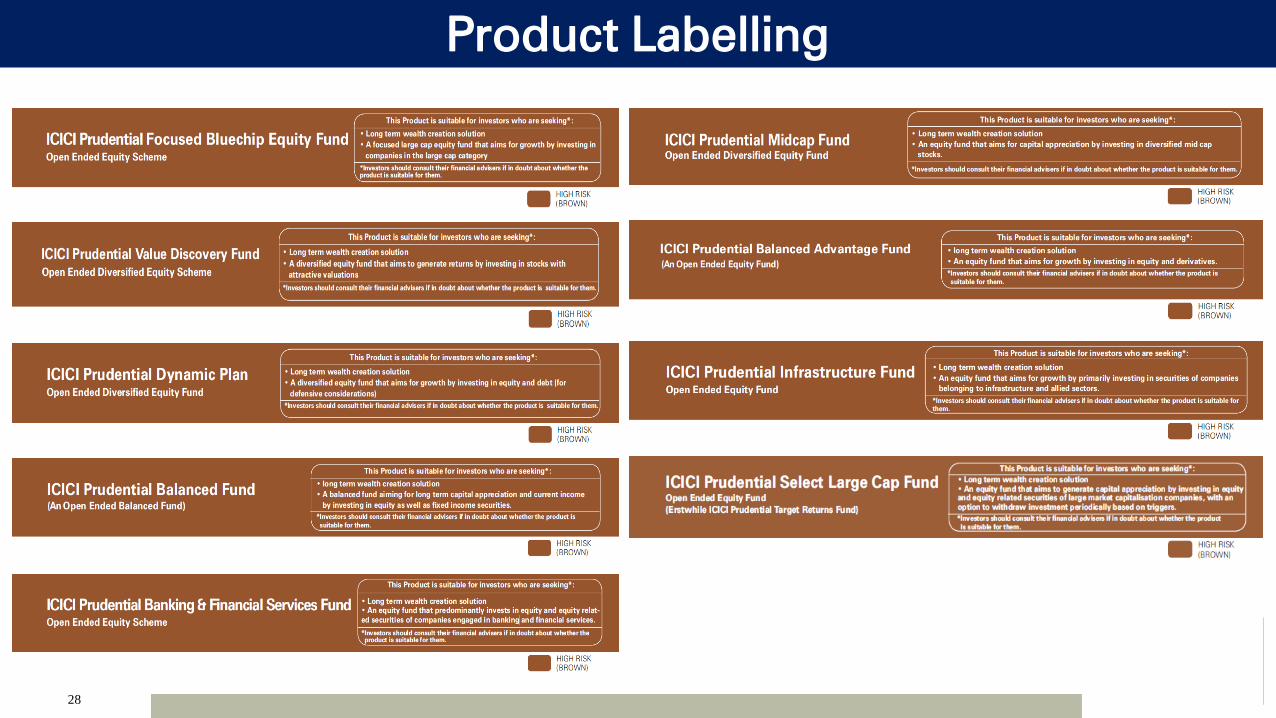
28
Product Labelling
29
Product Labelling
Note - Risk may be represented as:
(BLUE) investors
understand that their
principal will be at low
risk
(YELLOW) investors
understand that their
principal will be at
medium risk
(BROWN) investors
understand that their
principal will be at high risk

Disclaimer
Mutual Fund investments are subject to market risks, read all scheme
related documents carefully.
All figures and other data given in this document are as on 5th
March 2015 unless stated otherwise. The same may or may not be relevant at a future date. The AMC takes no
responsibility of updating any data/information in this material from time to time. The information shall not be altered in any way, transmitted to, copied or distributed, in part or in
whole, to any other person or to the media or reproduced in any form, without prior written consent of ICICI Prudential Asset Management Company Limited.
Prospective investors are advised to consult their own legal, tax and financial advisors to determine possible tax, legal and other financial implication or consequence of subscribing to
the units of ICICI Prudential Mutual Fund.
Data source: Bloomberg, except as mentioned specifically.
Disclaimer: In the preparation of the material contained in this document, ICICI Prudential Asset Management Company Ltd. (the AMC) has used information that is publicly available,
including information developed in-house. Some of the material used in the document may have been obtained from members/persons other than the AMC and/or its affiliates and
which may have been made available to the AMC and/or to its affiliates. Information gathered and material used in this document is believed to be from reliable sources. The AMC
however does not warrant the accuracy, reasonableness and / or completeness of any information. We have included statements / opinions / recommendations in this document, which
contain words, or phrases such as “will”, “expect”, “should”, “believe” and similar expressions or variations of such expressions, that are “forward looking statements”. Actual results
may differ materially from those suggested by the forward looking statements due to risk or uncertainties associated with our expectations with respect to, but not limited to, exposure to
market risks, general economic and political conditions in India and other countries globally, which have an impact on our services and / or investments, the monetary and interest
policies of India, inflation, deflation, unanticipated turbulence in interest rates, foreign exchange rates, equity prices or other rates or prices etc.
ICICI Prudential Asset Management Company Limited (including its affiliates), the Mutual Fund, The Trust and any of its officers, directors, personnel and employees, shall not liable for
any loss, damage of any nature, including but not limited to direct, indirect, punitive, special, exemplary, consequential, as also any loss of profit in any way arising from the use of this
material in any manner.
Further, the information contained herein should not be construed as forecast or promise. The recipient alone shall be fully responsible/are liable for any decision taken on this material.
Thank You