monthly market outlook presentation july 2015€¦ · monthly market outlook presentation ......
TRANSCRIPT

1
Monthly Market
Outlook Presentation
July 2015
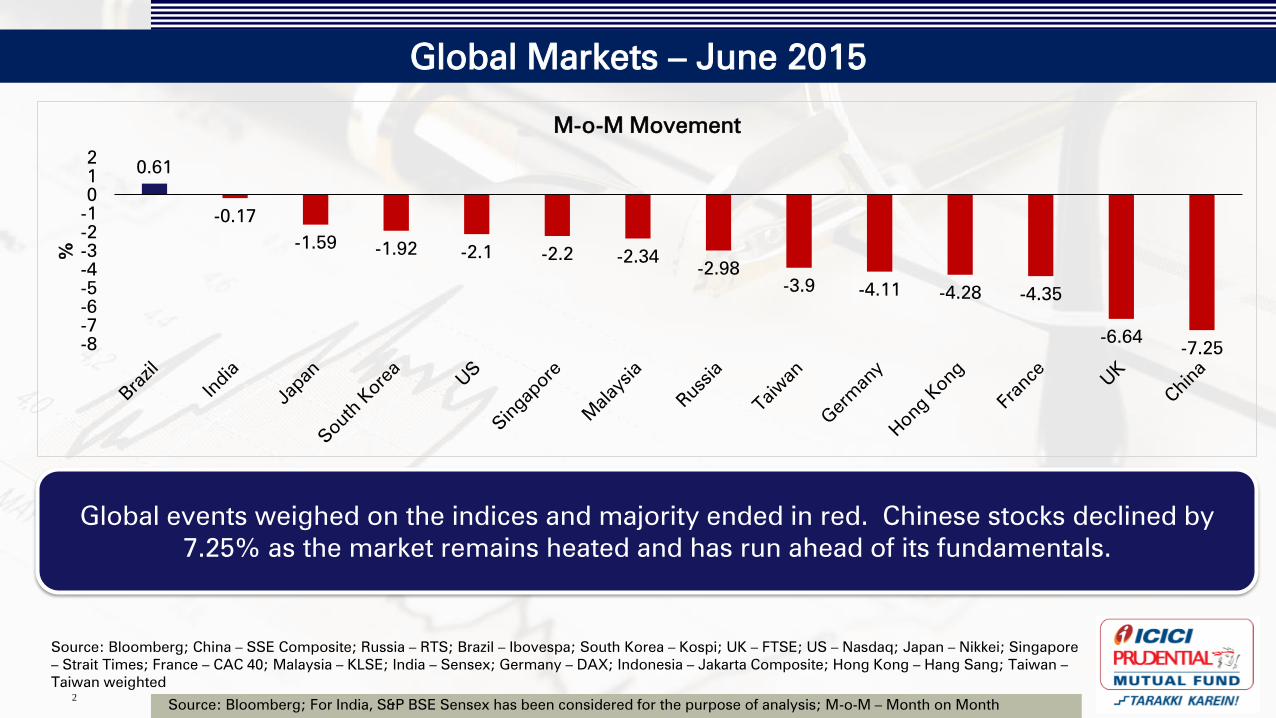
Global Markets – June 2015
Source: Bloomberg; For India, S&P BSE Sensex has been considered for the purpose of analysis; M-o-M – Month on Month 2
Global events weighed on the indices and majority ended in red. Chinese stocks declined by
7.25% as the market remains heated and has run ahead of its fundamentals.
Source: Bloomberg; China – SSE Composite; Russia – RTS; Brazil – Ibovespa; South Korea – Kospi; UK – FTSE; US – Nasdaq; Japan – Nikkei; Singapore
– Strait Times; France – CAC 40; Malaysia – KLSE; India – Sensex; Germany – DAX; Indonesia – Jakarta Composite; Hong Kong – Hang Sang; Taiwan –
Taiwan weighted
0.61
-0.17
-1.59 -1.92 -2.1 -2.2 -2.34
-2.98
-3.9 -4.11 -4.28 -4.35
-6.64 -7.25 -8
-7
-6
-5
-4
-3
-2
-1
0
1
2
%
M-o-M Movement
Indian Equity Markets – June 2015
3
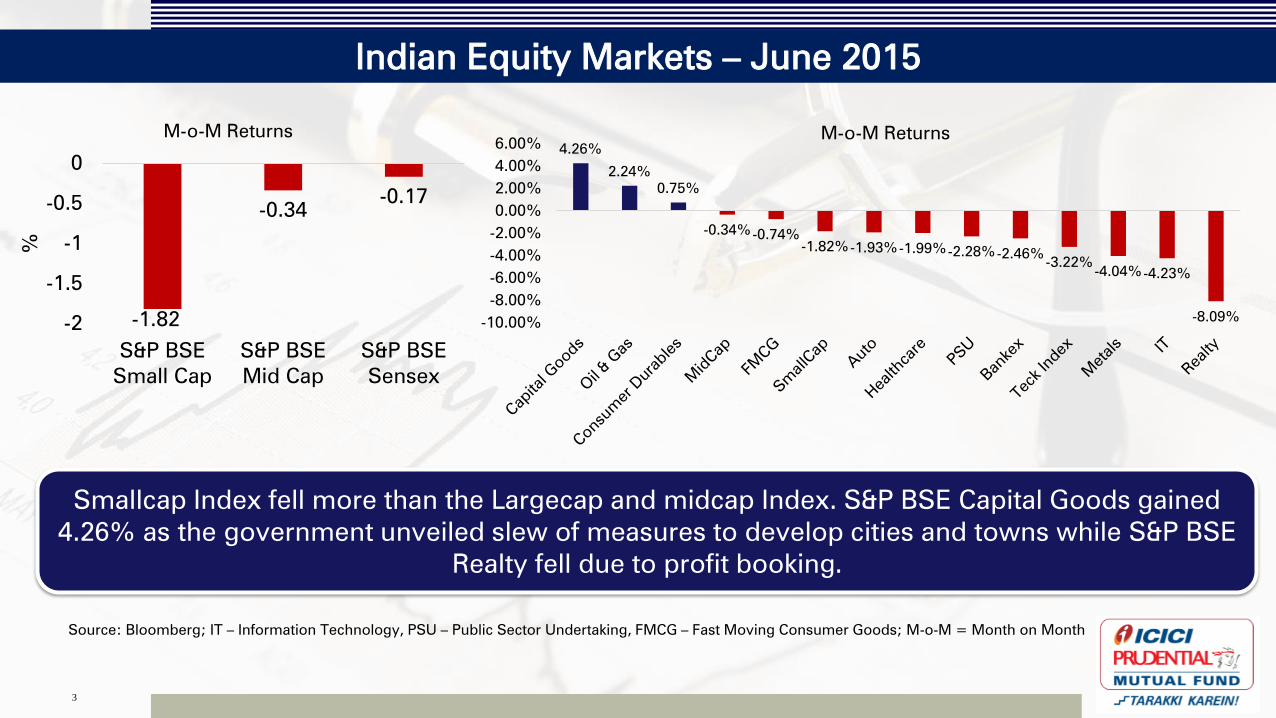
Source: Bloomberg; IT – Information Technology, PSU – Public Sector Undertaking, FMCG – Fast Moving Consumer Goods; M-o-M = Month on Month
-1.82
-0.34 -0.17
-2
-1.5
-1
-0.5
0
S&P BSE
Small Cap
S&P BSE
Mid Cap
S&P BSE
Sensex
%
M-o-M Returns
Smallcap Index fell more than the Largecap and midcap Index. S&P BSE Capital Goods gained
4.26% as the government unveiled slew of measures to develop cities and towns while S&P BSE
Realty fell due to profit booking.
4.26%
2.24%
0.75%
-0.34% -0.74%
-1.82% -1.93% -1.99% -2.28% -2.46% -3.22%
-4.04% -4.23%
-8.09% -10.00%
-8.00%
-6.00%
-4.00%
-2.00%
0.00%
2.00%
4.00%
6.00%M-o-M Returns
FII and MF Flows
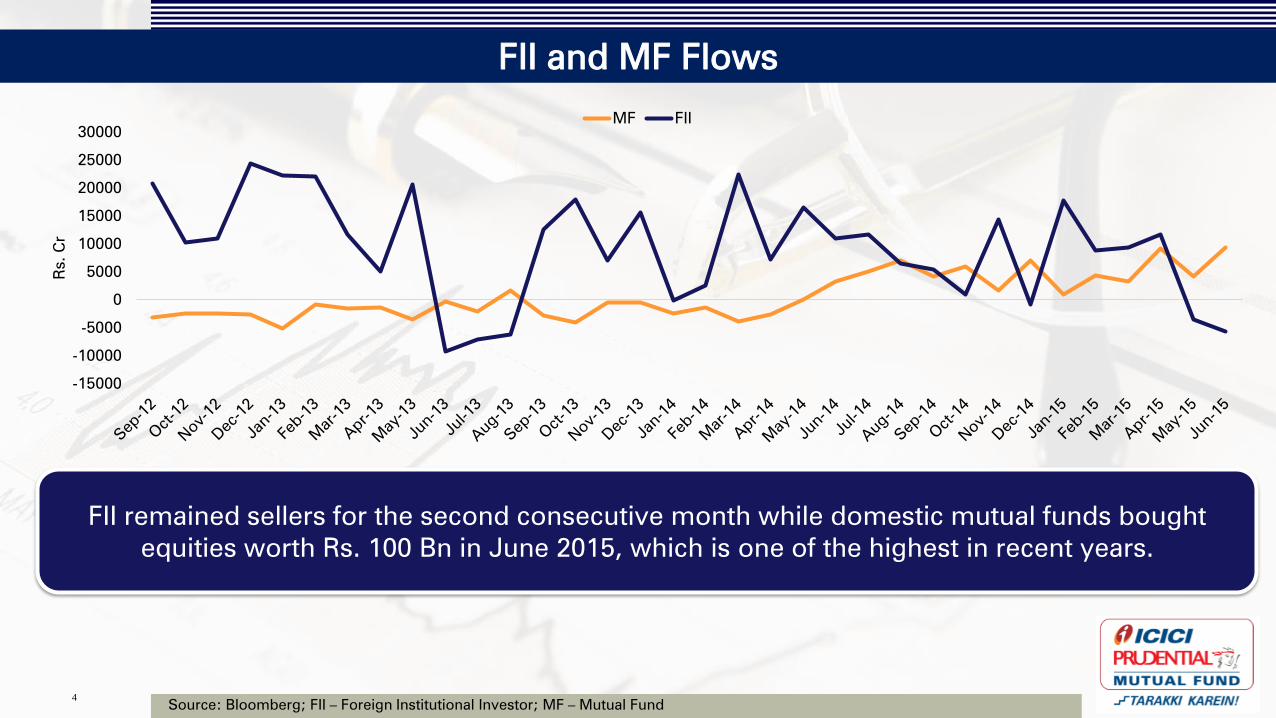
Source: Bloomberg; FII – Foreign Institutional Investor; MF – Mutual Fund 4
FII remained sellers for the second consecutive month while domestic mutual funds bought
equities worth Rs. 100 Bn in June 2015, which is one of the highest in recent years.
-15000
-10000
-5000
0
5000
10000
15000
20000
25000
30000
Rs. C
r
MF FII
What are the Sectoral Returns since the rate cut cycle started?
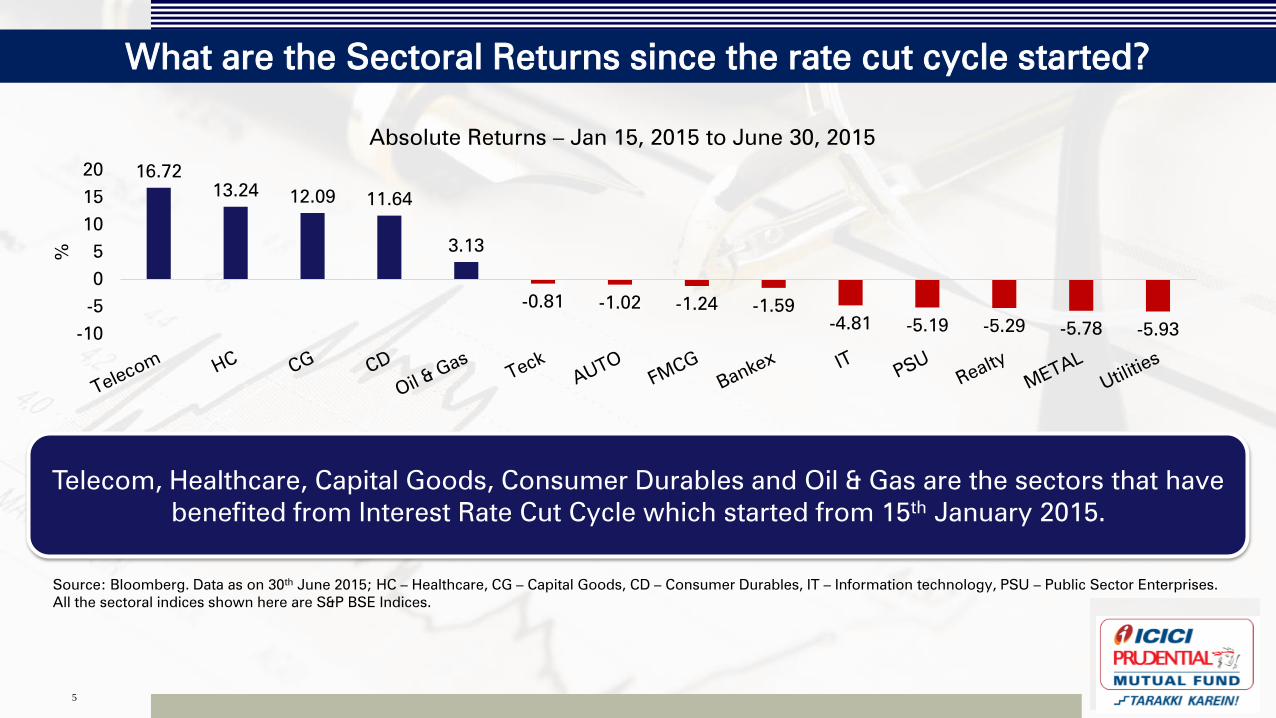
Source: Bloomberg. Data as on 30th
June 2015; HC – Healthcare, CG – Capital Goods, CD – Consumer Durables, IT – Information technology, PSU – Public Sector Enterprises.
All the sectoral indices shown here are S&P BSE Indices.
5
Telecom, Healthcare, Capital Goods, Consumer Durables and Oil & Gas are the sectors that have
benefited from Interest Rate Cut Cycle which started from 15th
January 2015.
16.72
13.24 12.09 11.64
3.13
-0.81 -1.02 -1.24 -1.59
-4.81 -5.19 -5.29 -5.78 -5.93 -10
-5
0
5
10
15
20
%
Absolute Returns – Jan 15, 2015 to June 30, 2015
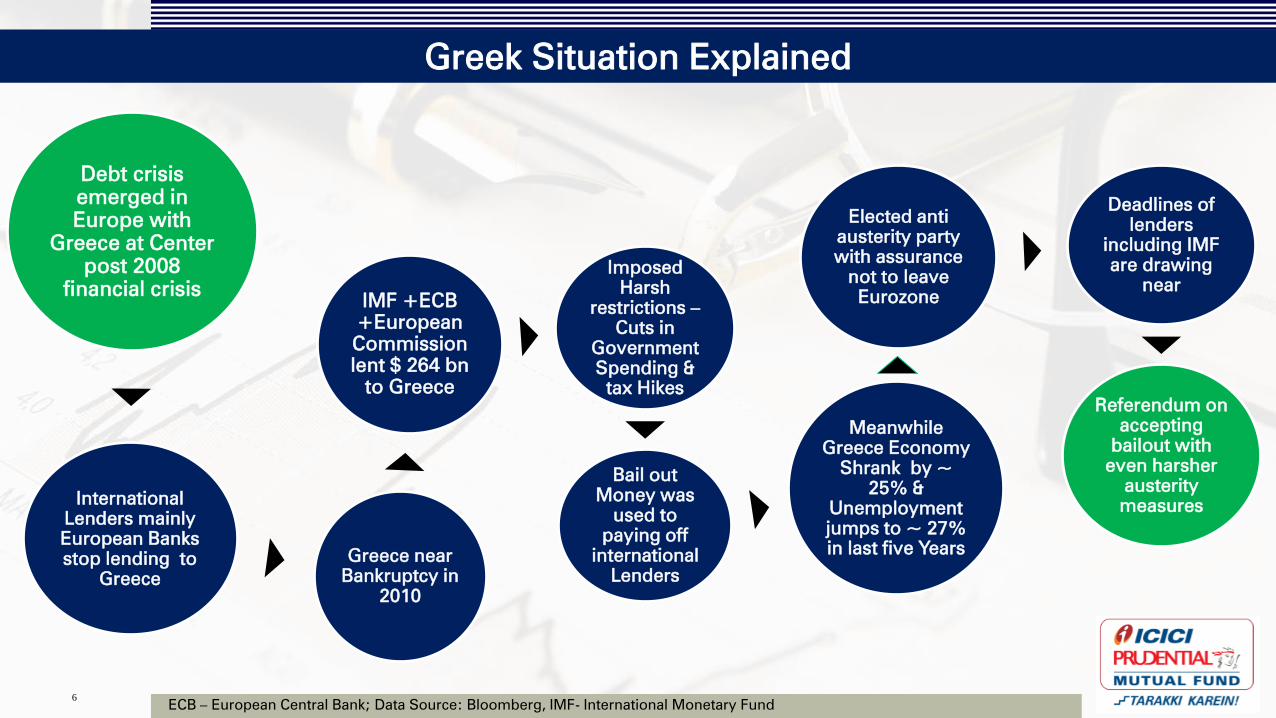
Greek Situation Explained
6
Debt crisis
emerged in
Europe with
Greece at Center
post 2008
financial crisis
International
Lenders mainly
European Banks
stop lending to
Greece
Greece near
Bankruptcy in
2010
IMF +ECB
+European
Commission
lent $ 264 bn
to Greece
Imposed
Harsh
restrictions –
Cuts in
Government
Spending &
tax Hikes
Bail out
Money was
used to
paying off
international
Lenders
Meanwhile
Greece Economy
Shrank by ~
25% &
Unemployment
jumps to ~ 27%
in last five Years
Elected anti
austerity party
with assurance
not to leave
Eurozone
Deadlines of
lenders
including IMF
are drawing
near
Referendum on
accepting
bailout with
even harsher
austerity
measures
ECB – European Central Bank; Data Source: Bloomberg, IMF- International Monetary Fund
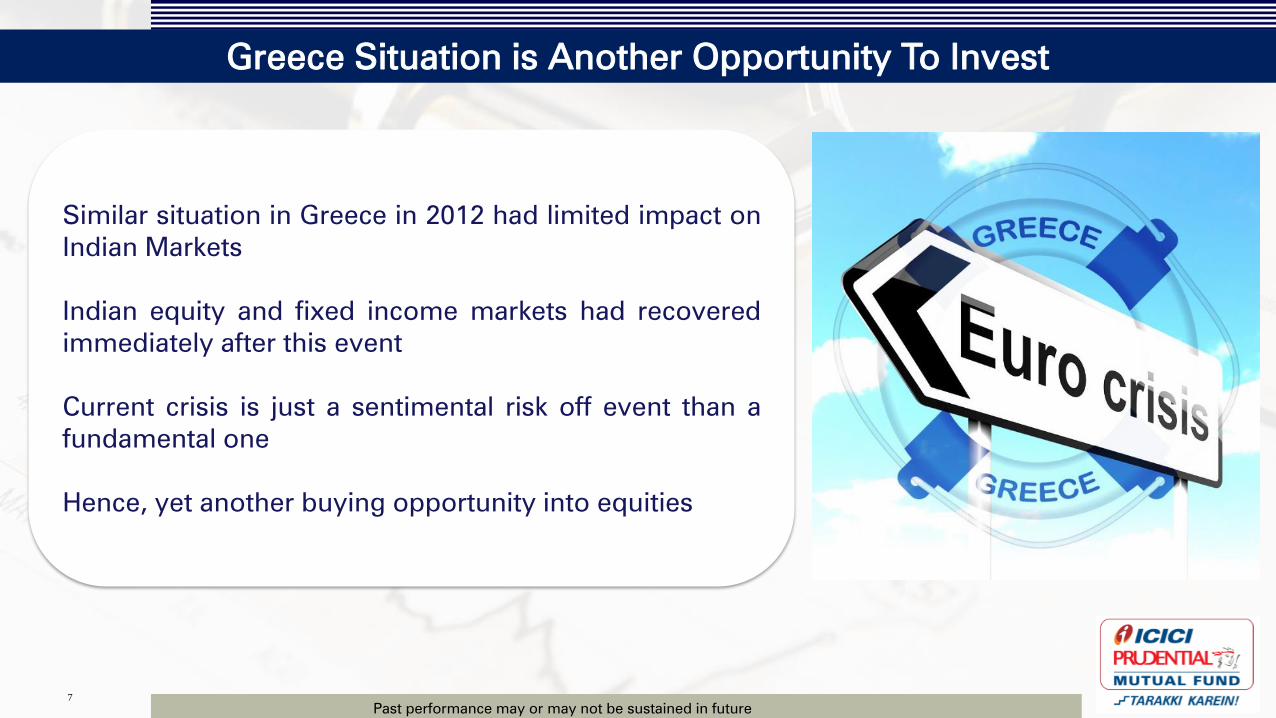
Greece Situation is Another Opportunity To Invest
7
Similar situation in Greece in 2012 had limited impact on
Indian Markets
Indian equity and fixed income markets had recovered
immediately after this event
Current crisis is just a sentimental risk off event than a
fundamental one
Hence, yet another buying opportunity into equities
Past performance may or may not be sustained in future
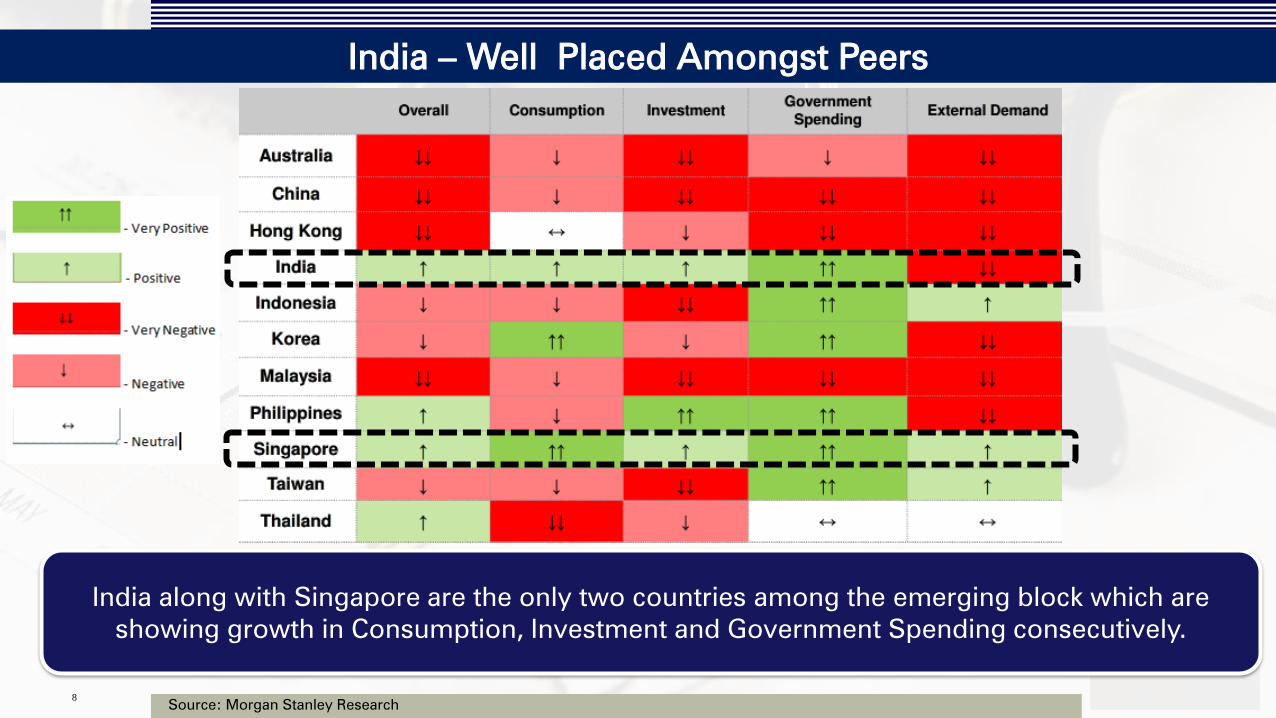
India – Well Placed Amongst Peers
Source: Morgan Stanley Research 8
India along with Singapore are the only two countries among the emerging block which are
showing growth in Consumption, Investment and Government Spending consecutively.
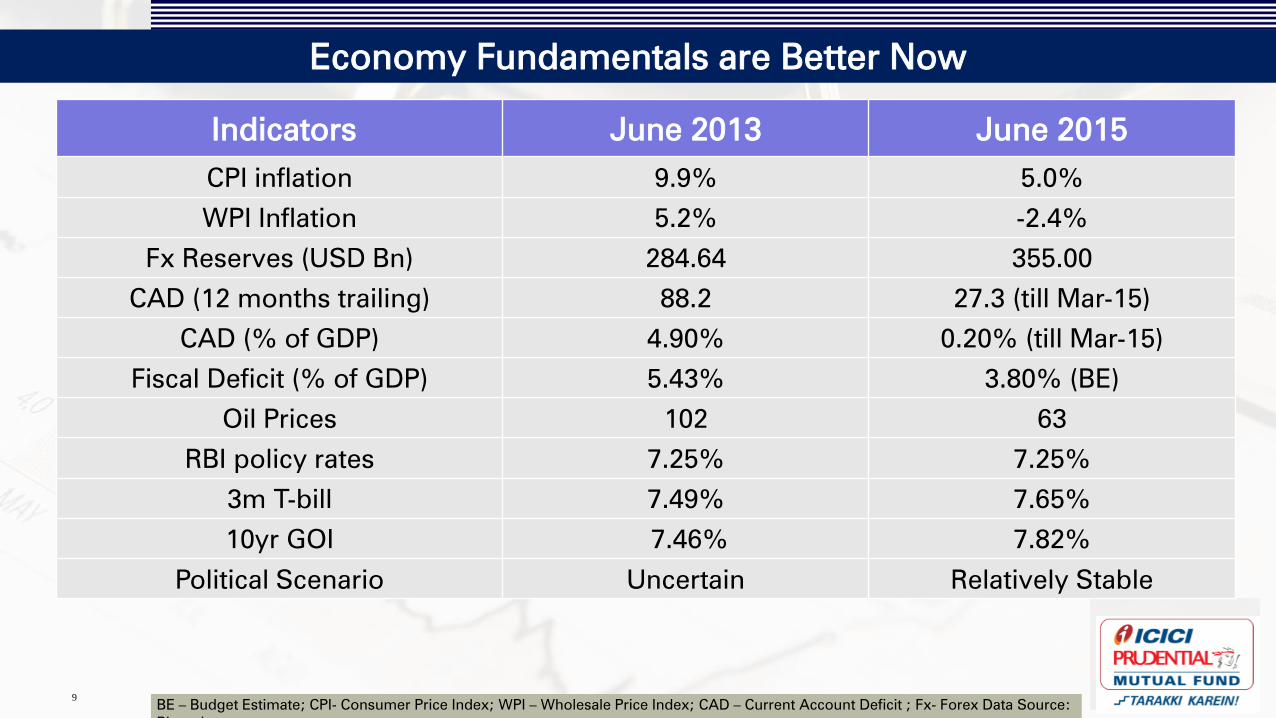
Economy Fundamentals are Better Now
9
Indicators June 2013 June 2015
CPI inflation 9.9% 5.0%
WPI Inflation 5.2% -2.4%
Fx Reserves (USD Bn) 284.64 355.00
CAD (12 months trailing) 88.2 27.3 (till Mar-15)
CAD (% of GDP) 4.90% 0.20% (till Mar-15)
Fiscal Deficit (% of GDP) 5.43% 3.80% (BE)
Oil Prices 102 63
RBI policy rates 7.25% 7.25%
3m T-bill 7.49% 7.65%
10yr GOI 7.46% 7.82%
Political Scenario Uncertain Relatively Stable
BE – Budget Estimate; CPI- Consumer Price Index; WPI – Wholesale Price Index; CAD – Current Account Deficit ; Fx- Forex Data Source:
Bloomberg
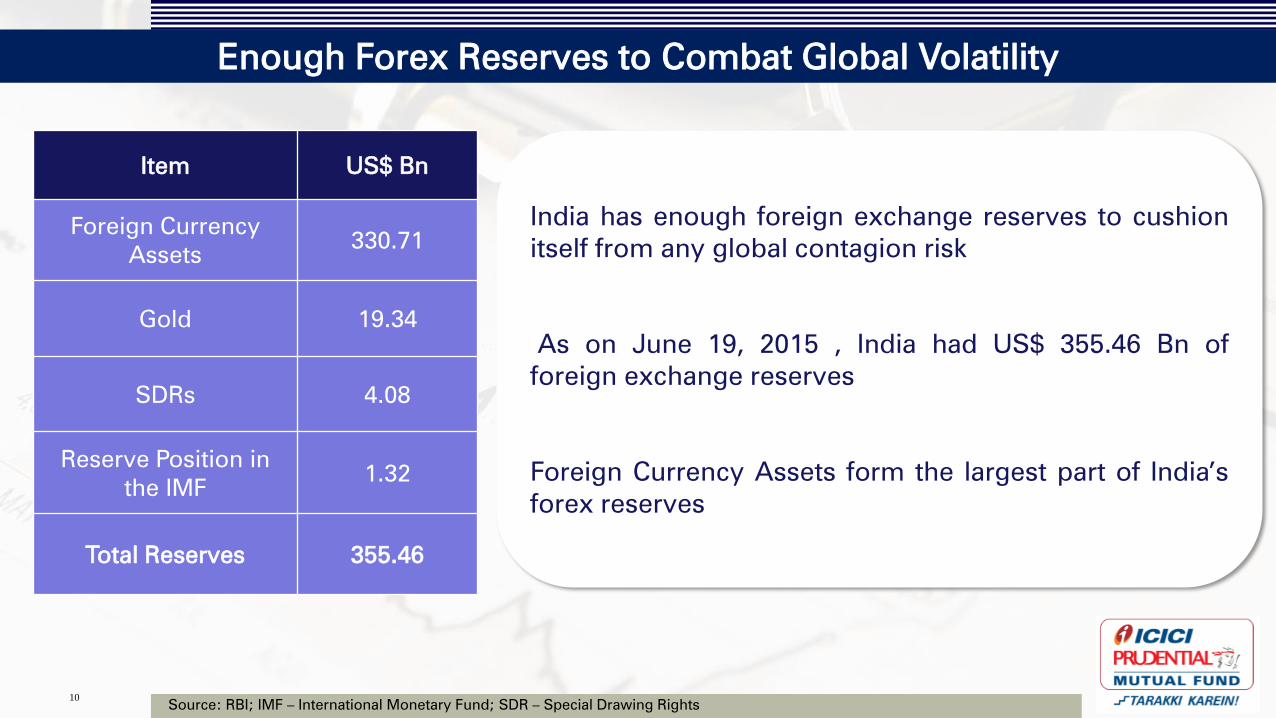
Enough Forex Reserves to Combat Global Volatility
10
India has enough foreign exchange reserves to cushion
itself from any global contagion risk
As on June 19, 2015 , India had US$ 355.46 Bn of
foreign exchange reserves
Foreign Currency Assets form the largest part of India’s
forex reserves
Item US$ Bn
Foreign Currency
Assets 330.71
Gold 19.34
SDRs 4.08
Reserve Position in
the IMF 1.32
Total Reserves 355.46
Source: RBI; IMF – International Monetary Fund; SDR – Special Drawing Rights
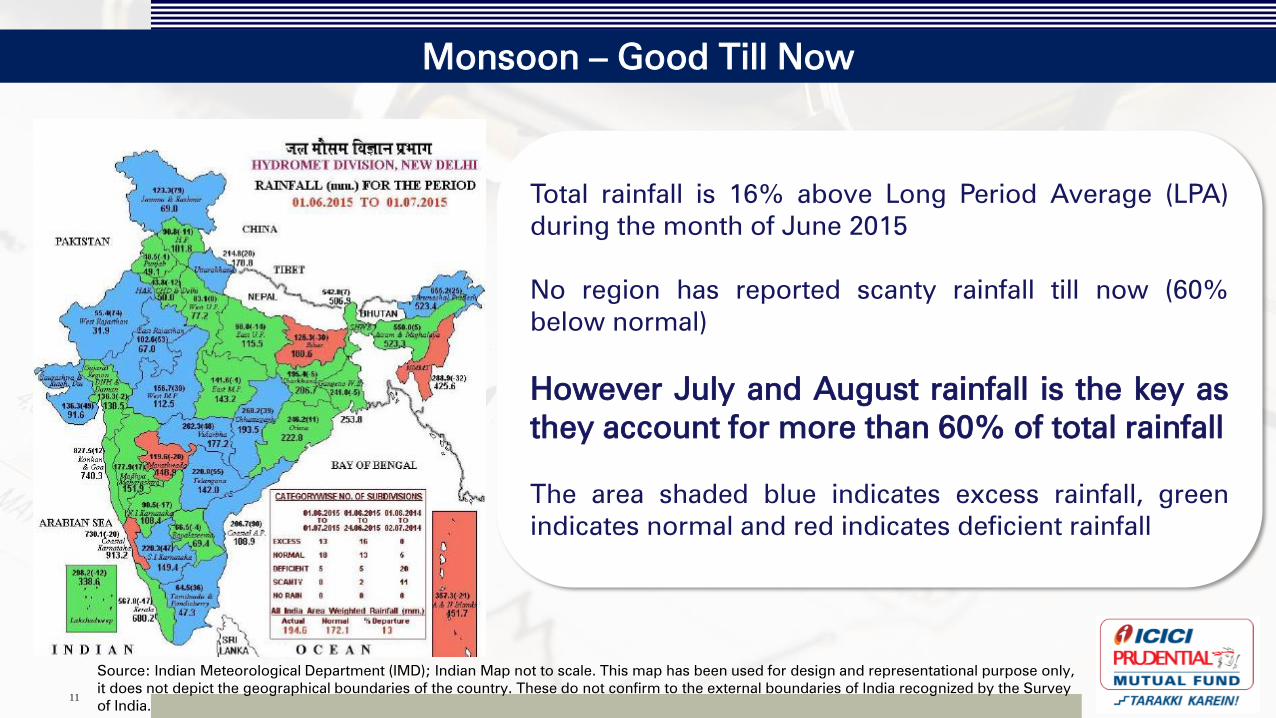
Monsoon – Good Till Now
11
Total rainfall is 16% above Long Period Average (LPA)
during the month of June 2015
No region has reported scanty rainfall till now (60%
below normal)
However July and August rainfall is the key as
they account for more than 60% of total rainfall
The area shaded blue indicates excess rainfall, green
indicates normal and red indicates deficient rainfall
Source: Indian Meteorological Department (IMD); Indian Map not to scale. This map has been used for design and representational purpose only,
it does not depict the geographical boundaries of the country. These do not confirm to the external boundaries of India recognized by the Survey
of India.
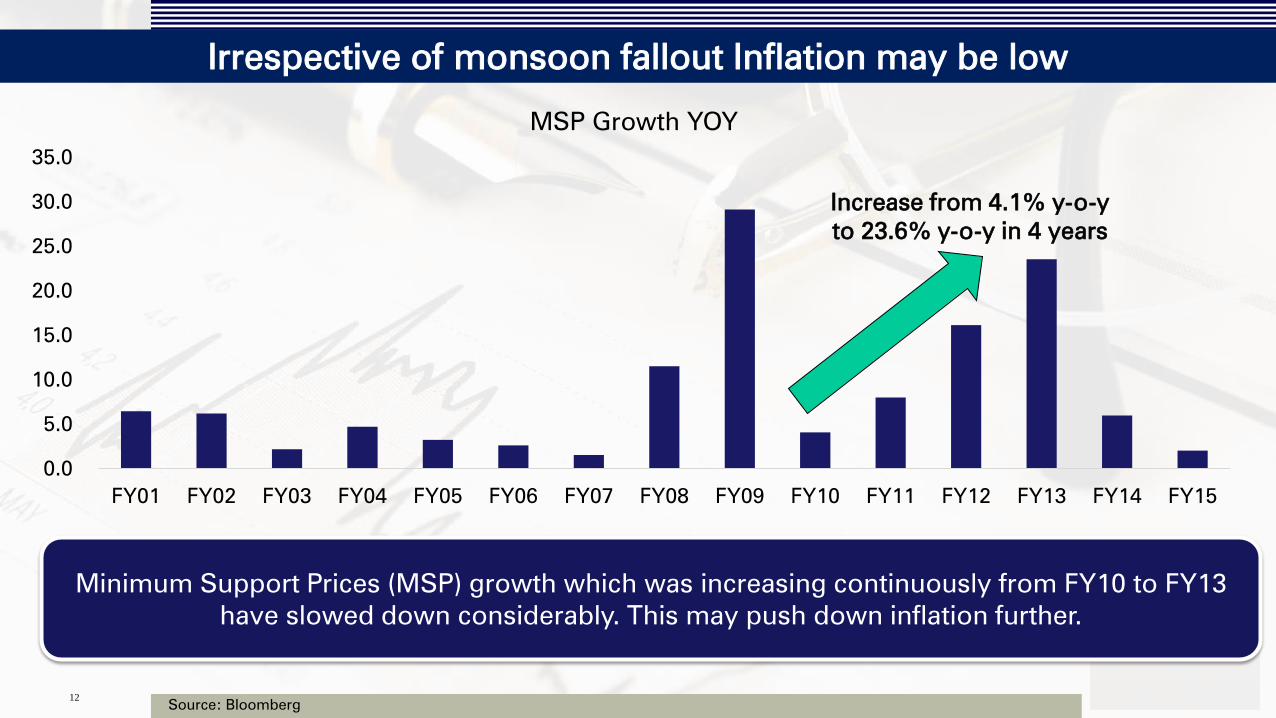
Irrespective of monsoon fallout Inflation may be low
Source: Bloomberg 12
Minimum Support Prices (MSP) growth which was increasing continuously from FY10 to FY13
have slowed down considerably. This may push down inflation further.
0.0
5.0
10.0
15.0
20.0
25.0
30.0
35.0
FY01 FY02 FY03 FY04 FY05 FY06 FY07 FY08 FY09 FY10 FY11 FY12 FY13 FY14 FY15
MSP Growth YOY
Increase from 4.1% y-o-y
to 23.6% y-o-y in 4 years
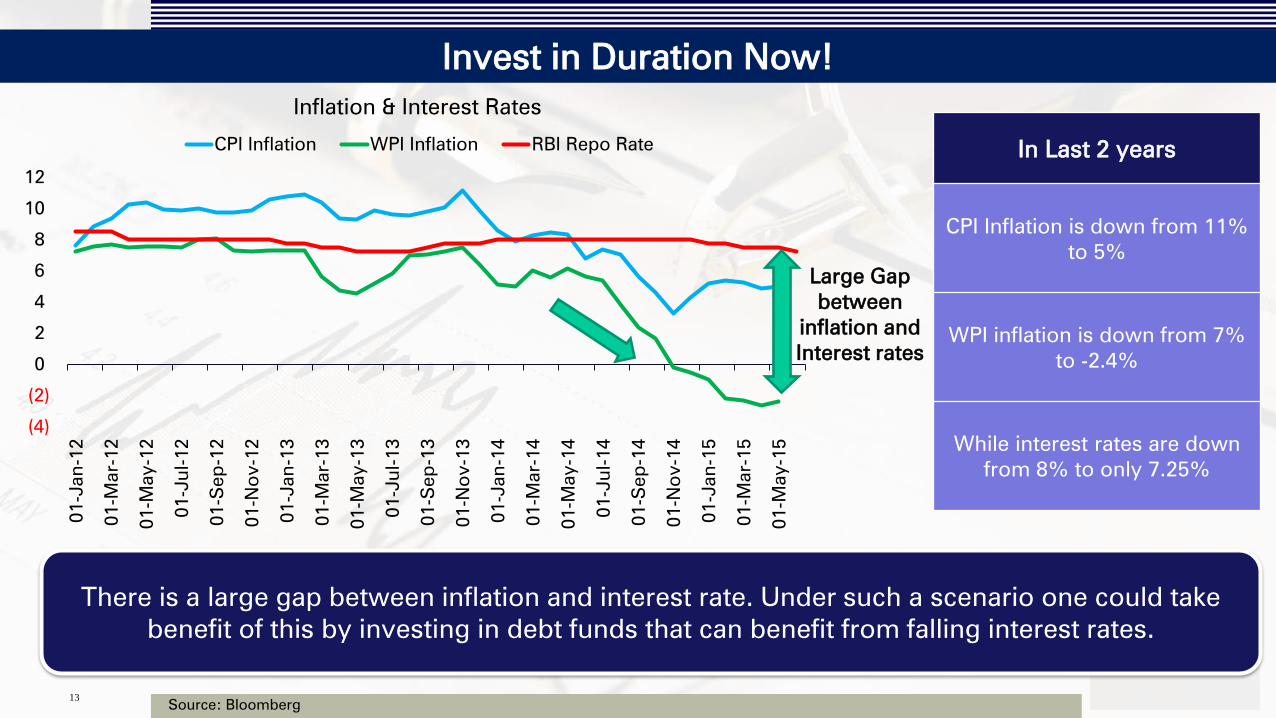
Invest in Duration Now!
Source: Bloomberg 13
There is a large gap between inflation and interest rate. Under such a scenario one could take
benefit of this by investing in debt funds that can benefit from falling interest rates.
(4)
(2)
0
2
4
6
8
10
12
01-Jan
-12
01-M
ar-12
01-M
ay-12
01-Ju
l-12
01-S
ep
-12
01-N
ov-12
01-Jan
-13
01-M
ar-13
01-M
ay-13
01-Ju
l-13
01-S
ep
-13
01-N
ov-13
01-Jan
-14
01-M
ar-14
01-M
ay-14
01-Ju
l-14
01-S
ep
-14
01-N
ov-14
01-Jan
-15
01-M
ar-15
01-M
ay-15
Inflation & Interest Rates
CPI Inflation WPI Inflation RBI Repo Rate
Large Gap
between
inflation and
Interest rates
In Last 2 years
CPI Inflation is down from 11%
to 5%
WPI inflation is down from 7%
to -2.4%
While interest rates are down
from 8% to only 7.25%
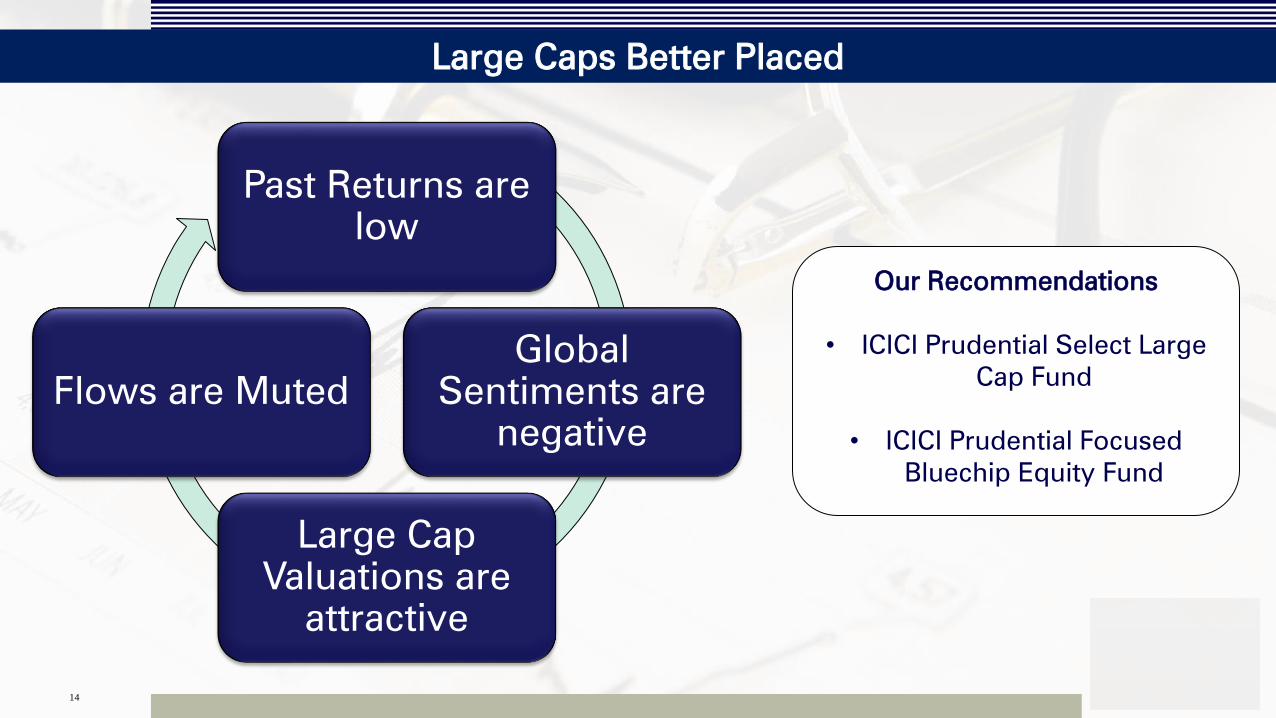
Large Caps Better Placed
14
Past Returns are
low
Global
Sentiments are
negative
Large Cap
Valuations are
attractive
Flows are Muted
Our Recommendations
• ICICI Prudential Select Large
Cap Fund
• ICICI Prudential Focused
Bluechip Equity Fund
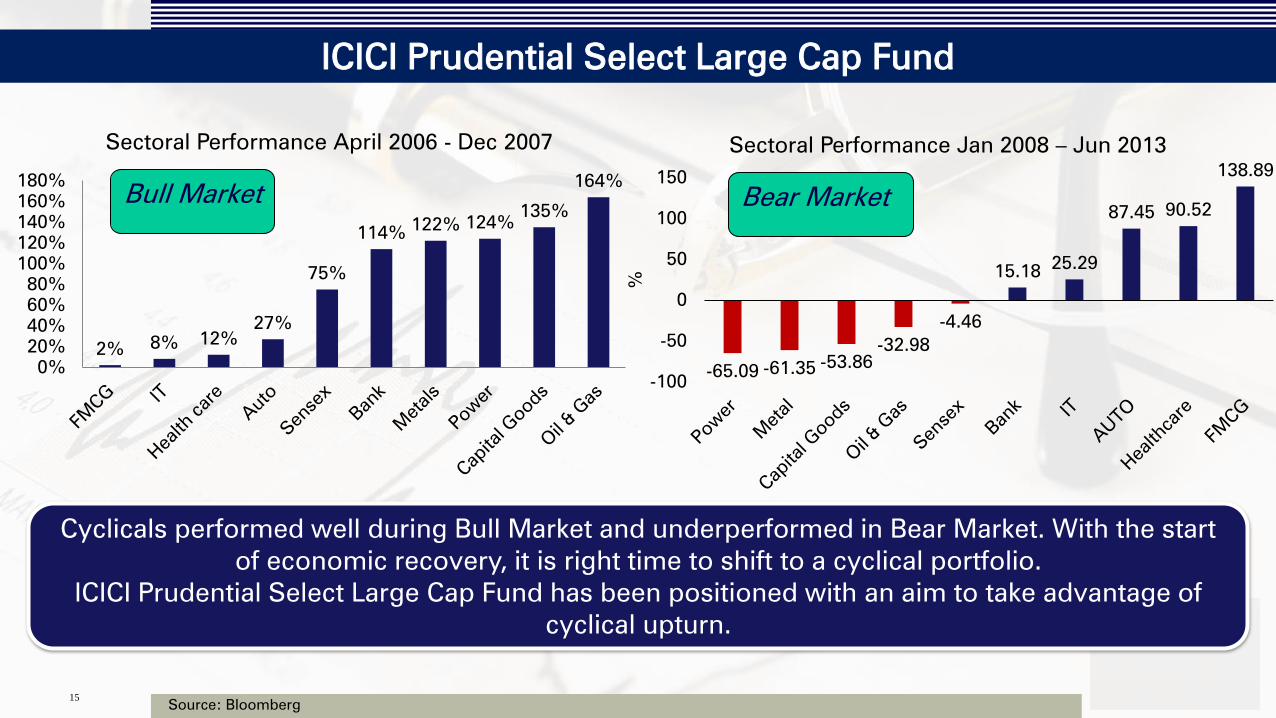
ICICI Prudential Select Large Cap Fund
Source: Bloomberg 15
Cyclicals performed well during Bull Market and underperformed in Bear Market. With the start
of economic recovery, it is right time to shift to a cyclical portfolio.
ICICI Prudential Select Large Cap Fund has been positioned with an aim to take advantage of
cyclical upturn.
2% 8% 12%
27%
75%
114% 122% 124%
135%
164%
0%
20%
40%
60%
80%
100%
120%
140%
160%
180%
Sectoral Performance April 2006 - Dec 2007
Bull Market Bear Market
-65.09 -61.35 -53.86
-32.98
-4.46
15.18 25.29
87.45 90.52
138.89
-100
-50
0
50
100
150
%
Sectoral Performance Jan 2008 – Jun 2013
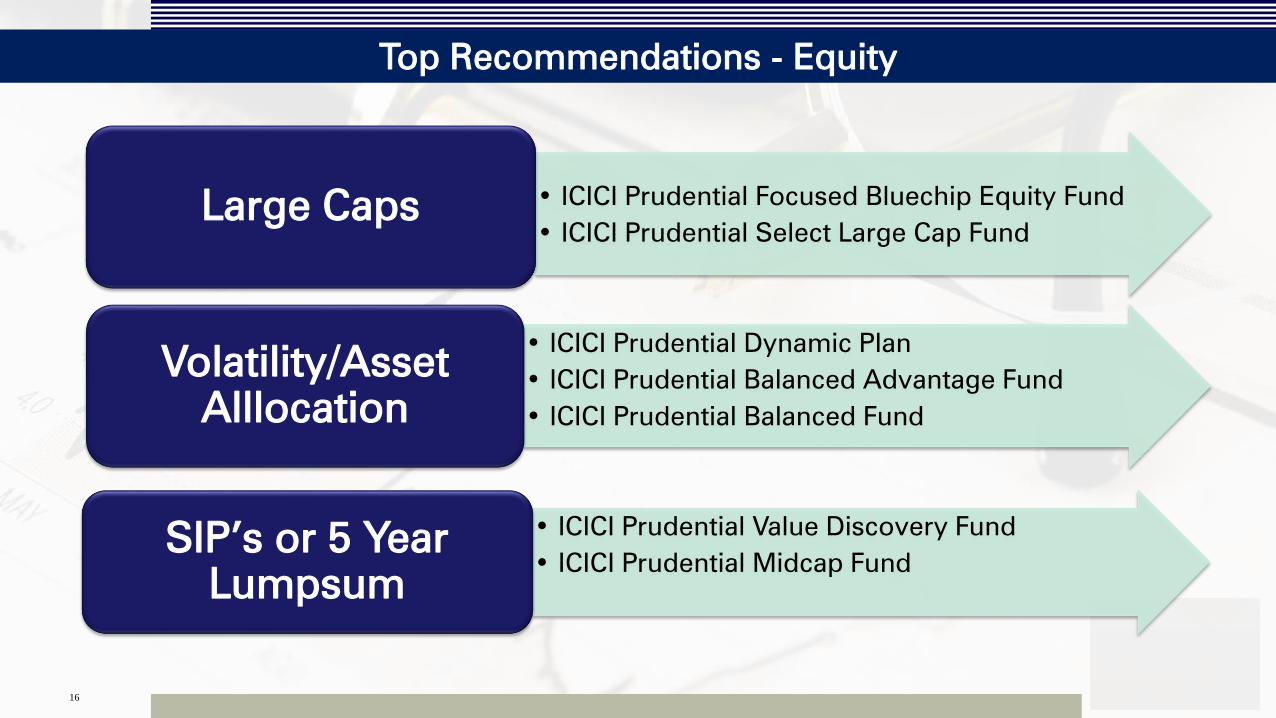
Top Recommendations - Equity
16
• ICICI Prudential Focused Bluechip Equity Fund
• ICICI Prudential Select Large Cap Fund
Large Caps
• ICICI Prudential Dynamic Plan
• ICICI Prudential Balanced Advantage Fund
• ICICI Prudential Balanced Fund
Volatility/Asset
Alllocation
• ICICI Prudential Value Discovery Fund
• ICICI Prudential Midcap Fund
SIP’s or 5 Year
Lumpsum
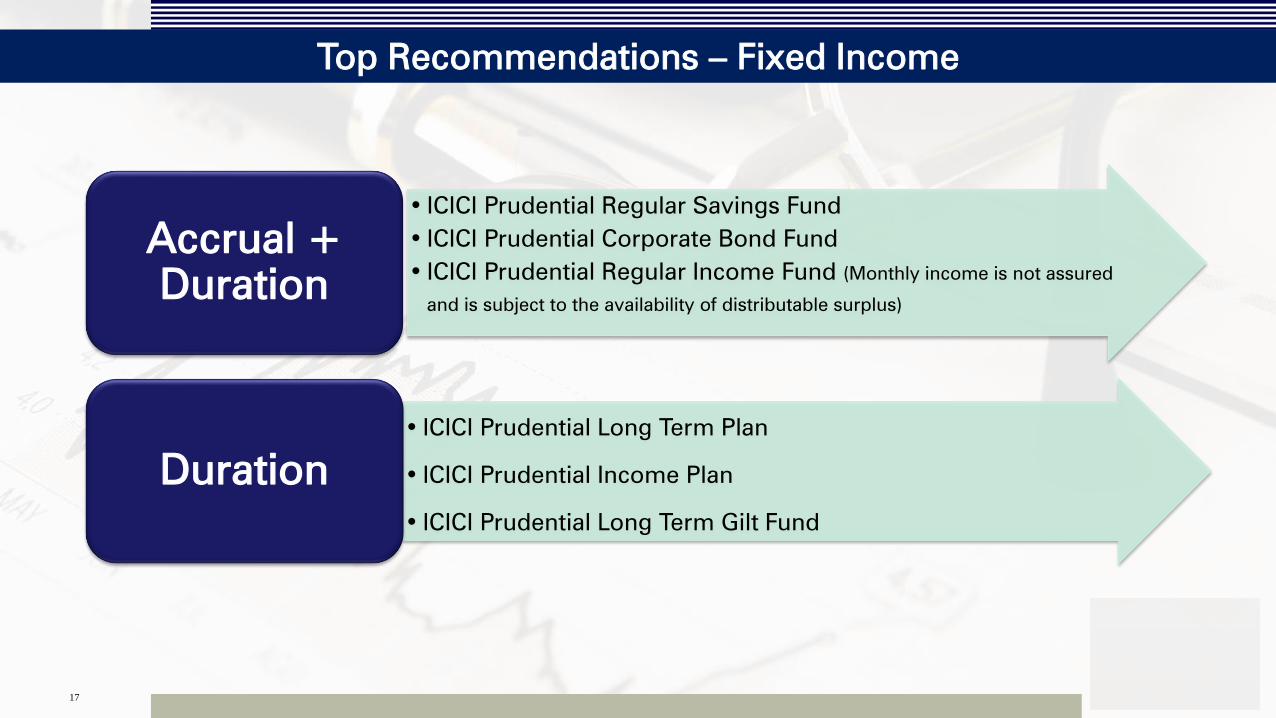
Top Recommendations – Fixed Income
17
• ICICI Prudential Regular Savings Fund
• ICICI Prudential Corporate Bond Fund
• ICICI Prudential Regular Income Fund (Monthly income is not assured
and is subject to the availability of distributable surplus)
Accrual +
Duration
• ICICI Prudential Long Term Plan
• ICICI Prudential Income Plan
• ICICI Prudential Long Term Gilt Fund
Duration
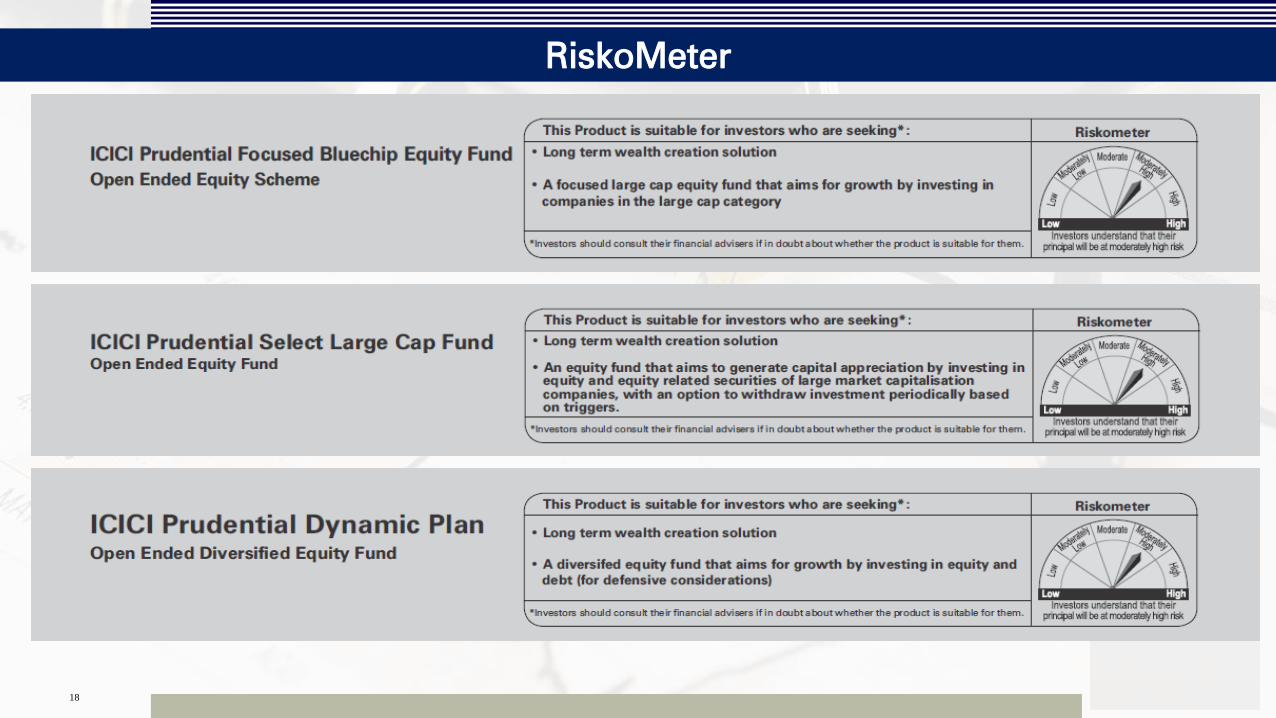
RiskoMeter
18
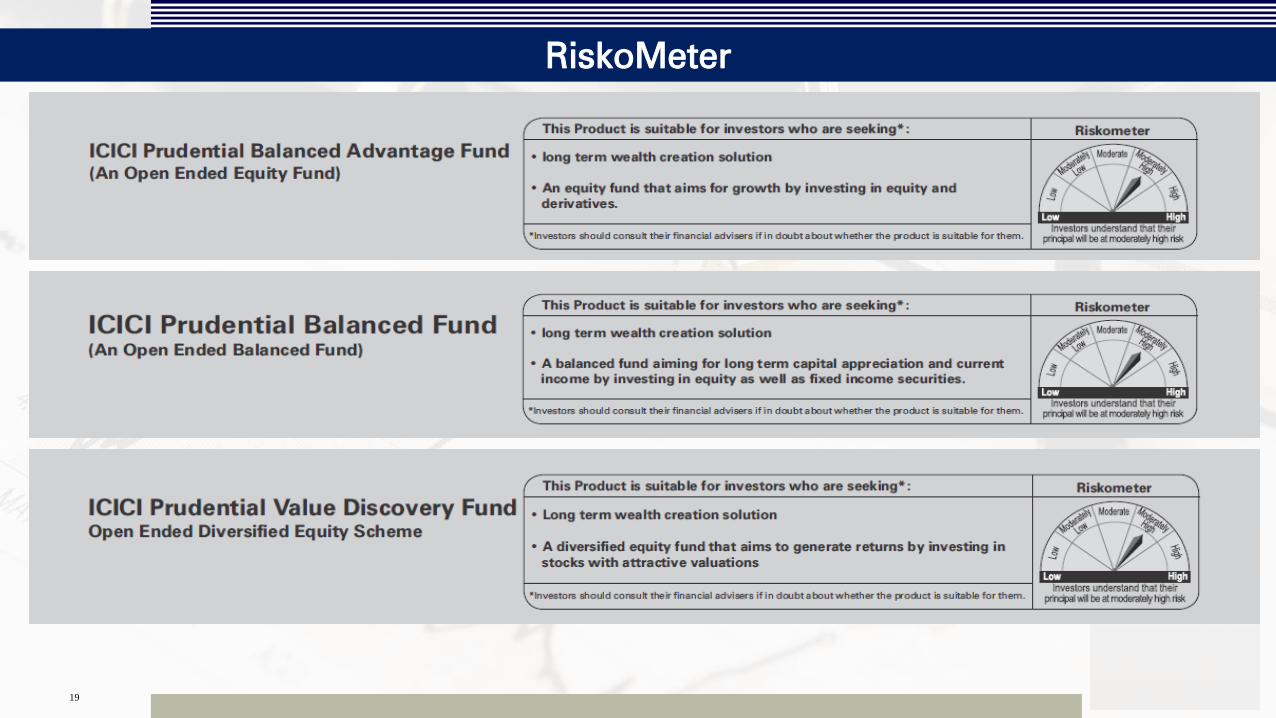
RiskoMeter
19
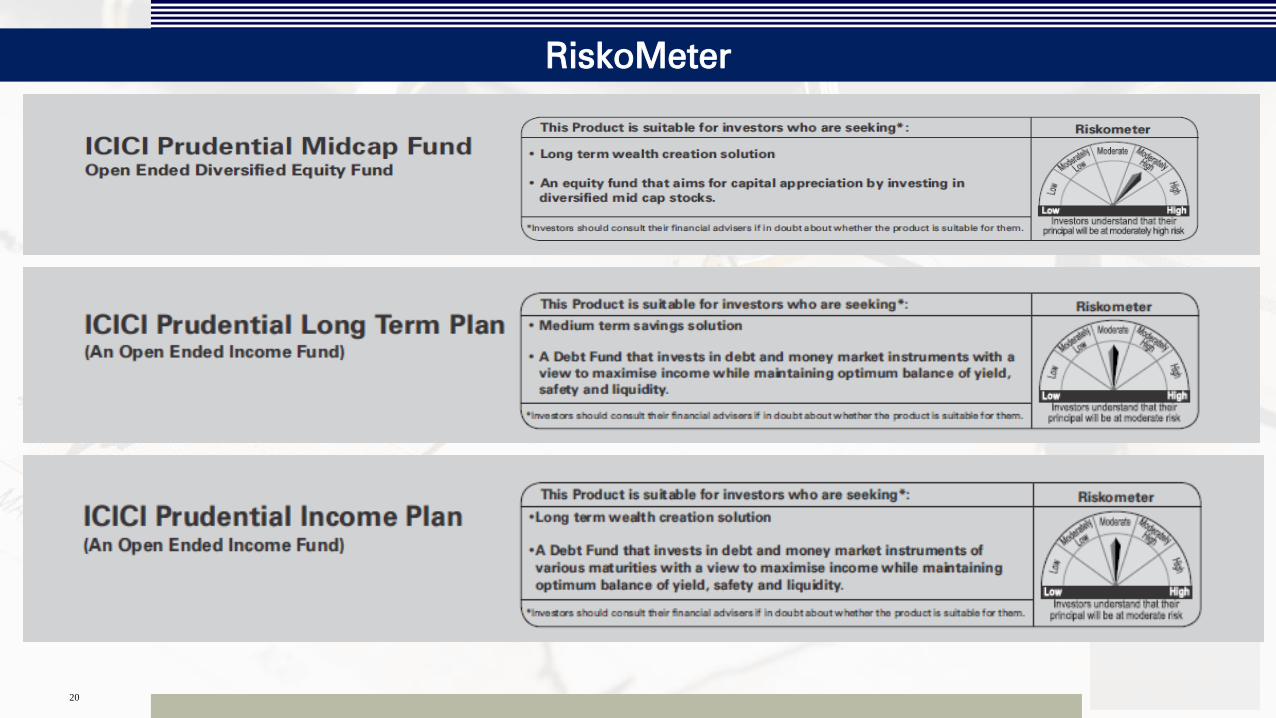
RiskoMeter
20
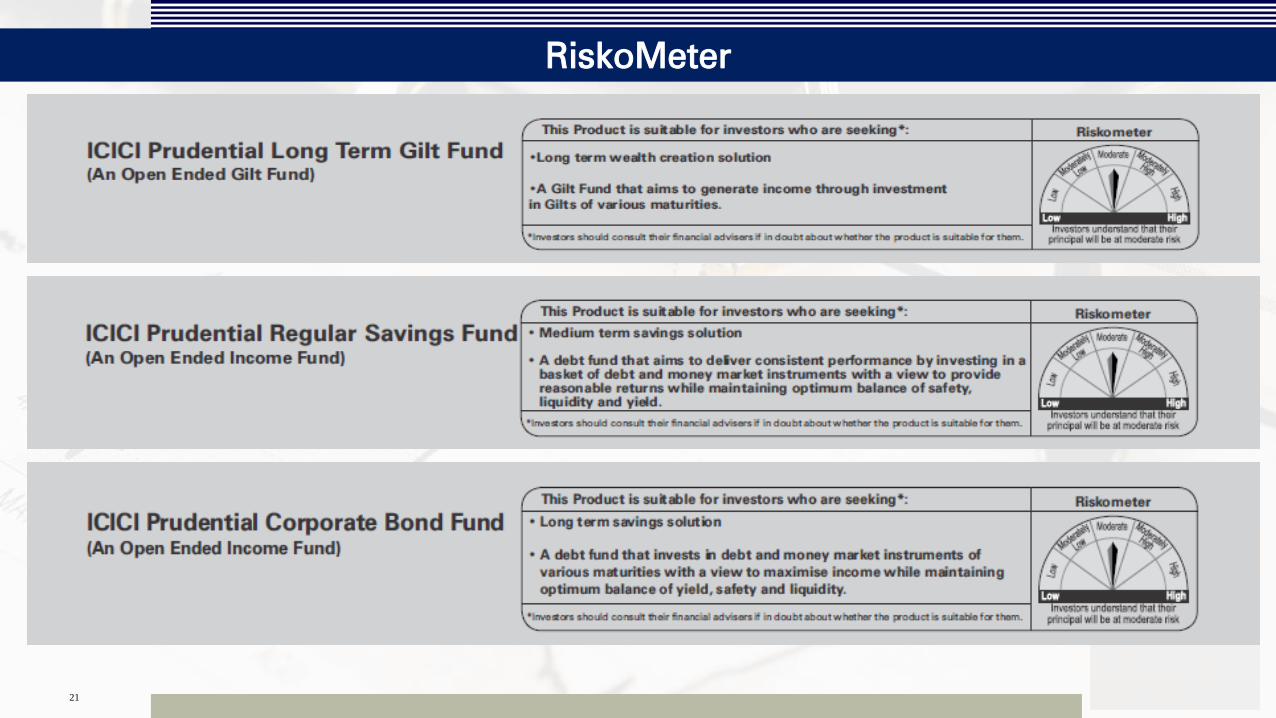
RiskoMeter
21
Disclaimer
22
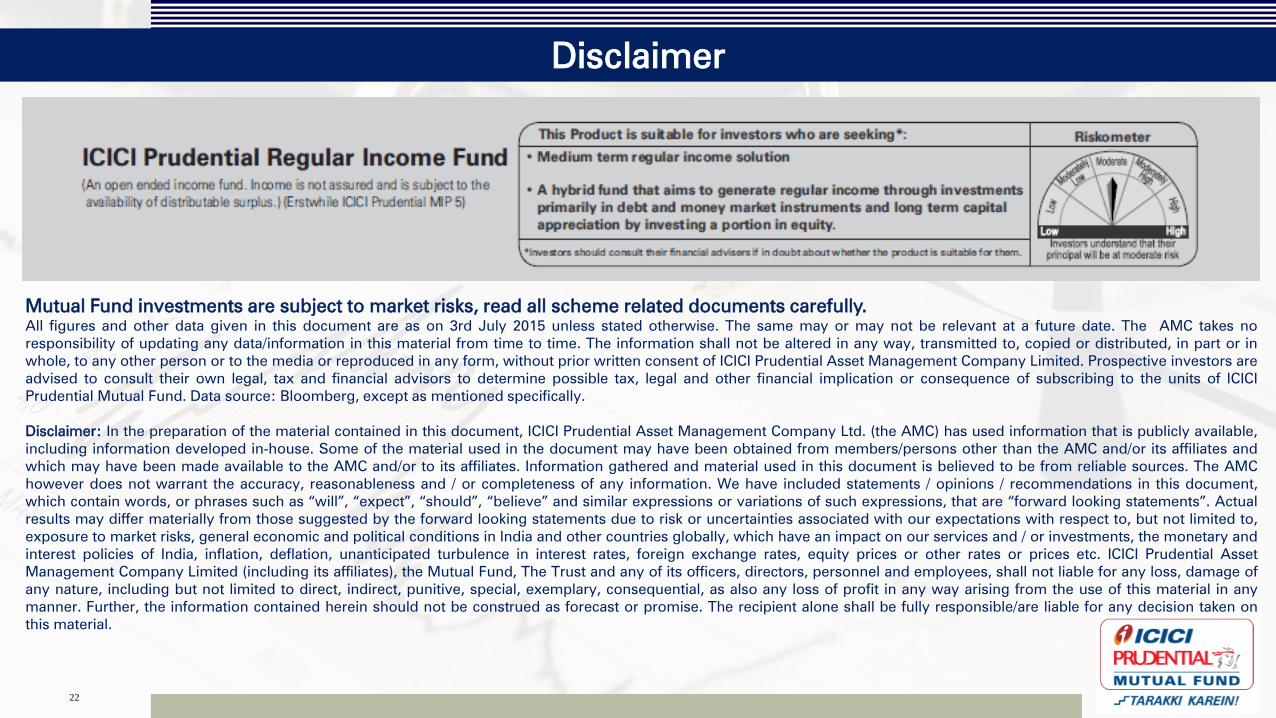
Mutual Fund investments are subject to market risks, read all scheme related documents carefully.
All figures and other data given in this document are as on 3rd July 2015 unless stated otherwise. The same may or may not be relevant at a future date. The AMC takes no
responsibility of updating any data/information in this material from time to time. The information shall not be altered in any way, transmitted to, copied or distributed, in part or in
whole, to any other person or to the media or reproduced in any form, without prior written consent of ICICI Prudential Asset Management Company Limited. Prospective investors are
advised to consult their own legal, tax and financial advisors to determine possible tax, legal and other financial implication or consequence of subscribing to the units of ICICI
Prudential Mutual Fund. Data source: Bloomberg, except as mentioned specifically.
Disclaimer: In the preparation of the material contained in this document, ICICI Prudential Asset Management Company Ltd. (the AMC) has used information that is publicly available,
including information developed in-house. Some of the material used in the document may have been obtained from members/persons other than the AMC and/or its affiliates and
which may have been made available to the AMC and/or to its affiliates. Information gathered and material used in this document is believed to be from reliable sources. The AMC
however does not warrant the accuracy, reasonableness and / or completeness of any information. We have included statements / opinions / recommendations in this document,
which contain words, or phrases such as “will”, “expect”, “should”, “believe” and similar expressions or variations of such expressions, that are “forward looking statements”. Actual
results may differ materially from those suggested by the forward looking statements due to risk or uncertainties associated with our expectations with respect to, but not limited to,
exposure to market risks, general economic and political conditions in India and other countries globally, which have an impact on our services and / or investments, the monetary and
interest policies of India, inflation, deflation, unanticipated turbulence in interest rates, foreign exchange rates, equity prices or other rates or prices etc. ICICI Prudential Asset
Management Company Limited (including its affiliates), the Mutual Fund, The Trust and any of its officers, directors, personnel and employees, shall not liable for any loss, damage of
any nature, including but not limited to direct, indirect, punitive, special, exemplary, consequential, as also any loss of profit in any way arising from the use of this material in any
manner. Further, the information contained herein should not be construed as forecast or promise. The recipient alone shall be fully responsible/are liable for any decision taken on
this material.