monthly performance pack july 2010
TRANSCRIPT
1
Please refer to slide 6 for guide footnotes.
Monthly Performance Pack
July 2010
Sheryl Holland, Publicist, BBC iPlayerBBC Marketing, Communications & AudiencesT. 020 8008 5294 | M. 07912 583654 | E. [email protected]
2
Please refer to slide 6 for guide footnotes.
Monthly summary – July 2010
• In total the BBC iPlayer received 114 million requests for programmes across all platforms in July 2010, including both online platforms and devices and BBC iPlayer on Virgin Media TV. Requests still remain significantly higher than July 2009 with 68 million requests for TV programmes and 27 million were for radio programmes, whilst requests on Virgin Media were up to 19 million.
• BBC iPlayer’s most-requested TV title for July was Top Gear, with some episodes attracting over 1 million requests each. New BBC one drama titles also performed well, as did comedy, as usual and the start of the BBC Three Adult Season.
• Live TV viewing via the BBC iPlayer fell back to relatively normal levels in July as the World Cup came to a close.
Consistent with previous months:
• The profile of BBC iPlayer users is evening out over time in terms of male/female ratio, but remains strongly under-55 in terms of age, which is younger than the typical TV viewer or radio listener’s profile.
• On-demand makes up the great majority of TV programme requests (in July, 10% of requests were for live simulcast streams), however about 68% of requests for radio streams are for live programmes, as opposed to on-demand catch-up listening.
• BBC iPlayer is used for TV at roughly the same time of day as linear TV viewing, although there is proportionally more daytime and late-peak use. For radio, BBC iPlayer is used far more in daytime than traditional radio listening, which peaks at breakfast-time.
3
Please refer to slide 6 for guide footnotes.
IndexPage
Overview for BBC iPlayer across all platforms 4
Monthly requests 7
Average daily requests 8
Average daily users 9
Weekly requests 10
Weekly users 11
Minutes per user per week 12
Top TV programmes 13
Top radio programmes 14
Live vs on-demand 15
Use of BBC iPlayer for TV by time of day 16
Use of BBC iPlayer for radio by time of day 17
Profile of BBC iPlayer users 18
Glossary 19
4
Please refer to slide 6 for guide footnotes.
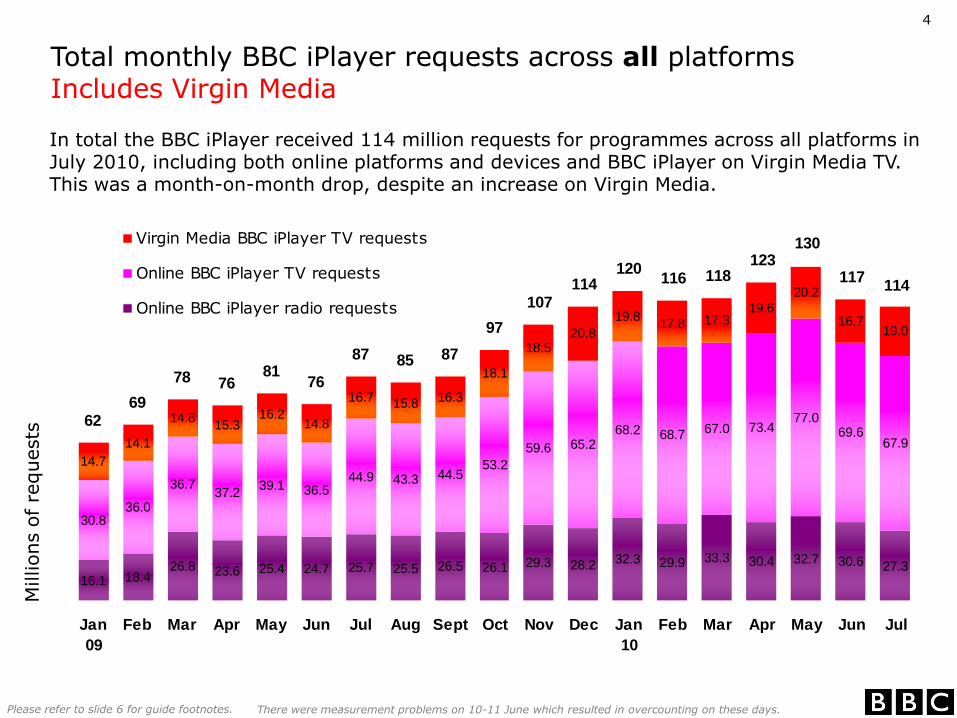
Total monthly BBC iPlayer requests across all platformsIncludes Virgin Media
Millions o
f re
quests
16.1 18.426.8 23.6 25.4 24.7 25.7 25.5 26.5 26.1 29.3 28.2 32.3 29.9 33.3 30.4 32.7 30.6 27.3
30.836.0
36.737.2
39.1 36.544.9 43.3 44.5
53.2
59.6 65.268.2 68.7 67.0 73.4
77.069.6
67.9
14.7
14.1
14.815.3
16.214.8
16.7 15.8 16.3
18.1
18.520.8
19.817.8 17.3
19.6
20.2
16.719.0
6269
78 7681
76
87 85 87
97
107114
120116 118
123130
117114
Jan
09
Feb Mar Apr May Jun Jul Aug Sept Oct Nov Dec Jan
10
Feb Mar Apr May Jun Jul
Virgin Media BBC iPlayer TV requests
Online BBC iPlayer TV requests
Online BBC iPlayer radio requests
In total the BBC iPlayer received 114 million requests for programmes across all platforms in July 2010, including both online platforms and devices and BBC iPlayer on Virgin Media TV. This was a month-on-month drop, despite an increase on Virgin Media.
There were measurement problems on 10-11 June which resulted in overcounting on these days.
5
Please refer to slide 6 for guide footnotes.
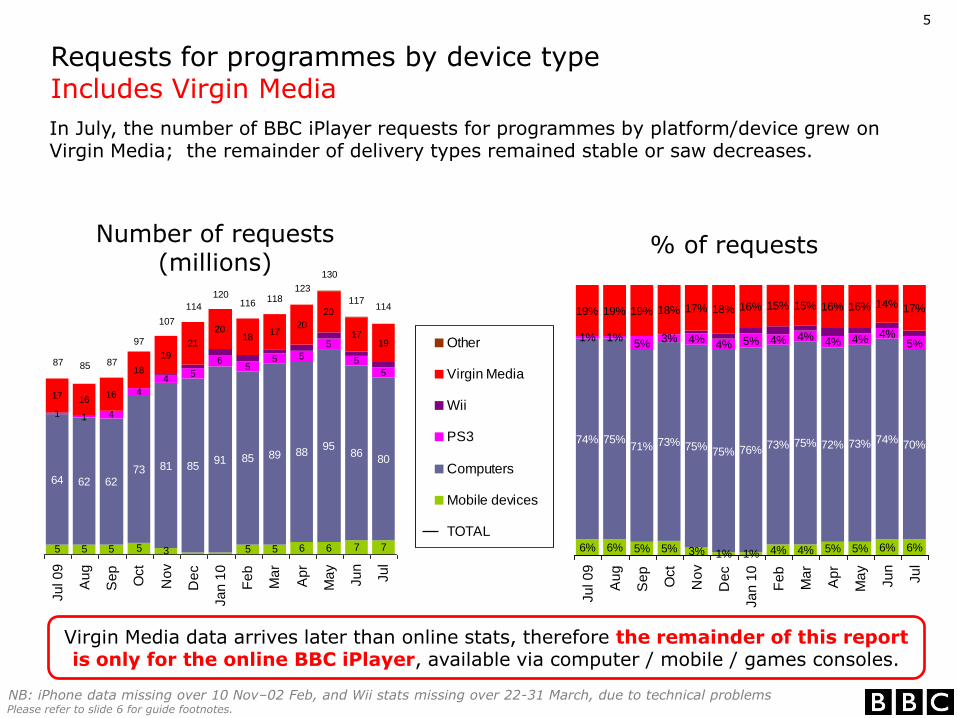
Requests for programmes by device typeIncludes Virgin Media
% of requests
In July, the number of BBC iPlayer requests for programmes by platform/device grew on Virgin Media; the remainder of delivery types remained stable or saw decreases.
NB: iPhone data missing over 10 Nov–02 Feb, and Wii stats missing over 22-31 March, due to technical problems
Number of requests (millions)
Virgin Media data arrives later than online stats, therefore the remainder of this report is only for the online BBC iPlayer, available via computer / mobile / games consoles.
6% 6% 5% 5% 3% 1% 1% 4% 4% 5% 5% 6% 6%
74% 75%71% 73% 75% 75% 76% 73% 75% 72% 73% 74% 70%
1% 1%5% 3% 4% 4% 5% 4% 4% 4% 4% 4%
5%
19% 19% 19% 18% 17% 18% 16% 15% 15% 16% 16% 14% 17%
Ju
l 0
9
Au
g
Se
p
Oct
No
v
De
c
Ja
n 1
0
Fe
b
Ma
r
Ap
r
Ma
y
Ju
n
Ju
l
5 5 5 5 3 5 5 6 6 7 7
64 62 6273 81 85
91 85 89 8895
8680
1 1 4
4
45
65
5 5
5
5
5
17 1616
18
19
1817
20
20
171921
20
87 85 87
97
107
114
120116 118
123
130
117114
Ju
l 0
9
Au
g
Se
p
Oct
No
v
De
c
Ja
n 1
0
Fe
b
Ma
r
Ap
r
Ma
y
Ju
n
Ju
l
Other
Virgin Media
Wii
PS3
Computers
Mobile devices
TOTAL
6
Please refer to slide 6 for guide footnotes.
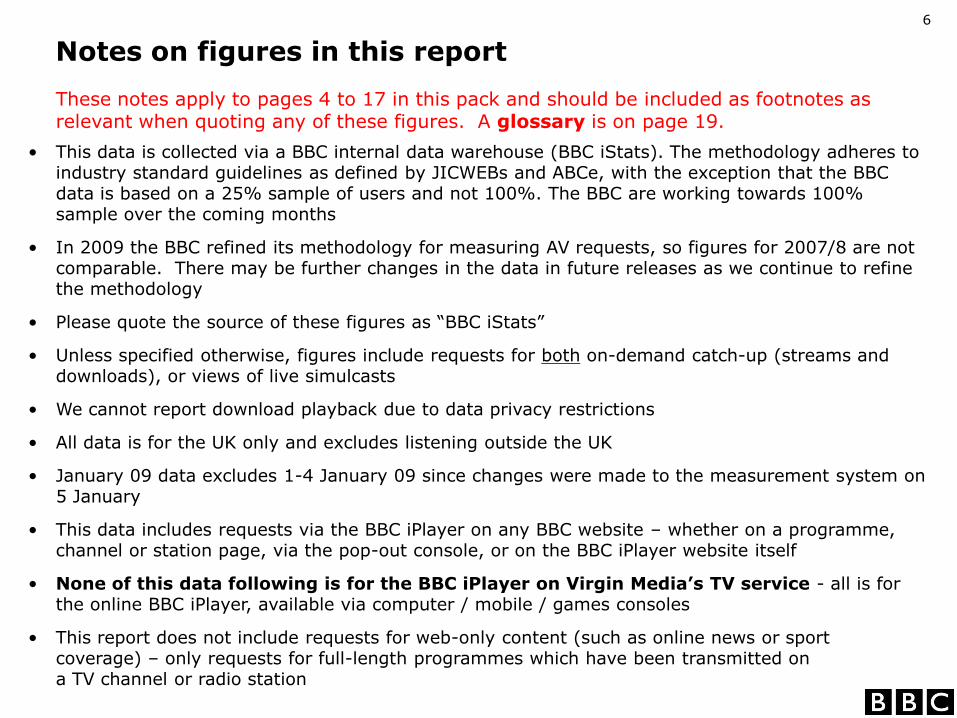
Notes on figures in this report
These notes apply to pages 4 to 17 in this pack and should be included as footnotes as relevant when quoting any of these figures. A glossary is on page 19.
• This data is collected via a BBC internal data warehouse (BBC iStats). The methodology adheres to industry standard guidelines as defined by JICWEBs and ABCe, with the exception that the BBC data is based on a 25% sample of users and not 100%. The BBC are working towards 100% sample over the coming months
• In 2009 the BBC refined its methodology for measuring AV requests, so figures for 2007/8 are not comparable. There may be further changes in the data in future releases as we continue to refine the methodology
• Please quote the source of these figures as “BBC iStats”
• Unless specified otherwise, figures include requests for both on-demand catch-up (streams and downloads), or views of live simulcasts
• We cannot report download playback due to data privacy restrictions
• All data is for the UK only and excludes listening outside the UK
• January 09 data excludes 1-4 January 09 since changes were made to the measurement system on 5 January
• This data includes requests via the BBC iPlayer on any BBC website – whether on a programme, channel or station page, via the pop-out console, or on the BBC iPlayer website itself
• None of this data following is for the BBC iPlayer on Virgin Media’s TV service - all is for the online BBC iPlayer, available via computer / mobile / games consoles
• This report does not include requests for web-only content (such as online news or sport coverage) – only requests for full-length programmes which have been transmitted on a TV channel or radio station
7
Please refer to slide 6 for guide footnotes.
30.836.0 36.7 37.1 39.1 36.5
44.9 43.3 44.553.2
59.665.2 68.2 68.7 67.4
73.4 77.069.6 67.9
16.1
18.426.8 23.6
25.424.7
25.7 25.5 26.5
26.1
29.328.2
32.3 29.9 33.830.4
32.7
30.627.3
47
54
6361
6561
71 69 71
79
8993
101 99101
104110
10095
0
20
40
60
80
100
120
Jan09
Feb Mar Apr May Jun Jul Aug Sep Oct Nov Dec Jan10
Feb Mar Apr May Jun Jul
Month
ly R
equests
(m
illions) .
Radio Requests
TV Requests
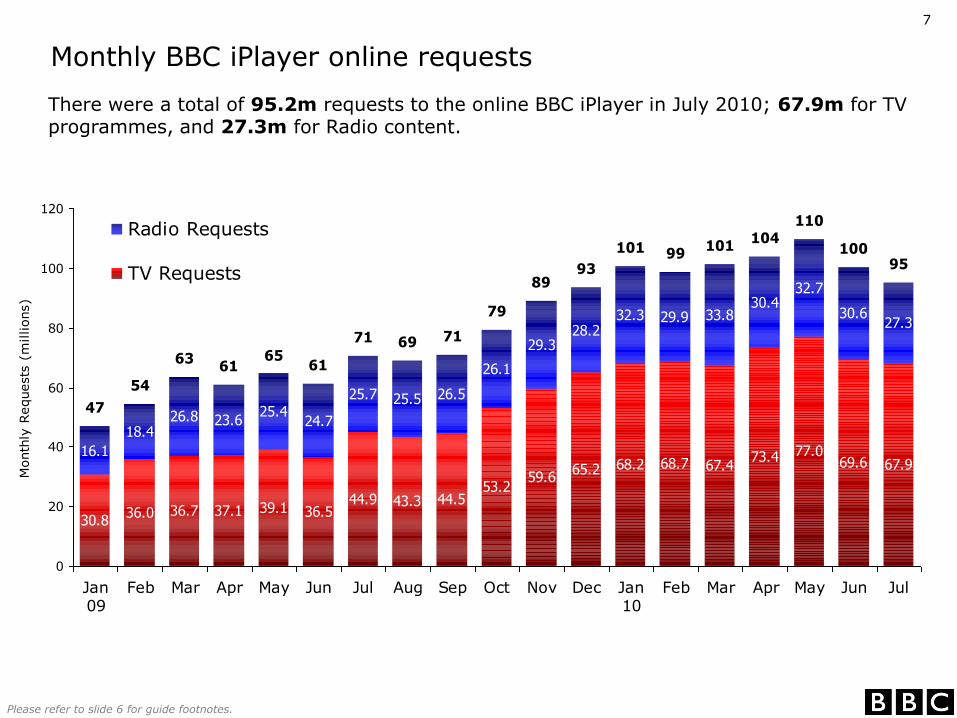
Monthly BBC iPlayer online requests
There were a total of 95.2m requests to the online BBC iPlayer in July 2010; 67.9m for TV programmes, and 27.3m for Radio content.
8
Please refer to slide 6 for guide footnotes.
1.11.3 1.2 1.2 1.3 1.2
1.5 1.4 1.51.7
2.0 2.1 2.22.5
2.22.4 2.5
2.3 2.2
0.60.7 0.9 0.8 0.8 0.8
0.8 0.80.9
0.8
1.0 0.91.0
1.1
1.11.0
1.1
1.00.9
1.7
1.92.1 2.0 2.1 2.0
2.3 2.22.4
2.6
2.93.0
3.2
3.5
3.3
3.1
3.5
3.2
3.5
0
1
2
3
4
Jan
09
Feb Mar Apr May Jun Jul Aug Sep Oct Nov Dec Jan
10
Feb Mar Apr May Jun Jul
Avera
ge D
aily R
equests
(m
illions) .
Radio Requests
TV Requests
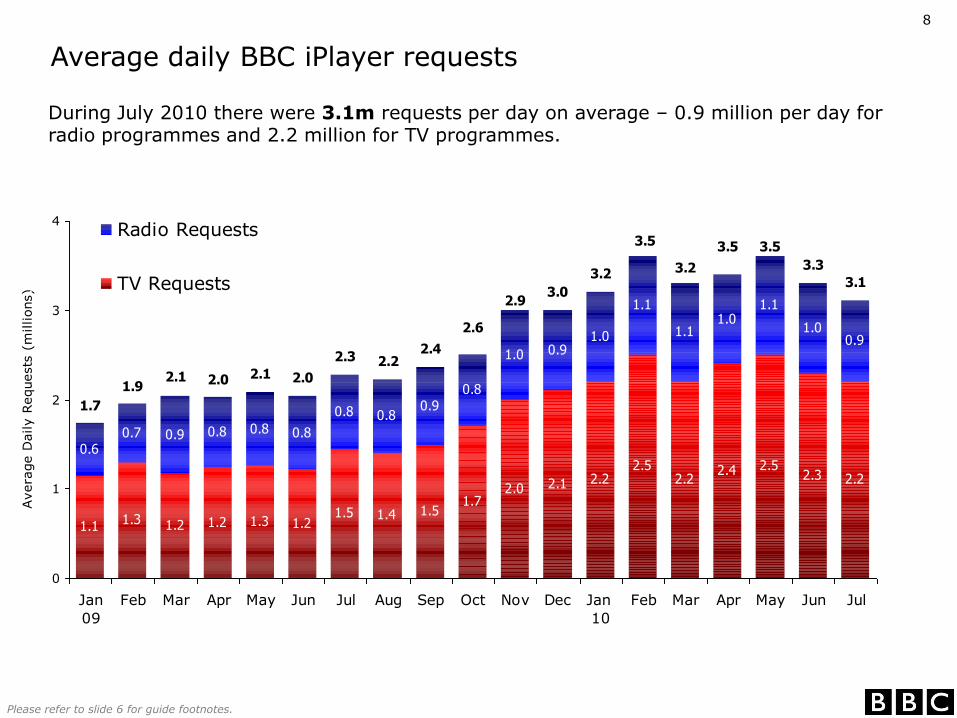
During July 2010 there were 3.1m requests per day on average – 0.9 million per day for radio programmes and 2.2 million for TV programmes.
Average daily BBC iPlayer requests
9
Please refer to slide 6 for guide footnotes.
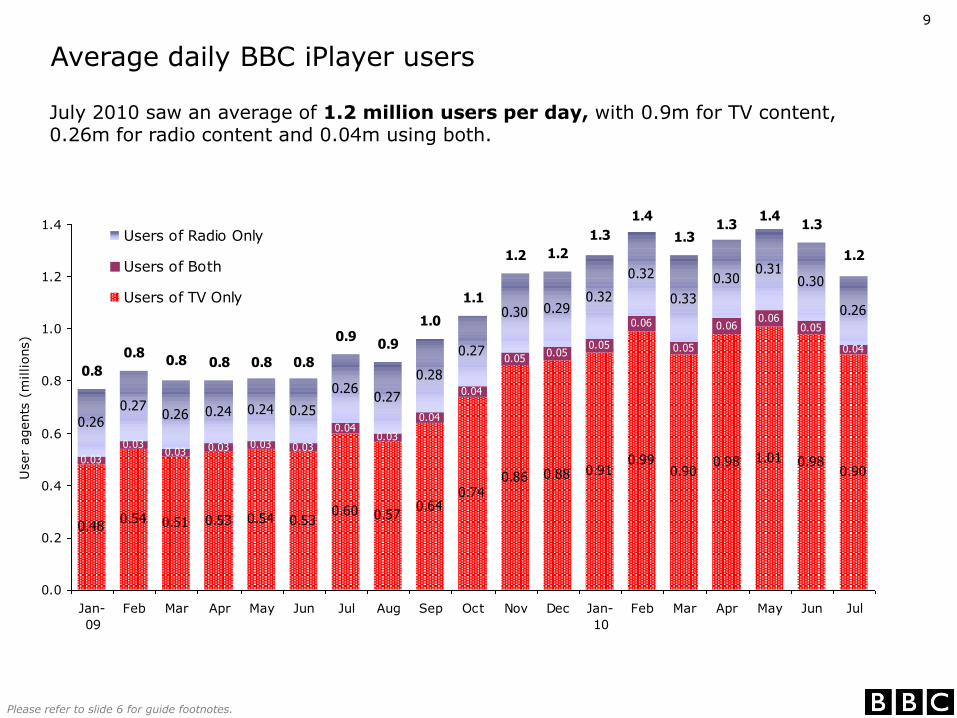
Average daily BBC iPlayer users
July 2010 saw an average of 1.2 million users per day, with 0.9m for TV content, 0.26m for radio content and 0.04m using both.
0.480.54 0.51 0.53 0.54 0.53
0.60 0.570.64
0.740.86 0.88 0.91
0.990.90
0.98 1.01 0.980.90
0.03
0.030.03 0.03 0.03 0.03
0.040.04
0.04
0.050.05
0.05
0.06
0.05
0.060.06
0.05
0.04
0.260.27
0.26 0.24 0.24 0.25
0.260.27
0.28
0.27
0.30 0.290.32
0.32
0.33
0.300.31
0.30
0.26
0.03
0.8
0.80.8 0.8 0.8 0.8
0.90.9
1.0
1.1
1.2 1.2
1.3
1.4
1.31.3
1.41.3
1.2
0.0
0.2
0.4
0.6
0.8
1.0
1.2
1.4
Jan-
09
Feb Mar Apr May Jun Jul Aug Sep Oct Nov Dec Jan-
10
Feb Mar Apr May Jun Jul
User
agents
(m
illions) .
Users of Radio Only
Users of Both
Users of TV Only
10
Please refer to slide 6 for guide footnotes.
16.5 16.718.9
16.715.1 15.3 15.6 15.0 15.9
17.6 17.1 17.2 17.318.3 17.6
16.5 16.5 16.818.2
14.615.9
14.813.9
15.9 15.316.7
7.5 7.4
7.4
7.6
7.07.5 7.7
7.56.9
6.1 7.2 7.7 7.87.9
8.1
7.3 7.0 6.3
7.8
6.7
7.4
6.46.2
6.26.1
6.2
24 24
26
24
2223
2323 23
2424
25 2526
26
24 24 23
26
21
23
2120
2221
23
0
5
10
15
20
25
30
'01 F
eb
08 F
eb
15 F
eb
22 F
eb
01 M
ar
08 M
ar
15 M
ar
22 M
ar
29 M
ar
05 A
pr
12 A
pr
19 A
pr
26 A
pr
03 M
ay
10 M
ay
17 M
ay
24 M
ay
31 M
ay
07 J
un
14 J
un
21 J
un
28 J
un
05 J
ul
12 J
ul
19 J
ul
26 J
ul
Weekly
Requests
(m
illions) .
TV Requests Radio Requests
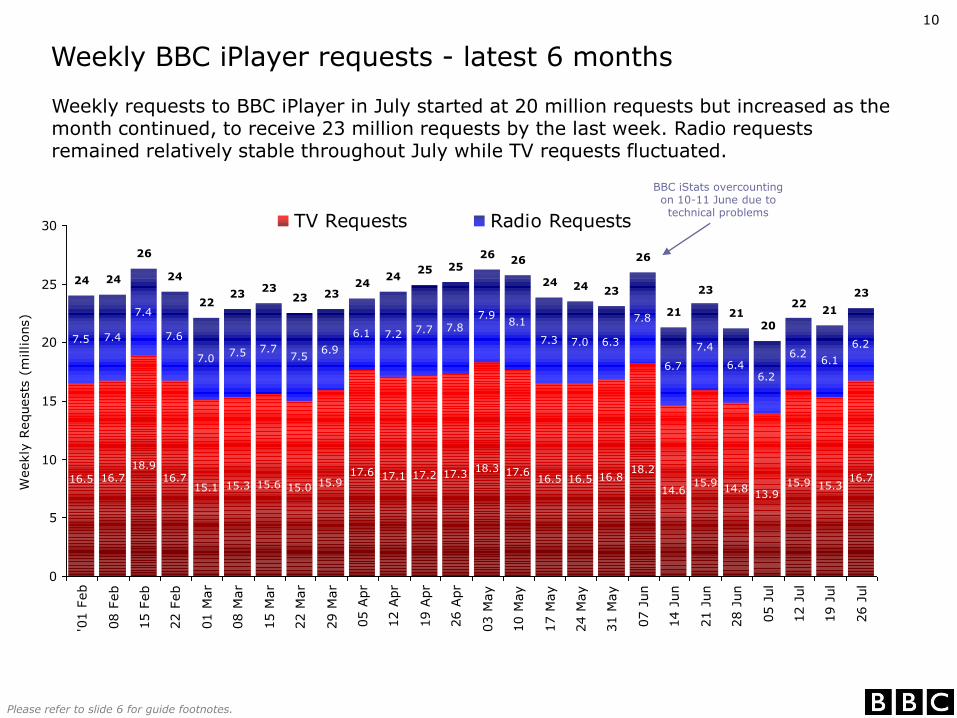
Weekly BBC iPlayer requests - latest 6 months
Weekly requests to BBC iPlayer in July started at 20 million requests but increased as the month continued, to receive 23 million requests by the last week. Radio requests remained relatively stable throughout July while TV requests fluctuated.
BBC iStats overcounting on 10-11 June due to technical problems
11
Please refer to slide 6 for guide footnotes.
3.9 3.94.3
3.9 3.7 3.6 3.73.4
3.7
4.5
3.8 3.8 3.9 4.0 4.0 3.9 3.9 3.8
4.9
3.6 3.8 3.73.4
3.8 3.7 3.9
0.4 0.4
0.5
0.50.4 0.4 0.4
0.40.4
0.4
0.4 0.5 0.40.5 0.5
0.4 0.4 0.4
0.4
0.30.4 0.4
0.3
0.3 0.30.4
1.2 1.2
1.2
1.21.2 1.2 1.3
1.21.2
1.1
1.11.2 1.2
1.3 1.21.1 1.1
1.0
1.4
1.0
1.21.0
1.0
1.00.9
0.9
5.5 5.5
5.95.6
5.3 5.25.4
5.05.3
6.1
5.35.5 5.6
5.85.6
5.4 5.45.2
6.7
4.9
5.4
5.0
4.6
5.14.9
5.2
0
1
2
3
4
5
6
7
8
'01 F
eb
08 F
eb
15 F
eb
22 F
eb
01 M
ar
08 M
ar
15 M
ar
22 M
ar
29 M
ar
05 A
pr
12 A
pr
19 A
pr
26 A
pr
03 M
ay
10 M
ay
17 M
ay
24 M
ay
31 M
ay
07 J
un
14 J
un
21 J
un
28 J
un
05 J
ul
12 J
ul
19 J
ul
26 J
ul
User
agents
(m
illions) .
Users of Radio Only
Users of Both
Users of TV Only
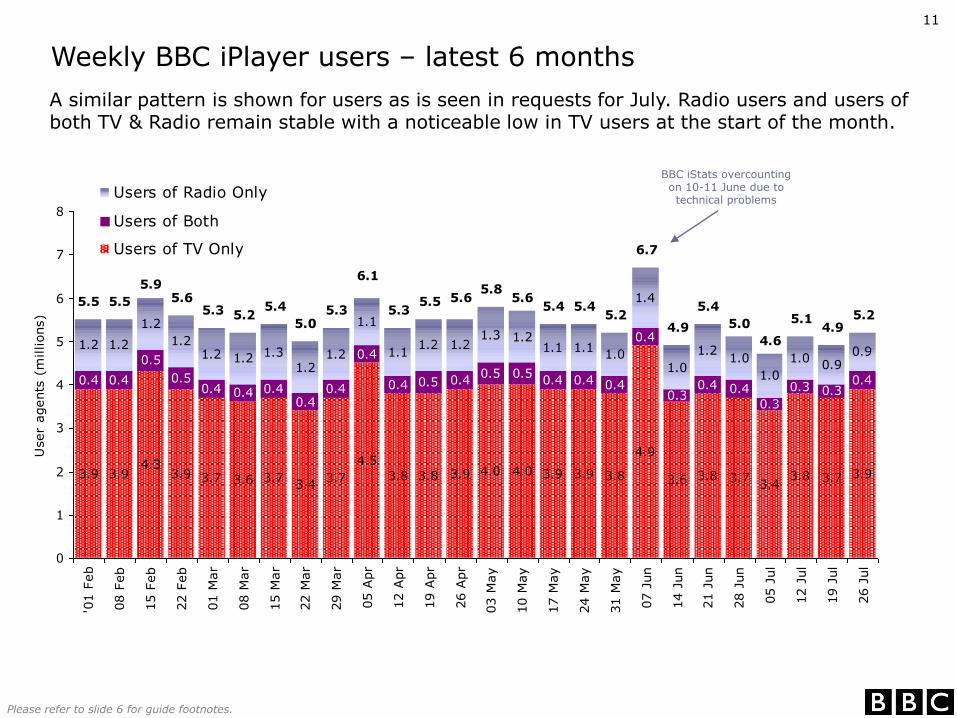
Weekly BBC iPlayer users – latest 6 months
A similar pattern is shown for users as is seen in requests for July. Radio users and users of both TV & Radio remain stable with a noticeable low in TV users at the start of the month.
BBC iStats overcounting on 10-11 June due to technical problems
12
Please refer to slide 6 for guide footnotes.
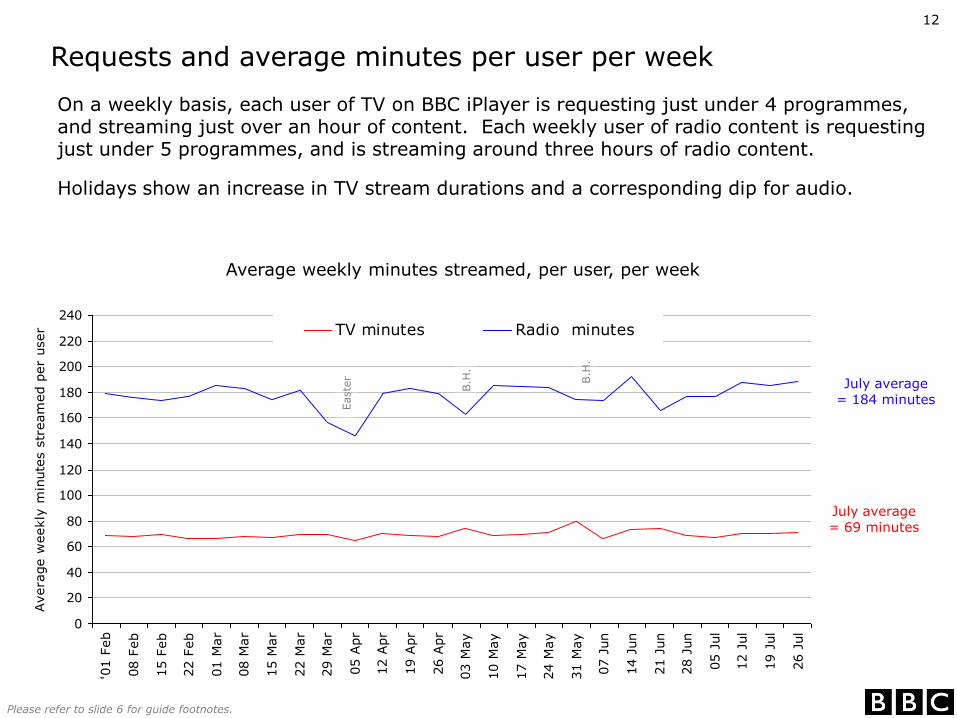
Requests and average minutes per user per week
On a weekly basis, each user of TV on BBC iPlayer is requesting just under 4 programmes, and streaming just over an hour of content. Each weekly user of radio content is requesting just under 5 programmes, and is streaming around three hours of radio content.
Holidays show an increase in TV stream durations and a corresponding dip for audio.
0
20
40
60
80
100
120
140
160
180
200
220
240
'01 F
eb
08 F
eb
15 F
eb
22 F
eb
01 M
ar
08 M
ar
15 M
ar
22 M
ar
29 M
ar
05 A
pr
12 A
pr
19 A
pr
26 A
pr
03 M
ay
10 M
ay
17 M
ay
24 M
ay
31 M
ay
07 J
un
14 J
un
21 J
un
28 J
un
05 J
ul
12 J
ul
19 J
ul
26 J
ul
Avera
ge w
eekly
min
ute
s s
tream
ed p
er
user
.
TV minutes Radio minutes
Average weekly minutes streamed, per user, per week
July average = 184 minutes
July average = 69 minutes
Easte
r
B.H
.
B.H
.

13
Please refer to slide 6 for guide footnotes.
BBC iPLAYER TOP 20 TV EPISODE – ALL
BBC iPlayer - top 20 TV episodes July 2010
Total requests per episode
1 Top Gear Series 15 Episode 3 1,273,000
2 Top Gear Series 15 Episode 2 1,273,000
3 Top Gear Series 15 Episode 5 1,208,000
4 Top Gear Series 15 Episode 4 1,136,000
5 Mock the Week Series 9 Episode 3 946,000
6 Sherlock Episode 1 718,000
7 Top Gear Series 15 Episode 1 707,000
8 EastEnders 23/07/10 639,000
9 EastEnders 01/07/10 604,000
10 EastEnders 08/07/10 579,000
11 Mock the Week Series 9 Episode 4 573,000
12 Mock the Week Series 9 Episode 5 548,000
13 Friday Night Jonathan Ross S18 Episode 25 545,000
14 EastEnders 09/07/10 520,000
15 The Incredibles 25/12/09 486,000
16 EastEnders 20/07/10 484,000
17 EastEnders 05/07/10 474,000
18 EastEnders 16/07/10 446,000
19 EastEnders 13/07/10 440,000
20 EastEnders 30/06/10 426,000
BBC iPLAYER TOP 20 TV EPISODE
– MOST-REQUESTED EPISODE PER SERIES
Total requests per episode
1 Top Gear Series 15 Episode 3 1,273,000
2 Mock the Week Series 9 Episode 3 946,000
3 Sherlock Episode 1 718,000
4 EastEnders 23/07/10 639,000
5 Friday Night Jonathan Ross S18 Episode 25 545,000
6 The Incredibles 25/12/09 486,000
7 Underage and Pregnant Series 2 Episode 1 401,000
8 Dragons' Den Series 8 Episode 1 361,000
9 Waterloo Road Series 5 Episode 20 341,000
10 That Mitchell and Webb Look S4 Episode 1 329,000
11 Have I Got a Bit More News for You S39 Ep 2 310,000
12 Doctor Who Series 5 Episode 13 301,000
13 Dive Episode 1 291,000
14 Young, Dumb and Living Off Mum S2 Ep 1 277,000
15 The Silence Episode 1 268,000
16 My Family Series 10 Episode 1 265,000
17 The Damned United 18/07/10 260,000
18 Outnumbered Series 1 Episode 2 258,000
19 Lee Nelson's Well Good Show Episode 4 254,000
20 It's a Boy Girl Thing 29/04/09 242,000
Note: excludes episodes which had been available for fewer than seven days at the end of the month.
BBC iPlayer’s most-requested title in July was clearly Top Gear, with some episodes attracting over 1 million requests each. New BBC One drama titles also performed well, as did comedy, as usual, and the start of BBC Three's Adult Season.
14
Please refer to slide 6 for guide footnotes.
BBC iPLAYER TOP 20 RADIO EPISODE – ALL
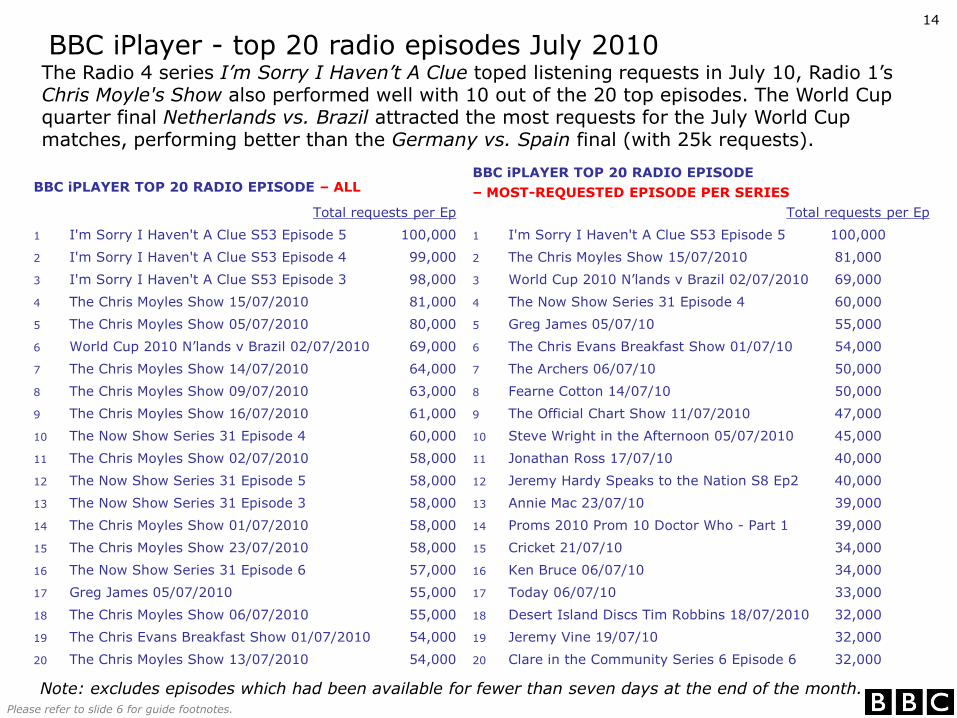
BBC iPlayer - top 20 radio episodes July 2010
Note: excludes episodes which had been available for fewer than seven days at the end of the month.
BBC iPLAYER TOP 20 RADIO EPISODE
– MOST-REQUESTED EPISODE PER SERIES
Total requests per Ep
1 I'm Sorry I Haven't A Clue S53 Episode 5 100,000
2 I'm Sorry I Haven't A Clue S53 Episode 4 99,000
3 I'm Sorry I Haven't A Clue S53 Episode 3 98,000
4 The Chris Moyles Show 15/07/2010 81,000
5 The Chris Moyles Show 05/07/2010 80,000
6 World Cup 2010 N’lands v Brazil 02/07/2010 69,000
7 The Chris Moyles Show 14/07/2010 64,000
8 The Chris Moyles Show 09/07/2010 63,000
9 The Chris Moyles Show 16/07/2010 61,000
10 The Now Show Series 31 Episode 4 60,000
11 The Chris Moyles Show 02/07/2010 58,000
12 The Now Show Series 31 Episode 5 58,000
13 The Now Show Series 31 Episode 3 58,000
14 The Chris Moyles Show 01/07/2010 58,000
15 The Chris Moyles Show 23/07/2010 58,000
16 The Now Show Series 31 Episode 6 57,000
17 Greg James 05/07/2010 55,000
18 The Chris Moyles Show 06/07/2010 55,000
19 The Chris Evans Breakfast Show 01/07/2010 54,000
20 The Chris Moyles Show 13/07/2010 54,000
Total requests per Ep
1 I'm Sorry I Haven't A Clue S53 Episode 5 100,000
2 The Chris Moyles Show 15/07/2010 81,000
3 World Cup 2010 N’lands v Brazil 02/07/2010 69,000
4 The Now Show Series 31 Episode 4 60,000
5 Greg James 05/07/10 55,000
6 The Chris Evans Breakfast Show 01/07/10 54,000
7 The Archers 06/07/10 50,000
8 Fearne Cotton 14/07/10 50,000
9 The Official Chart Show 11/07/2010 47,000
10 Steve Wright in the Afternoon 05/07/2010 45,000
11 Jonathan Ross 17/07/10 40,000
12 Jeremy Hardy Speaks to the Nation S8 Ep2 40,000
13 Annie Mac 23/07/10 39,000
14 Proms 2010 Prom 10 Doctor Who - Part 1 39,000
15 Cricket 21/07/10 34,000
16 Ken Bruce 06/07/10 34,000
17 Today 06/07/10 33,000
18 Desert Island Discs Tim Robbins 18/07/2010 32,000
19 Jeremy Vine 19/07/10 32,000
20 Clare in the Community Series 6 Episode 6 32,000
The Radio 4 series I’m Sorry I Haven’t A Clue toped listening requests in July 10, Radio 1’s Chris Moyle's Show also performed well with 10 out of the 20 top episodes. The World Cup quarter final Netherlands vs. Brazil attracted the most requests for the July World Cup matches, performing better than the Germany vs. Spain final (with 25k requests).
15
Please refer to slide 6 for guide footnotes.
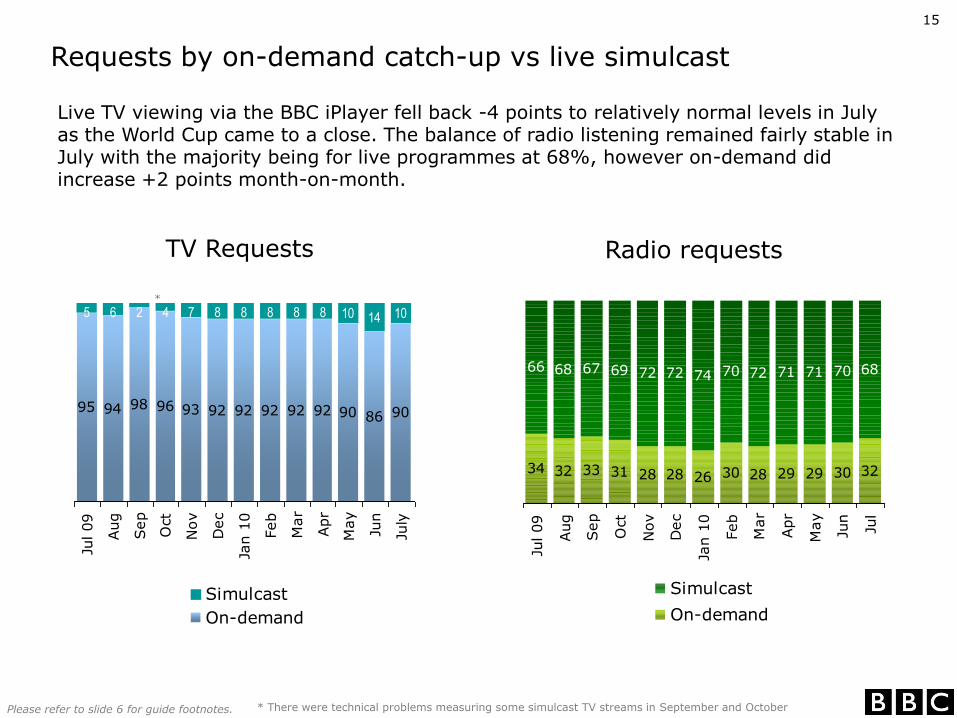
Requests by on-demand catch-up vs live simulcast
TV Requests Radio requests
Live TV viewing via the BBC iPlayer fell back -4 points to relatively normal levels in July as the World Cup came to a close. The balance of radio listening remained fairly stable in July with the majority being for live programmes at 68%, however on-demand did increase +2 points month-on-month.
95 94 98 96 93 92 92 92 92 92 90 86 90
5 6 2 4 7 8 8 8 8 8 10 14 10
Jul 09
Aug
Sep
Oct
Nov
Dec
Jan 1
0
Feb
Mar
Apr
May
Jun
July
Simulcast
On-demand
34 32 33 31 28 28 26 30 28 29 29 30 32
66 68 67 69 72 72 74 70 72 71 71 70 68
Jul 09
Aug
Sep
Oct
Nov
Dec
Jan 1
0
Feb
Mar
Apr
May
Jun
Jul
Simulcast
On-demand
*
* There were technical problems measuring some simulcast TV streams in September and October
16
Please refer to slide 6 for guide footnotes.
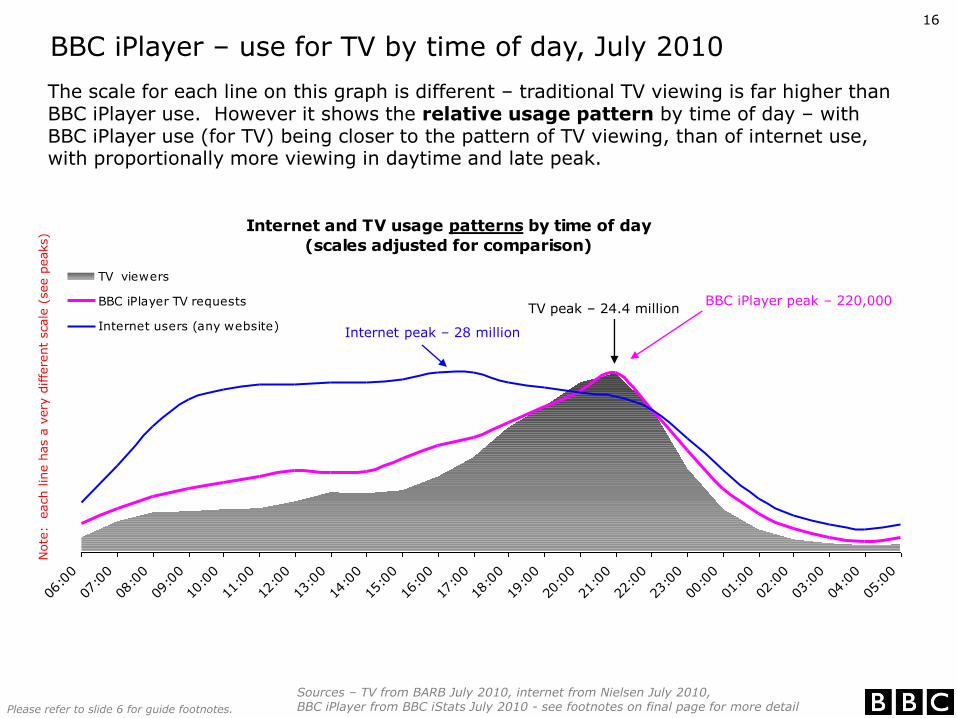
BBC iPlayer – use for TV by time of day, July 2010
Internet and TV usage patterns by time of day
(scales adjusted for comparison)
06:0
0
07:0
0
08:0
0
09:0
0
10:0
0
11:0
0
12:0
0
13:0
0
14:0
0
15:0
0
16:0
0
17:0
0
18:0
0
19:0
0
20:0
0
21:0
0
22:0
0
23:0
0
00:0
0
01:0
0
02:0
0
03:0
0
04:0
0
05:0
0
TV viewers
BBC iPlayer TV requests
Internet users (any website)
The scale for each line on this graph is different – traditional TV viewing is far higher than BBC iPlayer use. However it shows the relative usage pattern by time of day – with BBC iPlayer use (for TV) being closer to the pattern of TV viewing, than of internet use, with proportionally more viewing in daytime and late peak.
TV peak – 24.4 millionBBC iPlayer peak – 220,000
Internet peak – 28 million
Sources – TV from BARB July 2010, internet from Nielsen July 2010, BBC iPlayer from BBC iStats July 2010 - see footnotes on final page for more detail
Note
: e
ach lin
e h
as a
very
diffe
rent
scale
(see p
eaks)
17
Please refer to slide 6 for guide footnotes.
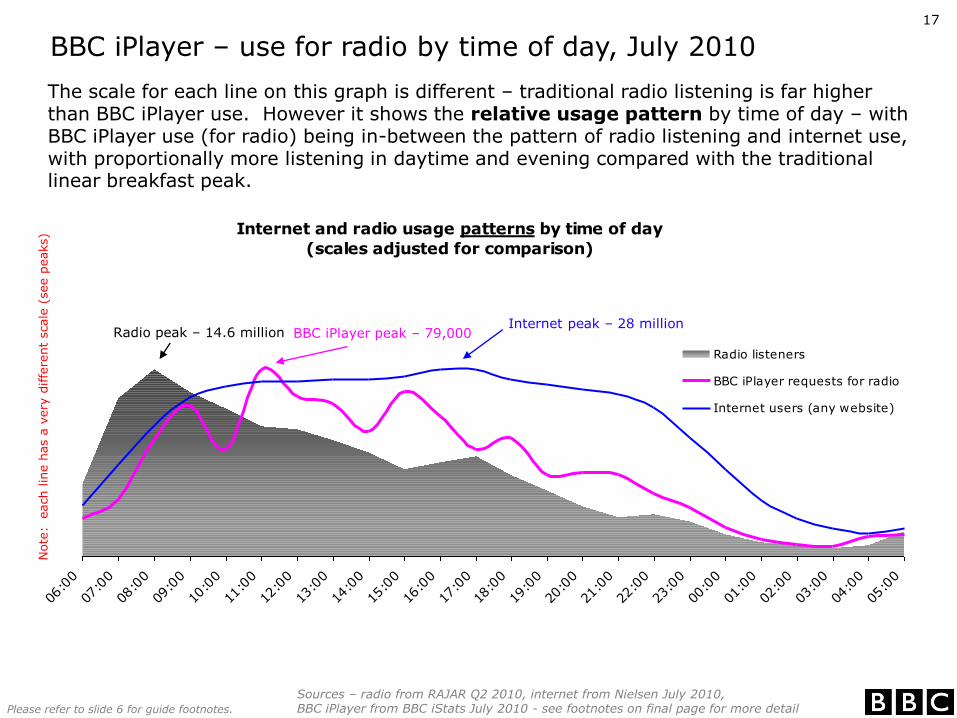
BBC iPlayer – use for radio by time of day, July 2010
Internet and radio usage patterns by time of day
(scales adjusted for comparison)
06:0
0
07:0
0
08:0
0
09:0
0
10:0
0
11:0
0
12:0
0
13:0
0
14:0
0
15:0
0
16:0
0
17:0
0
18:0
0
19:0
0
20:0
0
21:0
0
22:0
0
23:0
0
00:0
0
01:0
0
02:0
0
03:0
0
04:0
0
05:0
0
Radio listeners
BBC iPlayer requests for radio
Internet users (any website)
Radio peak – 14.6 million BBC iPlayer peak – 79,000Internet peak – 28 million
The scale for each line on this graph is different – traditional radio listening is far higher than BBC iPlayer use. However it shows the relative usage pattern by time of day – with BBC iPlayer use (for radio) being in-between the pattern of radio listening and internet use, with proportionally more listening in daytime and evening compared with the traditional linear breakfast peak.
Note
: e
ach lin
e h
as a
very
diffe
rent
scale
(see p
eaks)
Sources – radio from RAJAR Q2 2010, internet from Nielsen July 2010, BBC iPlayer from BBC iStats July 2010 - see footnotes on final page for more detail
18
Please refer to slide 6 for guide footnotes.
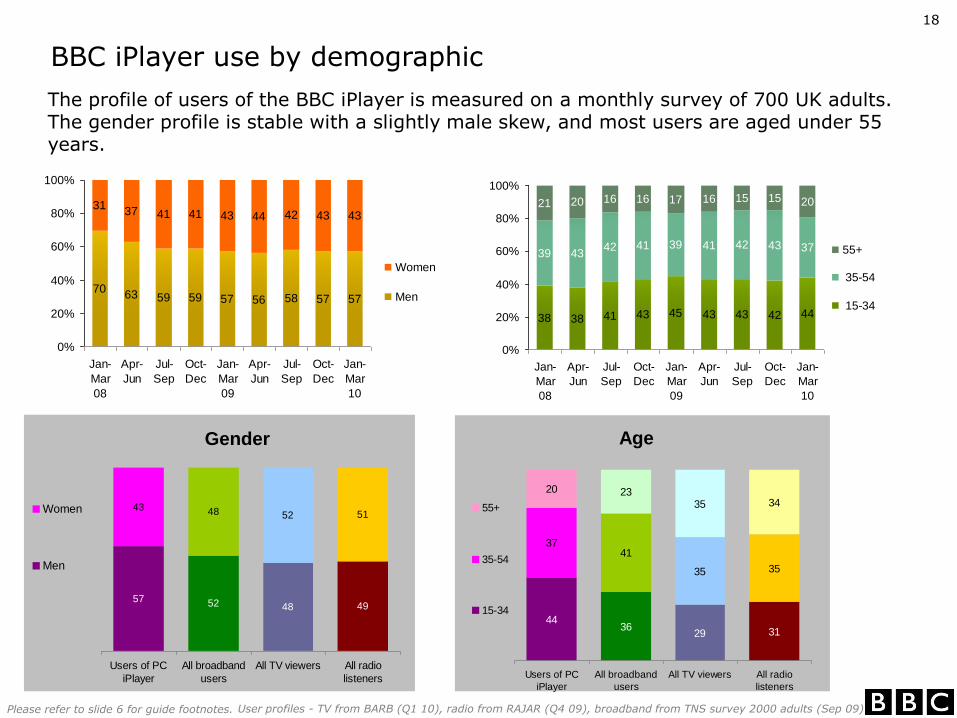
BBC iPlayer use by demographic
The profile of users of the BBC iPlayer is measured on a monthly survey of 700 UK adults. The gender profile is stable with a slightly male skew, and most users are aged under 55 years.
57 52 48 49
43 48 52 51
Users of PC
iPlayer
All broadband
users
All TV viewers All radio
listeners
Women
Men
4436
29 31
3741
35 35
20 2335 34
Users of PC
iPlayer
All broadband
users
All TV viewers All radio
listeners
55+
35-54
15-34
Gender Age
User profiles - TV from BARB (Q1 10), radio from RAJAR (Q4 09), broadband from TNS survey 2000 adults (Sep 09)
7063 59 59 57 56 58 57 57
3137 41 41 43 44 42 43 43
0%
20%
40%
60%
80%
100%
Jan-
Mar
08
Apr-
Jun
Jul-
Sep
Oct-
Dec
Jan-
Mar
09
Apr-
Jun
Jul-
Sep
Oct-
Dec
Jan-
Mar
10
Women
Men
38 38 41 43 45 43 43 42 44
39 4342 41 39 41 42 43
21 20 16 16 17 16 15 15 20
37
0%
20%
40%
60%
80%
100%
Jan-
Mar
08
Apr-
Jun
Jul-
Sep
Oct-
Dec
Jan-
Mar
09
Apr-
Jun
Jul-
Sep
Oct-
Dec
Jan-
Mar
10
55+
35-54
15-34
19
Please refer to slide 6 for guide footnotes.
Glossary
Stream – click to play instantly
Download – save to your computer to play laterWe cannot report on playback of downloads due to technical and data privacy restrictions
Users – a count of computer browsers accessing the online BBC iPlayer serviceSo please note: if someone has a different computer at work and at home, they are counted twice. If a family watches on a computer together, only one browser is counted. This is the industry-standard way of counting “users” or “visitors” to websites.
Requests – number of successful requests to stream or download a programmeWe only count successful requests, where a stream or a download actually start, rather than “clicks” which can be repeated if the user does not see an immediate reaction on the website.
Catch-up / on-demand – programmes requested after they have gone out on “normal” TV/radio channels and are available on BBC iPlayer
Live / simulcast – streaming of live TV channels / radio stations on the website, at exactly the same time as broadcast on “normal” TV / radio
Special footnotes for slides showing data for time of day
TV data – BARB average audience, live overnights, by hour, all individuals aged 4+, Total TV
Radio data - RAJAR average audience, by hour, all adults 16+, all radio stations
BBC iPlayer - average requests, by hour, all programmes, stream & downloading, live and on-demand, UK only
Nielsen – user numbers, aged 2+ based on internet population estimate of 38 million individuals