monthly performance pack may 2015 -...
TRANSCRIPT

May 2015
Monthly Performance Pack
Mimmi Andersson, BBC iPlayer
BBC Communications
07725641207 | [email protected]
Monthly summary – May 2015
Slide 2
• There were 276 million requests to BBC iPlayer in May. This was an increase of +2% month-on-month and bucked
the trend we typically see in iPlayer at this time of year, where Spring and Summer brings a month-on-month slow down in requests.
• TV requests were up +10% year on year to 222 million, with an additional 20m requests compared to May 2014.
• Radio requests are still affected by changes made to radio streaming services (more details are on slide 4.)
• Peter Kay’s Car Share continued to perform very well in May, with the first 4 episodes appearing in the top 5 titles.
New documentary Shark also proved popular this month along with coverage of The Election 2015.
• Other popular TV content included The C Word, The Eurovision Song Contest and the first episodes of new drama series’ The Game and Jonathan Strange & Mr Norrell.
• Test Match Special coverage of the England V New Zealand match was the most requested radio programme this month. The News Quiz also continued to prove popular in May, as well as the final episode of Fearne Cotton on Radio 1, and coverage of the General Election was also in the top 20 list.
Consistent with previous months:
• The profile of BBC iPlayer users has evened out over time in terms of male/female ratio, but remains strongly under-55 in terms of age, which is younger than the typical TV viewer or radio listener’s profile (although more in line with
home broadband users).
• BBC iPlayer is used for TV at roughly the same time of day as linear TV viewing, although there is proportionally more daytime and late-peak use. For radio, BBC iPlayer is used far more in daytime than traditional radio listening, which peaks at breakfast-time.

Index
Slide 3
Page Content
4-9 Monthly / weekly BBC iPlayer requests by media type and device type
10 Notes about the data in this report
11 Top TV programmes
12 Top radio programmes
13 TV and radio requests - live vs catch-up
14 Use of BBC iPlayer for TV by time of day
15 Use of BBC iPlayer for radio by time of day
16 Profile of BBC iPlayer users
17 Glossary
16
18
27
24
25
25
26
25
26
26
29
28
32
30
33
30
33
31
27
28
28
31
32
32
35
32
38
33
37
36
37
40
40
44
46
44
46
46
48
45
49
42
45
46
50
49
40
42 61
68
72
74
76
69
77
74
69
63
68
69
74
67
72
64
71
70
66
64
75
80
80
78
79
57
57
53
54 45
50 52
52
55
51
62
59
61
71
78
86
88
87
84
93
97
86
87
91
86 108
109
114
127
117
122
108
122
120
117
115
113
134
139
143
145
146
142
140
138
125
130
151
150
165
167
174
212
194
200
183
181
170
164
159
176
200
198
202 2
42
234
248
204
202
190
165
179
184
237
255
256
264
242
221
218
222
62
69 78
76
81
76 87
85
87
97 107
114
120
116
118
123
130
117
114
119
114
139
141
145 162
148
160
141 159
157
153
155
153 1
78
185
187
191
192
190
185
187
167
175
196
199
213
207
217
272
262
272
257
257
239
242
234
245 263
266
271
315
301 320
268
273
260
231
243 259
318 334
333
343
299*
278*
271
* 276*
Ja
n 0
9Fe
bM
ar
Ap
rM
ay
Ju
nJu
lA
ug
Se
pt
Oc
tN
ov
De
cJa
n 1
0Fe
bM
ar
Ap
rM
ay
Ju
nJu
lA
ug
Se
pO
ct
No
vD
ec
Ja
n 1
1Fe
bM
ar
Ap
rM
ay
Ju
nJu
lA
ug
Se
pO
ct
No
vD
ec
Ja
n 1
2Fe
bM
ar
Ap
rM
ay
Ju
nJu
lA
ug
Se
pO
ct
No
vD
ec
Ja
n-1
3Fe
bM
ar
Ap
rM
ay
Ju
nJu
lA
ug
Se
pO
ct
No
vD
ec
Ja
n-1
4Fe
bM
ar
Ap
rM
ay
Ju
nJu
lA
ug
Se
pO
ct
No
vD
ec
Ja
n-1
5Fe
bM
ar
Ap
rM
ay
Requests for TV programmes
Requests for radio programmes
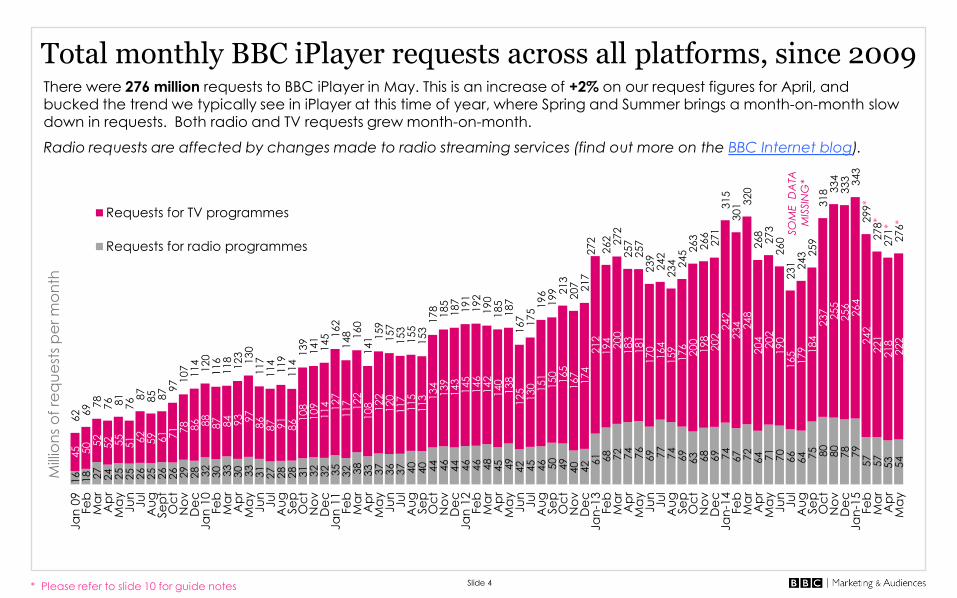
Total monthly BBC iPlayer requests across all platforms, since 2009 There were 276 million requests to BBC iPlayer in May. This is an increase of +2% on our request figures for April, and
bucked the trend we typically see in iPlayer at this time of year, where Spring and Summer brings a month-on-month slow down in requests. Both radio and TV requests grew month-on-month.
Radio requests are affected by changes made to radio streaming services (find out more on the BBC Internet blog).
Slide 4
Mill
ion
s o
f re
qu
est
s p
er m
on
th
SO
ME
DA
TA
MIS
SIN
G*
* Please refer to slide 10 for guide notes

TV only: Monthly requests to BBC iPlayer year-on-year
We recently created this graph for a blog about these stats, and we hope it will be a useful addition to this deck, showing the seasonal pattern of BBC iPlayer. Because a lot of iPlayer viewing is simple catch-up, there is a strong link with linear TV –
so highest in autumn and winter; however major events and schedule variations cause significant monthly differences.
In May 2015, TV requests were up +10% year-on-year to 222m, with an additional 20m requests compared to May 2014.
Slide 5
0
50
100
150
200
250
300
Jan Feb Mar Apr May Jun Jul Aug Sept Oct Nov Dec
BB
C iP
laye
r m
on
thly
re
qu
est
s (m
illio
ns)
2015
2014
2013
2012
2011
2010
2009
* Please refer to slide 10 for guide notes
LONDON
OLYMPICS
* SOME DATA
MISSING
* SOME DATA
MISSING
May 2015: 222m

0.6
0
.7
0.9
0
.8
0.8
0
.8
0.8
0
.8
0.9
0
.9
1.0
0
.9
1.0
1
.1
1.1
1
.0
1.1
1
.0
0.9
0
.9
1.0
1
.0
1.1
1
.0
1.1
1
.1
1.2
1
.1
1.2
1
.2
1.2
1
.3
1.3
1
.4
1.5
1
.4
1.5
1
.6
1.6
1
.5
1.6
1
.4
1.4
1
.5
1.7
1
.6
1.3
1
.4
2.0
2
.4
2.3
2
.5
2.4
2
.3
2.5
2
.4
2.3
2
.0
2.3
2
.2
2.4
2
.4
2.3
2
.1
2.3
2
.3
2.1
2
.1
2.5
2
.6
2.7
2
.5
2.5
2
.0
1.8
1
.8
1.7
1.6
1
.8
1.7
1
.7
1.8
1
.7
2.0
1
.9
2.0
2
.3
2.6
2
.8
2.9
3
.1
2.7
3
.1
3.1
2
.9
2.8
2
.9
2.9
3.5
3
.6
3.7
4
.1
4.2
3
.9
3.6
3
.9
4.0
3
.8
3.7
3
.8 4.3
4
.6
4.6
4
.7 5.2
4
.6
4.7
4
.5
4.2
4
.2 4.9
5
.0
5.3
5
.6
5.6
6
.8 6
.9
6.4
6
.1
5.8
5
.7
5.3
5
.1
5.9
6
.5
6.6
6
.5
7.8
8
.4
8.0
6
.8
6.5
6
.3
5.3
5
.8 6
.1
7.7
8.5
8
.2
8.5
8
.6
7.1
7
.3
7.2
2.1
2
.4
2.5
2
.5
2.6
2
.5
2.8
2
.7
2.9
3
.3 3.6
3
.7
3.9
4
.2
3.8
4
.1
4.2
3
.9
3.7
3
.8
3.8
4.5
4
.7
4.7
5.2
5
.3
5.2
4
.7 5.1
5
.2
4.9
5
.0
5.1
5.8
6.2
6
.0
6.2
6.8
6
.1
6.2
6
.0
5.6
5
.7 6
.3
6.6
6
.9
6.9
7
.0
8.8
9.3
8
.8
8.6
8
.3
8.0
7
.8
7.5
8.2
8
.5 8.9
8
.7
10.2
10.7
1
0.3
8
.9
8.8
8
.7
7.5
7.8
8
.6
10.2
11.1
1
0.7
1
1.1
1
0.7
9
.0
9.0
8
.9
Ja
n 0
9Fe
bM
ar
Ap
rM
ay
Ju
nJu
lA
ug
Se
pt
Oc
tN
ov
De
cJa
n 1
0Fe
bM
ar
Ap
rM
ay
Ju
nJu
lA
ug
Se
pO
ct
No
vD
ec
Ja
n 1
1Fe
bM
ar
Ap
rM
ay
Ju
nJu
lA
ug
Se
pO
ct
No
vD
ec
Ja
n 1
2Fe
bM
ar
Ap
rM
ay
Ju
nJu
lA
ug
Se
pO
ct
No
vD
ec
Ja
n-1
3Fe
bM
ar
Ap
rM
ay
Ju
nJu
lA
ug
Se
pO
ct
No
vD
ec
Ja
n-1
4Fe
bM
ar
Ap
rM
ay
Ju
nJu
lA
ug
Se
pO
ct
No
vD
ec
Ja
n-1
5Fe
bM
ar
Ap
rM
ay
Daily TV requests Daily radio requests
Average daily BBC iPlayer online requests
Slide 6
Mill
ion
s o
f re
qu
est
s p
er
da
y (
av
era
ge
mo
nth
ly)
There was an average of 8.9m daily requests to iPlayer in May. Radio requests are still affected by changes made to radio streaming services (find out more on the BBC Internet blog).
Measurement
correction
SO
ME
DA
TA
MIS
SIN
G
* Please refer to slide 10 for guide notes
*
19 18 18 15 11 18 20 20 20 17
13 12 13 13 13 13 13 11 12 13 13 13 12 13 13 11
56 56 57 61 65
60 58 58 59 57
56
69 60
56 46
42 52
50 52 52 50 51 54 48 48 49
75 75 75 76 76 78 78 78 78
75
69
82
73 68
59 54
65 62
64 64 63 64 66
60 61 61
0
10
20
30
40
50
60
70
80
90
01 D
ec
08 D
ec
15 D
ec
22 D
ec
29 D
ec
05 J
an
12 J
an
19 J
an
26 J
an
02 F
eb
09 F
eb
16 F
eb
23 F
eb
02 M
ar
09 M
ar
16 M
ar
23 M
ar
30 M
ar
06 A
pr
13 A
pr
20 A
pr
27 A
pr
04 M
ay
11 M
ay
18 M
ay
25 M
ay
We
ekly
Re
qu
est
s (m
illio
ns)
Weekly radio requests
Weekly TV requests
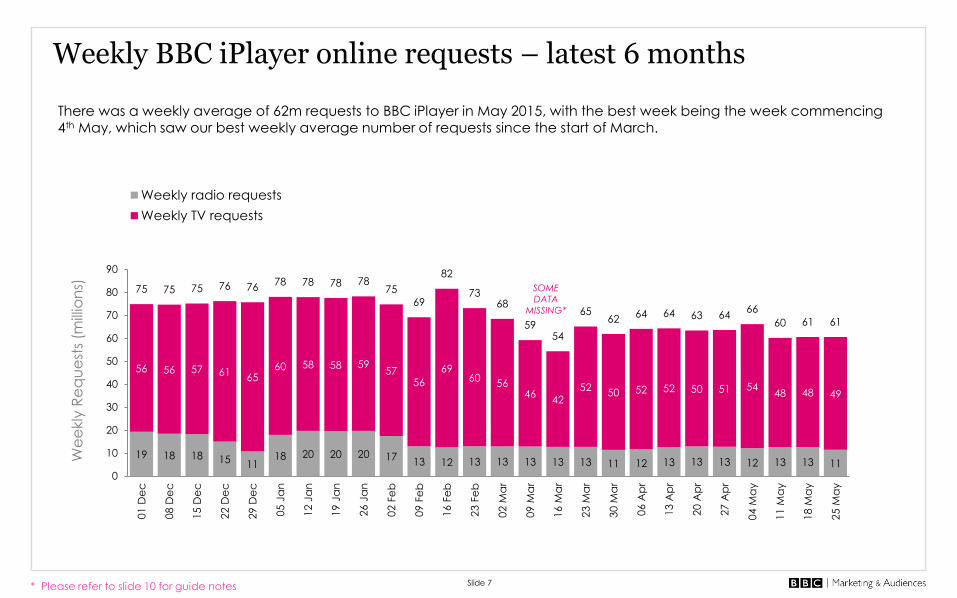
Weekly BBC iPlayer online requests – latest 6 months
Slide 7
There was a weekly average of 62m requests to BBC iPlayer in May 2015, with the best week being the week commencing 4th May, which saw our best weekly average number of requests since the start of March.
* Please refer to slide 10 for guide notes
SOME
DATA
MISSING*

49 50 43 45 49 62 67 75 80 75 69 64 65
65 58 51 57 61
72 74 79 83 77
66 61 62
90 86
77 72 71
96 101
97 99
90 93
83 80
9 8
6 8 10
11 10 10
9
6 5
7 7 34
31
25 32 36
41 46 37
40
30 24
25 34 7
6
6 7
7
8 6 5
4
3 6
10 11 25
28 29 30
28
16 14
20 16
273 260
231 243
259
318 334 333
343
299
278* 271 276
Ma
y
Jun
Jul
Au
g
Se
p
Oc
t
No
v
De
c
Jan
-15
Fe
b
Ma
r
Ap
r
Ma
y
Unknown
Internet TV /
connected devices
TV platform
operators
Games consoles
Computers
Tablets
Mobile devices
TOTAL
Notes: Internet TV / connected devices include Freeview and Freesat smart TVs, set-top-boxes and devices like Roku and blu-ray DVD players. TV platform operators include Virgin Media, Sky, YouView and BT Vision. Games consoles comprise Sony Playstation, Nintendo Wii and Microsoft XBox. Unknown devices are historically mostly due to online radio services such as the TuneIn radio app, or more recently due to changes to TV devices.
18% 19% 19% 19% 19% 19% 20% 23% 23% 25% 25% 24% 24%
24% 22% 22% 23% 24% 23% 22% 24% 24%
26% 24% 23% 23%
33% 33% 33% 30% 28% 30% 30% 29% 29%
30% 34% 31% 29%
3% 3% 3% 3% 4% 3% 3%
3% 3% 2% 2%
3% 3%
13% 12% 11% 13% 14% 13% 14% 11% 12% 10% 9%
9% 12%
3% 2% 2% 3% 3% 2% 2% 2% 1% 1% 2%
4% 4% 7% 8% 10% 9% 10% 9% 9% 9% 8% 5% 5% 7% 6%
Ma
y
Ju
n
Ju
l
Au
g
Se
p
Oc
t
No
v
De
c
Ja
n-1
5
Fe
b
Ma
r
Ap
r
Ma
y
TV and radio: Requests for programmes by device type
Total requests were at 276m this month, up +2% on April 2015. The most obvious growth in requests this month came from TV devices, which was partly due to the correction of some measurement issues (TV devices previously counted as ‘unknown’). Generally the picture was stable across all 4 screens.
Slide 8
% of requests Number of requests (millions)
46%
19% SOME
DATA
MISSING*
* Please refer to slide 10 for guide notes
---- SOME DATA MISSING * ----

Notes: Internet TV / connected devices include Freeview and Freesat smart TVs, set-top-boxes and devices like Roku. TV platform operators include Virgin Media, Sky, YouView and BT Vision. Games consoles comprise Sony Playstation, Nintendo Wii and Microsoft XBox.
TV only: Requests for programmes across BBC iPlayer by device type
TV requests were at 222m this month, up +2% on April 2015 and up 10% on May last year. The most obvious growth in requests came from TV devices, which was partly due to the correction of some measurement issues (TV devices
previously counted as ‘unknown’). Generally the picture was stable across all 4 screens.
Slide 9
34 36 31 34 38 47 50 56 59 55 46 42 42
59 52 46
52 56
66 67 71
76 70
59 54 55
58 54
46 40 31
55 64
65 66
65
68 60 57
9 8
6 8 10
11
10 10
9 6
5
7 7
34 30
25 31 36
41
46 37
40
30
24
25 34
7
6
6 7 7
7
6 5 4
3
6 10
11
202 190
165
179 184
237
255 256 264
242
221* 218 222
Ma
y
Jun
Jul
Au
g
Se
p
Oc
t
No
v
De
c
Jan
-15
Feb
Ma
r
Ap
r
Ma
y
Unknown
Internet TV /
connected devices
TV platform operators
Games consoles
Computers
Tablets
Mobile devices
TOTAL
17% 19% 19% 19% 21% 20% 20% 22% 22% 23% 21% 19% 19%
29% 27% 28% 29% 30% 28% 26% 28% 29% 29%
27% 25% 25%
29% 28% 28% 22% 17% 23% 25% 25% 25% 27%
31% 28% 26%
4% 4% 4% 5%
5% 5% 4%
4% 3% 3% 2%
3% 3%
17% 16% 15% 18% 20% 17% 18% 15% 15% 12% 11% 12% 15%
3% 3% 3% 4% 4% 3% 2% 2% 1% 1% 3% 4% 5%
Ma
y
Ju
n
Ju
l
Au
g
Se
p
Oc
t
No
v
De
c
Ja
n-1
5
Fe
b
Ma
r
Ap
r
Ma
y
% of requests
Number of requests (millions)
44%
23%
SOME
DATA
MISSING*
SOME DATA MISSING*
* Please refer to slide 10 for guide notes

15 14 12 11 1115 18 20 21 20 23 22 23
6 65 5 6
67
7 7 78 7 7
32 3231 32
40
4137 32
33
2526
23 23
18 1817 16
17
18 1818 17
40
71 70
6664
75
80 8078 79
57 5753 54
Ma
y
Jun
Jul
Aug
Sep
Oc
t
No
v
De
c
Jan-1
5
Feb
Ma
r
Ap
r
Ma
y
Unknown
Internet TV / connecteddevices
TV platform operators
Games consoles
Computers
Tablets
Mobile devices
TOTAL
Radio only: Requests for programmes across BBC iPlayer by device type
Slide 10
There were 54m radio requests recorded in May, though some data is not being counted following recent changes to radio streaming - find out more here: http://www.bbc.co.uk/blogs/internet/entries/977a1954-658f-4fb2-a23c-71680c49882f
Notes: Internet TV / connected devices include Freeview and Freesat smart TVs, set-top-boxes and devices like Roku and blu-ray DVD players. TV platform operators include Virgin Media, Sky, YouView. Games consoles comprise Sony Playstation, Nintendo Wii and Microsoft XBox. Unknown devices are historically mostly due to online radio services such as the TuneIn radio app, which we were unable to classify accurately by device.
% of requests Number of requests (millions)
21% 20% 18% 17% 15% 18% 22% 25% 27% 36%
40% 42% 43% 9% 8%
8% 9% 7%
7% 9%
10% 9%
12% 14% 14% 14%
45% 46% 48% 49% 54% 51% 46% 41% 42%
44%
45% 44% 43%
25% 25% 26% 25% 23% 23% 23% 23% 22%
7% 1% 0% 1%
Ma
y
Ju
n
Ju
l
Au
g
Se
p
Oc
t
No
v
De
c
Ja
n-1
5
Fe
b
Ma
r
Ap
r
Ma
y
SOME
DATA
MISSING*
* Please refer to slide 10 for guide notes
SOME
DATA
MISSING*

TV and radio requests: live vs catch-up online requests
Slide 11
9% of TV requests were for live viewing in May. For radio, live requests were stable at 73% of the total.
% requests for TV programmes % requests for radio programmes
89%
88%
87%
92%
93%
92%
92%
91%
91%
92%
91%
11
%
12
%
13
%
8%
7%
8%
8%
9%
9%
8%
9%
Ma
y
Ju
n
Ju
l
Au
g
Se
p
Oc
t
No
v
De
c
Ja
n-1
5
Fe
b
Ma
r
Ap
r
Ma
y
On-demand Simulcast20
18
19
21
18
17
18
19
20
25
27
27
27
80
82
81
79
82
83
82
81
80
75
73
73
73
Ma
y
Ju
n
Ju
l
Au
g
Se
p
Oc
t
No
v
De
c
Ja
n-1
5
Fe
b
Ma
r
Ap
r
Ma
y
On-demand Simulcast
Please refer to slide 10 for guide notes
DA
TA U
NA
VA
ILA
BLE
DA
TA U
NA
VA
ILA
BLE

Notes for figures in this report
Slide 12
Some changes were made to radio streaming services in February , which has resulted in gaps in our reporting for some streams. Find out more
about the changes on the BBC Internet blog.
Some TV request data was not captured in March 2015. We estimate around 17m requests are missing from TV platforms in March.
Some TV request data is also missing for 2014 - about 3.5m requests in August and 11.5m requests in September from computer devices, and
about 6m requests are missing in November, across all device types. We are not including these estimates in the graphs in this report.
The remainder of this report excludes data from Virgin Media cable and Sky. Virgin Media cable is not included as the data arrives later than
BBC internal AV stats and Sky is treated separately as it is not currently consolidated within BBC iStats AV systems.
These notes apply to all the data in this pack and should be included as footnotes when quoting any of these figures. A glossary is on page 17.
• This data is collected via a BBC internal data warehouse (BBC iStats). The methodology adheres to industry standard guidelines as defined
by JICWEBs and ABCe, with the exception that the BBC data is based on a 25% sample of users and not 100%. The BBC are working
towards 100% sample over the coming months.
• Note on the top 20 lists for TV and radio episodes: these show the most-requested individual episodes for the month, for interest, but only
represent a fraction of all the episodes available on iPlayer. They are indicative only, since they do not represent total request numbers per
series.
• In 2009 the BBC refined its methodology for measuring AV requests, so figures for 2007/8 are not comparable. There may be further
changes in the data in future releases as we continue to refine the methodology.
• Unless specified otherwise, figures include requests for both on-demand catch-up (streams and downloads), or views of live simulcasts. We
cannot report download playback due to data privacy restrictions. All data is for the UK only and excludes listening outside the UK
• This data includes requests via BBC iPlayer on any BBC website – whether on a programme, channel or station page, via the pop-out
console, or on the BBC iPlayer website itself.
• This report does not include requests for web-only content (such as online news or sport coverage) – only requests for full-length
programmes which have been transmitted on a TV channel or radio station.
• BBC iPlayer stats measurement was under-representing radio data up to mid-January 2013, when a problem was corrected, and radio
requests from week 12 2014 to week 17 2014 were undercounted.
• Please quote the source of these figures as “BBC iStats”.

BBC iPlayer - top 20 TV episodes, May 2015 (excluding Virgin Media cable and Sky)
Slide 13
Peter Kay's Car Share Episode 2 1,452,000
Peter Kay's Car Share Episode 3 1,423,000
Peter Kay's Car Share Episode 1 1,391,000
Shark Episode 1 1,318,000
Peter Kay's Car Share Episode 4 1,260,000
Election 2015 Part 1 Episode 1 1,249,000
The C Word 03/05/15 1,177,000
EastEnders 12/05/15 1,098,000
EastEnders 08/05/15 1,084,000
EastEnders 25/05/15 1,063,000
EastEnders 22/05/15 1,059,000
EastEnders 21/05/15 1,057,000
EastEnders 26/05/15 1,045,000
EastEnders 15/05/15 1,030,000
EastEnders 01/05/15 1,017,000
EastEnders 05/05/15 1,008,000
EastEnders 19/05/15 996,000
EastEnders 04/05/15 991,000
EastEnders 07/05/2015 991,000
Peter Kay's Car Share Episode 5 991,000
Peter Kay's Car Share Episode 2 1,452,000
Shark Episode 1 1,318,000
Election 2015 Part 1 Episode 1 1,249,000
The C Word 03/05/15 1,177,000
EastEnders 12/05/15 1,098,000
The Game Episode 1 960,000
The Next Step Series 2 Episode 11 790,000
Have I Got News for You Series 49 Episode 5 763,000
Alan Partridge: Alpha Papa 06/05/14 705,000
Eurovision Song Contest 2015 Grand Final 692,000
Jonathan Strange & Mr Norrell Episode 1 689,000
The Graham Norton Show Series 17 Episode 7 607,000
Charlie Brooker's Election Wipe 06/05/15 583,000
Casualty Series 29 Episode 31 576,000
Episodes Series 4 Episode 1 505,000
Hetty Feather Episode 1 504,000
Atlantis Series 2 Episode 12 492,000
Festivals, Sex and Suspicious Parents Series 2 Episode 1 489,000
The FA Cup 2014/15 Final: Arsenal v Aston Villa 463,000
Inspector George Gently Series 7 Episode 2 441,000
BBC iPlayer Top 20 TV episodes – All
Total requests per ep. BBC iPlayer Top 20 TV episodes –
most requested episode per series Total requests per ep.
Please refer to slide 10 for guide notes
Peter Kay’s Car Share continued to perform very well in May, with the first 4 episodes appearing in the top 5 titles. New documentary Shark also proved popular this month along with coverage of The Election 2015. Other popular content included The C Word, The Eurovision Song Contest and the first episodes of new series’ The Game and Jonathan Strange & Mr Norrell.

BBC iPlayer - top 20 radio episodes, May 2015
Slide 14
Test Match Special England v New Zealand 25/05/2015 158,000
The News Quiz Series 87 Episode 1 152,000
Fearne Cotton 22/05/2015 140,000
Desert Island Discs 10/05/2015 124,000
Dead Ringers Series 14 Episode 5 123,000
The News Quiz Series 87 Episode 2 122,000
5LS 5 live Boxing Mayweather v Pacquiao 03/05/2015 113,000
Test Match Special England v New Zealand 21/05/2015 112,000
The Chris Evans Breakfast Show 21/05/2015 109,000
Election 2015 08/05/15 106,000
Dead Ringers Series 14 Episode 4 103,000
Test Match Special England v New Zealand 22/05/2015 101,000
The Radio 1 Breakfast Show 01/05/15 99,000
The Vote Now Show Series 2 Episode 4 98,000
Test Match Special England v New Zealand 30/05/2015 98,000
The News Quiz Series 87 Episode 3 96,000
Test Match Special England v New Zealand 29/05/2015 95,000
Test Match Special England v New Zealand 31/05/2015 95,000
Election 2015 Breakfast 08/05/2015 94,000
The Radio 1 Breakfast Show 22/05/2015 94,000
Test Match Special England v New Zealand 25/05/2015 158,000
The News Quiz Series 87 Episode 1 152,000
Fearne Cotton 22/05/2015 140,000
Desert Island Discs 10/05/2015 124,000
Dead Ringers Series 14 Episode 5 123,000
5LS 5 live Boxing Mayweather v Pacquiao 03/05/2015 113,000
The Chris Evans Breakfast Show 21/05/2015 109,000
Election 2015 08/05/15 106,000
The Radio 1 Breakfast Show 01/05/15 99,000
The Vote Now Show Series 2 Episode 4 98,000
Scott Mills The Radio 1 Breakfast Show! 08/05/2015 90,000
Today 08/05/15 78,000
The Archers 11/05/15 76,000
Ken Bruce 14/05/2015 73,000
The Inspector Alleyn Mysteries 06/11/2007 73,000
Ian Rankin - The Serpent's Back 09/06/13 70,000
Just a Minute Series 72 Episode 1 68,000
Jeremy Vine 12/05/15 67,000
Steve Wright in the Afternoon 14/05/2015 65,000
Mark Steel's in Town Series 6 Episode 1 65,000
BBC iPlayer Top 20 Radio episodes – All
Total requests per ep. BBC iPlayer Top 20 Radio episodes –
most requested episode per series Total requests per ep.
Test Match Special coverage of the England V New Zealand match was the most requested radio programme this month. The News Quiz also continued to prove popular in May, as well as the final episode of Fearne Cotton on Radio 1, and coverage of the General Election was also in the top 20 list.
Please refer to slide 10 for guide notes

BBC iPlayer – use for TV online by time of day, May 2015
Slide 15
The scale for each line on this graph is different – traditional TV viewing is far higher than BBC iPlayer use. However it shows the relative usage pattern by time of day – with BBC iPlayer use (for TV) being closer to the pattern of TV viewing, than of internet use, with proportionally more viewing in daytime and late peak
06:0
0
07:0
0
08:0
0
09:0
0
10:0
0
11:0
0
12:0
0
13:0
0
14:0
0
15:0
0
16:0
0
17:0
0
18:0
0
19:0
0
20:0
0
21:0
0
22:0
0
23:0
0
00:0
0
01:0
0
02:0
0
03:0
0
04:0
0
05:0
0
TV viewers
BBC iPlayer TV requests
Internet users (any website)
TV peak – 24.3 million
BBC iPlayer peak –561,000
Internet peak – 28.4 million
No
te: e
ac
h li
ne
ha
s a
ve
ry d
iffe
ren
t sc
ale
(s
ee
pe
aks)
Sources – TV from BARB May 2015, internet from Nielsen March 2012, BBC iPlayer from BBC iStats May 2015- see footnotes on final page for more detail
Please refer to slide 10 for guide notes

BBC iPlayer – use for radio online by time of day, May 2015
Slide 16 Please refer to slide 10 for guide notes
The scale for each line on this graph is different – traditional radio listening is far higher than BBC iPlayer use. However it shows the relative usage pattern by time of day – with BBC iPlayer use (for radio) being in-between the pattern of radio listening and internet use, with proportionally more listening in daytime and evening compared with the traditional linear breakfast peak.
06
:00
07
:00
08
:00
09
:00
10
:00
11
:00
12
:00
13
:00
14
:00
15
:00
16
:00
17
:00
18
:00
19
:00
20
:00
21
:00
22
:00
23
:00
00
:00
01
:00
02
:00
03
:00
04
:00
05
:00
Radio listeners
BBC iPlayer requests
for radio
Internet users (any
website)
Sources – radio from RAJAR Q1 2015, internet from Nielsen March 2012,
BBC iPlayer from BBC iStats May 2015 - see footnotes on final page for more detail
Radio peak – 13.5 million
BBC iPlayer peak – 124,000 Internet peak –
28.4 million
No
te: e
ac
h li
ne
ha
s a
ve
ry
diffe
ren
t sc
ale
(se
e p
ea
ks)

Slide 17
BBC iPlayer usage is equally balanced between men and women, and the age profile has remained consistent across the end of 2014 and into 2015. .
TV & iPlayer Product: demographics of BBC iPlayer users
57%
52%
52%
51%
52%
45%
44%
48%
49%
49%
48%
55%
0%
20%
40%
60%
80%
100%
2010 2011 2012 2013 2014 2015
Women
Men
43%
40%
39%
37%
46%
46%
39%
40%
39%
39%
35%
35%
19%
21%
22%
23%
19%
20%
0%
20%
40%
60%
80%
100%
2010 2011 2012 2013 2014 2015
55+
35-54
16-34
50% 49% 49% 51%
50% 51% 51% 49%
0%
10%
20%
30%
40%
50%
60%
70%
80%
90%
100%
Users of BBC
iPlayer
Home
broadband
users
All TV viewers All Radio
Listeners
Women
Men
45% 34% 31% 31%
35%
36% 34% 34%
20% 30% 35% 35%
0%
10%
20%
30%
40%
50%
60%
70%
80%
90%
100%
Users of BBC
iPlayer
Home
broadband
users
All TV viewers All Radio
Listeners
55+
35-54
16-34
Gender (latest 4 quarters) Age (latest 4 quarters)
Sources: ART (1000 UK adults each month) or CMI from Q1 14 onwards / BARB.
Data up to Q1 2015, RAJAR Q1 15
METHOD CHANGE IN 2014
METHOD CHANGE IN 2014

Glossary
Slide 18
• Stream – click to play instantly
• Download – save to your device to play later. We cannot report on playback of downloads due to technical and data
privacy restrictions
• Users – a count of browsers accessing the online BBC iPlayer service. So, please note: if someone has a different device at
work and at home, they are counted twice. If a family watches on one device together, only one browser is counted. This is
the industry-standard way of counting “users” or “visitors” to websites
• Requests – the number of successful requests to stream or download a programme. We only count successful requests, where
a stream or a download actually starts, rather than “clicks” which can be repeated if the user does not see an immediate
reaction on the website
• Catch-up / on-demand – programmes requested after they have gone out on traditional TV/radio stations and are available
on BBC iPlayer
• Live / simulcast – streaming of live TV channels / radio stations on the website, at exactly the same time as broadcast on
traditional TV / radio stations
Extra footnotes for slides 15-16 showing data for time of day • TV data – BARB average audience, live overnights, by hour, all individuals aged 4+, Total TV
• Radio data - RAJAR average audience, by hour, all adults 16+, all radio stations
• BBC iPlayer - average requests, by hour, all programmes, stream & downloading, live and on-demand, UK only
• Nielsen – user numbers, aged 2+ based on internet population estimate of 38 million individuals