monthly product deck - hdfcsec.com
TRANSCRIPT

Monthly Product DeckJuly 2021

2
Table of Content
Particulars Page Nos Particulars Page Nos
Long-only PMS / AIF Strategies 3 – 42 Mutual Funds 50 – 58
Unifi Umbrella AIF - Blend 2 4 – 7 Equity Mutual Fund Performance Summary 50 – 54
Unifi Blended Rangoli Fund PMS 8 – 11 Debt Mutual Fund Performance Summary 55 – 58
Abakkus All Cap Approach (PMS) 12 – 15
White Oak India Equity Fund -IV (AIF) 16 – 19 Direct Debt / Bond Offering 59 – 62
White Oak India Pioneers Equity Portfolio (PMS) 20 – 23 Direct Debt / Bonds 60
ASK India Entrepreneur Portfolio (PMS) 24 – 26 Corporate Fixed Deposits 61
ASK India Select (PMS) 27 – 29 RBI Bonds 62
Helios India Rising (PMS) 30 – 32
Helios India Rising Fund (AIF) 33 – 36 Sovereign Gold Bond 63 – 65
Aditya Birla ISOP (PMS) 37 – 39
Ambit Good & Clean Midcap Fund (PMS) 40 - 42 Estate Planning Services 66 - 67
Long-only PMS / AIF Performance Summary 43 – 44 Tax Advisory Services 68 - 69
Long-only PMS / AIF Performance Summary 44
Long-Short AIF Strategies 45 – 49
Avendus Absolute Return Strategy (PMS) 46 – 49

3
Long-only PMS / AIF Strategies

4
Unifi Umbrella AIF - Blend Fund 2 (1 of 4 slides)
Portfolio Strategy and Philosophy
Unifi Umbrella AIF - Blend AIF 2 fund is a diversified multicap fundinvesting in “best of the best” businesses from across the 7 thematicfunds that they have launched over time
i. Business consolidation after disruption (BCAD): invests in growthoriented companies in specific sectors which are leading themigration of market share from unorganized to organized play
ii. Insider shadow: invests in fundamentally sound companies whichhave repurchased their own shares
iii. Deep value discount: invests in growth oriented companies atdeep discount to its intrinsic value
iv. Holdco: invests in holding companies with strong underlyingbusinesses available at significant valuation discount
v. Spin off: Considers single corporate structure with multiplebusinesses and invests in situations that offer great scope forbusinesses to realize their full growth potential and attractcommensurate market valuation.
vi. APJ 20: considers sectors like specialty chemicals, agriculture,precision manufacturing which have become competitive globally
vii. Green: invests in companies which provide service/ products thathelp reduce carbon footprints and/or result in more efficient useof natural resources
Final Portfolio (10-20
stocks)
Strong RoE; Low leverage; Low P/B; High earnings growth
Shortlist
Continuous Review
Sell
Fundamentals Deteriorate/ Investment Thesis not realised
Price of the stock exceeds growth potential of business
A Better Opportunity
Best balance of value with
growth over 3-5 year period and high capital efficiency
Universe
The fund’s investment universe
would include the diverse
investment opportunities within
the above mentioned investment
themes at any specific point of
time.
INVESTMENT PROCESS

5
Unifi Umbrella AIF - Blend Fund 2 (2 of 4 slides)
Portfolio Performance:Since the fund is recently launched, pls find below details of Unifi Umbrella AIF - Blend Fund I
Portfolio Details:
1 M 3 M 6 M 1 Y 2 Y Since Inception
Unifi Blend Fund I 7.0% 19.0% 27.0% 88.0% 40.0% 35.0%
S&P BSE Midcap 4.0% 12.0% 26.0% 73.0% 23.0% 23.0%
Details as on 30-Jun-21. Returns are net of management fees and expenses; Returns < 1 yr are absolute. Returns > 1 yr are CAGR, Inception date – Feb-2019
Top 10 Stocks (%)
Garware Technical Fibres Ltd 13.1
J B Chemicals And Pharma 12.3
ICICI Securities Ltd 6.6
JK Papers Ltd 6.3
Suven Pharma Ltd 6.1
Wipro Ltd 5.9
Axis Bank Ltd 5.7
ICICI Bank Ltd 5.6
CG Consumer 5.3
Tata Comm Ltd 5.0
Top Sectors (%)
BFSI 22.8
Chemicals 20.0
Technical Textiles 13.1
Pharma 11.5
Paper 6.3
IT 5.9
Consumer durables 5.3
Telecom 5.1
Auto Ancillary 4.6
Consumer discretionary 4.1
Market Cap Break-up (%)
Large Cap 25
Mid Cap 21
Small Cap 50
Portfolio Metrics (Rs Cr)
Weighted Average Market Cap 81,010
Median Market Cap 14,120
Large CapMulti Cap
Mid & Small Cap
Concentrated( < 15 stocks)
aFocused
(15 - 30 stocks)
Well Diversified(> 30 stocks)

6
Unifi Umbrella AIF - Blend Fund 2 (3 of 4 slides)
Unifi Capital
Unifi Capital is a discretionary, long only India centric fund manager; specializing in event oriented top down themesand a bottom up focus on “growth with value". Unifi was founded in 2001 by Sarath K Reddy, Narendranath K, GMaran and Christopher Vinod and currently manages Rs 7,500+ Crs in AuM.Unifi is headquartered in Chennai with offices in Bangalore, Hyderabad, Mumbai, and Delhi with a total team size of75 professionals
Fund Manager:Sarath Reddy
Mr Sarath Reddy has over 30 years of experience in Indian capital market and has rich experience in portfoliomanagement, equity and fixed income trading, equity research, corporate finance and private equity.He previously worked with Standard Chartered Bank in Treasury and then set up an investment services firm for oneof country’s large business houses.Mr Sarath holds an MBA (Finance) degree from Utah state University, USA
7
Unifi Umbrella AIF - Blend Fund 2 (4 of 4 slides)
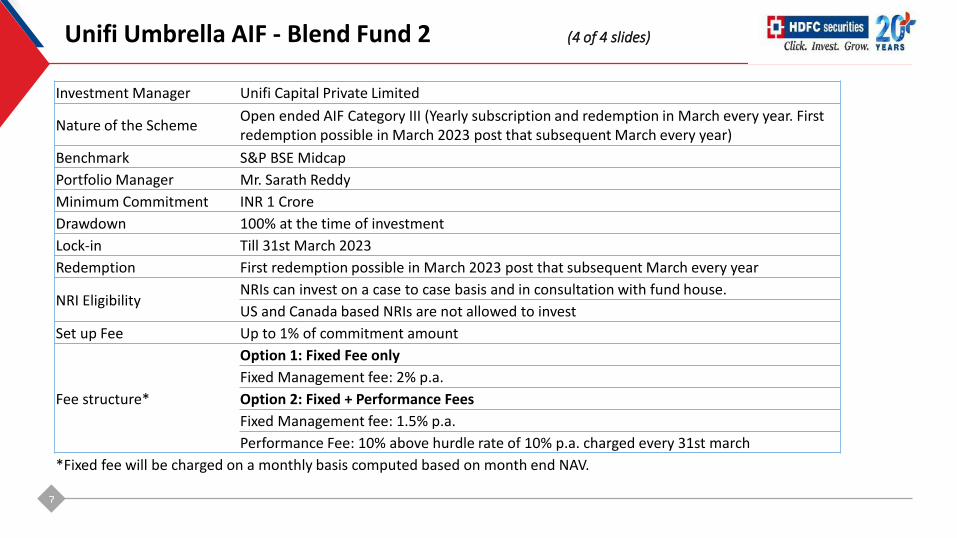
Investment Manager Unifi Capital Private Limited
Nature of the SchemeOpen ended AIF Category III (Yearly subscription and redemption in March every year. First redemption possible in March 2023 post that subsequent March every year)
Benchmark S&P BSE Midcap
Portfolio Manager Mr. Sarath Reddy
Minimum Commitment INR 1 Crore
Drawdown 100% at the time of investment
Lock-in Till 31st March 2023
Redemption First redemption possible in March 2023 post that subsequent March every year
NRI EligibilityNRIs can invest on a case to case basis and in consultation with fund house.
US and Canada based NRIs are not allowed to invest
Set up Fee Up to 1% of commitment amount
Fee structure*
Option 1: Fixed Fee only
Fixed Management fee: 2% p.a.
Option 2: Fixed + Performance Fees
Fixed Management fee: 1.5% p.a.
Performance Fee: 10% above hurdle rate of 10% p.a. charged every 31st march
*Fixed fee will be charged on a monthly basis computed based on month end NAV.

8
Unifi Blended Rangoli Fund PMS (1 of 4 slides)
Portfolio Strategy and Philosophy
Unifi Blended Rangoli Fund is a diversified multicap fund investing in“best of the best” businesses from across the 7 thematic funds thatthey have launched over time
i. Business consolidation after disruption (BCAD): invests in growthoriented companies in specific sectors which are leading themigration of market share from unorganized to organized play
ii. Insider shadow: invests in fundamentally sound companies whichhave repurchased their own shares
iii. Deep value discount: invests in growth oriented companies atdeep discount to its intrinsic value
iv. Holdco: invests in holding companies with strong underlyingbusinesses available at significant valuation discount
v. Spin off: Considers single corporate structure with multiplebusinesses and invests in situations that offer great scope forbusinesses to realize their full growth potential and attractcommensurate market valuation.
vi. APJ 20: considers sectors like specialty chemicals, agriculture,precision manufacturing which have become competitive globally
vii. Green: invests in companies which provide service/ products thathelp reduce carbon footprints and/or result in more efficient useof natural resources
Final Portfolio (10-20
stocks)
Strong RoE; Low leverage; Low P/B; High earnings growth
Shortlist
Continuous Review
Sell
Fundamentals Deteriorate/ Investment Thesis not realised
Price of the stock exceeds growth potential of business
A Better Opportunity
Best balance of value with
growth over 3-5 year period and high capital efficiency
Universe
The fund’s investment universe
would include the diverse
investment opportunities within
the above mentioned investment
themes at any specific point of
time.
INVESTMENT PROCESS

9
Unifi Blended Rangoli Fund PMS (2 of 4 slides)
Portfolio Performance:
Details as on 30-Jun-21. Returns are net of management fees and expenses; Returns < 1 yr are absolute. Returns > 1 yr are CAGR, Inception date – June-2017
1 M 3 M 6 M 1 Y 2 Y 3 YSince
Inception
Unifi Blended - RangoliPMS
6.8% 24.2% 32.3% 94.1% 46.6% 30.5% 26.0%
S&P BSE Midcap 3.6% 11.7% 25.6% 72.6% 23.4% 13.4% 10.9%
Top 10 Stocks (%)
Tata Communications Limited 10.0
GSFC 10.0
State Bank of India 10.0
Hindalco Industries Ltd 10.0
CG Consumer 8.0
India Energy Exchange Ltd 7.5
Bajaj Holdings Ltd 7.5
ICICI Securities Ltd 5.0
Atul Ltd 5.0
Suprajit Engineering Ltd 5.0
Top Sectors (%)
BFSI 15.0
Telecom/Internet 10.0
Fertilisers 10.0
Metal – Aluminium 10.0
Consumer Durables 8.0
Power trading 7.5
Holdco 7.5
Chemicals 5.0
Auto Anicilliary 5.0
Market Cap Break-up (%)
Large Cap 18
Mid Cap 28
Small Cap 33
Portfolio Metrics (Rs Cr)
Total AUM 3,454
Weighted Average Market Cap 76,942
Median Market Cap 13,708
Large CapMulti Cap
Mid & Small Cap
Concentrated( < 15 stocks)
aFocused
(15 - 30 stocks)
Well Diversified(> 30 stocks)
Note - Portfolio is getting built up for the current tranche – 79% is invested across 10 stocks

10
Unifi Blended Rangoli Fund PMS (3 of 4 slides)
Unifi Capital
Unifi Capital is a discretionary, long only India centric fund manager; specializing in event oriented top down themesand a bottom up focus on “growth with value". Unifi was founded in 2001 by Sarath K Reddy, Narendranath K, GMaran and Christopher Vinod and currently manages Rs 7,500+ Crs in AuM.Unifi is headquartered in Chennai with offices in Bangalore, Hyderabad, Mumbai, and Delhi with a total team size of75 professionals
Fund Manager:Sarath Reddy
Mr Sarath Reddy has over 30 years of experience in Indian capital market and has rich experience in portfoliomanagement, equity and fixed income trading, equity research, corporate finance and private equity.He previously worked with Standard Chartered Bank in Treasury and then set up an investment services firm for oneof country’s large business houses.Mr Sarath holds an MBA (Finance) degree from Utah state University, USA

11
Unifi Blended Rangoli Fund PMS (4 of 4 slides)
Investment Manager Unifi Capital Private Limited
Benchmark S&P BSE Midcap
Portfolio Manager Mr. Sarath Reddy
Minimum Initial Investment Amount
INR 50 Lakhs
Minimum Add-on Investment Amount
INR 10 Lakhs
NRI EligibilityNRIs can invest on a case to case basis and in consultation with fund house.
US and Canada based NRIs are not allowed to invest
Fee structure*
Option 1: Fixed Fee only
Fixed Management fee: 2% p.a.
Option 2: Fixed + Performance Fees
Fixed Management fee: 1.5% p.a.
Performance Fee: 10% above hurdle rate of 10% p.a. charged at the end of 5 years or 200% return which is earlier. In case of pre-closure, the hurdle rate will be reduced from 10% p.a. to 8% p.a.
Exit Load NIL
*Fixed fee will be charged on a monthly basis computed based on average AUM

12
Abakkus All Cap Approach PMS (1 of 4 slides)
Portfolio Strategy and Philosophy• Benchmark agnostic diversified All-cap portfolio• Fundamental based ideas picked via a bottom up approach• Large cap allocation based on top down sector view with focus on stability• Alpha from exposure to broader market companies with sustainable business and high ROEs• Endeavor to generate alpha and wealth creation by buying with typically 3-5 years holding period• Differentiated Portfolio adhering to our “MEETS” Framework(shown below)
•Quality - Capability and track record
• Capital Allocation – capex is fine if ROE is maintained or enhanced
• Capital Distribution – fair to minority shareholders
• Error in decision – Business errors vs intentional mishaps
• Quality of earnings vs reported numbers
• Actual earnings vs expected
• Cyclical vs Structural earnings
• Companies that can double profits in 4 years or less or where EV/EBITDA can halve in four years
• Stock movement because of events. Can be Buy or Sell opportunity
• Events on the horizon
• Disruptive trends/New themes
• Good company is not necessarily a good investment if price is not right
• What is the price discounting
• Time frame of investment
• Mean Reversion
• Size of the opportunity
• Competitive positioning / MOAT
• Consistent growth in profits
Management
Earnings
Events/Trends
Timing
Structural

13
Abakkus All Cap Approach PMS (2 of 4 slides)
Current Opportunity Matrix:• Structural Growth Companies - Companies which offer high quality secular growth or are part of emerging sectors which offer a
large opportunity• Disbelief to Belief - Well established companies who have a checkered past, currently ignored by investors but offer an
opportunity to own a quality business at attractive prices• Near Term Headwinds - Companies that face near-term issues but the business is good & sustainable and offers an opportunity
for patient investors• Awaiting Triggers - Companies that suffer or are ignored due to lack of stand-out performance, fears, etc but there is a trigger
which could change this• Deep Value Plays - Quality companies that are trading below their intrinsic value and offers an interesting opportunity. Will be
conscious of not getting into value traps
Details as on 30-Jun-21. Returns are net of management fees and expenses; Returns < 1 yr are absolute. Returns > 1 yr are CAGR, Inception date – 29-Oct-2020
1 M 3 M 6 MSince
Inception
Abakkus All Cap Approach 4.3% 23.0% 47.6% 63.9%
S&P BSE 200 1.4% 8.5% 15.5% 38.3%
Nifty 50 0.9% 7.0% 12.4% 34.0%
BSE Mid Cap 3.6% 11.7% 25.6% 52.1%
Performance details:
14
Abakkus All Cap Approach PMS (3 of 4 slides)
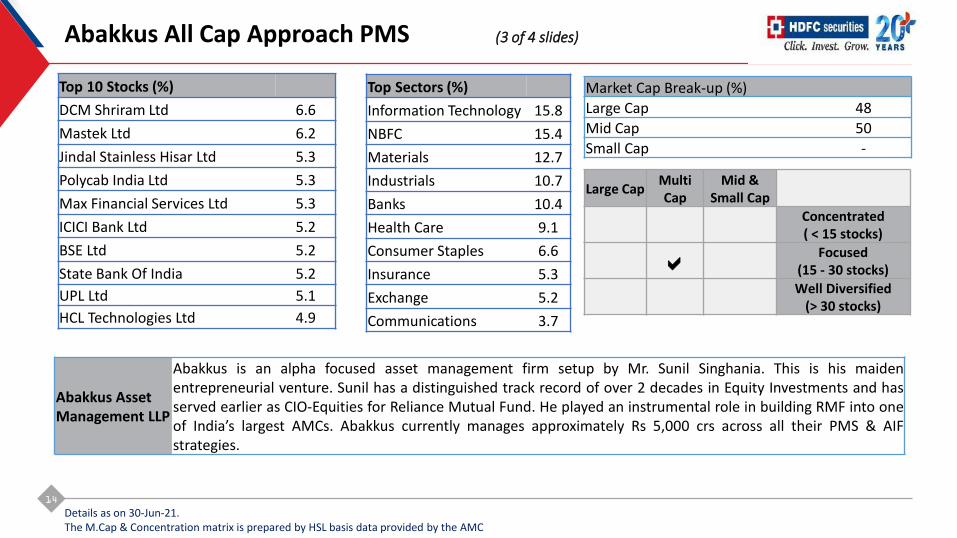
Details as on 30-Jun-21. The M.Cap & Concentration matrix is prepared by HSL basis data provided by the AMC
Top 10 Stocks (%)
DCM Shriram Ltd 6.6
Mastek Ltd 6.2
Jindal Stainless Hisar Ltd 5.3
Polycab India Ltd 5.3
Max Financial Services Ltd 5.3
ICICI Bank Ltd 5.2
BSE Ltd 5.2
State Bank Of India 5.2
UPL Ltd 5.1
HCL Technologies Ltd 4.9
Top Sectors (%)
Information Technology 15.8
NBFC 15.4
Materials 12.7
Industrials 10.7
Banks 10.4
Health Care 9.1
Consumer Staples 6.6
Insurance 5.3
Exchange 5.2
Communications 3.7
Market Cap Break-up (%)
Large Cap 48
Mid Cap 50
Small Cap -
Large CapMulti Cap
Mid & Small Cap
Concentrated( < 15 stocks)
aFocused
(15 - 30 stocks)
Well Diversified(> 30 stocks)
Abakkus AssetManagement LLP
Abakkus is an alpha focused asset management firm setup by Mr. Sunil Singhania. This is his maidenentrepreneurial venture. Sunil has a distinguished track record of over 2 decades in Equity Investments and hasserved earlier as CIO-Equities for Reliance Mutual Fund. He played an instrumental role in building RMF into oneof India’s largest AMCs. Abakkus currently manages approximately Rs 5,000 crs across all their PMS & AIFstrategies.

15
Abakkus All Cap Approach PMS (4 of 4 slides)
Fund Manager:Sunil Singhania
Sunil Singhania, a CA rank and CFA charter holder, is a reputed name in Indian equities. He last served as CIO-Equities for Reliance Mutual Fund, where he oversaw over $ 1 billion of equity assets. Sunil is regarded as one of the top Equity Fund Managers in the country (rated best Fund Manager by Outlook Business in 2016 and 2017 over 10 year time frame). He is the first Indian to be appointed on the Global Board of CFA Institute, USA. Currently Honorary Chairman of Investment Committee of CFA Institute. Sunil is currently on the IFRS Capital Markets Advisory Committee (CMAC) and the only member from India to be appointed for the same (2020 -2023)
Portfolio Manager Sunil Singhania / Aman Chowhan
Benchmark S&P BSE 200
Investment Tenure Open ended PMS with investment horizon of more than 3 years
Minimum Initial Investment Amount Rs 50 lacs
Minimum Add-on Investment Amount Rs 5 lacs
NRI Eligibility NRIs can invest on a case to case basis and in consultation with fund house
US and Canada based NRIs are not allowed to invest
Annual Management Fee
Fixed Fee only Fixed + Performance Fee
Amount Fixed Fees Fixed Fees Performance Fee
Rs 50 lakhs to < Rs 5 Cr 2.50% 1.75%15% sharing over 9%
hurdle rateRs 5 Cr to < Rs 10 Cr 2.10% 1.40%
Rs 10 Cr and above 1.75% 1.10%
Performance Fee Annual with high water mark applicable. No catch-up
Exit Load 1.5 % up to 12 months. NIL there after

16
White Oak India Equity Fund IV (AIF) (1 of 4 slides)
Portfolio Strategy and Philosophy• White Oak India Equity Fund 4 (WOIEF-IV) is a close ended AIF that follows a long only investment strategy with a bottom up
stock selection approach• WOIEF-IV follows an investment philosophy of investing in businesses based on stock selection, rather than betting on
macros• White Oak believes outsized returns are earned over time by investing in great businesses at attractive values. The strategy
focuses on:• Great businesses - one that is well managed, scalable, and generates superior returns on incremental capital• Valuation – attractive values when the current market price is at a substantial discount to intrinsic value
• White Oak uses a proprietary OpcoFinco valuation framework instead of relying on traditional P/E or EV/EBIDTA valuationmeasures
Indicative portfolio composition• Number of stocks: 40-50• Maximum 10% exposure to single stock at cost, 15% at market value• Maximum 40% exposure to single sector
Key Attributes Key factors for evaluation
Superior returns on incremental capitalIndustry competitive intensity
Sustainable competitive advantage
Scalable long-term opportunityIndustry potential versus current size
Expanding market share and scope
Strong execution and governanceDrive to create long term value
Interests aligned with minorityshareholders
Valuation Frameworks Derives insights
Intrinsic value = present value of cash flows
Economic free cash flow rather than accounting
Terminal value based on greatness of business
Value excess returns on capital vs. capital employed
Assess cash flows net of cost of capital
Asset lite free cash flow multiples for relative comps

17
White Oak India Equity Fund IV (AIF) (2 of 4 slides)
Details as on 30-Jun-21. The M.Cap & Concentration matrix is prepared by HSL basis data provided by the AMC
Top 10 Stocks (%)
Infosys Ltd 7.3
ICICI Bank Ltd 6.6
HDFC Bank Ltd 6.4
Axis Bank Ltd 5.1
Coforge Limited 4.9
Nestle India Ltd 3.9
Asian Paints Ltd 3.2
CGC Ltd 3.1
Bajaj Finserv Ltd 3.1
Persistent Systems Ltd 2.8
Top Sectors (%)
Financials 30.9
Information Technology 21.6
Consumer Discretionary 15.6
Health Care 9.8
Materials 9.4
Consumer Staples 6.2
Industrials 3.7
Communication Services
1.6
Real Estate 0.5
Market Cap Break-up (%)
Large Cap 52
Mid Cap 32
Small Cap 16
Portfolio Metrics (Rs Cr)
Weighted Average Market Cap 2,04,075
Median Market Cap 27,284
Large CapMulti Cap
Mid & Small Cap
Concentrated( < 15 stocks)
Focused(15 - 30 stocks)
aWell Diversified
(> 30 stocks)
Since the fund was launched only in Apr-21 , pls find below the details on White Oak India Equity Fund II which follows a similarstrategy as White Oak India Equity Fund IV.

18
White Oak India Equity Fund IV (AIF) (3 of 4 slides)
White Oak Capital
White Oak Capital is an investment management and investment advisory firm founded by Mr.Prashant Khemka in 2017. Mr Khemka was the former CIO and Lead Portfolio Manager for GoldmanSachs India since 2007 and Global Emerging Markets Equity since 2013. White Oak has a 65+ memberteam with offices in Mumbai, Singapore, Mauritius, UK and Switzerland. White Oak group, in a shortspan of 3 years has managed to garner over Rs. 24,000 crores in India dedicated assets.
Founder:Prashant Khemka
Prashant was the former CIO and Lead Portfolio Manager for Goldman Sachs India since 2007 andGlobal Emerging Markets Equity since 2013. He was a Senior PM and Co-Chair of the InvestmentCommittee on the US Growth Equity team which managed US$25 bn in 2004. He started the GSAMIndia business in 2006 and served as the CIO and CEO until 2013. Prashant and the funds managed byhim at GSAM earned several awards including Citywire AAA rating and FundCalibre Elite rating.Prashant has a BE in Mechanical Engineering from Mumbai University and an MBA in Finance fromVanderbilt University in the United States, where he received the Matt Wigginton Leadership Awardfor outstanding performance in Finance. He was awarded the CFA designation in 2001 and is a fellowof the Ananta Aspen Centre, India.

19
White Oak India Equity Fund IV (AIF) (4 of 4 slides)
Investment Manager White Oak Capital Management Consultants LLPStructure AIF Category III (Close Ended)Benchmark S&P BSE 500 TRI
TenureThe Fund shall have an initial tenure of 2.5 years from Final Close. The intent is to launch a Series-2 fund at the end of tenure, enabling investors to either continue or access liquidity
Drawdown Period 50% at the time of Investment and 50% before the final close Upfront Drawdown 50% of the Capital Commitment AmountFinal Close On or before July 2021
Management Fee Structure
Fixed Fee Option Variable Fee OptionClass Amount Fixed Fee Class Amount Fixed FeeClass C 1cr - <5 cr 2.50% Class A 1cr - <5 cr 1.85%Class C 1 5cr - <10cr 2.00% Class B 5cr - <10cr 1.50%Class I 10cr+ 1.50% Class I 1 10cr+ 1.00%
Performance Fee20% on outperformance over the Benchmark Returns, without catch-upPositive absolute return
Hurdle Rate Positive relative return vs the BenchmarkNRIs can invest on a case to case basis and in consultation with fund house
NRI Eligibility US based NRIs are allowed to invest (Canada based NRIs not allowed)Operating Expenses At actuals, capped at 0.20% per annum of the Net Capital ContributionSet-Up Cost Up to 2% of Gross Capital ContributionExit The investors can exit only at the maturity of the fund.Redemption On maturity of the Fund

20
White Oak India Pioneers Equity Portfolio (PMS) (1 of 4 slides)
Portfolio Strategy and Philosophy• White Oak India Pioneers Equity Portfolio follows a long only investment strategy with a bottom up stock selection approach• White Oak follows an investment philosophy of investing in businesses based on stock selection, rather than betting on
macros• White Oak believes outsized returns are earned over time by investing in great businesses at attractive values. The strategy
focuses on:• Great businesses - one that is well managed, scalable, and generates superior returns on incremental capital• Valuation – attractive values when the current market price is at a substantial discount to intrinsic value
• White Oak uses a proprietary OpcoFinco valuation framework instead of relying on traditional P/E or EV/EBIDTA valuationmeasures
Details as on 30-Jun-21. Returns are net of management fees and expenses; Returns < 1 yr are absolute. Returns > 1 yr are CAGR, Inception date – 09-Apr-2019
Indicative portfolio composition• Number of stocks: 30-50• Maximum 10% exposure to single stock at cost, 15% at
market value• Maximum 40% exposure to single sector
1 M 3 M 6 M 1 Y 2 YSince
Inception
W.O.I. Pioneers Equity
4.2% 12.5% 19.9% 67.7% 29.4% 27.8%
BSE 500 TRI 2.1% 9.9% 18.0% 61.8% 20.0% 18.0%
Key Attributes Key factors for evaluation
Superior returns on incremental capitalIndustry competitive intensity
Sustainable competitive advantage
Scalable long-term opportunityIndustry potential versus current size
Expanding market share and scope
Strong execution and governance
Drive to create long term value
Interests aligned with minorityshareholders
Valuation Frameworks Derives insights
Intrinsic value = present value of cash flows
Economic free cash flow rather than accounting
Terminal value based on greatness of business
Value excess returns on capital vs. capital employed
Assess cash flows net of cost of capital
Asset lite free cash flow multiples for relative comps

21
White Oak India Pioneers Equity Portfolio (PMS) (2 of 4 slides)
Details as on 30-Jun-21. The M.Cap & Concentration matrix is prepared by HSL basis data provided by the AMC
Top 10 Stocks (%)
Infosys Ltd 8.0
ICICI Bank Ltd 7.2
HDFC Bank Ltd 6.4
Axis Bank Ltd 5.1
Coforge Ltd 5.0
Nestle India Ltd 4.6
Asian Paints Ltd 3.1
Bajaj Finserv Ltd 3.1
Cholamandalam Invt & Fin Co 2.9
Persistent Systems Ltd 2.8
Top Sectors (%)
Financials 32.9
Information Technology 21.8
Health Care 12.4
Consumer Discretionary 10.8
Materials 9.6
Consumer Staples 6.7
Industrials 3.7
Communication Services
0.7
Real Estate 0.6
Market Cap Break-up (%)
Large Cap 55
Mid Cap 32
Small Cap 12
Portfolio Metrics (Rs Cr)
Total AUM 3,284
Weighted Average Market Cap 2,13,645
Median Market Cap 33,108
Large CapMulti Cap
Mid & Small Cap
Concentrated( < 15 stocks)
Focused(15 - 30 stocks)
aWell Diversified
(> 30 stocks)

22
White Oak India Pioneers Equity Portfolio (PMS) (3 of 4 slides)
White Oak Capital
White Oak Capital is an investment management and investment advisory firm founded by Mr.Prashant Khemka in 2017. Mr Khemka was the former CIO and Lead Portfolio Manager for GoldmanSachs India since 2007 and Global Emerging Markets Equity since 2013. White Oak has a 65+ memberteam with offices in Mumbai, Singapore, Mauritius, UK and Switzerland. White Oak group, in a shortspan of 3 years has managed to garner over Rs. 24,000 crores in India dedicated assets.
Founder:Prashant Khemka
Prashant was the former CIO and Lead Portfolio Manager for Goldman Sachs India since 2007 andGlobal Emerging Markets Equity since 2013. He was a Senior PM and Co-Chair of the InvestmentCommittee on the US Growth Equity team which managed US$25 bn in 2004. He started the GSAMIndia business in 2006 and served as the CIO and CEO until 2013. Prashant and the funds managed byhim at GSAM earned several awards including Citywire AAA rating and FundCalibre Elite rating.Prashant has a BE in Mechanical Engineering from Mumbai University and an MBA in Finance fromVanderbilt University in the United States, where he received the Matt Wigginton Leadership Awardfor outstanding performance in Finance. He was awarded the CFA designation in 2001 and is a fellowof the Ananta Aspen Centre, India.

23
White Oak India Pioneers Equity Portfolio (PMS) (4 of 4 slides)
Benchmark S&P BSE 500 TRI
Investment Horizon More than 3 years
Minimum Initial Investment Amount Rs. 50 lakhs
Minimum Add-on Investment Amount Rs 5 lakhs
Fixed Management Fees (Annual)<Rs. 10 cr – 2.50% p.a
>Rs. 10 cr – 2.00% p.a
NRI EligibilityNRIs can invest on a case to case basis and in consultation with fund house
US and Canada based NRIs are not allowed to invest
Exit Load NIL

24
Portfolio Strategy and Philosophy• ASK India Entrepreneur Portfolio (IEP) seeks to identify large and growing business opportunities• Identify businesses with competitive advantage that are significant in size (minimum PBT of 100 Crores) which enables
sustainable growth both from market share gains as well as the growth of the opportunity size• The portfolio filters companies that will have the ability to fund strong growth through internal cash generation
• over 20% compounded growth from each business that is bought and target over 25% growth from the portfolio• to fund such growth, the business ROCE should be over 25% so that growth can be funded internally
• The portfolio has an uncompromised focus on corporate governance and prefers companies with management who have skinin the game
• invest in businesses with an identifiable business house at helm with minimum 25% stake• Identify businesses at reasonable discount to value and accumulate gains by staying invested over the long term as EPS
compounds• The strategy is market cap agnostic
1 M 3 M 6 M 1 Y 2 Y 3 Y 5 Y Since
Inception
ASK IEP 2.8% 9.0% 15.9% 61.4% 22.6% 15.9% 16.6% 19.3%
BSE 500 1.9% 9.5% 17.3% 59.7% 18.4% 13.9% 14.2% 10.8%
Nifty 0.9% 7.0% 12.4% 52.6% 15.4% 13.6% 13.7% 10.5%
Rs. 1 Cr invested in ASK IEP in Jan 2010 is now worth Rs. 7.52 crs v/s Rs. 3.21 crs in BSE 500
Details as on 30-Jun-21. Returns are net of management fees and expenses; Returns < 1 yr are absolute. Returns > 1 yr are CAGR, Inception date – 25-Jan-2010
ASK India Entrepreneur Portfolio (PMS) (1 of 3 slides)
25
ASK India Entrepreneur Portfolio (PMS) (2 of 3 slides)
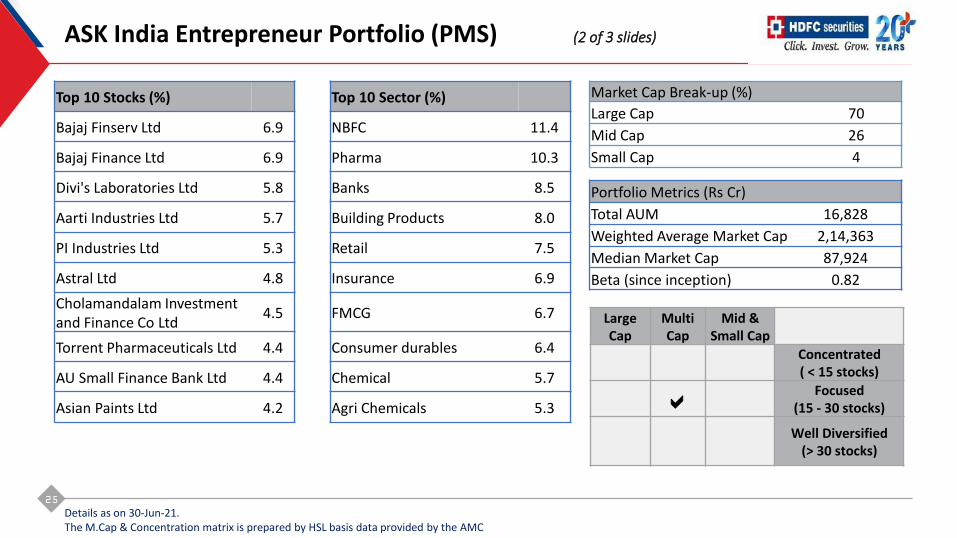
Top 10 Stocks (%) Top 10 Sector (%)
Bajaj Finserv Ltd 6.9 NBFC 11.4
Bajaj Finance Ltd 6.9 Pharma 10.3
Divi's Laboratories Ltd 5.8 Banks 8.5
Aarti Industries Ltd 5.7 Building Products 8.0
PI Industries Ltd 5.3 Retail 7.5
Astral Ltd 4.8 Insurance 6.9
Cholamandalam Investment and Finance Co Ltd
4.5 FMCG 6.7
Torrent Pharmaceuticals Ltd 4.4 Consumer durables 6.4
AU Small Finance Bank Ltd 4.4 Chemical 5.7
Asian Paints Ltd 4.2 Agri Chemicals 5.3
Market Cap Break-up (%)
Large Cap 70
Mid Cap 26
Small Cap 4
Portfolio Metrics (Rs Cr)
Total AUM 16,828
Weighted Average Market Cap 2,14,363
Median Market Cap 87,924
Beta (since inception) 0.82
Large Cap
Multi Cap
Mid & Small Cap
Concentrated( < 15 stocks)
aFocused
(15 - 30 stocks)
Well Diversified(> 30 stocks)
Details as on 30-Jun-21. The M.Cap & Concentration matrix is prepared by HSL basis data provided by the AMC

26
ASK India Entrepreneur Portfolio (PMS) (3 of 3 slides)
ASK Investment Managers Ltd.
ASK Investment Managers Limited (ASKIM), is a leading asset and wealth management company, primarilycatering to the HNI and UHNI market in India. ASK is one of the first companies to obtain a portfoliomanagement services license in India and the third largest company in both discretionary listed equity portfoliomanagement services and discretionary equity overall portfolio management services
Fund Manager:Chetan Thacker
Chetan has a total work experience of more than 12 years with 9 years plus in equity research. He has sectorresearch expertise in agriculture, chemicals, metals & mining and midcaps. Previously Chetan has worked withMcKinsey & Co, HSBC InvestDirect, Emkay Global Financial Services.His educational qualification includes CFA (ICFAI University) and PGDBM from NMIMS. He is with ASK for thelast 4 years.
Benchmark BSE 500
Investment Horizon More than 3 years
Minimum Initial Investment Amount Rs. 50 lakhs
Minimum Add-on Investment Amount Rs 5 lakhs
Fixed Management Fees (Annual)2.50% p.a. (calculated on the average daily portfolio value payable on a quarterly basis at the end of each calendar quarter)
Exit Load 1% up to 36 months. NIL there after

27
Portfolio Strategy and Philosophy• Ask India Select Portfolio aims to invest in best ideas from each of the four business attributes:
• Size of Opportunity: Size of pond Vs. size of fish, Dominance, Resilience, Liquidity• Quality of Business: Superior Return on Capital Employed, Strong MOAT, Impregnability, Sustainability, Key pivot of
strong wealth creation• Earnings Growth: Quantum, consistency and durability of earnings, Compounding Power & Predating (Early vs Late)• Value: Price-value gap or margin of safety
• Any stock selection across any strategy has to pass a minimum defined threshold for all the attributes• Strategy focuses equally on 4 key business attributes to ensure true diversification within equity• In addition to the above, high quality of management is a given constant among all stocks• The portfolio has rigorous filters such as:
• Profit before tax (PBT) of at least INR 75 crores for trailing 4 quarters• Minimum 20% ROCE• Minimum 15% annual earnings growth
1 M 3 M 6 M 1 Y 2 Y 3 Y 5 Y Since
Inception
ASK India Select
4.9% 12.1% 14.1% 49.6% 19.2% 13.5% 13.9% 17.1%
BSE 500 1.9% 9.5% 17.3% 59.7% 18.4% 13.9% 14.2% 10.4%
Nifty 0.9% 7.0% 12.4% 52.6% 15.4% 13.6% 13.7% 10.0%
Details as on 30-Jun-21. Returns are net of management fees and expenses; Returns < 1 yr are absolute. Returns > 1 yr are CAGR, Inception date – 04-Jan-2010
Rs. 1 Cr invested in ASK India Select PMS in Jan 2010 is now worth Rs. 6.14 crs v/s Rs. 3.11 crs in BSE 500
ASK India Select (PMS) (1 of 3 slides)

28
ASK India Select (PMS) (2 of 3 slides)
Top 10 Stocks (%) Top 10 Sector (%)
Bajaj Finance Ltd 7.1 Insurance 12.7
Bajaj Finserv Ltd 6.5 Banks 9.4
Aarti Industries Ltd 5.6 Pharma 9.1
PI Industries Ltd 5.3 Retail 7.7
APL Apollo Tubes Ltd 5.2 NBFC 7.1
Infosys Ltd 5.2 FMCG 7.0
Divi's Laboratories Ltd 5.1 Chemical 5.6
Polycab India Ltd 4.9 Agri Chemicals 5.3
Dixon Technologies (India) Ltd
4.8 Pipes 5.2
Asian Paints Ltd 4.5 IT 5.2
Market Cap Break-up (%)
Large Cap 75
Mid Cap 20
Small Cap 5
Portfolio Metrics (Rs Cr)
Total AUM 4,450
Weighted Average Market Cap 2,41,264
Median Market Cap 99,332
Beta (since inception) 0.82
Large CapMulti Cap
Mid & Small Cap
Concentrated( < 15 stocks)
aFocused
(15 - 30 stocks)
Well Diversified(> 30 stocks)
Details as on 30-Jun-21. The M.Cap & Concentration matrix is prepared by HSL basis data provided by the AMC

29
ASK India Select (PMS) (3 of 3 slides)
ASK Investment Managers Ltd.
ASK Investment Managers Limited (ASKIM), is a leading asset and wealth management company, primarilycatering to the HNI and UHNI market in India. ASK is one of the first companies to obtain a portfoliomanagement services license in India and the third largest company in both discretionary listed equity portfoliomanagement services and discretionary equity overall portfolio management services
Fund Manager:Chetan Thacker
Chetan has a total work experience of more than 12 years with 9 years plus in equity research. He has sectorresearch expertise in agriculture, chemicals, metals & mining and midcaps. Previously Chetan has worked withMcKinsey & Co, HSBC InvestDirect, Emkay Global Financial Services.His educational qualification includes CFA (ICFAI University) and PGDBM from NMIMS. He is with ASK for thelast 4 years.
Benchmark BSE 500*
Investment Horizon More than 3 years
Minimum Initial Investment Amount Rs. 50 lakhs
Minimum Add-on Investment Amount Rs 5 lakhs
Fixed Management Fees (Annual)2.50% p.a. (calculated on the average daily portfolio value payable on a quarterly basis at the end of each calendar quarter)
Exit Load 1% up to 36 months. NIL there after
*The benchmark for ASK India Select has been changed from S&P BSE 100 to S&P BSE 500 w.e.f. October 1, 2019.

30
Helios India Rising (PMS) (1 of 3 slides)
Portfolio Strategy and Philosophy• Helios India Rising PMS will invest in 3 major themes characterized by “non-zero sum” competition, backed by rigorous
bottom up research and rich experience of the investment team in the Indian equity markets• Private sector companies competing with government-owned companies (mostly in financial /healthcare and infrastructure
sectors)• Companies benefiting from demographic / lifestyle changes in India (mostly in urban or middle class focused under
penetrated sectors)• Companies benefiting from durable factor cost advantages (mostly in export-oriented software/pharmaceuticals/chemicals
and auto ancillaries’ sectors)• Helios believes that bottom up research works best in sectors/themes that have strong tailwinds• It is currently envisaged that the portfolio will generally be underweight in the following areas:
• Commodities sector• “One Billion consumer” stories• State owned companies• Indian companies owning “difficult to analyze” foreign businesses
• 10-15% of the portfolio may not be in preferred themes but should offer value/trigger
Details as on 30-Jun-21. Returns are net of management fees and expenses; Returns < 1 yr are absolute. Returns > 1 yr are CAGR, Inception date – 16-Mar-2020
Indicative portfolio composition• Number of stocks: 30-40• Maximum 10% exposure to single stock• Maximum 35% exposure to single sector
1 M 3 M 6 M 1 YSince
Inception
Helios India Rising PMS 4.7% 10.7% 17.8% 59.1% 47.8%
NSE 500 TRI 2.1% 9.8% 17.6% 60.8% 49.0%

31
Helios India Rising (PMS) (2 of 3 slides)
Details as on 30-Jun-21. The M.Cap & Concentration matrix is prepared by HSL basis data provided by the AMC
Top 10 Stocks (%)
ICICI Bank Ltd 6.3
HDFC Bank Ltd 5.8
State Bank Of India 5.4
Dixon Technologies India Ltd 5.0
Infosys Ltd 4.4
Tata Consultancy Services Ltd 4.1
Piramal Enterprises Ltd 4.0
Laurus Labs Ltd 3.7
SRF Ltd 3.3
Apollo Hospitals Enterprises Ltd 3.3
Top Sectors (%)
Banks 22.4
Software / I.T. 17.8
Pharma / Healthcare 12.9
Consumer 12.7
Non Banks 11.4
Others 10.9
Insurance 6.0
Infrastructure 2.2
Market Cap Break-up (%)
Large Cap 69
Mid Cap 21
Small Cap 6
Portfolio Metrics (Rs Cr)
Total AUM 291
Weighted Average Market Cap 1,95,371
Median Market Cap 88,287
Large CapMulti Cap
Mid & Small Cap
Concentrated( < 15 stocks)
Focused(15 - 30 stocks)
aWell Diversified
(> 30 stocks)
32
Helios India Rising (PMS) (3 of 3 slides)
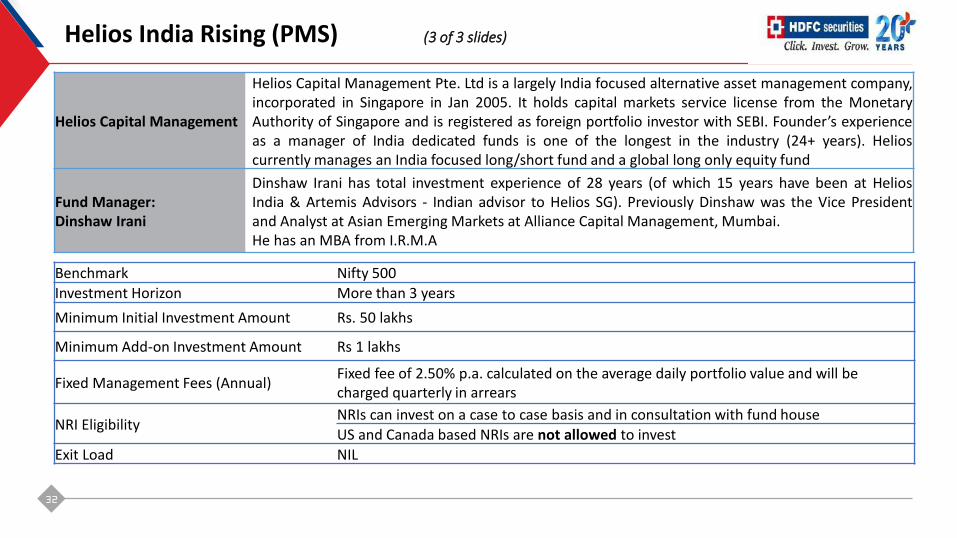
Helios Capital Management
Helios Capital Management Pte. Ltd is a largely India focused alternative asset management company,incorporated in Singapore in Jan 2005. It holds capital markets service license from the MonetaryAuthority of Singapore and is registered as foreign portfolio investor with SEBI. Founder’s experienceas a manager of India dedicated funds is one of the longest in the industry (24+ years). Helioscurrently manages an India focused long/short fund and a global long only equity fund
Fund Manager:Dinshaw Irani
Dinshaw Irani has total investment experience of 28 years (of which 15 years have been at HeliosIndia & Artemis Advisors - Indian advisor to Helios SG). Previously Dinshaw was the Vice Presidentand Analyst at Asian Emerging Markets at Alliance Capital Management, Mumbai.He has an MBA from I.R.M.A
Benchmark Nifty 500
Investment Horizon More than 3 years
Minimum Initial Investment Amount Rs. 50 lakhs
Minimum Add-on Investment Amount Rs 1 lakhs
Fixed Management Fees (Annual)Fixed fee of 2.50% p.a. calculated on the average daily portfolio value and will be charged quarterly in arrears
NRI EligibilityNRIs can invest on a case to case basis and in consultation with fund house
US and Canada based NRIs are not allowed to invest
Exit Load NIL

33
Helios India Rising Fund (AIF) (1 of 4 slides)
Portfolio Strategy and Philosophy• Helios India Rising Fund (AIF) will invest in 3 major themes characterized by “non-zero sum” competition, backed by rigorous
bottom up research and rich experience of the investment team in the Indian equity markets• Private sector companies competing with government-owned companies (mostly in financial /healthcare and infrastructure
sectors)• Companies benefiting from demographic / lifestyle changes in India (mostly in urban or middle class focused under
penetrated sectors)• Companies benefiting from durable factor cost advantages (mostly in export-oriented software/pharmaceuticals/chemicals
and auto ancillaries’ sectors)• Helios believes that bottom up research works best in sectors/themes that have strong tailwinds• It is currently envisaged that the portfolio will generally be underweight in the following areas:
• Commodities sector• “One Billion consumer” stories• State owned companies• Indian companies owning “difficult to analyze” foreign businesses
• 10-15% of the portfolio may not be in preferred themes but should offer value/trigger
Details as on 30-Jun-21. Returns are net of management fees and expenses; Returns < 1 yr are absolute. Returns > 1 yr are CAGR, Inception date – 16-Mar-2020
Indicative portfolio composition• Number of stocks: 30-40• Maximum 10% exposure to single stock• Maximum 35% exposure to single sector
1 M 3 M 6 M 1 YSince
Inception
Helios India Rising PMS* 4.7% 10.7% 17.8% 59.1% 47.8%
NSE 500 TRI 2.1% 9.8% 17.6% 60.8% 49.0%*Since the fund is just being launched, please find above the returns of Helios IndiaRising PMS which follows a similar strategy as Helios India Rising Fund - AIF.

34
Helios India Rising Fund (AIF) (2 of 4 slides)
Details as on 30-Jun-21. The M.Cap & Concentration matrix is prepared by HSL basis data provided by the AMC
Top 10 Stocks (%)
ICICI Bank Ltd 6.3
HDFC Bank Ltd 5.8
State Bank Of India 5.4
Dixon Technologies India Ltd 5.0
Infosys Ltd 4.4
Tata Consultancy Services Ltd 4.1
Piramal Enterprises Ltd 4.0
Laurus Labs Ltd 3.7
SRF Ltd 3.3
Apollo Hospitals Enterprises Ltd 3.3
Top Sectors (%)
Banks 22.4
Software / I.T. 17.8
Pharma / Healthcare 12.9
Consumer 12.7
Non Banks 11.4
Others 10.9
Insurance 6.0
Infrastructure 2.2
Market Cap Break-up (%)*
Large Cap 69
Mid Cap 21
Small Cap 6
Portfolio Metrics (Rs Cr)*
Weighted Average Market Cap 1,95,371
Median Market Cap 88,287
Large CapMulti Cap
Mid & Small Cap
Concentrated( < 15 stocks)
Focused(15 - 30 stocks)
aWell Diversified
(> 30 stocks)
Since the fund is just being launched, please find below details of Helios India Rising PMS which follows a similar strategy as Helios IndiaRising Fund - AIF.

35
Helios India Rising Fund (AIF) (3 of 4 slides)
Helios Capital Management
Helios Capital Management Pte. Ltd is a largely India focused alternative asset management company,incorporated in Singapore in Jan 2005. It holds capital markets service license from the MonetaryAuthority of Singapore and is registered as foreign portfolio investor with SEBI. Founder’s experienceas a manager of India dedicated funds is one of the longest in the industry (24+ years).Helios currently manages an India focused long/short fund and a global long only equity fund
Fund Manager:Dinshaw Irani
Dinshaw Irani has total investment experience of 28 years (of which 15 years have been at HeliosIndia & Artemis Advisors - Indian advisor to Helios SG). Previously Dinshaw was the Vice Presidentand Analyst at Asian Emerging Markets at Alliance Capital Management, Mumbai.He has an MBA from I.R.M.A

36
Helios India Rising Fund (AIF) (4 of 4 slides)
Investment Manager Helios Capital Management India LLPNature of the Scheme Closed ended AIF Category IIIBenchmark Nifty 500Portfolio Manager Mr. Dinshaw IraniTenure 4 years. Extendable by additional period of up to 2 year with prior approval of 2/3rd of Unitholders by Net Capital Contributions valueInitial Contribution In Lumpsum of Minimum Capital Commitment INR 1 Crs. or / In Drawdowns
DrawdownFirst Drawdown (to be paid along with the execution of the Contribution Agreement): 35% of Capital CommitmentSecond Drawdown: 35%Final Drawdown: 30%
NRI EligibilityNRIs can invest on a case to case basis and in consultation with fund house.US and Canada based NRIs are not allowed to invest
Management Fee
AmountFixed Fee Only Fixed + Performance FeeShare Class Fixed Mgt Fees Share Class Fixed Mgt Fees Performance Fee
Rs 1 cr to < Rs 2 crs C1 2.25% B1 1.75%15% sharing over 10%
hurdle rate (NO catch-up)Rs 2 crs to < Rs 5 crs C2 2.00% B2 1.50%Rs 5 crs to < Rs 10 crs C3 1.75% B3 1.25%Rs 10 crs and above C4 1.50% B4 1.00%
Performance Fee High water mark applicableSet-up Fee Up to 2 % of the aggregate Capital CommitmentsOther Expenses On actualsLock-in 12 months from the due date of Final Drawdown/ or Pay in Date which ever is earlier.Liquidity Investors can exit during quarterly exit windows after the lock-in period is over
Exit Load
Exit Period Exit Load<=12 months Lock-in (No Liquidity)>12 months and <=36 months 3% of NAV>36 months but before the maturity date. 1% of NAV

37
Aditya Birla ISOP (PMS) (1 of 3 slides)
Portfolio Strategy and Philosophy• Birla ISOP (India special opportunities portfolio) is a diversified, multi cap portfolio of 15-25 stocks• Core focus on companies that are primed to benefit from micro and macro catalysts• Endeavors to exploit the inefficiencies in the market that lead to mispricing of stocks that are fundamentally strong• Focus on strong quantitative filters and qualitative factors• Quantitative factors include:
• Strong balance sheet• Good capital allocation track record• High return on capital over long time frame
• Qualitative factors include:• High corporate governance• Established business model• Prominent market share• Skilled management
Details as on 30-Jun-21. Returns are net of management fees and expenses; Returns < 1 yr are absolute. Returns > 1 yr are CAGR, Inception date – 15-Jun-2018
1 M 3 M 6 M 1 Y 2 Y 3 YSince
Inception
ISOP 2.8% 13.1% 27.1% 64.7% 25.8% 17.9% 16.3%
Nifty 500 1.9% 9.4% 17.0% 59.0% 18.1% 13.7% 12.6%

38
Aditya Birla ISOP (PMS) (2 of 3 slides)
Details as on 30-Jun-21. The M.Cap & Concentration matrix is prepared by HSL basis data provided by the AMC
Top 10 Stocks (%)
HDFC Bank Ltd 7.9%
Trent Ltd 6.0%
ICICI Bank Ltd 5.4%
Container Corporation of India Ltd
4.9%
Kotak Mahindra Bank Ltd 4.8%
Fortis Healthcare Ltd 4.8%
Persistent Systems Ltd 4.8%
Axis Bank Ltd 4.7%
ION Exchange (India) Ltd 4.1%
Praj Industries Ltd 4.1%
Top Sectors (%)
Financials 26.7%
Industrials 19.9%
Consumer Discretionary 14.2%
Health Care 10.9%
Consumer Staples 10.1%
Communication Services 6.7%
Information Technology 4.8%
Utilities 3.9%
Market Cap Break-up (%)
Large Cap 43
Mid Cap 34
Small Cap 20
Portfolio Metrics (Rs Cr)
Total AUM 548
Weighted Average Market Cap 1,68,026
Median Market Cap 36,381
Large CapMulti Cap
Mid & Small Cap
Concentrated( < 15 stocks)
aFocused
(15 - 30 stocks)
Well Diversified(> 30 stocks)

39
Aditya Birla ISOP (PMS) (3 of 3 slides)
Aditya Birla Sun LifeAMC
Founded in 1994, Aditya Birla Sun Life (ABSL) Asset Management Co. is a joint venture (since 2001) betweentwo pioneering companies – Aditya Birla Group, a $ 44 billion corporation and one of the largest Indianconglomerates and Sun Life Financial, a leading financial services company in Canada which manages AUM ofCAD $ 979 billion. ABSL Portfolio Management Services offer investment solutions to HNIs and Institutionsand currently manages / advices appx Rs. 15,000 Crores of assets.
Fund Manager:Vishal Gajwani
Vishal Gajwani has total experience of 12 years in the field of equity research and portfolio management.Previously Vishal was a part of Reliance portfolio management services (a part of Reliance capital assetmanagement ltd.), where he was designated as an assistant fund manager and was responsible for managingequity portfolios.He is a gold medalist CA (ICAI, India), holds a master’s degree in commerce and a CFA charter holder from CFAinstitute (The Global Association of Investment Professionals) USA
Benchmark Nifty 500
Investment Horizon More than 3 years
Minimum Initial Investment Amount Rs. 50 lakhs
Minimum Add-on Investment Amount Rs 1 lakhs
Fixed Management Fees (Annual)Fixed fee of 2.50% p.a. calculated on the average daily portfolio value and will be charged monthly in arrears
NRI EligibilityNRIs can invest on a case to case basis and in consultation with fund house
US based NRIs are allowed for investment
Exit Load 1% up to 1 year. NIL there after

40
Ambit Good & Clean Mid Cap (PMS) (1 of 3 slides)
Portfolio Strategy and PhilosophyThe strategy aims to invest in firms which are:• Good: on the basis of capital allocation track record and quality of improvement in financial metrics over the past six years• Clean: based on the quality of accounts and corporate governance• The focus on 'good' helps generate upside while not compromising on 'clean' reduces down-side risk• The strategy uses Ambit's proprietary 'forensic accounting' framework to weed out firms with poor quality accounts whereas
the 'greatness framework' helps identify efficient capital allocators with a holistic approach to consistent growth• Essentially, while the objective is to generate returns, the even bigger goal is to manage drawdowns
Portfolio Composition & Characteristics• Stellar track record of capital allocation in terms of RoE• Low debt companies - median portfolio company is cash positive• Reasonable valuation for quality stocks
Indicative Portfolio Composition• <20 stocks, maximum 10% exposure to single stock and 25% exposure to single sector• Low churn (<15-50% of the portfolio in any year, amounting to 2-3 holdings being replaced)
Details as on 30-Jun-21. Returns are net of management fees and expenses; Returns < 1 yr are absolute. Returns > 1 yr are CAGR, Inception date – 12-Mar-2015
1 M 3 M 6 M 1 Y 2 Y 3 Y 5 Y Since Inception
Ambit G&C Midcap Portfolio 3.7% 8.7% 22.4% 67.1% 20.9% 21.2% 18.0% 15.4%
Nifty Midcap 100 4.6% 13.8% 29.4% 83.4% 23.6% 14.0% 14.3% 11.8%
Nifty 50 0.9% 7.0% 12.4% 52.6% 15.5% 13.6% 13.7% 9.7%

41
Ambit Good & Clean Mid Cap (PMS) (2 of 3 slides)
Details as on 30-Jun-21. The M.Cap & Concentration matrix is prepared by HSL basis data provided by the AMC
Top 10 Stocks (%)
P I Industries Ltd 7.0%
Laurus Labs Ltd 7.0%
Tvs Motor Company Ltd 6.0%
Kajaria Ceramics Ltd 6.0%
Icici Lombard General Insurance Co Ltd
6.0%
Page Industries Ltd 6.0%
Torrent Pharma Ltd 6.0%
PVR Ltd 6.0%
Persistent Systems Ltd 6.0%
City Union Bank 5.0%
Top Sectors (%)
Financials 27.0%
Cons Discretionary 17.0%
Pharmaceuticals 13.0%
Specialty Chemicals 12.0%
Homebuilding 11.0%
Automobile 6.0%
IT Services 6.0%
Market Cap Break-up (%)
Large Cap 22
Mid Cap 68
Small Cap 06
Portfolio Metrics (Rs Cr)
Total AUM 570
Weighted Average Market Cap 39,828
Median Market Cap 28,486
Large CapMulti Cap
Mid & Small Cap
Concentrated( < 15 stocks)
aFocused
(15 - 30 stocks)
Well Diversified(> 30 stocks)

42
Ambit Good & Clean Mid Cap (PMS) (3 of 3 slides)
Ambit Capital
Founded in 1997 as a boutique M&A Advisory firm, Ambit added various offerings over two decades tobecome a full service India focused Investment Bank. Ambit Capital has a stable experienced team of over 450employees and has global presence with offices in Mumbai, Delhi, Bangalore, London, New York andSingapore.
Fund Manager:Aishvarya Dadheech
Aishvarya Dadheech has work experience over 12 years in Indian equities. He has been managing Ambit’sG&C Mid cap and Emerging Giants portfolios for last 2 years. Prior to that he was managing Ambit’sproprietary book for nearly 1.5 years. Previously Aishvarya has worked with Reliance Life Insurance and Crisil.He is a CFA charter holder, CA (ICAI, India) and has done his MBA in finance.
Benchmark Nifty Midcap 100
Investment Horizon More than 3 years
Minimum Initial Investment Amount Rs. 50 lakhs
Minimum Add-on Investment Amount Rs 2.5 lakhs
Fixed Management Fees (Annual)Fixed fee of 2.50% p.a. calculated on the average daily portfolio value and will be charged quarterly in arrears
NRI EligibilityNRIs can invest on a case to case basis and in consultation with fund house
US and Canada based NRIs are not allowed to invest
Exit Load 1% up to 1 year. NIL there after

43
PMS/AIF Performance Summary

44
PMS/AIF Performance Summary
Performance as on 30-Jun-21. Returns <1 year are in absolute terms & >1 year are CAGR. Portfolio details as of Jun’21.
**Founder^ currently the portfolio is only 78% invested
Scheme NameFund Manager Corpus
(in Crs)1 Month 3 Months 6 Months 1 Year 2 Years 3 Years 5 Years Large Cap Mid Cap Small Cap # Stocks
Median M.CapName
Multi Cap Funds
Unified Blended Rangoli PMS Mr. Sarath Reddy 3,454 6.8 24.2 32.3 94.2 46.6 30.5 - 18 28 33 10^ 13,708
Abbakus All Cap Approach PMS Sunil Singhania 200 10.9 19.7 50.3 - - - - 39 54 3 22 24,000
White Oak India Pioneers Equity Prashant Khemka** 3,284 4.2 12.5 19.9 67.6 29.4 - - 55 32 12 50 33,108
ASK: IEP Chetan Thacker 16,828 2.8 9.0 15.9 61.4 22.6 15.9 16.6 70 26 4 23 87.924
ASK: India Select Chetan Thacker 4,450 4.9 12.1 14.1 49.6 19.2 13.5 13.9 75 20 5 23 99,332
Helios India Rising Fund Dinshaw Irani 291 4.7 10.7 17.8 59.1 - - - 69 21 6 36 88,287
Aditya Birla Isop Vishal Gajwani 548 2.8 13.1 27.1 64.7 25.8 17.9 - 43 34 20 24 36.381
Mid & Small Cap Funds
Ambit G&C Aishvarya Dadheech 570 3.7 8.7 22.4 67.1 20.9 21.2 18.0 22 68 6 18 28.486
Indices
Nifty 50 TRI 1.1 7.5 13.2 54.6 16.8 15.0 15.1
S&P BSE 500 TRI 2.1 9.9 18.0 61.8 19.9 15.3 15.6
S&P BSE MID CAP TRI 3.7 11.9 26.3 74.4 24.7 14.7 15.2
S&P BSE SMALL CAP TRI 7.0 22.3 39.9 105.4 34.4 17.5 17.4

45
Long-Short AIF Strategies

46
Avendus Absolute Return Strategy (PMS) (1 of 4 slides)
Portfolio Strategy and Philosophy• The strategy is based on the team’s assessment of markets from a global and local perspective and looking at important macros to
determine the sectors and stocks which are likely to outperform and underperform the markets.• Assessment of fundamental, technical and momentum factors are used to arrive at the pool of stocks for portfolio construction on
long and short side• For Long positions, cash equities and derivative instruments would be used, whereas for short positions derivative instruments/
Securities Lending and Borrowing Mechanism (SLBM) would be used• A combination of long and short positions in the portfolio will aim to generate returns with lower volatility over a period of time • Gross exposure of the fund (long + short positions) will not exceed 100% of net assets • Net exposure (long – short positions) will typically be between 10% - 50% (Can be zero / negative if bearish) • Long Short Investment Positions: will be driven by fundamental research, with a technical/quantitative overlay backed by a price
target, generally around year.• Long/Short Trading Positions: will be more driven by technical/quantitative analysis and generally have a holding period of less
than a month • Net Market Exposure: will be dynamically managed, having due regard for near-term market view and will generally be hedged
using single stock futures as well as, at-the-money and/or out-of-the-money index options to minimize downside risk to the portfolio
Details as on 30-June-21. Returns are net of fees & pre tax; Returns < 1 yr are absolute. Returns > 1 yr are CAGR, Inception date – 03-Aug-2020
1 M 3 M 6 M Since Inception
Avendus Absolute Return Strategy 0.04 0.94 4.08 8.21
*CRISLQFD 0.28 0.87 1.75 3.35
**NSE50ARB 0.30 1.27 2.50 3.86

47
Avendus Absolute Return Strategy (PMS) (2 of 4 slides)
Risk Management• Portfolio volatility will generally be maintained at a level lower than that of the broader equity stock market• Strategy intends to buy options on stocks/indices; it does not intend to write open options• Liquidity risk will be mitigated by maintaining liquid asset cover to meet worst historical redemption; and calibrating portfolio
liquidity profile to endure stressed market conditions
Details as on 30-June-21.
Top Longs
Tech Mahindra Ltd 3.3
HDFC Standard Life insurance
3.2
HDFC Bank Ltd 2.5
Tata Motors Ltd 2.5
TVS Motors Ltd 2.4
Total Longs 31.6
Top Shorts
Nifty Index 5.3
Britannia Industries Ltd 0.9
NMDC Ltd 0.6
Grasim Industries Ltd 0.4
Dr Lal Pathlabs Ltd 0.4
Total Shorts 13.0
Exposure
Gross Exposure 44.5%
Net Exposure 18.6%
Gross Exposure = Long Exposure + Short ExposureNet Exposure = Long Exposure - Short Exposure

48
Avendus Absolute Return Strategy (PMS) (3 of 4 slides)
Avendus Capital Markets LLP
Avendus Capital Public Markets Alternate Strategies LLP (“ACPMAS LLP”) is the Investment Manager for AIFCAT III funds, under the wider group of Avendus Capital, a financial institution covering a wide area offinancial advisory, wealth management, structured credit solutions and alternative asset management. KKR isa majority financial investor in the group entity
Fund ManagementTeam
ACPMAS LLP team has over 100 years of cumulative experience investing in Indian markets. Highly experienced professionals comprising of ex Merrill Lynch fund managers from the Strategic Risk Group led by Andrew Holland. The core investment team has over 15 years of track record Team has the skill set around managing Long/Short strategy and has pioneered the “Alternative Investment Fund Category III Long-Short Fund” in India
The Avendus team was awarded the Best Indian Hedge Fund at the Eureka Hedge Asian Hedge Fund Awards in 2019 and Best Single Country Award at the HFM Asia Hedge Awards 2019 for their onshore strategy- AvendusAbsolute Return Fund.

49
Avendus Absolute Return Strategy (PMS) (4 of 4 slides)
*(Pre performance fee value will be the next HWM)Note: The costs / expenses charged to the scheme include custody ; fund accountant ; operational charges etc. which can go uptomax. 50 bps and brokerage transaction charges at actuals. Kindly refer to the Scheme’s Disclosure Document for further details
Type of Scheme Discretionary Portfolio Management Services
Term of the Fund 5 years (Open-ended)
Redemption Windows Monthly
Exit Load Nil
Minimum Commitment
Rs 5 Crore
Drawdowns 100% at the time of application
FeesMaximum Indicative Rate (% p.a.) [basis clients daily average assets under management]
Option I Option II
Management Fee 1.00% p.a. 0.25% p.a.
Performance Fees20% of the profits over and above the hurdle rate
10% p.a. on all profits
Hurdle Rate/HWM8% p.a. (pre-Tax) on an annualized basis calculated at the compounded rate of return.
*High Watermark Applicable
Taxation Taxation at investor level

50
Equity MF Performance Summary

51
Equity Mutual Funds Performance Summary
Performance Market Cap Allocation
Scheme Name Fund Manager NameCorpus
1 Month 3 Months 6 Months 1 Year 2 Years 3 Years 5 Years Large Cap Mid Cap Small CapOthers &
Cash(in Crs)
Large Cap Funds
Axis Bluechip Fund-Reg(G) Shreyash Devalkar 27,142 3.4 7.2 9.4 46.1 18.2 15.6 16.5 96 1 3
Canara Rob Bluechip Equity Fund-Reg(G) Shridatta Bhandwaldar 2,886 3.5 7.3 13.8 50.9 21.9 17.9 16.8 88 7 4
UTI Mastershare-Reg(D) Swati Kulkarni 8,213 3.5 7.3 14.7 55.1 18.6 13.9 13.5 86 8 4 3
Multi Cap/Flexi Cap Funds
Canara Rob Flexi Cap Fund-Reg(G) Shridatta Bhandwaldar 4,244 4.2 9.6 17.0 55.0 21.2 17.6 17.3 71 22 3 5
DSP Flexicap Fund(G) Atul Bhole 5,687 5.0 11.1 20.7 60.3 22.5 17.5 16.6 59 29 11
UTI Flexi Cap Fund-Reg(G) Ajay Tyagi 18,405 4.2 8.3 16.3 69.6 27.6 18.7 17.3 63 28 6 3
Large & Mid Cap Funds
Canara Rob Emerg Equities Fund-Reg(G) Miyush Gandhi 8,988 6.1 11.6 20.2 64.9 23.5 16.6 17.9 55 40 2 3
Kotak Equity Opp Fund(G) Harsha Upadhyaya 6,362 4.3 9.4 19.9 55.9 21.4 16.9 16.0 54 37 7 3
Tata Large & Mid Cap Fund(G) Chandraprakash Padiyar 2,301 3.6 7.1 18.6 57.3 19.2 17.3 14.2 53 38 5 4
Mid Cap Funds
Axis Midcap Fund-Reg(G) Shreyash Devalkar 11,834 5.6 11.8 21.9 62.2 28.5 21.4 19.3 25 64 4 7
Invesco India Midcap Fund (G) Pranav Gokhale 1,706 5.9 12.5 24.5 65.9 26.9 18.6 17.0 9 68 14 10
Kotak Emerging Equity Fund(G) Pankaj Tibrewal 12,463 6.3 13.6 32.0 83.5 28.9 19.7 17.6 14 65 19 3
Indices
NIFTY 50 - TRI 1.1 7.5 13.2 54.6 16.8 15.0 15.1
S&P BSE 500 - TRI 2.1 9.9 18.0 61.8 19.9 15.3 15.6
S&P BSE Mid-Cap - TRI 3.7 11.9 26.3 74.4 24.7 14.7 15.2
S&P BSE Small-Cap - TRI 7.0 22.3 39.9 105.4 34.4 17.5 17.4
Performance as on 30th June. Returns <1 year are in absolute terms & >1 year are CAGR. Portfolio details as of May end

52
Equity Mutual Funds Performance Summary
Performance Market Cap Allocation
Scheme Name Fund Manager NameCorpus (in Crs)
1 Month 3 Months 6 Months 1 Year 2 Years 3 Years 5 Years Large Cap Mid Cap Small CapOthers &
Cash
Small Cap Funds
Kotak Small Cap Fund(G) Pankaj Tibrewal 4,294 5.1 17.9 43.3 119.5 40.0 23.9 19.7 5 22 63 11
Nippon Small Cap Fund(G) Samir Rachh 15,353 7.0 22.5 44.1 108.5 34.6 20.2 21.2 7 18 72 3
Value/Contra Funds
ICICI Pru Value Discovery Fund (G) Sankaran Naren 20,786 2.0 11.2 22.8 61.1 21.0 14.5 12.3 75 12 6 7
UTI Value Opp Fund-Reg(G) Vetri Subramaniam 5,917 4.4 9.6 19.2 60.5 21.9 15.4 14.2 69 19 9 3
Focused Funds
Axis Focused 25 Fund-Reg(G) Jinesh Gopani 16,540 3.4 9.2 10.8 52.4 19.9 14.5 17.5 85 7 9
SBI Focused Equity Fund-Reg(G) R. Srinivasan 15,879 5.3 11.9 19.6 53.6 20.2 17.1 16.7 48 31 1 20
ELSS Funds
Axis Long Term Equity Fund-Reg(G) Jinesh Gopani 29,575 4.2 9.2 12.4 53.6 20.4 15.7 16.1 84 13 3
Kotak Tax Saver Fund(G) Harsha Upadhyaya 1,988 4.4 10.0 20.8 58.4 19.2 17.2 15.8 58 30 11 1
Mirae Asset Tax Saver Fund (G) Neelesh Surana 8,338 3.5 10.0 21.5 68.1 24.7 20.5 21.1 68 18 10 4
Index Funds
HDFC Index Fund-NIFTY 50 Plan(G) Krishan Daga 3,210 2.2 6.3 13.0 53.8 16.0 14.3 14.4 100
UTI Nifty Index Fund-Reg(G) Sharwan Kumar 4,022 2.2 6.3 13.1 54.2 16.4 14.6 14.7 100
Indices
NIFTY 50 - TRI 1.1 7.5 13.2 54.6 16.8 15.0 15.1
S&P BSE 500 - TRI 2.1 9.9 18.0 61.8 19.9 15.3 15.6
S&P BSE Mid-Cap - TRI 3.7 11.9 26.3 74.4 24.7 14.7 15.2
S&P BSE Small-Cap - TRI 7.0 22.3 39.9 105.4 34.4 17.5 17.4
Performance as on 30th June. Returns <1 year are in absolute terms & >1 year are CAGR. Portfolio details as of May end

53
Equity Mutual Funds Performance Summary
Performance Market Cap Allocation
Scheme Name Fund Manager NameCorpus (in Crs)
1 Month 3 Months 6 Months 1 Year 2 Years 3 Years 5 Years Large Cap Mid Cap Small CapOthers &
Cash
Aggressive Hybrid Funds
Canara Rob Equity Hybrid Fund-Reg(G) Shridatta Bhandwaldar 5,636 3.2 7.1 12.8 40.3 18.3 15.4 14.4 56 17 27
DSP Equity & Bond Fund-Reg(G) Atul Bhole 6,769 3.6 8.2 14.8 43.8 19.1 15.4 13.9 47 19 8 25
SBI Equity Hybrid Fund Rahul Baijal 39,977 2.5 6.9 12.6 39.6 15.6 13.7 12.9 54 11 2 33
Dynamic Asset Allocation Funds
Aditya Birla SL Advantage Fund (G) Mohit Sharma 3,969 1.8 6.0 8.4 32.1 13.9 11.8 11.2 50 8 5 37
ICICI Pru Balanced Advantage Fund (G) Arpit Kapoor 32,188 1.2 4.3 9.0 31.0 13.1 11.5 11.0 60 6 1 33
Equity Savings Funds
Axis Equity Saver Fund-Reg(G) Anupam Tiwari 761 1.9 3.4 5.5 22.8 10.3 8.9 9.0 65 3 31
SBI Equity Savings Fund - Reg(G) Neeraj Kumar 1,411 1.1 4.2 7.7 26.4 12.0 9.6 8.7 64 6 3 28
Arbitrage Funds
Aditya Birla Sun life Arbitrage-Reg(G) Lovelish Solanki 7,445 0.5 1.3 2.3 3.5 4.6 5.1 5.5 52 13 1 34
Kotak Equity Arbitrage Fund(G) Hiten Shah 20,291 0.5 1.3 2.3 3.7 4.7 5.2 5.6 50 18 1 31
Tata Arbitrage Fund-Reg(G) Sailesh Jain 6,302 0.5 1.2 2.2 3.7 5.0 - - 46 19 1 33
Indices
NIFTY 50 - TRI 1.1 7.5 13.2 54.6 16.8 15.0 15.1
S&P BSE 500 - TRI 2.1 9.9 18.0 61.8 19.9 15.3 15.6
S&P BSE Mid-Cap - TRI 3.7 11.9 26.3 74.4 24.7 14.7 15.2
S&P BSE Small-Cap - TRI 7.0 22.3 39.9 105.4 34.4 17.5 17.4
Performance as on 30th June. Returns <1 year are in absolute terms & >1 year are CAGR. Portfolio details as of May end

54
Equity Mutual Funds Performance Summary
Performance Market Cap Allocation
Scheme Name Fund Manager NameCorpus (in Crs)
1 Month 3 Months 6 Months 1 Year 2 Years 3 Years 5 Years Large Cap Mid Cap Small CapOthers &
Cash
Other Recommended Funds
Aditya Birla SL Mfg. Equity Fund-Reg(G)
Anil Shah 643 4.8 14.3 19.5 55.3 23.2 12.8 13.7 43 27 17 13
Nippon India Power & Infra Fund(G) Sanjay Doshi 1,438 4.4 11.8 28.9 62.6 15.1 10.8 12.5 56 17 24 2
L&T Infrastructure Fund Venugopal Manghat 1,238 5.4 13.3 31.4 63.4 13.2 8.2 13.1 37 31 32
ICICI Pru Multi-Asset Fund(G) Sankaran Naren 11,730 1.2 8.8 18.5 43.4 14.8 13.1 13.6 66 4 5 26
DSP US Flexible Equity Fund-Reg(G) Laukik Bagwe 440 2.8 8.1 16.5 42.0 28.0 19.0 18.8
Gold Funds
Kotak Gold Fund(G) Abhishek Bisen 968 -3.7 5.2 -6.7 -4.4 16.8 15.0 8.1
HDFC Gold Fund(G) Krishan Daga 1,229 -3.9 4.8 -7.0 -5.0 16.2 14.0 7.5
Indices
NIFTY 50 - TRI 1.1 7.5 13.2 54.6 16.8 15.0 15.1
S&P BSE 500 - TRI 2.1 9.9 18.0 61.8 19.9 15.3 15.6
S&P BSE Mid-Cap - TRI 3.7 11.9 26.3 74.4 24.7 14.7 15.2
S&P BSE Small-Cap - TRI 7.0 22.3 39.9 105.4 34.4 17.5 17.4
Performance as on 30th June. Returns <1 year are in absolute terms & >1 year are CAGR. Portfolio details as of May end

55
Debt MF Performance Summary

56
Debt Mutual Funds Performance Summary
Performance Credit Allocation Portfolio Metrics
Scheme Name Fund Manager NameCorpus (in Crs)
1 Month 3 Months 6 Months 1 Year 2 Years 3 Years 5 Years AAA & EqAA &
BelowYTM (%)
Avg. Maturity
(Yrs)
Liquid / Overnight Funds
Axis Liquid Fund-Reg(G) Devang Shah 24,177 3.3 3.2 3.2 3.2 4.4 5.4 6.0 99 1 3.5 0.1
Kotak Liquid Fund-Reg(G) Deepak Agrawal 29,526 3.2 3.2 3.1 3.2 4.3 5.3 5.9 100 3.5 0.1
UTI Liquid Fund(G) Amandeep Singh Chopra 26,230 3.3 3.2 3.2 3.2 4.3 5.4 6.0 100 3.4 0.1
Money Market / Floater Funds
Aditya Birla SL Money Manager Fund(G) Kaustubh Gupta 13,622 3.7 3.9 3.9 4.3 6.2 6.9 7.0 100 4.0 0.4
HDFC Money Market Fund –(G) Anil Bamboli 13,854 3.6 3.9 3.8 4.2 6.2 6.8 6.8 100 4.0 0.4
Tata Money Market Fund – (G) Amit Somani 3,864 3.6 4.0 4.0 4.3 6.0 4.2 5.3 100 3.9 0.5
Ultra Short Duration / Low Duration Funds
Aditya Birla Sun Life Savings Fund Kaustubh Gupta 18,789 3.6 4.4 3.8 4.8 6.5 7.2 7.4 88 12 4.4 0.5
Tata Treasury Advantage Fund(G) Akhil Mittal 2,503 2.7 4.2 3.4 4.7 6.6 5.1 6.0 100 4.1 0.8
IDFC Low Duration Fund-Reg(G) Anurag Mittal 9,169 2.6 3.9 3.4 4.1 6.4 7.0 7.1 100 3.9 0.6
Corporate Bond Funds
Axis Corp Bond Fund (G) Devang Shah 4,876 0.9 5.2 3.2 6.3 9.2 7.9 - 95 5 4.9 2.4
HDFC Corp Bond Fund(G) Anupam Joshi 26,698 0.8 5.9 2.8 5.7 8.9 9.3 8.4 100 5.4 4.3
ICICI Pru Corp Bond Fund(G) Anuj Tagra 20,276 3.1 5.2 3.6 5.8 8.6 8.7 8.0 100 5.1 4.2
Banking and PSU Funds
Aditya Birla SL Banking & PSU Debt(G) Kaustubh Gupta 16,857 1.5 6.0 2.8 5.4 8.5 8.9 8.2 97 3 5.0 2.7
ICICI Prudential Banking & PSU Debt Fund Rahul Goswami 14,345 2.6 5.9 3.5 5.8 8.0 8.2 7.9 80 20 5.9 6.6
Nippon India Banking & PSU Debt Fund Pranay Sinha 6,410 1.4 5.4 3.1 5.2 8.9 9.1 8.2 100 5.1 2.9
Performance as on 30th June. Returns <1 year are in simple annualised terms & >1 year are CAGR. Portfolio details as of May end

57
Debt Mutual Funds Performance Summary
Performance Credit Allocation Portfolio Metrics
Scheme Name Fund Manager NameCorpus (in Crs)
1 Month 3 Months 6 Months 1 Year 2 Years 3 Years 5 Years AAA & EqAA &
BelowYTM (%)
Avg. Maturity
(Yrs)
Medium Duration / Short Duration Funds
Aditya Birla Sun Life Short Term Fund Kaustubh Gupta 7,725 1.9 6.0 3.2 7.5 8.4 8.6 7.9 87 13 5.2 2.9
ICICI Pru Short Term Fund(G) Manish Banthia 20,921 2.3 5.6 3.5 6.1 8.6 8.6 8.0 81 19 5.6 4.1
IDFC Bond Fund - Short Term Plan-Reg(G) Suyash Choudhary 13,701 0.7 4.6 2.6 4.6 8.0 8.3 7.5 100 4.6 1.8
Dynamic Bond Funds
IDFC Dynamic Bond Fund-Reg(G) Suyash Choudhary 3,292 -0.6 6.3 -0.3 3.2 8.7 9.9 8.5 100 4.4 2.2
Kotak Dynamic Bond Fund-Reg(G) Deepak Agrawal 2,848 2.8 5.7 1.3 5.2 8.4 9.7 8.8 91 9 6.0 5.4
SBI Dynamic Bond Fund-Reg(G) Dinesh Ahuja 3,072 1.5 3.4 0.8 3.2 8.1 9.3 8.2 100 4.4 4.2
Long Duration / Medium to Long Duration Funds
ICICI Pru Bond Fund(G) Manish Banthia 3,352 -1.0 5.1 1.8 5.1 8.9 9.1 8.0 100 6.1 8.0
IDFC Bond Fund - Income Plan-Reg(G) Suyash Choudhary 685 -1.7 5.6 -0.8 2.6 7.7 9.3 7.9 100 4.5 2.4
Kotak Bond Fund (G) Abhishek Bisen 2,071 4.0 6.0 -0.1 4.1 8.1 8.9 7.2 100 6.3 7.3
Gilt
ICICI Pru Constant Maturity Gilt Fund(G) Rahul Goswami 325 -1.8 7.2 1.0 4.3 9.7 11.6 9.6 100 6.5 9.4
IDFC G-Sec-Invest-Reg(G) Suyash Choudhary 1,969 -0.8 6.5 -0.1 3.5 9.3 11.3 9.3 100 4.6 2.5
Performance as on 30th June. Returns <1 year are in simple annualised terms & >1 year are CAGR. Portfolio details as of May end
58
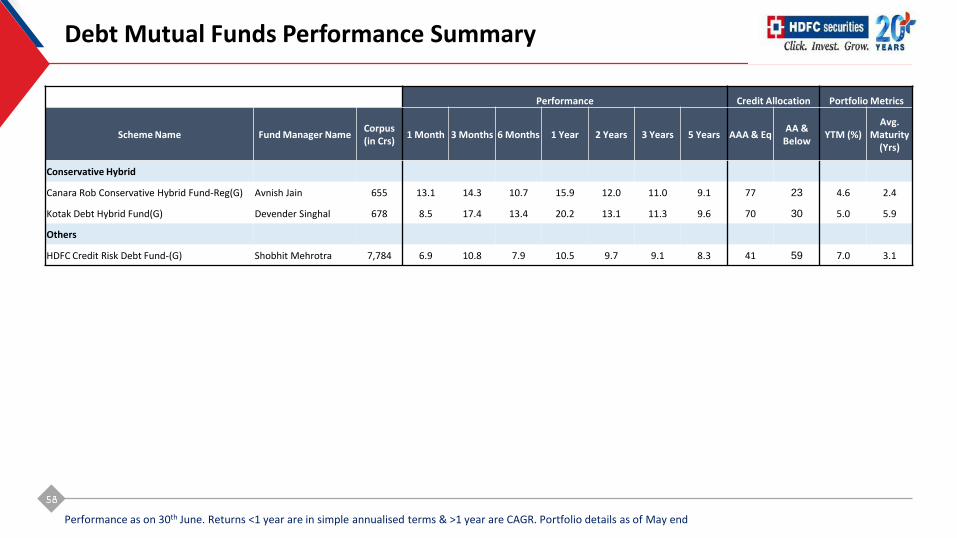
Debt Mutual Funds Performance Summary
Performance Credit Allocation Portfolio Metrics
Scheme Name Fund Manager NameCorpus (in Crs)
1 Month 3 Months 6 Months 1 Year 2 Years 3 Years 5 Years AAA & EqAA &
BelowYTM (%)
Avg. Maturity
(Yrs)
Conservative Hybrid
Canara Rob Conservative Hybrid Fund-Reg(G) Avnish Jain 655 13.1 14.3 10.7 15.9 12.0 11.0 9.1 77 23 4.6 2.4
Kotak Debt Hybrid Fund(G) Devender Singhal 678 8.5 17.4 13.4 20.2 13.1 11.3 9.6 70 30 5.0 5.9
Others
HDFC Credit Risk Debt Fund-(G) Shobhit Mehrotra 7,784 6.9 10.8 7.9 10.5 9.7 9.1 8.3 41 59 7.0 3.1
Performance as on 30th June. Returns <1 year are in simple annualised terms & >1 year are CAGR. Portfolio details as of May end

59
Direct Debt / Bond Offering

60
Direct Debt/Bond Offerings
Bond Rating Coupon Maturity IP Date Yield ISIN
Tax Free Bonds
REC Tax Free 2027 AAA 8.12% 27-Mar-27 01st Jul 4.36% INE020B07GH7
IRFC Tax Free 2022 AAA 7.22% 06-Dec-22 15th Oct 3.62% INE053F09HZ5
PSU Bonds
REC Ltd. 2028 (Unsecured) AAA by CARE, CRISIL 8.56% 29-Nov-28 29th May/29th Nov 6.78% INE020B08BG8
IRFC Ltd. 2035 (Secured) AAA by CARE, CRISIL 6.90% 05-Jun-35 15th Apr 6.93% INE053F07CD7
Private Bonds
HDFC Limited 2031 (Secured) AAA by CRISIL & ICRA 6.88% 16-June-31 16th June 6.89% INE001A07SZ6
Shriram Transport Finance Company Ltd 2023 (Secured)
AA+ by CRISIL 9.50% 27-Feb-23 26th Feb 7.45% INE721A07PT8
Muthoot Finance Ltd 2024 (Secured) AA+ by CRISIL & AA by ICRA 7.40% 05-Jan-24 05th Nov 6.95% INE414G07FF7
Tata Capital Financial Services Ltd 2021 (Secured)
AAA by CRISIL & CARE 8.80% 27-Sep-21 MMY 4.35% INE306N07KD6
Bond quotes as of 12th July 2021. These are indicative in nature and subject to market change. Above quotes are being shared only for information and should not be construed as arecommendation or advice.The quotes mentioned above are from the OTC market where institutions trade and thus there can be a variance with the quotes shared from the exchanges in the secondary market dueto low volumes and lower demand/supply.Effective 1st Nov’20 the trading lots for all new issuances of Bank Perpetual bonds will be Rs 1 crore.Bond quotes listed above serve as a sample and are an indicator of the prevailing yields. The actual availability could be more exhaustive and have many more papers. Yields on thepapers will vary depending on the day/time of the transaction.

61
Corporate Fixed Deposits
Regular Deposit Cumulative Option ROI (p.a.)Additional for Senior
Citizen
Credit Rating 1 Yr 2 Yr 3 Yr 4 Yr 5 YrSenior Citizen
W.e.f
HDFC Limited CRISIL- FAAA & ICRA - MAAA 5.70% 5.85% 6.05% 6.05% 6.40% 0.25% 30-Mar-21
Mahindra Finance Ltd CRISIL- FAAA & ICRA - MAAA 5.70% 6.20% 6.30% 6.45% 6.45% 0.25% 24-Aug-20
Bajaj Finance Ltd. CRISIL- FAAA & ICRA - MAAA 5.65% 6.10% 6.50% 6.50% 6.50% 0.25% 12-May-21
LIC Housing Finance CRISIL – FAAA & ICRA - MAAA 5.10% 5.50% 5.60% - 5.60% 0.25% 1-Apr-21
Shriram Transport CRISIL – FAAA & ICRA – MAA+ 7.25% 7.50% 8.00% 8.10% 8.25% 0.40% 1-Apr-21
ICICI Home Finance CRISIL- FAAA & ICRA - MAAA 5.70% 5.85% 6.05% 6.30% 6.45% 0.25% 15-Apr-21
Quotes as on 12th July 2021The above quotes are indicative in nature and subject to market change. Above quotes are being shared only for information and should not be construed as a recommendation or advice.

62
RBI Bonds
Issue By Reserve Bank of India
Who can investResident individuals (including joint holdings) & HUF
NRIs are not eligible to invest
Issue price At par (Rs 1,000 per unit)
Minimum amount Rs 1,000/- (face value) in multiples thereof
Maximum amount No maximum limit
Maturity/ Repayment of principal7 year (lock in period) from the date of issue. Premature redemption shall be allowed forspecified categories of senior citizens, subject to minimum lock in period
Interest rate & periodicity
Currently, the bonds have a floating interest rate of 7.15% p.a.
Floating Interest is payable semi annually on 1st January & 1st July
Coupon rate payable next half would be reset every 1st January & 1st July
Tax treatment Income from the bonds is taxable
Transferability/liquidity Not transferable, not tradable in secondary market

63
Sovereign Gold Bonds (SGB)

64
Sovereign Gold Bonds (SGB)
Issued by Sovereign gold bonds are issued by RBI on behalf of Government of India
Minimum application criteria 1 unit (i.e. 1 gram of gold)
Maximum application limitNot be more than 4kg for individuals/HUFs and 20kgs for trusts/similar entities per fiscal year (April-March). Theannual ceiling includes bonds subscribed under different tranches during initial issuance by government and thosepurchased from the secondary market
TenorThe tenor of the Bond will be for a period of 8 years with exit option after the 5th year of the date of issue andsuch redemptions shall be made on the next interest payment dates.
Issue pricePrice of Bond will be fixed in Indian Rupees on the basis of simple average of closing price of gold of 999purity published by the India Bullion and Jewelers Association Limited for the last 3 working days of theweek preceding the subscription period
Redemption price
The sovereign gold bonds will be redeemed for cash at the end of the investment tenure. Redemption will takeplace at the prevailing gold price (simple average of closing price of gold of 999 purity of previous 3 working dayspublished by IBJA), giving the investor the value of the bond plus capital appreciation/depreciation fromincrease/fall in gold price.
Interest RateThe Sovereign Gold Bonds offer an interest rate of 2.50% per annum payable semi-annually. Interest will becredited semi-annually to the bank account of the investor.
Taxation The interest on Gold Bonds shall be taxable as per the provision of Income Tax Act, 1961 (43 of 1961). The capitalgains tax arising on redemption of SGB to an individual has been exempted. The indexation benefits will beavailable to long term capital gains arising to any person on transfer of bond

65
Sovereign Gold Bonds (SGB)
Key Benefits
• Sovereign Gold Bonds deliver two streams of returns. One in the form of regular interest of (2.50% p.a.) on invested capital
every six months and the other in the form of capital gains at the time of redemption in case the price at the time of
redemption is higher.
• During primary issuance, the online mode offers a discount of Rs 50/- per gram
• Bonds are freely tradable on stock exchanges within a fortnight of the issuance on a date notified by the RBI
• Exempt from capital gains tax, if held till maturity
Details on current tranche:
• Tranche – FY 22 series IV
• Date of subscription – 12-July-21 to 16-July-21
• Date of issuance – 20-July-21
• Issue price - Rs. 4,757 (Rupees four thousand seven hundred and fifty-seven only) per gram of gold for those who subscribe
online and pay through digital mode and Rs. 4,807 (Rupees four thousand eight hundred and seven only) per gram for others

66
Estate Planning Services

67
Estate Planning Services – Wills & Trusts
• Estate & Succession Planning is provided through Vistra ITCL (India) Ltd.
• Vistra ITCL (India) Ltd. is managed by a team of professionals from the field of banking, law, taxation, accounting andmanagement.
• Trusts help in creating protection with respect to encumbrance risk, financial risk, family risk, etc.
• Client needs are met through:
Prudent succession & estate planning Efficient tax planning Smooth distribution & transfer of assets to identified beneficiaries Dependable Trustees / Escrow agents / Managers to handle and preserve family fortune Uninterrupted management of assets Trust management & wills Confidentiality
About Vistra ITCL India:Vistra ITCL is part of Vistra. Vistra is globally the third largest fiduciary service provider present in 46 jurisdictions with 78 offices.Vistra has over 4,300 professionals working across 46 jurisdictions throughout the Americas, Asia Pacific, Europe and the MiddleEast. Vistra ITCL (India) Limited is the largest independent non-bank trustee in India with over two decades of presence in theIndian trusteeship space. Vistra ITCL is regulated by Indian Capital Markets Regulator Securities and Exchange Board of India (SEBI)as a Bond / Debenture Trustee. Vistra ITCL currently has significant market share in each market segment and its clients includeBanks, Financial Institutions, Asset managers, Corporates, Governments, Insurance companies and High-Net Worth Individuals.

68
Tax Advisory Services

69
Tax Advisory Services
About Ernst & Young:EY is one of the most reputed and largest consultancy firms in the world. Through their four service lines - Assurance, Consulting,Strategy and Transactions, and Tax, they work with more than 200,000 clients in 150 countries, from start-ups to multinationalsacross all sectors, helping them meet their most pressing challenges. Their clients include 84% of the Fortune Global 500 and 73%of the Forbes Global 2000. They have a long legacy of working with owners, CEOs and entrepreneurs leading private and familyenterprises.
About EY India:In India, they have a team of over 50,000 people (20,000 in EY India and 30,000 in Global Delivery Services) and offices in 11 cities in India: Ahmedabad, Bangalore, Chandigarh, Chennai, Hyderabad, Jamshedpur, Kochi, Kolkata, Mumbai, NCR (New Delhi + Gurgaon + Noida) and Pune.
Their tax team in India have 4000+ professionals and 150+ Partners. They were ranked as #1 brand for Tax Services in India inbiennial Global Brand Survey 2019 & 2017 (Ipsos) 2015 (Kantar) 2013 (TNS), 2011 (TNS) and were recognized as a tier-one tax firm for the 14th consecutive year – Euromoney ITR, World Tax Top Tier Firm 2020 and World Transfer Pricing Top Tier Firm 2020
Distribution offering at HDFC Securities:EY India can help HSL clients who are looking for professional advisory services in relation to income-tax (including cases where the solution is through trust and estate planning), foreign exchange regulations or any other regulatory law.

70
Disclaimer
Investment in securities market are subject to market risks, read all the related documents carefully before investing.
This note has been prepared exclusively for the benefit and internal use of the recipient and does not carry any right of reproduction or disclosure. Neither this note nor anyof its contents maybe used for any other purpose without the prior written consent of HDFC Securities Ltd (HSL)
Information herein is believed to be reliable however HDFC Securities Ltd. does not warrant its completeness or accuracy. Although HDFC Securities Ltd. tries to ensure thatall information and materials in relation to the products, services, facilities, offerings or otherwise provided as part of its website or through any other source ofcommunication, is correct at the time of inclusion on the communication, it does not guarantee the accuracy of the information.
Use of this presentation /note is at the sole risk of the user / client. The data and information provided on the website or in any presentation / note is not professionaladvice and should not be relied upon as such. HDFC Securities Ltd. may at any time edit, alter and or remove any information in whole or in part that may be available andthat it shall not be held responsible for all or any actions that may subsequently result into any loss, damage and or liability. Nothing contained herein is to be construed asa recommendation to use any product or process, and HDFC Securities Ltd. makes no representation or warranty, express or implied that, the use thereof will not infringeany patent, or otherwise
HDFC Securities Ltd. would have an exclusive discretion to decide the clients who would be entitled to its investing services. HDFC Securities Ltd. also reserves the right todecide on the criteria based on which clients would be chosen to participate in these services. HDFC Securities Ltd. is incorporated under the regulatory laws of India andhence adheres to the same laws for entering into or executing an agreement with the client
This note does not purport to contain all the information that the recipient may require. Recipients should not construe any of the contents herein as advice relating tobusiness, financial, legal, taxation, or investment matters and are advised to consult their own business, financial, legal, taxation and other advisors concerning thecompany.
This note does not constitute an offer for sale, or an invitation to subscribe for, or purchase equity shares or other assets or securities of the company and the informationcontained herein shall not form the basis of any contract. It is also not meant to be or to constitute any offer for any transaction.
As a distributor, HDFC Securities Ltd. does not assume any responsibility or liability arising from the sale of any product and the investor's contract for purchase/sale isdirectly with the product provider. HDFC Securities Ltd. may earn a distribution fee from the product provider on completion of sale of such products. To reiterate, HDFCSecurities Ltd. only acts as a Distributor. There is no element of advisory involved.