monthly report june 2016 [email protected] sandhya...
TRANSCRIPT


1
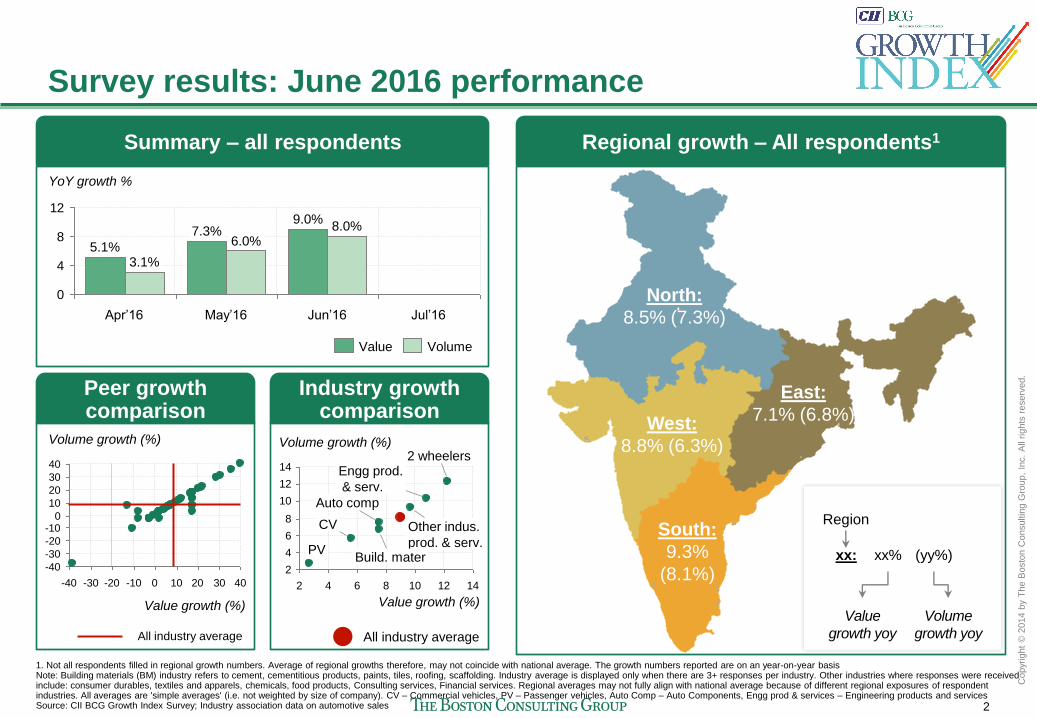
Summary growth trends: June 2016
Overall, June registered a stronger growth of ~9.0% for the Indian industry
compared to May and April that showed growth of 7.3% and 5.1% respectively
Growth was high across all the regions with South witnessing the highest growth
of ~9.3% ; West and North saw healthy growth of ~8.8% and ~8.5% respectively,
while East grew at ~7.7%
Inflation seemed to be in the range of ~1% year-on-year – similar to May and April;
West saw above average price increments as indicated by an inflation of ~2.5%
Engineering products and services, 2-wheelers emerged as winners in June
posting a growth of over 10%; Building materials and Auto components registered
modest growth of ~7.5%, while Commercial vehicles (5.6%) and Passenger
vehicles (2.8%) witnessed relatively weak growth
1. Not all respondents filled in regional growth numbers. Average of regional growths therefore, may not coincide with national average. The growth numbers reported are on an year-on-year basis. Inflation reported above is the value over volume growth based on the survey results. Growth numbers reported are on year-on-year basis Source: CII BCG Growth Index Survey; Industry association data on automotive sales
2
Copyr
ight
© 2
014 b
y T
he B
osto
n C
onsultin
g G
roup,
Inc.
All
rights
reserv
ed.
Value
growth yoy
Volume
growth yoy
Region
xx: xx% (yy%)
Survey results: June 2016 performance
1. Not all respondents filled in regional growth numbers. Average of regional growths therefore, may not coincide with national average. The growth numbers reported are on an year-on-year basis Note: Building materials (BM) industry refers to cement, cementitious products, paints, tiles, roofing, scaffolding. Industry average is displayed only when there are 3+ responses per industry. Other industries where responses were received include: consumer durables, textiles and apparels, chemicals, food products, Consulting services, Financial services. Regional averages may not fully align with national average because of different regional exposures of respondent industries. All averages are 'simple averages' (i.e. not weighted by size of company). CV – Commercial vehicles, PV – Passenger vehicles, Auto Comp – Auto Components, Engg prod & services – Engineering products and services Source: CII BCG Growth Index Survey; Industry association data on automotive sales
Volume Value
0
4
8
12
YoY growth %
Jul’16 Jun’16
8.0% 9.0%
May’16
6.0% 7.3%
Apr’16
3.1% 5.1%
Summary – all respondents Regional growth – All respondents1
Industry growth comparison
Value growth (%)
Peer growth comparison
20 0 -10 -20 -30 -40
40
30
20
10
0 -10
-20
-30
-40
40 30 10
Volume growth (%)
Value growth (%)
2
4
6
8
10
12
14
2 4 6 8 10 12 14
Other indus.
prod. & serv.
2 wheelers
PV
CV
Auto comp
Engg prod.
& serv.
Build. mater
Volume growth (%)
West:
8.8% (6.3%)
South:
9.3%
(8.1%)
North:
8.5% (7.3%)
East:
7.1% (6.8%)
All industry average All industry average
3
Copyr
ight
© 2
014 b
y T
he B
osto
n C
onsultin
g G
roup,
Inc.
All
rights
reserv
ed.
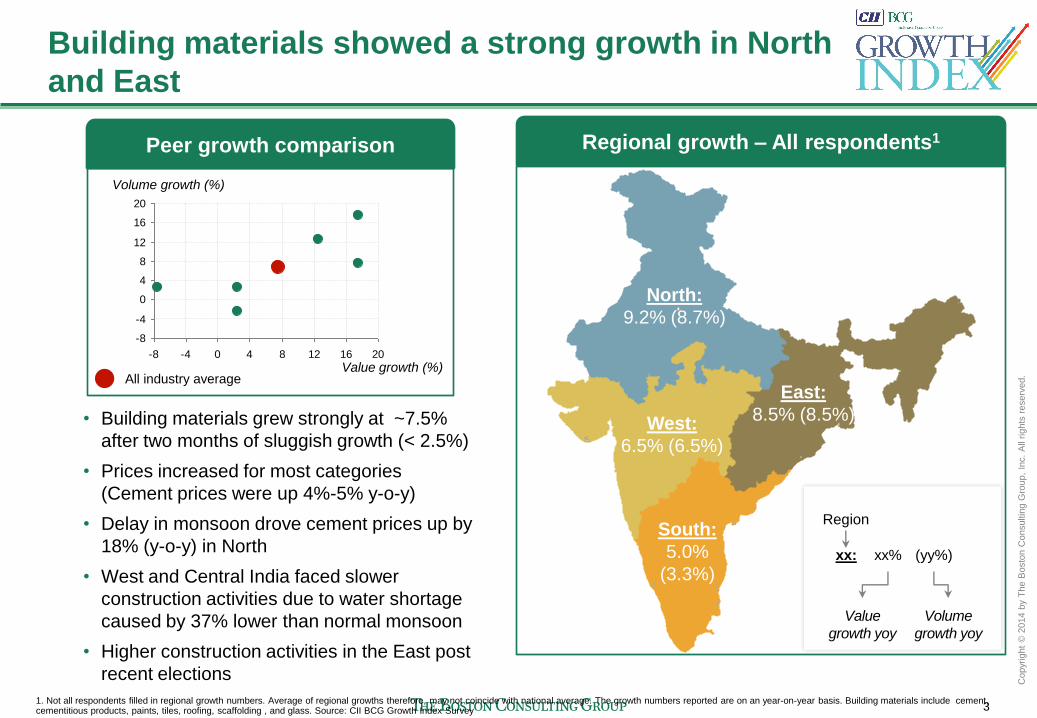
Building materials showed a strong growth in North
and East
Value
growth yoy
Volume
growth yoy
xx: xx% (yy%)
Regional growth – All respondents1
West:
6.5% (6.5%)
South:
5.0%
(3.3%)
North:
9.2% (8.7%)
East:
8.5% (8.5%)
Peer growth comparison
Value growth (%) All industry average
-8
-4
0
4
8
12
16
20
-8 -4 0 4 8 12 16 20
Volume growth (%)
1. Not all respondents filled in regional growth numbers. Average of regional growths therefore, may not coincide with national average. The growth numbers reported are on an year-on-year basis. Building materials include cement, cementitious products, paints, tiles, roofing, scaffolding , and glass. Source: CII BCG Growth Index Survey
• Building materials grew strongly at ~7.5%
after two months of sluggish growth (< 2.5%)
• Prices increased for most categories
(Cement prices were up 4%-5% y-o-y)
• Delay in monsoon drove cement prices up by
18% (y-o-y) in North
• West and Central India faced slower
construction activities due to water shortage
caused by 37% lower than normal monsoon
• Higher construction activities in the East post
recent elections
Region

4
Copyr
ight
© 2
014 b
y T
he B
osto
n C
onsultin
g G
roup,
Inc.
All
rights
reserv
ed.
Automotive industry continued to grow on the back
of a good monsoon and recent 7th pay commission
Passenger vehicle (PV)
• PV showed weak growth of
2.6% (y-o-y)
• Maruti Suzuki witnessed a y-o-y
de-growth of ~10%
• Renault and Ford emerged as
winners posting growth >100%
• Higher growth expected in July
on back of monsoon discounts
and recent pay revisions
Commercial vehicle (CV)
• CV showed modest growth of
5.7% (y-o-y)
• Growth drivers - Govt's push
towards clearing long term road
projects and increasing demand
for heavy truck transportation
• Short term concerns -
Increasing diesel prices and
truck rentals
2-wheelers
Value growth (%) All industry average
-40
-20
0
20
40
60
80
100
120
120 100 80 60 40 20 0 -20 -40
Volume growth (%)
Value growth (%) All industry average
0
4
8
12
16
20
24
0 4 8 12 16 20 24
Volume growth (%)
Value growth (%) All industry average
0
5
10
15
20
25
30
35
40
36 32 28 24 20 16 12 8 4 0
Volume growth (%)
• 2-wheelers witnessed strong
growth of ~12% (y-o-y)
• Yamaha and Royal Enfield
posted growth upwards of 30%
• Govt's pay revision and good
monsoon expected to drive
high growth
1. Not all respondents filled in regional growth numbers. Average of regional growths therefore, may not coincide with national average. The growth numbers reported are on an year-on-year basis Source: CII BCG Growth Index Survey, Industry association data on automotive sales

5
Copyr
ight
© 2
014 b
y T
he B
osto
n C
onsultin
g G
roup,
Inc.
All
rights
reserv
ed.
Engineering products witnessed a high growth
across all the regions
Value
growth yoy
Volume
growth yoy
xx: xx% (yy%)
Regional growth – All respondents1
West:
12.5% (11.3%)
South:
12.5%
(11.3%)
North:
12.5% (11.3%)
East:
11.3% (10%)
Peer growth comparison
Value growth (%) All industry average
-8
-4
0
4
8
12
16
20
-4 0 4 8 12 16 20
Volume growth (%)
1. Not all respondents filled in regional growth numbers. Average of regional growths therefore, may not coincide with national average. The growth numbers reported are on an year-on-year basis. MHE – Material handling equipments Source: CII BCG Growth Index Survey
• Engineering products and services grew
~12% in June 2016 (y-o-y)
• Heavy engineering and electrical segment
get boost from capacity expansion in power
sector and infrastructure – industrial
corridors, airports and road construction
• Steel production to remain low until August -
govt. to review minimum import price
• 100% FDI (automatic route) expected to
intensify competition
Region

6
Copyr
ight
© 2
014 b
y T
he B
osto
n C
onsultin
g G
roup,
Inc.
All
rights
reserv
ed.
MHE riding high on e-commerce, retail boom; South
witnesses highest growth (2/2)
Value
growth yoy
Volume
growth yoy
xx: xx% (yy%)
Regional growth – All respondents1
West:
10.5% (6.5%)
South:
12.5%
(13.5%)
North:
1.0% (5.0%)
East:
4.5% (6.5%)
Peer growth comparison
Value growth (%) All industry average
-8
-4
0
4
8
12
16
20
-8 -4 0 4 8 12 16 20
Volume growth (%)
1. Not all respondents filled in regional growth numbers. Average of regional growths therefore, may not coincide with national average. The growth numbers reported are on an year-on-year basis. MHE – Material handling equipments Source: CII BCG Growth Index Survey
• More than half of the surveyed companies
reported growth of over 15% (y-o-y)
• Rising e-commerce and retail provide major
boost to MHE sector in South and West
• Growth in South driven by government's
push to expand ports, harbours and better
warehousing
• More than average monsoon to drive MHE
demand in agri-warehousing, cold storage,
and automotive sector
Region
7
Commercial vehicle sales
Overall economic indicators: June 2016 review
*Not comparable as negative percentage in prior month
1. Average of GDP estimates for FY15-16 for China and India made by leading international financial institutions in Apr & Feb 2. As of Jun & May 3. As of May and Apr 4. As of end May and Apr 5. For Jun and May, Includes
only equity flows. 6. Total outstanding values as of May and Apr 7. As in Jun and May
Note: PV and CV refer to passenger and commercial vehicles resp. Source: RBI, Thomson One, Ministry of Finance monthly Report, Capitaline, EIS, BCG analysis, Press Search.
Latest
month
Previous
month
India GDP growth est. (%)1
China GDP growth est. (%)1
Inflation – WPI (%)2
BSE Sensex2
Growth Indices
1.62
7.9
6.7
0.79
25,668
7.3
6.8
(y-o-y)
(y-o-y)
(y-o-y)
IIP (%)3
Steel production (Mn Tn)2
CV Auto vol growth2 (%)
Cement production (Mn Tn)3
Energy req growth3 (%)
PV Auto vol growth2 (%)
(y-o-y)
1.2
24.9
6.6
5.7
8.6
2.7
(3.1)
24.7
14.5
16.9
7.7
6.4
Growth Indices
Latest
month
Previous
month
Exports growth* (%)3
Oil imports growth* (%)3
Non-oil imports growth* (%)3
Trade deficit (US$ Bn)3
(7.1)
(6.3)
(0.8)
(30.4)
(22.8)
(4.8)
(6.7)
(24.0)
NRI deposits (US$ Bn)6
Forex reserves (US$ Bn)5
Currency competitiveness7
FII flows (US$ Mn)5
FDI flows (US$ Mn)4
127
67.2
555
361
2294
127
66.9
380
361
3528
Economy statistics
Select industry metrics
Current account
Capital account
(y-o-y)
(y-o-y)
(y-o-y)
Passenger vehicle sales
5462
57595253
0
20
40
60
80
'000
52
Ju
n-1
5
Ja
n-1
6
62
Dec-1
5
Nov-1
5
59
Oct-
15
Se
p-1
5
63
Au
g-1
5
Ju
l-1
5
56
Ju
n-1
6
+5%
-2%
Ma
y-1
6
57
Ap
r-1
6
Ma
r-1
6
80
Fe
b-1
6
242234231269
222218
200
300
100
0
+3%
-4%
Ma
y-1
6
232
Ap
r-1
6
'000
Ma
r-1
6
257
Fe
b-1
6
Ja
n-1
6
232
Dec-1
5
Nov-1
5
252
Oct-
15
Se
p-1
5
232 223
Au
g-1
5
Ju
l-1
5
222
Ju
n-1
5
Ju
n-1
6
26,999

8
Good monsoon to provide further boost to Indian
businesses
Monsoon 2016 forecast
• Overall, 6-7% higher than average monsoon expected (June – Sept)
• Last year, 15% lower than average monsoon was received ~20% higher than last year
• Good monsoon to positively affect Automotive, Building materials, Warehousing, MHE, consumer durables,
and FMCG sectors
June statistics
• Arrived a week late on June 7
• The cumulative monsoon in June (until June 21) was 21% less than normal
– East and North-east: 29% below normal
– Central India: 37% below normal
– North India: 8% below normal
– Southern peninsula: 13% above normal
Forecast for July
• Higher than normal monsoon expected in July across India; 35% more than normal precipitation in the first
week of July
• Central and North (MP, UT, HP, Delhi, East Rajasthan) India to receive higher than normal precipitation in the
2nd and 3rd week – flood conditions and disruption due to river swelling Source: Indian Meteorological Department. MHE – Material Handling Equipments

Thank you
bcg.com | bcgperspectives.com