monthly station normals of temperature, precipitation… · climatography of the united states no...
TRANSCRIPT
CLIMATOGRAPHY OF THE UNITED STATES NO 81
Monthly Station Normalsof Temperature Precipitationand Heating and CoolingDegree Days1971 -2000
CONNECTICUT
NATIONAL OCEANIC AND ATMOSPHERIC ADMINISTRATIONNATIONAL ENVIRONMENTAL SATELLITE DATA AND INFORMATION SERVICENATIONAL CLIMATIC DATA CENTERASHEVILLE NC
X United States ^Stev CLIMATOGRAPHY OF THE UNITED STATES NO 81 Wj Climate Normals w d pound Monthly Normals of Temperature Precipitation and Heating and Cooling Degree Days
laquo T 19Z1-2000
1971-2000
^ ^ ^ ^ CONNECTICUT Page 2 J F H A H J J A S O H D
(This Page Intentionally Left Blank)
United States j CLIMATOGRAPHY OF THE UNITED STATES NO 81 Wj Climate Normals Monthly Normals of Temperature Precipitation and Heating and Cooling Degree Days
1971-2000
CONNECTICUT Page 3
NOTES
Product Description This Climatography includes 1971-2000 normals of monthly and annual maximum minimum and mean temperature (degrees F) monthly and annual total precipitation (inches) and heating and cooling degree days (base 65 degrees F) Normals stations include both National Weather Service Cooperative Network and Principal Observation (First-Order) locations in the 50 states Puerto Rico the Virgin Islands and Pacific Islands
Abbreviations No = Station Number in State Map Latitude = Latitude in degrees minutes and hemisphere (N=North S=South) COOP ID = Cooperative Network ID (12=State ID 36=Station Index) Longitude = Longitude in degrees minutes and hemisphere (W=West E=East) WBAN ID = Weather Bureau Army Navy ID if assigned Elev = Elevation in feet above mean sea level Elements = Input Elements (X=Maximum Temperature Flag 1 = if a published Local Climatological Data station
N=Minimum Temperature P=Precipitation) Flag 2 = + if WMO Fully Qualified (see Note below) Call = 3-Letter Station Call Sign if assigned MAX = Normal Maximum Temperature (degrees Fahrenheit) HIGHEST MEANYEAR = Maximum Mean Monthly ValueYear 1971-2000 MEAN = Average of MAX and MIN (degrees Fahrenheit) MEDIAN = Median Mean Monthly ValueYear 1971-2000 MIN = Normal Minimum Temperature (degrees Fahrenheit) LOWEST MEANYEAR = Minimum Mean Monthly ValueYear 1971-2000 HDD = Total Heating Degree Days (base 65 degrees Fahrenheit) MAX OBS TIME ADJUSTMENT = Add to MAX to Get Midnight Obs Schedule CDD = Total Cooling Degree Days (base 65 degrees Fahrenheit) MIN OBS TIME ADJUSTMENT = Add to MIN to Get Midnight Obs Schedule
Note In 1989 the World Meteorological Organization (WMO) prescribed standards of data completeness for the 1961-1990 WMO Standard Normals For full qualification no more than three consecutive year-month values can be missing for a given month or no more than five overall values can be missing for a given month (out of 30 values) Stations meeting these standards are indicated with a + sign in Flag 2 Otherwise stations are included in the normals if they have at least 10 year-month values for each month and have been active since January 1999 or were a previous normals station
Map Legend Numbers correspond to No in Station Inventory Shaded Circles indicate Temperature and Precipitation Stations Triangles (Point Up) indicate Precipitation-Only Stations Triangles (Point Down) indicate Temperature-Only Stations and Hexagons indicate stations with Flag 1 =
Computational Procedures A climate normal is defined by convention as the arithmetic mean of a climatological element computed over three consecutive decades
(WMO1989) Ideally the data record for such a 30-year period should be free of any inconsistencies in observational practices (eg changes in station location instrumentation time of observation efc) and be serially complete (ie no missing values) When present inconsistencies can lead to a non-climatic bias in one period of a stations record relative to another yielding an inhomogeneous data record Adjustments and estimations can make a climate record homogeneous and serially complete and allow a climate normal to be calculated simply as the average of the 30 monthly values
The methodology employed to generate the 1971-2000 normals is not the same as in previous normals as it addresses inhomogeneity and missing data value problems using several steps The technique developed by Karl ef a (1986) is used to adjust monthly maximum and minimum temperature observations of conterminous US stations to a consistent midnight-to-midnight schedule All monthly temperature averages and precipitation totals are cross-checked against archived daily observations to ensure internal consistency Each monthly observation is evaluated using a modified quality control procedure (Peterson et a1998) where station observation departures are computed compared with neighboring stations and then flagged and estimated where large differences with neighboring values exist Missing or discarded temperature and precipitation observations are replaced using a weighting function derived from the observed relationship between a candidates monthly observations and those of up to 20 neighboring stations whose observations are most strongly correlated with the candidate site For temperature estimates neighboring stations were selected from the US Historical Climatology Network (USHCN Karl ef al 1990) For precipitation estimates all available stations were potential neighbors maximizing station density for estimating the more spatially variable precipitation values
Peterson and Easteriing (1994) and Easteriing and Peterson (1995) outline the method for adjusting temperature inhomogeneities This technique involves comparing the record of the candidate station with a reference series generated from neighboring data The reference series is reconstructed using a weighted average of first difference observations (the difference from one year to the next) for neighboring stations with the highest correlation with the candidate The underlying assumption behind this methodology is that temperatures over a region have similar tendencies in variation If this assumption is violated the potential discontinuity is evaluated for statistical significance Where significant discontinuities are detected the difference in average annual temperatures before and after the inhomogeneity is applied to adjust the mean of the earlier block with the mean of the latter block of data Such an evaluation requires a minimum of five years between discontinuities Consequently if multiple changes occur within five years or if a change occurs very near the end of the normals period (eg after 1995) the discontinuity may not be detectable using this methodology
The monthly normals for maximum and minimum temperature and precipitation are computed simply by averaging the appropriate 30 values from the 1971-2000 record The monthly average temperature normals are computed by averaging the corresponding monthly maximum and minimum normals The annual temperature normals are calculated by taking the average of the 12 monthly normals The annual precipitation and degree day normals are the sum of the 12 monthly normals Trace precipitation totals are shown as zero Precipitation totals include rain and the liquid equivalent of frozen and freezing precipitation (eg snow sleet freezing rain and hail) For many NWS locations indicated with an next to HDD and CDD in the degree day table degree day normals are computed directly from daily values for the 1971-2000 period For all other stations estimated degree day totals are based on a modification of the rational conversion formula developed by Thorn (1966) using daily spline-fit means and standard deviations of average temperature as inputs
References Easteriing DR and TC Peterson 1995 A new method for detecting and adjusting for undocumented discontinuities in dimatolooical time series Intl J Clim 15369-377 Karl TR CN Williams Jr PJ Young and WM Wendland1986 A model to estimate the time of observation bias associated with monthly mean maximum minimum and mean temperatures for the United States J dim Appl Mef 25145-160 Peterson TC and DR Easteriing 1994 Creation of homogeneous composite climatological reference series Intl J Clim 14671-679 PetersonTC R Vose R Schmoyer and V Razuvaev 1998 Global Historical Climatology Network fGHCN) quality control of monthly temperature data Intl J Clim 181169-1179 Thorn HCS 1966 Normal degree days above any base by the universal truncation coefficient Month Wea Rev 94461-465 World Meteorological Organization 1989 Calculation of Monthly and Annual 30-Year Standard Normals WCDP-No 10 WMO-TDNo 341 Geneva World Meteorological Organization
Release Date Revised 022002 National Climatic Data CenterNESDISNOAA Asheville North Carolina
06 - CONNECTICUT
42degN-
10 MA
41degN-
73degW
laquoJgt
10 miles
72degW
S j United States CLIMATOGRAPHY OF THE UNITED STATES NO 81 Wj Climate Normals Monthly Normals of Temperature Precipitation and Heating and Cooling Degree Days
1971-2000 1971-2000
CONNECTICUT Page 5 1 r H A M J 1 A 3 O H D
STATION INVENTORY No COOP ID WBAN ID Elements Station Name Call Latitude Longitude Elev Flag 1 Flag 2
1- 060128 P ANSONIA 1 NE 4121N 73 04 W 140 21 060227 XNP B A K E R S ^ I L L E bullbullbull bull bull bull 4 1 gt 5 1 N 73 01 W 597 3 060299 bull P 4155N 7257 W 660 4 060806 94702 XNP V
BRIDGEPORT SJkdRSKY AP B D R 41bullbulligiji 73 08 W 5 5 060961 XNP BXJLLSbull BPjM^^iim bull bull - - 41 J9 N 7329 W 260 6 060973 XNP BURLINGTON 41 48 N 72 56 W 510 7 061488 P COCKAPONSET RANGER STA 41 28 N 72 31 W 160 8 061689 XNP COVENTRY 41 48 N 72 21 W 480 9 061762 XNP DANBURY 41 24 N 73 25-W 405
10 062658 XNP FALLS VILLAGE 41 57 N 73 22 W 550 11 O63207 XNP -72- 02 w 40 12 14752 XNP 20 13 14740 160 i4 250 15 369 16 065077 XNP MOUNT CARMEL 41 24 N 72 54 W 180 17 065445 XNP NORFOLK 2 SW 41 58 N 73 13 W 1340 18 065893 XNP NORWALK GAS PLANT 41 07 N 73 25 W 37 19 065910 XNP NORWICH PUB UTIL PLANT 41 32 N 72 04 W 20 20 066655 P PUTNAM LAKE 41 05 N 73 38 W 300
^21 066966 VE ROClSf RIVERiDAM r StiiS^ N J3r2Sw 220
22 067002 -p ROUND- P0m^^-ripoundV 4l18N 7-3 32 W 800 23 067157 v-P SAUGATOCK RE$ERypIR 73 V2iW 300
21 Xfip 25 0iS7432 Pbull -Sii3^N~72 49 W 26 067970 XNP STAMFORD 5 N 41 07 N 73 33 W 190 27 068065 P STEVENSON DAM 41 23 N 73 10 W 60 28 068138 XNP STORRS 41 48 N 72 15 W 650 29 068436 P TORRINGTON 41 48 N 73 07 W 580 30 069162 P WEST HARTFORD 41 45 N 72 47 W 275 31 069388 XNP WEST THOMPSON LAKE 41 57 N 71 54 W 360 32 069568 XNP WIGWAM RESERVOIR 41 40 N 73 08 W 570
United States j^Sfei CLIMATOGRAPHY OF THE UNITED STATES NO 81 W Monthly Normals of Temperature Precipitation and Heating and Cooling Degree Days
1971 2000 raquo r 1971-2000 laquo0 T
laquo r CONNECTICUT Page 6 1 F M A V J J A O H O
TEMPERATURE NORMALS (Degrees Fahrenheit) No Station Name Element JAN FEB MAR APR MAY JUN JUL AUG SEP OCT NOV DEC ANNUAL
002 BAKERSVILLE MAX 3 3 i 2 361 462 581 698shy 766 807 788 714 597 486 372 580 MEAN 23 6 263 352 456 567 644 695 673 598 485 392 288 471 MIN 13 9 165 241 bull33 LI 435 52 I bull582v 55^8 481 373 297 203 361
004 BRIDGEPORT SIKORSKY AP MAX 369 388 469 570 674 764 819 807 736 631 526 421 598 MEAN 299 319 395 489 590 680 740 731 657 547 451 351 521 MIN 229 249 320 407 506 596 660 654 SI 1 463 375 280 443
005 BULLSBRIDGE DAM M A X bullbullbull 34^8 37v 8 47 5 -S93 710 788 gt836 815 73 6 62 6 50 4 394 600 MEAN 246 26^9 -362 473 584 668 7 1 6 70 0 618 50 1 398 299 48-6 MIN 143 i59~shy 24i9 35bull2 45 7 547 5 9 5 58-4 4 99 376 291 20 4 371
006 BURLINGTON MAX 352 377 46 6 581 696 778 827 80 6 729 621 511 3 99 595 MEAN 247 269 358 467 577 662 712 69 4 616 503 410 305 485 MIN 141 161 249 353 457 546 597 5 8 1 502 384 309 210 374
008 COVENTRY MAX 352 378 468 575 687 763 812 80 0 724 621 509 400 591 MEAN 240 264 356 454 560 643 693 67 8 594 485 400 299 472 MIN 128 149 243 333 433 522 573 555 463 348 291 197 353
009 DANBURY MAX 354 386 48 1 596 709 793 839 814 730 620 507 396 602 MEAN 265 290 378 480 588 675 725 703 621 509 414 312 497 MIN 176 193 274 364 467 557 610 592 512 397 320 228 391
010 FALLS VILLAGE MAX 350 383 477 598 719 790 836 815 735 624 501 391 602 MEAN 242 269 359 467 580 659 706 690 612 497 396 292 481 MIN 133 155 241 336 441 528 57 6 564 488 369 290 193 360
O i l GROTON MAX 377 394 47 1 563 663 749 807 796 727 625 527 427 594 MEAN 289 306 382 472 570 658 718 709 636 530 440 342 504 MIN 200 218 293 381 477 566 629 622 545 434 352 257 415
012 HARTFORDBRAINARD FIELD MAX 355 384 47 l 585 701 786 838 819 741 628 515 403 602 MEAN 259 288 372 481 590 680 736 716 628 513 419 313 500 MIN 163 192 273 376 478 574 634 612 514 398 323 222 397
013 HARTFORD BRADLEY INTL A MAX 341 377 477 599 717 800 849 825 743 631 509 390 605 MEAN 257 288 380 489 599 685 737 716 632 519 418 308 502 MIN 172 199 283 379 481 570 624 607 521 406 326 226 400
014 MANSFIELD HOLLOW LAKE MAX 350 374 466 575 692 770 817 802 727 624 510 397 592 MEAN 242 265 358 458 565 649 701 685 601 490 401 297 476 MIN 134 156 250 341 438 528 584 567 475 355 292 197 360
015 MIDDLETOWN 4 W (MERIDEN MAX 362 389 475 589 706 794 842 812 727 615 510 406 602 MEAN 283 305 386 488 596 684 734 712 632 522 431 332 509 MIN 203 221 297 387 485 573 625 612 536 429 351 258 415
016 MOUNT CARMEL MAX 349 371 464 573 680 773 828 805 727 620 503 394 591 MEAN 259 278 370 471 575 668 725 705 625 514 410 311 493 MIN 169 184 275 368 470 563 621 605 523 407 316 227 394
017 NORFOLK 2 SW MAX 291 313 409 531 655 735 781 763 683 569 451 339 543 MEAN 205 224 314 430 549 633 680 664 585 472 372 263 449 MIN 119 134 219 328 442 530 579 564 486 375 293 186 355
018 NORWALK GAS PLANT MAX 368 393 483 598 700 792 842 824 749 636 524 416 610 MEAN 278 300 bull 3 8 6 488 583 679 734 717 638 520 428 329 507 MIN 188 206 288 377 465 565 625 610 527 404 332 24 1 402
019 NORWICH PUB UTIL PLANT MAX 378 400 486 589 705 785 838 820 746 639 529 422 611 MEAN 276 295 380 481 591 674 73 2 714 637 520 423 328 504 MIN 173 190 274 373 476 563 625 608 527 400 316 233 397
Q24 SHEPAUG DAM MAX 339 364 454 569 684 755 798 782 705 607 497 385 578 MEAN 229 250 337 444 558 637 686 671 595 490 394 285 465 MIN 119 136 220 319 432 519 574 559 484 373 290 184 351
026 STAMFORD 5 N MAX 382 413 504 621 728 807 854 833 755 647 533 425 625 MEAN 287 312 396 499 601 685 735 720 644 532 434 337 515 MIN 192 210 287 376 474 562 616 606 532 416 335 248 405
028 STORRS MAX 337 360 448 558 673 750 796 779 707 605 494 385 574 MEAN 255 277 363 465 571 652 703 686 612 508 414 309 485 MIN 172 193 278 371 468 554 609 593 517 411 333 232 394
031 WEST THOMPSON LAKE MAX 354 377 465 SI 1 694 773 824 804 726 620 511 398 594 MEAN 240 262 353 455 564 650 704 688 605 490 404 296 476 MIN 126 146 240 332 434 527 583 571 483 360 296 194 358
032 WIGWAM RESERVOIR MAX 341 368 462 576 700 778 833 808 732 617 503 385 592 MEAN 234 253 349 452 567 653 705 684 607 491 392 289 473 MIN 126 137 235 327 434 527 576 559 481 364 281 192 353
5pound United States CLIMATOGRAPHY OF THE UNITED STATES NO 81 Wj Climate Hdrmals Monthly Normals of Temperature Precipitation and Heating and Cooling Degree Days 1971-2000
1971-2000
fiPiPf CONNECTICUT Page 7 j f H A M J I A 3 O H D
PRECIPITATION NORMALS (Total in Inches) No Station Name JAN FEB MAR APR MAY JUN JUL AUG SEP OCT NOV DEC ANNUAL
001 ANSONIA 1 NE 445 323 424 438 438 3 84 3 97 416 4 0 7 444 438 4 01 4955 002 BAKERSVILLE 439 325 457 451 476 4gtJ7- 504 bull4 92 500 480 4 6 9 449 5459shy003 BARKHAMSTED 412 316 432 4 21 454 4 -26 426 4 3 6 4 4 9 439 4 2 2 403 5036 004 BRIDGEPORT SIKORSKY AP 373 292 415 399 03 357 377 3 75 358 354 3 65 347 4415 005 BULLS BRIDGE DAM 363 290 390 414 30 396 4 8 9 431 4 2 2 391 4 06 365 47 87 006 BURLINGTON 430 330 461 439 65 420 431 467 4 8 0 447 4 5 8 399 5227 007 COCKAPONSET RANGER STA 504 361 475 471 416 413 3 82 469 4 1 5 472 496 458 5332 008 COVENTRY 4 3 8 300 432 454 396 425 4 0 8 407 4 5 4 456 464 402 5036 009 DANBURY 4 2 2 308 445 427 469 426 461 449 4 99 418 445 408 5177 010 FALLS VILLAGE 354 266 362 377 426 417 441 437 398 381 374 349 4582 011 GROTON 012 HARTFORD BRAINARD FIELD 013 HaRTFORD BRADLEY INTL A 014vMANSFIEID HOLLOW1 lAKE 015 MIDpiiET0flN4-W (MERIDEN 016 MOUNT CARMEL 017 NORFOLK 2 SW 018 NORWALK GAS PLANT 019 NORWICH- PUB UTIL PLANT 020 PUTNAM LAKE 021 ROCKY RIVER DAM 022 ROUND POND 023 SAUGATUCK RESERVOIR 024 SHEPAUG DAM 025 SHUTTLE MEADOW RESVR 026 STAMFORD 5 N 027 STEVENSON DAM 02 8 STORRS 02 9 TORRINGTON 03 0 WEST HARTFORD 031 WEST THOMPSON LAKE 032 WIGWAM RESERVOIR
4 3 9 3 66 384 470 4 -54 459 447 420 474 435 368 417 437 394 441 450 505 461 442 466 468 403
354 265 296
332 324 353 303 382 311 287 321 321 310 339 332 339 366 325 344 332 317
446 3 61 3 88
465 457 433 493 439 3 90 464 461 442 432 470 528 445 462 464 444
457
423 382 3B6
bulli39 444 463 453 437 458 448 404 451 454 420 452 451 496 436 415 497 440 429
379 399
74-39 bull416 43 0 470 481 436 413 4 63 447 497 492 451 432 497 474 400 431 497 394
450
367 383
44$ 444 449 394 368 434 411 432 413 415 405 433 456 393 419 478
4 00
420
331 393 367 bull4gtS7-
420 4 2 8 490 383 367 406 445 445 408 482 453 409 405 441 394 470 455 420
446 383
398 4 21 446 450 474 389 485 425 473 478 443 466 430 426 408 425 481 516 447 444
4 06 3 83 bull4trade 1 3 425 458 466 447 454 429 490 444 483 444 460 4 44 482 433 442 462 483 400 463
398 391 3 94 444 481 454 440 389 453 411 421 443 423 412 457 442
4 54 464 437 520 443 444
451 379
474 4 54 447 465 404 486 4 35 414 472 461 419 4 54 458 500 458 437 523 470
432 3 44 36(5
403 431 396 470 407 362 423 413 386 421 429 473 433 416 435 432
439 417
4872 4429 4616 bull51^55 5235 5273 5387 4838 5278 5104 4866 5326 5170 5057 5160 5279 5471 5164 5121 5693 5125 5103
fX United States Jfifei CLIMATOGRAPHY OF THE UNITED STATES 1MO 81 W Monthly Normals of Temperature Precipitation and Heating and Cooling Degree Days
1971-2000
1971-2000
CONNECTICUT Page 8
DEGREE DAYS (Total) No Station Name Element JAN FEB MAR APR MAY JUN JUL AUG 3EP OCT NOV DEC ANNUAL
002 BAKERSVILLE HDD 1284 1084 925 5 8 3 268 77 10 28 168 512 775 112 5 6839 bull bull 8 bull CDD 0 0 0 0 bullbullbullbull 5 8 147 100 10 bull bull bull bull bull bull bull 0 bull -r-O 0 323
004 BRIDGEPORT SIKORSKY AP HDD 1089 943 803 489 207 32 2 4 68 320 5 9 1 918 5466 CDD 0 0 0 1 2 1 125 286 258 91 7 0 0 789
005 BULLS BRIDGE DAM H D D bullbull 1253 1069 892 533 221 bullbull 4 amp iv5-- i2 118 463 757 1089 6458 bull bull bull bull v bull bull bull bull bull bull bull bull CDD v i 0 0 0 0 bull l 5 v bull 9$ i208 166 20 bullbullbull 2 0 510
006 BURLINGTON HDD 1251 1067 907 549 240 57 8 17 130 458 720 1071 6475 CDD 0 0 0 0 12 92 200 152 26 1 0 0 483
008 COVENTRY HDD 1271 1083 913 589 286 bull bull i t Viioy 22 180 bull 513 751 1090 6 7 8 3 C D D bullbull o Cfr v 5 3V i42 106 10 bull bull - 0 bull--ib 317 bull bull bull amp- bull bull bull (
bull bull f bull bull bull bull bull bull bull bull bull bull - bull bull lt bull bull
009 DANBURY HDD 1194 1010 844 509 22 0 46 i i 9 119 439 7 i i 1047 6159 CDD 0 0 0 0 29 1 2 1 242 173 3 1 1 0 0 597
010 FALLS VILLAGE HDD 1267 1067 902 549 233 50 6 17 139 477 - 763 1109 6579 CDD 0 0 0 0 16 77 180 140 24 bull
i - 0 -bull v 0 438 011 GROTON HDD 1121 964 832 534 254 42 2 4 83 376 632 955 5799
CDD 0 0 0 0 6 64 213 186 40 2 0 0 5 1 1 012 HARTFORD BRAINARD FIELD HDD 1213 1014 862 509 210 32 3 103 428 698 1048 6121
CDD 0 bull o 0 22 gtVl22-1 266 2 0 6 36 bull bull 2 0 6 5 4 bullbullbullbullbull 0Jo013 HARTFORD BRADLEY INTL A HDD 1218 1024 844 486 195 38 -3 12 120 413 697 1054 6104
CDD 0 0 1 5 38 144 277 220 68 5 1 0 759 014 MANSFIELD HOLLOW LAKE HDD - 1265 1078 904 576 271- 68 7 162 497 7 4 7 1095 6688
bull Jlffv CDD o 0 6 0 bullbull A i bull
65 1 6 4 bull 124 16 0 bull Q bull V 0 3 6 015 MIDDLETOWN 4 W (MERIDEN HDD 1139 966 818 486 195 30 2 5 105 400 658 987 5791
CDD 0 0 0 0 26 1 3 1 262 197 50 3 0 0 669 016 MOUNtczuJMEL - SDD 1212 1043 870 539 2 4 5 47 4 5 108 425 bull bull 7 2 1 1052 V 6271
bull - - - bull - bull bull bull - bull bull bull - - bull - -
0CDD 0 0 0 0 12 100 234 177 33 gt bull-bull2 bull bull bull bull bull bull -] 5 5 8
- Q
017 NORFOLK 2 SW HDD 1381 1193 1042 6 6 1 319 93 17 35 202 552 835 1202 7532 CDD 0 0 0 0 5 4 0 110 77 5 0 0 0 237
018 NORWALK GAS PLANT HDD 1153 982 820 4 8 7 228 27 1 3 85 4 0 5 665 998 5854 CDD 0 0 0 0 19 113 259 2 1 1 4 8 2 0 0 652shy
019 NORWICH PUB UTIL PLANT HDD 1162 994 837 508 2 0 1 30 2 3 9 1 406 683 999 5916 CDD 0 0 0 0 15 1 0 1 256 203 5 1 1 0 0 627
024 SHEPAUG DAM HDD 1305 1120 9 7 1 617 289 84 24 33 174 496 769 1132 7014 CDD 0 0 0 0 5 4 5 135 97 7 0 0 0 289
02 6 STAMFORD 5 N HDD 1125 948 788 4 5 5 176 24 1 3 72 370 648 972 5582 CDD 0 0 0 0 24 128 2 6 5 218 53 4 0 0 692
02 8 STORRS HDD 1227 1047 890 5 5 7 254 60 5 15 136 442 709 1059 6401 CDD 0 0 0 0 7 66 167 127 22 1 0 0 390
0 3 1 WEST THOMPSON LAKE HDD 1272 1089 923 587 272 63 8 18 1 5 1 496 739 1099 6717 CDD 0 0 0 0 6 63 173 134 14 0 0 0 390
032 WIGWAM RESERVOIR HDD 1292 1113 936 596 2 6 5 62 8 15 150 494 774 1120 6825 CDD 0 0 0 0 8 69 177 120 20 1 0 0 3 9 5
fSpound
raquo r
w r
No 002
004
005
006
008
009
010
Oil
012
013
United States fifci CLIMATOGRAPHY OF THE UNITED STATES NO 81 w Monthly Normals of Temperature Precipitation and Heating and Cooling Degree Days
1971 2000
1971-2000
CONNECTICUT Page 9 F H A M J J A S O H D
NORMALS STATISTICS Station Name Element JAN FEB MAR APR MAY JUN JUL AUG SEP OCT NOV DEC ANNUAL bullBAKERSVILLE HIGHEST MEAN 3 2 5 3 4 2 4 0 7 499 6 1 1 69-9 7 3 2 708 6 3 1 V543 4 3 9 3 4 7 7 3 2
MEDIAN 2 4 9 2 5 8 3 5 3 459 5 7 2 647V 69 lt 3 671 5 9 7 484 391 2 9 7 4 6 9 LOWEST MEAN 1 5 7 bull163 2 8 6 407 5 3 3 6Pa 663 bull 64i3- 5 6 - 6 44v5 ii-5 1 5 6 bullbullbulli5-6
HIGHEST MEAN YEAR 1 9 9 0 1 9 9 8 2 0 0 0 1991 1 9 9 8 1999 1 9 9 4 1 9 9 8 1 9 9 8 S1975 1998 - 1 9 9 4 -bull bull L O W E S T M E A N 1 Y E A R v 1994 1979 1 9 8 4 1972 1 9 7 4 i985^ 0992 Cigsi I1978 i1974 pound06bull 1989 1 9 8 9
MIN OBS TIME ADJUSTMENT 00 0 - 0 bullbullgtoVo 00 0 0 Vrbib li0v0 -00 bullbullbullbull O O vfi--0 V 0 0 MAX OBS TIME ADJUSTMENT bullbullbullbull o p 00 0 v 0 oo PO bullbullbull O C O j i sQv0 bull oo OOi -ioO b0 00
BRIDGEPORT SI HIGHEST MEAN 367 3 7 9 4 3 2 519 645 7 1 8 785 7 6 1 680 596 4 9 6 4 0 S 7 8 5 MEDIAN 304 3 2 0 3 9 8 487 591 6 8 3 738 7 3 0 655 547 4 5 3 3 5 7 5 2 0
LOWEST MEAN 227 2 4 1 3 4 8 446 549 6 4 2 704 6 9 8 633 501 4 0 6 2 3 6 2 2 7 HIGHEST MEAN YEAR 1998 1 9 9 8 2 0 0 0 1974 1991 1 9 9 4 1994 1 9 8 8 1971 1990 1 9 7 5 1 9 8 4 1 9 9 4 LOWEST MEAN YEAR 1981 1 9 7 8 1 9 8 4 1975 1973 1 9 8 2 2000 1 9 8 2 1981 1972 1 9 7 2 1 9 8 9 1 9 8 1
MIN OBS TIME ADJUSTMENT 00 00 00 00 00 00 00 00 00 00 00 00 MAX OBS TIME ADJUSTMENT 00 00 00 00 00 00 00 00 00 00 00 00
BULLS BRIDGE HIGHEST MEAN 334 3 4 4 4 1 9 510 640 7 0 5 756 7 4 5 651 569 4 4 5 3 5 6 7 5 6 MEDIAN 258 2 6 2 3 6 2 481 588 6 7 2 714 6 9 8 615 501 3 9 5 3 1 3 4 8 4
LOWEST MEAN 155 1 6 9 3 1 0 425 544 6 2 3 681 6 5 7 589 458 3 4 0 1 7 3 1 5 5 HIGHEST MEAN YEAR 1998 1 9 9 8 2 0 0 0 1991 1991 1 9 7 3 1999 1 9 7 3 1971 1971 1 9 7 5 1 9 9 6 1 9 9 9 LOWEST MEAN YEAR 1981 1 9 7 9 1 9 8 4 1972 1997 1 9 7 7 2000 bull 1982 1978 1974 1 9 7 6 1 9 8 9 1 9 8 1
MIN OBS TIME ADJUSTMENT 12 18 10 00 00 _ - 0 5 -01 -03 06 05 11 07 MAX OBS TIME ADJUSTMENT 02 04 04 05 04 03 01 00 -01 00 01 00
BURLINGTON HIGHEST MEAN 3 4 0 3 5 1 4 1 1 503 630 7 0 8 753 726 659 563 4 5 9 3 8 2 7 5 3 MEDIAN 2 5 6 2 6 3 3 5 9 466 580 6 6 3 715 697 612 501 4 0 9 3 1 1 4 8 1
LOWEST MEAN 1 5 2 1 7 1 2 9 2 418 544 6 1 7 655 660 580 462 3 6 7 1 8 3 1 5 2 HIGHEST MEAN YEAR 1 9 9 0 1 9 9 8 2 0 0 0 1994 1991 1 9 9 9 1999 1988 1999 1990 1 9 9 9 1 9 9 8 1 9 9 9 LOWEST MEAN YEAR 1 9 8 2 1 9 7 9 1 9 8 4 1975 1974 1 9 8 5 2000 2000 1975 1987 1 9 7 6 1 9 8 9 1 9 8 2
MIN OBS TIME ADJUSTMENT 04 10 00 -06 -06 - 0 7 -05 -07 -04 -06 04 02 MAX OBS TIME ADJUSTMENT 02 04 04 04 03 02 01 00 -01 00 01 00
COVENTRY HIGHEST MEAN 3 3 1 3 2 9 4 1 1 489 598 6 7 8 726 707 635 539 4 4 7 3 6 0 7 2 6 MEDIAN 2 5 0 2 6 4 3 5 9 457 564 6 4 4 691 679 594 483 3 9 8 3 0 7 4 7 0
LOWEST MEAN 1 4 9 1 7 1 3 0 1 398 517 6 0 6 659 647 555 440 3 5 4 1 6 4 1 4 9 HIGHEST MEAN YEAR 1 9 9 0 1 9 8 4 1 9 7 3 1981 1991 1 9 7 6 1999 1973 1971 1971 1 9 7 9 1 9 8 2 1 9 9 9 LOWEST MEAN YEAR 1 9 7 7 1 9 7 9 1 9 8 4 1972 1997 1 9 8 0 2000 1982 1984 1974 1 9 9 6 1 9 8 9 1 9 7 7
MIN OBS TIME ADJUSTMENT 12 19 io 00 -06 -os -05 -03 -05 05 11 08 MAX OBS TIME ADJUSTMENT 02 05 04 04 04 03 01 00 -01 01 01 00
DANBURY HIGHEST MEAN 3 5 0 3 5 6 4 4 0 532 668 7 2 5 782 744 668 569 4 7 6 3 6 7 7 8 2 MEDIAN 2 7 6 2 9 1 3 7 5 483 587 6 7 9 721 701 621 507 4 1 6 3 2 5 4 9 4
LOWEST MEAN 1 7 6 1 9 2 3 1 5 434 551 6 2 8 691 668 586 469 3 4 7 1 8 1 1 7 6 HIGHEST MEAN YEAR 1 9 9 0 1 9 9 8 2 0 0 0 1991 1991 1 9 9 9 1999 1998 1998 1971 1 9 7 5 1 9 8 2 1 9 9 9 LOWEST MEAN YEAR 1 9 9 4 1 9 7 9 1 9 8 4 1975 1996 1 9 8 5 1976 1982 1984 1988 1 9 9 6 1 9 8 9 1 9 9 4
MIN OBS TIME ADJUSTMENT 00 00 00 00 00 00 00 00 00 00 00 00 MAX OBS TIME ADJUSTMENT 00 00 00 00 00 00 00 0 0 0 0 9-_9 0 0 deg_- 9
FALLS rVjiiLAGE bull TtiiGHESTSMEANbullbullv 3 3 3 3 4 7 MiSX-v51vO bull 63g3v 69i^ 741- r64-i4i VSSvS lt-356 V74-l-
2 5 3 2 6 ^ 8 sa^ii bull 7Q7 bullbull bull bull bull - bull bull IIS SB iss SI w$167 bull53--iV-
bull HIGHEST MEAN YEAR 1 9 9 0 1 9 8 4 2 0 0 0 i 9 9 i 1991 i976^ 1 9 9 9 i988 i971 vl999 3i984 1 9 9 9
bullbullbullbullbull X O W E S T MEANYEARv - 1 9 9 4 1 9 7 9 1 9 8 4 1 9 7 5 1 9 9 7 1 9 8 0 2 0 0 0 1976- 19761974 l976 bullrilMB9- 1 9 9 4 MIN OBS TIME ADJUSTMENT V - 1 0 - 1 3 -PV8 -o8 -Oi8 -oV6 -65 bull-bullbull07 -0ya- rflvlbull bull- 1 - iif--8
bullbullbullbullbullMAXMsiTIME--AlXroSTisENT - 0 6 bull-io v-Sv5 -P7 -12 hpe -ltys i-ivi -biaGROTON HIGHEST MEAN 3 6 5 3 6 4 4 2 5 508 624 6 8 5 IS2 7 3 8 678 5 8 7 4 8 6 3 8 8 7 5 2
MEDIAN 2 9 7 3 0 9 3 8 3 473 569 6 5 3 7 1 8 7 1 1 636 5 2 4 4 3 8 3 5 1 5 0 3 LOWEST MEAN 2 0 2 2 0 4 3 4 2 425 538 6 3 2 6 8 4 6 8 4 605 4 8 8 3 9 2 2 1 2 2 0 2
HIGHEST MEAN YEAR 1 9 9 0 1 9 8 4 2 0 0 0 1991 1991 1 9 8 4 1 9 9 4 1 9 8 4 1971 1 9 7 1 1 9 7 5 1 9 8 4 1 9 9 4 LOWEST MEAN YEAR 1 9 8 1 1 9 7 9 1 9 8 4 1972 1997 1 9 7 2 1 9 9 2 1 9 9 2 1978 1 9 7 4 1 9 7 6 1 9 8 9 1 9 8 1
MIN OBS TIME ADJUSTMENT 00 00 00 00 00 00 00 00 00 00 00 00 MAX OBS TIME ADJUSTMENT 00 00 00 00 00 00 00 00 00 00 00 00
HARTFORD BRAI HIGHEST MEAN 3 5 6 3 5 3 4 2 4 523 644 7 1 2 7 7 3 7 5 1 671 5 7 6 4 7 0 3 7 9 7 7 3 MEDIAN 2 6 2 2 9 0 3 7 4 481 591 6 8 2 7 3 5 7 1 4 627 5 1 2 4 2 0 3 2 0 4 9 9
LOWEST MEAN 1 7 7 1 8 8 3 0 3 428 551 6 3 7 7 0 3 6 8 9 582 4 5 3 3 2 2 1 7 8 1 7 7 HIGHEST MEAN YEAR 1 9 9 0 1 9 8 1 2 0 0 0 1991 1991 1 9 9 1 1 9 9 4 1 9 8 8 1971 1 9 9 0 1 9 9 9 1 9 9 0 1 9 9 4 LOWEST MEAN YEAR 1 9 8 2 1 9 7 9 1 9 8 4 1972 1997 1 9 8 0 2 0 0 0 1 9 8 2 1984 1 9 7 2 1 9 9 6 1 9 8 9 1 9 8 2
MIN OBS TIME ADJUSTMENT 12 19 10 00 00 - 0 5 --05 - 0 3 06 05 11 08 MAX OBS TIME ADJUSTMENT 02 04 04 05 04 Q-3 01 00 -0 1 00 0 1 01
HARTFORD BRAD HIGHEST MEAN 3 4 7 3 6 2 4 3 7 533 658 7 2 7 7 7 1 7 6 4 677 5 8 3 4 8 2 3 6 8 7 7 1 MEDIAN 2 6 8 2 8 8 3 8 3 492 599 6 8 8 7 4 0 7 1 6 630 5 1 4 4 1 5 3 1 1 4 9 9
LOWEST MEAN 1 7 8 1 8 0 3 1 4 443 560 6 3 7 6 9 6 6 9 0 586 4 7 3 3 7 9 1 8 1 1 7 8 HIGHEST MEAN YEAR 1 9 9 0 1 9 9 8 2 0 0 0 1976 1991 1 9 7 6 1 9 9 4 1 9 7 3 1971 1 9 7 1 1 9 7 5 1 9 9 8 1 9 9 4 LOWEST MEAN YEAR 1 9 8 1 1 9 7 9 1 9 8 4 1972 1984 1 9 8 5 2 0 0 0 1 9 8 7 1978 1 9 7 4 1 9 8 0 1 9 8 9 1 9 8 1
MIN OBS TIME ADJUSTMENT 00 00 00 00 00 00 00 00 00 00 00 00 MAX OBS TIME ADJUSTMENT 00 00 00 00 00 00 00 00 00 00 00 00
5
H r
A) F
yengt f
No
014
015
016
017
018
019
024
026
028
031
United States ^fifei CLIMATOGRAPHY OF THE UNITEDSTATES NO 81 lAiiato sal
w Monthly Normals of Temperature Precipitation and Heating and Cooling Degree Days 1971-2000
1971-2000
CONNECTICUT Page 10 F M A M J J A O H O
NORMALS STATISTICS Station Name Element JAN FEB MAR APR MAY JUN JUL AUG SEP OCT NOV DEC ANNUAL
MANSFIELE HOL HIGHEST MEAN 32 6 338 415 502 611 691 74 0 715 644 550 450 353 740
MEDIAN 25r9 265 357 457 568 65i 700 -684 599 488 401 305 472 LOWEST MEAN bull 14 9 16 4 302 410 524 607 665 65 1 57 i 44 v 4 V35S 154 149
HIGHEST MEAN YEAR 1998 1998 1973 1976 1991 1999 1994 1988 1971 1999 -1990 1994 1971 LOWEST MEAN YEAR 1981 1979 1984 1972 iS^O f85^ 1992 1986 i986 1974 1976 V1989 1981
bullbull M I H OBS TIME ADJUSTMENT 04 10 00 -06 -07 -6 -Ov5 bull-ltih -o9gt bull^tes bullbullbullbull0V4- 02
bullMAX OBS TIME ADJUSTMENT 02 04 04 04 03 02 01 Ovti -02 - 00 01 00 MIDDLETOWN 4 HIGHEST MEAN 389 378 439 535 649 720 781 750 677 585 479 395 781
MEDIAN 286 312 389 486 601 682 736 713 632 521 436 335 509 LOWEST MEAN 204 200 337 427 547 645 702 687 582 471 367 22 3 200
HIGHEST MEAN YEAR 1990 1981 1973 1991 1991 1999 1999 1988 1971 1971 1979 1990 1999 LOWEST MEAN YEAR 1994 1979 1984 1975 1974 1972 1974 1974 1975 1974 1996 1989 1979
MIN OBS TIME ADJUSTMENT -13 -15 -09 -09 -08 -07 -06 -09 -11 -15 -14 -11
MAX OBS TIME ADJUSTMENT -11 -11 -11 -17 -10 -14 -11 -13 -14 -20 -13 -10
MOUNT CARMEL HIGHEST MEAN bull 343- 354 423 504 632 705 773 732 660 573 460 375 773 - bull MEDIAN 265 279 lt37 2 474 577 669 723 705 625 512 409 320 490
LOWEST MEAN 17p- 161 316 426 538 629 695 676 587 473 352 174 167
HIGHEST-MEAN YEARV 1990 i998 2000 1976 1991 1999 1999 1980 1999 1971 1994 1998 1999 bullbull LOWEST MEAN YEAR 1981 1979 1984 1972 1973 1985 2000 1982 1975 1974 1976 1989 1979
bull MIN OBS TIME ADJUSTMENT bull o4 i o bullbullbulllt) o -06 -06 -07 -05 -07 -04 -06 04 02 MAX OBS TIME ADJUSTMENT 02 bull04 04 04 03 02 01 00 -01 00 01 01
NORFOLK SW HIGHEST MEAN 304 296 376 475 598 666 708 694 622 536 424 345 708 MEDIAN 214 220 310 431 551 634 681 661 581 471 374 273 446
LOWEST MEAN 117 113 249 372 511 592 645 639 556 425 326 117 113 HIGHEST MEAN YEAR 1990 1984 2000 1991 1991 1999 1994 1988 1998 1971 1975 1998 1994 LOWEST MEAN YEAR 1977 1979 1984 1972 1997 1985 2000 1992 1975 1974 1976 1989 1979
MIN OBS TIME ADJUSTMENT 04 10 00 -06 -06 -07 -05 -07 -04 -06 04 02 MAX OBS TIME ADJUSTMENT 02 04 04 04 04 02 01 00 -01 00 01 00
NORWALK GAS P HIGHEST MEAN 360 368 441 520 638 709 782 749 669 565 471 384 782 MEDIAN 291 300 389 491 582 bull 681 733 718 635 524 430 336 505
LOWEST MEAN 195 212 332 442 539 647 697 691 601 476 383 212 195 HIGHEST MEAN YEAR 1990 1998 2000 1977 1991 1999 1999 1980 1983 1990 1975 1984 1999 LOWEST MEAN YEAR 1981 1979 1984 1972 1974 1972 1992 1992 1975 1972 1995 1989 1981
MIN OBS TIME ADJUSTMENT 04 10 00 -06 -06 -06 -05 -07 -04 -06 04 01 MAX OBS TIME ADJUSTMENT 02 04 04 03 03 02 01 00 -01 00 01 00
NORWICH PUB U HIGHEST MEAN 354 362 429 517 627 710 778 748 680 568 472 378 778 MEDIAN 286 300 376 483 591 677 734 712 636 517 420 334 504
LOWEST MEAN 183 199 332 443 553 640 700 686 607 477 378 195 183 HIGHEST MEAN YEAR 1998 1998 1973 1986 1998 1999 1999 1988 1971 1971 1975 1996 1999 LOWEST MEAN YEAR 1977 1979 1984 1972 1990 1974 1992 1982 1984 1988 1976 1989 1977
MIN OBS TIME ADJUSTMENT 12 18 10 00 -06 -05 -04 -03 -04 05 11 07 MAX OBS TIME ADJUSTMENT 02 04 04 04 03 03 01 00 -01 00 01 00
SJiEPAUG I imlt t i HIGHEST MEAN 3i|i 7ogt6- 56i
bullbullbullbull bullbullbullbullbullshy
bull^degiP 448 bull -bull-bullbullpoundbull-shy
bull bull
vl39 28i 64 3 64 - ^i38v bullbull v--- bullbullbullbullLOWEST MEAN 14 8 396 52gt 8 1 Jff8J il3l
MEAN YEAR- bull 1985 1988 HIGHEST 1998 1984 1973 1998 1976 1999 1971 1975 fl998C bullbull 1999
bull LOWEST MEAN YfeAR 182 i979 1984 1972 1995 19poundS 199amp S1982 plusmn$15gt f-i-988 ii5976 1989 bullbullbull 1 9 8 9+
i MIN OBSi TIME ADJUSTMENT^1 -ii3 -l-i4 -09 -09 -O8 -67 -66 ii-tS -li- ftlgt4
bull
- bullbull bull bull bullbull bull bullbullbull ifiax OBS TIME ADJUSTMENT - l l -lv0 -11 ^17 Vlj-ff bull-i4 -0^7 ^i2 ^-i-4 -20 --WiV3 -poundbullampbull
STAMFORD 5 N HIGHEST MEAN 371 381 445 529 654 714 n 5 752 676 591 480 390 77 5 MEDIAN 301 310 400 502 602 689 732 716 641 532 438 346 514
LOWEST MEAN 183 214 340 451 564 648 704 689 604 486 370 226 183 HIGHEST MEAN YEAR 1998 1998 2000 1994 1991 1994 1994 1980 1980 1971 1975 1990 1994 LOWEST MEAN YEAR 1977 1979 1984 1972 1973 1985 2000 1982 1975 1974 1976 1989 1977
MIN OBS TIME ADJUSTMENT -11 -13 -09 -09 -08 -07 -05 -07 -09 -12 -12 -08 MAX OBS TIME ADJUSTMENT -10 -16 -10 -13 -18 -11 -12 -13 -17 -11 -13 -08
STORRS HIGHEST MEAN 342 345 416 505 614 684 743 716 655 559 463 376 743 MEDIAN 266 274 366 465 572 653 703 683 609 508 417 319 482
LOWEST MEAN 169 175 302 414 534 616 673 655 576 460 370 168 168 HIGHEST MEAN YEAR 1990 1998 1973 1976 1991 1999 1994 1988 1983 1971 1975 1998 1994 LOWEST MEAN YEAR 1977 1979 1984 1972 1997 1985 2000 1986 1975 1974 1976 1989 1989
MIN OBS TIME ADJUSTMENT 04 10 00 -06 -07 -07 -06 -07 -09 -06 04 02 MAX OBS TIME ADJUSTMENT 02 04 04 04 03 02 01 00 -01 00 01 00
WEST THOMPSON HIGHEST MEAN 323 335 406 496 610 686 749 723 641 551 453 363 749 MEDIAN 254 254 351 458 562 650 702 689 603 486 407 304 472
LOWEST MEAN 139 166 293 402 528 618 662 658 573 447 359 154 139 HIGHEST MEAN YEAR 1990 1998 2000 1976 1991 1976 1994 1984 1971 1971 1979 1998 1994 LOWEST MEAN YEAR 1981 1979 1984 1972 1990 1982 1992 1992 1978 1974 1976 1989 1981
MIN OBS TIME ADJUSTMENT 04 10 00 -06 -07 -07 -05 -07 -09 -06 04 02 MAX OBS TIME ADJUSTMENT 02 04 04 04 03 02 01 00 -02 00 01 00
CLIMATOGRAPHY OF THE UNITED STATES NO 81 Monthly Normals of Temperature Precipitation and Heating and Cooling Degree Days
1971-2000
CONNECTICUT Page 11
NORMALS STATISTICS No Station Name Element JAN FEB MAR APR MAY JUN JUL AUG SEP OCT NOV DEC ANNUAL
0 3 2 WIGWAM RESERV HIGHEST MEAN 315 327 403 491 612 686 7 4 bullbull a 711 654 572 44 0 349 748 bull-bull MEDIAN 240 25 1 353 459 57 5 656 702 v 683 bullbull60-2 39^3
bullbullbullbullbull
- bullbull LOWEST MEAN 139 153 295 395 522 6i8 670 bull65J1 bull 58 0- 337 - HIGHEST MEAN YEAR 1990 1984 2000 1991 1991 1999 1999 1988 1971 1979 1999
bullbull -bullbull-bull v bull - L O W E S T - M E A N YEAR1977 - J1993 1975 1974 2 000 ^992 1976 1989 1978
1- 0bullbullbullbull -VMIN O B S TIME A D J U S T M E N T 04 00 -06 -06 -07 bull-04 bull 04 bullbullbullbullltgtbullbullbull
MAX OBS TIME ADJUSTMENT 02 04 04 04 03 02lt-bullpi o o 01
C-2 Soil Maps from Soil Survey of Middlesex County Connecticut [USDA 1979]
Soil Survey of
United States Department of Agriculture Soil Conservation Service
in cooperation with
Connecticut Agricultural Experiment Station
Storrs Agricultural Experiment Station
IN7230
72 40
LEGEND
72^20 SOILS OF THE NEW ENGLAND UPLANDS THAT FORMED MAINLY IN MATERIAL THAT WEATHERED FROM GNEISS SCHIST AND GRANITE
-41 30
IS It O
2
3
bull 5
Canton-Hollis-Charlton Gently sloping to steep somewhat excessively drained and well drained loamy soils on glacial till uplands
Hollis-Charlton Gently sloping to steep somewhat excessively drained and well drained loamy sons on bedrock-controlled glacial till uplands
Paxton-Woodbridge Nearly level to steep well drained and moderately well drained loamy soils that have a compact substratum on drumloidal glacial till uplands and broad glacial till plains
Hinckley-Agawam-Merrimac Nearly level to steep excessively drained to well drained loamy and sandy soils on glacial outwash plains and terraces
SOILS OF THE CONNECTICUT VALLEY LOWLANDS THAT FORMED MAINLY IN MATERIAL THAT WEATHERED FROM TRIASSIC SANDSTONE AND CONGLOMERATE
Rumney-Saco-Podunk Nearly level moderately well drained to very poorly drained loamy soils on flood plains
Holyoke-Wethersfield-Cheshire Gently sloping to steep somewhat excessively drained and well drained loamy soils on bedrock-controlled glacial till uplands
Wethersfield-Ludlow-Wilbraham Nearly level to steep well drained to poorly drained loamy soilsthat have a compact substratum on drumloidal glacial till uplands and broad glacial till plains Hartford-Manchester-Penwood Nearly level to sloping excessively drained and somewhat excessively drained sandy soils on outwash plains and terraces
Compiled 1978
U S DEPARTMENT OF AGRICULTURE SOIL CONSERVATION SERVICE
GENERAL SOIL MAP MIDDLESEX COUNTY CONNECTICUT
WESTBBOOK HARBOR
ISLAND
Scale 1190080 1 0 1 2 3 4 Miles I I I I 1 I I I I
1 9 2 3 4 Kilometers I I I I I I I
Each area outlined on this map consists of more than one kind of soil The map it thus meant for genera planning rather than a basis for decisions on the use of specific tracts
IN7230
IT 40
C 7220
Inset sheet 4
mdash 4130
1 4T2C
INDEX TO MAP SHEETS MIDDLESEX COUNTY CONNECTICUT
46 1 0I 1 I 1 I
Scale 1190080 1 2
I I 3
I 4 Miles
I
LAND OVffD 1 9I I I
J
I 2
I 3
I 4 Kilometers
I
CONNECTICUT AGRICULTURAL EXPERIMENT STATION US DEPARTMENT OF AGRICULTURE MIDDLESEX COUNTY CONNECTICUT STORRS AGRICULTURAL EXPERIMENT STATION
SOIL CONSERVATION SERVICE
CONVENTIONAL AND SPECIAL SOIL LEGEND SYMBOLS LEGEND
CULTURAL FEATURES SPECIAL SYMBOLS FOR SOIL SURVEY
BOUNDARIES MISCELLANEOUS CULTURAL FEATURES SOIL DELINEATIONS AND SYMBOLS
National state or province Farmstead house (omit in urban areas) ESCARPMENTS The first letter always a capital is the initial letter of the soil name The second letter is a capital if the mapping unit is broadly
County or parish Church I Bedrock
(points down slope) defined otherwise it is a small letter The third letter always a capital A B C 0 or E indicates the slope Most symbols without a slope letter are those of nearly level soils however some are for soils that have a considerable range of slope but have similar
Minor civil division School C
Indian Other than bedrock
(points down slope)
use interpretations
Mound Reservation (national forest or park
state forest or park
and large airport)
Indian mound (label)
Located object (label)
Tower
SHORT STEEP SLOPE
GULLY fSSSSfSfSJi
SYMBOL NAME SYMBOL NAME
Land grant Tank (label)
DEPRESSION OR SINK
Limit of soil survey (label) Wells oil or gas
SOIL SAMPLE SITE (normally not shown)
AaAfA
Adrian muck Agawam fine sandy loam 0 to 3 percent slopes
PbBPbC
Paxton and Montauk fine sandy loams 3 to 8 percent slopes Paxton and Montauk fine sandy loams 8 to 15 percent slopes
Field sheet matchline amp neatline Windmill MISCELLANEOUS
AfB Agawam fine sandy loam 3 to 8 percent slopes PbDPdB
Paxton and Montauk fine sandy loams 15 to 25 percent slopes Paxton and Montauk very stony fine sandy loams 3 to 8 percent slopes
Ba Beaches-Udipsamments complex PdC Paxton and Montauk very stony fine sandy loams 8 to 15 percent slopes AD HOC BOUNDARY (label)
Kitchen midden Blowout BcA Berlin silt loam 0 to 5 percent slopes PeC Paxton and Montauk extremely stony fine sandy loams 3 to 15 percent slopes BoA Branford silt loam 0 to 3 percent slopes PeD Paxton and Montauk extremely stony fine sandy loams 15 to 35 percent slopes
Small airport airfield park oilfield
cemetery or flood pool
STATE COORDINATE TICK
Clay spot
Gravelly spot
BoBBoC
CbB
Branford silt loam 3 to 8 percent slopes Branford silt loam 8 to 15 percent slopes
Canton and Chariton fine sandy loams 3 to 8 percent slopes
PnAPnBPrPs
Penwood loamy sand 0 to 3 percent slopes Penwood loamy sand 3 to 8 percent slopes
Pits gravel Podunk fine sandy loam
CcB Canton and Chariton very stony fine sandy loams 3 to 8 percent slopes LAND DIVISION CORNERS l_ Gumbo slick or scabby spot (sodic) CcC Canton and Chariton very stony fine sandy loams 8 to 15 percent slopes Rb Raypol silt loam
(sections and land grants)
ROADS WATER FEATURES Dumps and other similar non soil areas
CdCCdDCe
Canton and Chariton extremely stony fine sandy loams 3 to 15 percent slopes Canton and Chariton extremely stony fine sandy loams 15 to 35 percent slopes
Carlisle muck
RpRuRv
Rock outcrop-Hollis complex Rumney fine sandy loam Rumney Variant silt loam
Divided (median shown if scale permits)
Other roads
DRAINAGE
Perennial double line
Prominent hill or peak
Rock outcrop (includes sandstone and shale)
CrCCsBCsCCyC
Charlton-Hollis very stony fine sandy loams 3 to 15 percent slopes Cheshire silt loam 3 to 8 percent slopes Cheshire silt loam 8 to 15 percent slopes Cheshire-Holyoke very stony silt loams 3 to 15 percent slopes
Sb5cSgASt
Saco silt loam Scarboro mucky loamy fine sand
Sudbury sandy loam 0 to 5 percent slopes Suncook loamy sand
Trail Perennial single line Saline spot EfA Ellington fine sandy loam 0 to 5 percent slopes
UD Udorthents-Urban land complex
ROAD EMBLEMS amp DESIGNATIONS Intermittent Sandy spot HfAHfB
Hartford sandy loam 0 to 3 percent slopes Hartford sandy loam 3 to 8 percent slopes
Ur Urban land
HkC Hinckley gravelly sandy loam 3 to 15 percent slopes VVd Wa lpo le sandy l oam
Interstate Drainage end Severely eroded spot HME
HpE Hinckley and Manchester soils 15 to 45 percent slopes Hollis-Charlton extremely stony fine sandy loams 15 to 4 0 percent slopes
WeWh
Westbrook mucky peat Westbrook mucky peat low salt
Federal
State
County farm or ranch
copy
Canals or ditches
Double-line (label)
Drainage andor irrigation
Slide or slip (tips point upslope)
Stony spot very stony spot
Clay pit
0 copy
HrCHSEHuDHyCHZE
LG
Hollis-Rock outcrop complex 3 to 15 percent slopes Hollis-Rock outcrop complex 15 to 40 percent slopes Holyoke-Cheshire very stony silt loams 15 to 35 percent slopes Holyoke-Rock outcrop complex 3 to 15 percent slopes Holyoke-Rock outcrop complex 15 to 40 percent slopes
Leicester Ridgebury and Whitman extremely stony fine sandy loams
WkBWkCWkD
WkDWmBWmC
Wethersfield loam 3 to 8 percent slopes Wethersfield loam 8 to 15 percent slopes Wethersfield loam 15 to 35 percent slopes
Wetherslield loam 15 to 35 percent slopes Wethersfield very stony loam 3 to 8 percent slopes Wethersfield very stony loam 8 to 15 percent slopes
RAILROAD LAKES PONDS AND RESERVOIRS LpA
LpB Ludlow silt loam 0 to 3 percent slopes Ludlow silt loam 3 to 8 percent slopes
WnCWr
Wethersfield extremely stony loam 3 to 15 percent slopes Wilbraham silt loam
LuB Ludlow very stony silt loam 3 to 8 percent slopes Wt Wilbraham extremely stony silt loam
POWER TRANSMISSION LINE Perennial LvC Ludlow extremely stony silt loam 3 to 15 percent slopes WvA
WvB Windsor loamy sand 0 to 3 percent slopes Windsor loamy sand 3 to 8 percent slopes
(normally not shown) Intermittent MgA Manchester gravelly sandy loam 0 to 3 percent slopes WxA Woodbridge fine sandy loam 0 to 3 percent slopes
PIPELINE MgC Manchester gravelly sandy loam 3 to 15 percent slopes WxB Woodbridge fine sandy loam 3 to 8 percent slopes
(normally not shown) FENCE MISCELLANEOUS WATER FEATURES
MyAMyB
Merrimac sandy loam 0 to 3 percent slopes Merrimac sandy loam 3 to 10 percent slopes
WyAWyB
Woodbridge very stony fine sandy loam 0 to 3 percent slopes Woodbridge very stony fine sandy loam 3 to 8 percent slopes
(normally not shown) VVzA Woodbridge extremely stony fine sandy loam 0 to 3 percent slopes
Marsh or swamp NnA Ninigret fine sandy loam 0 to 5 percent slopes WzC Woodbridge extremely stony fine sandy loam 3 to 15 percent slopes
LEVEES
Without road Spring cv-
YaBYaC
Yalesville fine sandy loam 3 to 8 percent slopes Yalesville fine sandy loam 8 to 15 percent slopes
Well artesian With road
Well irrigation With railroad
DAMS Wet spot
Large (to scale)
Medium or small
PITS
Gravel pit a
Mine or quarry
MIDDLESEX COUNTY CONNECTICUT - SHEET NUMBER 26 (26) (Jo n heef 20) WkD WkC WkC 1 P B WkC i W k D HZE Wt Rb HkCW^C | |_C
N
it
S
IMIDDLESEX COUNTY CONNECTICUT - SHEET NUMBER 25
C s Clining thoof 191Wt
MIDDLESEX COUNTY CONNECTICUT mdash SHEET NUMBER 20
MIDDLESEX COUNTY CONNECTICUT - SHEET NUMBER 19 LvC Pr EA
N
A
llni
oo IT)
llo 1deg
I
LpB
C-3 Land Use Maps
Town of Durham CT INLAND WETLANDS PLOODPLAINS MAP
( Scale ]fai+150k)
N
MAJOR ROADS
TOWN 5OUNDARY
WETLAND AREA
1OO qear floockwatj
UmSTAXE KBGtONAL WANNING ACKNCV i C r W4R
Created May 132002
Town of Durham CT CULTURAL AREAS
OP SIGNIFICANCE MAP bullbullbullbull( S c a l e M m
ARCHEOLOGICALLY SENSITIVE AREAS KNOWN ARCHEOLOGICAL AREAS
MAJOR ROADS TOWN 5OUNDARY
MDSIAXB REltHONAL PLANNING AGENCY raquo0 DiKmta Dritc tOMtuma CT 064S7
4250 +250 00 Peet FhoBemj4772M FOB M 3 4 M B )
File coldaicvtewnewprojectedurhampocdjipr Created May 13 3003
- barcode 67295
- barcodetext SDMS ID 67295
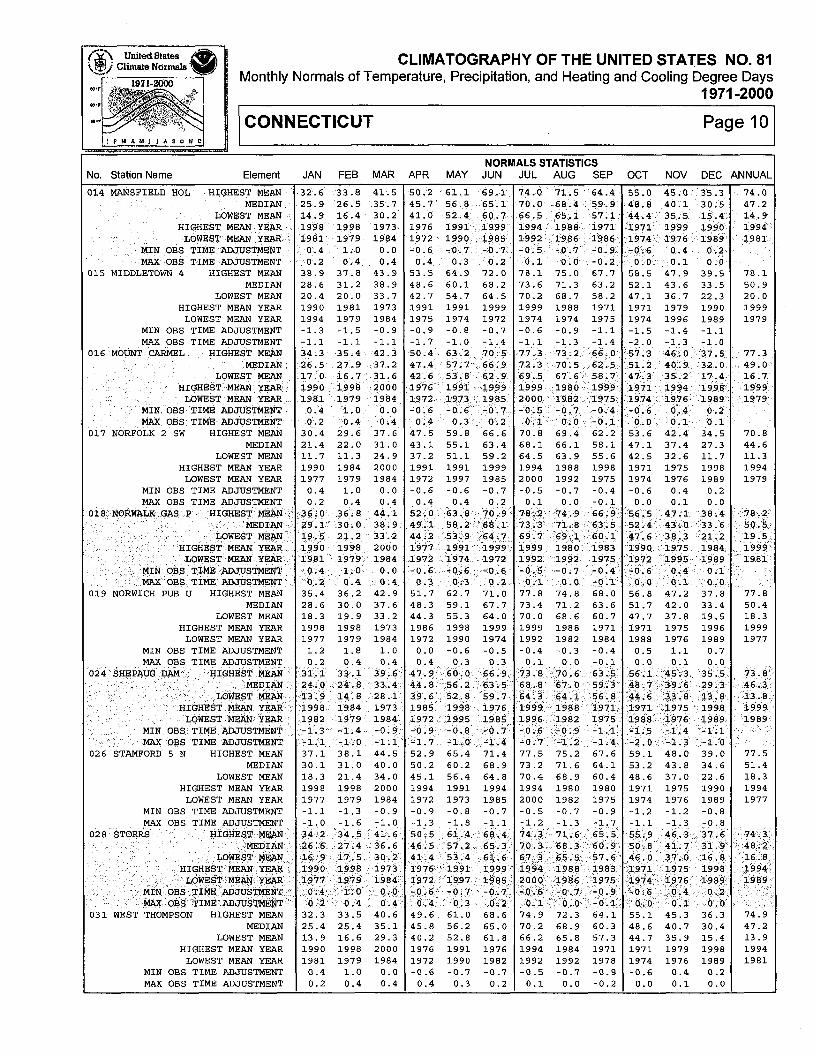
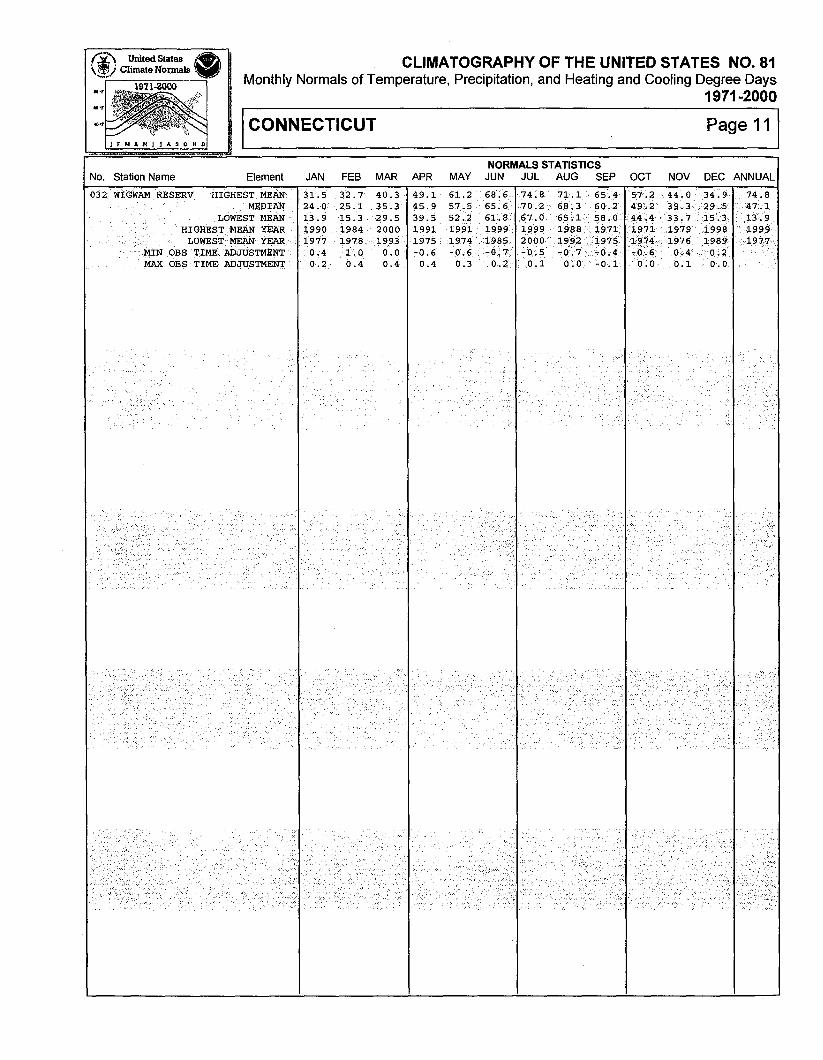

IN7230
IT 40
C 7220
Inset sheet 4
mdash 4130
1 4T2C
INDEX TO MAP SHEETS MIDDLESEX COUNTY CONNECTICUT
46 1 0I 1 I 1 I
Scale 1190080 1 2
I I 3
I 4 Miles
I
LAND OVffD 1 9I I I
J
I 2
I 3
I 4 Kilometers
I
CONNECTICUT AGRICULTURAL EXPERIMENT STATION US DEPARTMENT OF AGRICULTURE MIDDLESEX COUNTY CONNECTICUT STORRS AGRICULTURAL EXPERIMENT STATION
SOIL CONSERVATION SERVICE
CONVENTIONAL AND SPECIAL SOIL LEGEND SYMBOLS LEGEND
CULTURAL FEATURES SPECIAL SYMBOLS FOR SOIL SURVEY
BOUNDARIES MISCELLANEOUS CULTURAL FEATURES SOIL DELINEATIONS AND SYMBOLS
National state or province Farmstead house (omit in urban areas) ESCARPMENTS The first letter always a capital is the initial letter of the soil name The second letter is a capital if the mapping unit is broadly
County or parish Church I Bedrock
(points down slope) defined otherwise it is a small letter The third letter always a capital A B C 0 or E indicates the slope Most symbols without a slope letter are those of nearly level soils however some are for soils that have a considerable range of slope but have similar
Minor civil division School C
Indian Other than bedrock
(points down slope)
use interpretations
Mound Reservation (national forest or park
state forest or park
and large airport)
Indian mound (label)
Located object (label)
Tower
SHORT STEEP SLOPE
GULLY fSSSSfSfSJi
SYMBOL NAME SYMBOL NAME
Land grant Tank (label)
DEPRESSION OR SINK
Limit of soil survey (label) Wells oil or gas
SOIL SAMPLE SITE (normally not shown)
AaAfA
Adrian muck Agawam fine sandy loam 0 to 3 percent slopes
PbBPbC
Paxton and Montauk fine sandy loams 3 to 8 percent slopes Paxton and Montauk fine sandy loams 8 to 15 percent slopes
Field sheet matchline amp neatline Windmill MISCELLANEOUS
AfB Agawam fine sandy loam 3 to 8 percent slopes PbDPdB
Paxton and Montauk fine sandy loams 15 to 25 percent slopes Paxton and Montauk very stony fine sandy loams 3 to 8 percent slopes
Ba Beaches-Udipsamments complex PdC Paxton and Montauk very stony fine sandy loams 8 to 15 percent slopes AD HOC BOUNDARY (label)
Kitchen midden Blowout BcA Berlin silt loam 0 to 5 percent slopes PeC Paxton and Montauk extremely stony fine sandy loams 3 to 15 percent slopes BoA Branford silt loam 0 to 3 percent slopes PeD Paxton and Montauk extremely stony fine sandy loams 15 to 35 percent slopes
Small airport airfield park oilfield
cemetery or flood pool
STATE COORDINATE TICK
Clay spot
Gravelly spot
BoBBoC
CbB
Branford silt loam 3 to 8 percent slopes Branford silt loam 8 to 15 percent slopes
Canton and Chariton fine sandy loams 3 to 8 percent slopes
PnAPnBPrPs
Penwood loamy sand 0 to 3 percent slopes Penwood loamy sand 3 to 8 percent slopes
Pits gravel Podunk fine sandy loam
CcB Canton and Chariton very stony fine sandy loams 3 to 8 percent slopes LAND DIVISION CORNERS l_ Gumbo slick or scabby spot (sodic) CcC Canton and Chariton very stony fine sandy loams 8 to 15 percent slopes Rb Raypol silt loam
(sections and land grants)
ROADS WATER FEATURES Dumps and other similar non soil areas
CdCCdDCe
Canton and Chariton extremely stony fine sandy loams 3 to 15 percent slopes Canton and Chariton extremely stony fine sandy loams 15 to 35 percent slopes
Carlisle muck
RpRuRv
Rock outcrop-Hollis complex Rumney fine sandy loam Rumney Variant silt loam
Divided (median shown if scale permits)
Other roads
DRAINAGE
Perennial double line
Prominent hill or peak
Rock outcrop (includes sandstone and shale)
CrCCsBCsCCyC
Charlton-Hollis very stony fine sandy loams 3 to 15 percent slopes Cheshire silt loam 3 to 8 percent slopes Cheshire silt loam 8 to 15 percent slopes Cheshire-Holyoke very stony silt loams 3 to 15 percent slopes
Sb5cSgASt
Saco silt loam Scarboro mucky loamy fine sand
Sudbury sandy loam 0 to 5 percent slopes Suncook loamy sand
Trail Perennial single line Saline spot EfA Ellington fine sandy loam 0 to 5 percent slopes
UD Udorthents-Urban land complex
ROAD EMBLEMS amp DESIGNATIONS Intermittent Sandy spot HfAHfB
Hartford sandy loam 0 to 3 percent slopes Hartford sandy loam 3 to 8 percent slopes
Ur Urban land
HkC Hinckley gravelly sandy loam 3 to 15 percent slopes VVd Wa lpo le sandy l oam
Interstate Drainage end Severely eroded spot HME
HpE Hinckley and Manchester soils 15 to 45 percent slopes Hollis-Charlton extremely stony fine sandy loams 15 to 4 0 percent slopes
WeWh
Westbrook mucky peat Westbrook mucky peat low salt
Federal
State
County farm or ranch
copy
Canals or ditches
Double-line (label)
Drainage andor irrigation
Slide or slip (tips point upslope)
Stony spot very stony spot
Clay pit
0 copy
HrCHSEHuDHyCHZE
LG
Hollis-Rock outcrop complex 3 to 15 percent slopes Hollis-Rock outcrop complex 15 to 40 percent slopes Holyoke-Cheshire very stony silt loams 15 to 35 percent slopes Holyoke-Rock outcrop complex 3 to 15 percent slopes Holyoke-Rock outcrop complex 15 to 40 percent slopes
Leicester Ridgebury and Whitman extremely stony fine sandy loams
WkBWkCWkD
WkDWmBWmC
Wethersfield loam 3 to 8 percent slopes Wethersfield loam 8 to 15 percent slopes Wethersfield loam 15 to 35 percent slopes
Wetherslield loam 15 to 35 percent slopes Wethersfield very stony loam 3 to 8 percent slopes Wethersfield very stony loam 8 to 15 percent slopes
RAILROAD LAKES PONDS AND RESERVOIRS LpA
LpB Ludlow silt loam 0 to 3 percent slopes Ludlow silt loam 3 to 8 percent slopes
WnCWr
Wethersfield extremely stony loam 3 to 15 percent slopes Wilbraham silt loam
LuB Ludlow very stony silt loam 3 to 8 percent slopes Wt Wilbraham extremely stony silt loam
POWER TRANSMISSION LINE Perennial LvC Ludlow extremely stony silt loam 3 to 15 percent slopes WvA
WvB Windsor loamy sand 0 to 3 percent slopes Windsor loamy sand 3 to 8 percent slopes
(normally not shown) Intermittent MgA Manchester gravelly sandy loam 0 to 3 percent slopes WxA Woodbridge fine sandy loam 0 to 3 percent slopes
PIPELINE MgC Manchester gravelly sandy loam 3 to 15 percent slopes WxB Woodbridge fine sandy loam 3 to 8 percent slopes
(normally not shown) FENCE MISCELLANEOUS WATER FEATURES
MyAMyB
Merrimac sandy loam 0 to 3 percent slopes Merrimac sandy loam 3 to 10 percent slopes
WyAWyB
Woodbridge very stony fine sandy loam 0 to 3 percent slopes Woodbridge very stony fine sandy loam 3 to 8 percent slopes
(normally not shown) VVzA Woodbridge extremely stony fine sandy loam 0 to 3 percent slopes
Marsh or swamp NnA Ninigret fine sandy loam 0 to 5 percent slopes WzC Woodbridge extremely stony fine sandy loam 3 to 15 percent slopes
LEVEES
Without road Spring cv-
YaBYaC
Yalesville fine sandy loam 3 to 8 percent slopes Yalesville fine sandy loam 8 to 15 percent slopes
Well artesian With road
Well irrigation With railroad
DAMS Wet spot
Large (to scale)
Medium or small
PITS
Gravel pit a
Mine or quarry
MIDDLESEX COUNTY CONNECTICUT - SHEET NUMBER 26 (26) (Jo n heef 20) WkD WkC WkC 1 P B WkC i W k D HZE Wt Rb HkCW^C | |_C
N
it
S
IMIDDLESEX COUNTY CONNECTICUT - SHEET NUMBER 25
C s Clining thoof 191Wt
MIDDLESEX COUNTY CONNECTICUT mdash SHEET NUMBER 20
MIDDLESEX COUNTY CONNECTICUT - SHEET NUMBER 19 LvC Pr EA
N
A
llni
oo IT)
llo 1deg
I
LpB
C-3 Land Use Maps
Town of Durham CT INLAND WETLANDS PLOODPLAINS MAP
( Scale ]fai+150k)
N
MAJOR ROADS
TOWN 5OUNDARY
WETLAND AREA
1OO qear floockwatj
UmSTAXE KBGtONAL WANNING ACKNCV i C r W4R
Created May 132002
Town of Durham CT CULTURAL AREAS
OP SIGNIFICANCE MAP bullbullbullbull( S c a l e M m
ARCHEOLOGICALLY SENSITIVE AREAS KNOWN ARCHEOLOGICAL AREAS
MAJOR ROADS TOWN 5OUNDARY
MDSIAXB REltHONAL PLANNING AGENCY raquo0 DiKmta Dritc tOMtuma CT 064S7
4250 +250 00 Peet FhoBemj4772M FOB M 3 4 M B )
File coldaicvtewnewprojectedurhampocdjipr Created May 13 3003
- barcode 67295
- barcodetext SDMS ID 67295
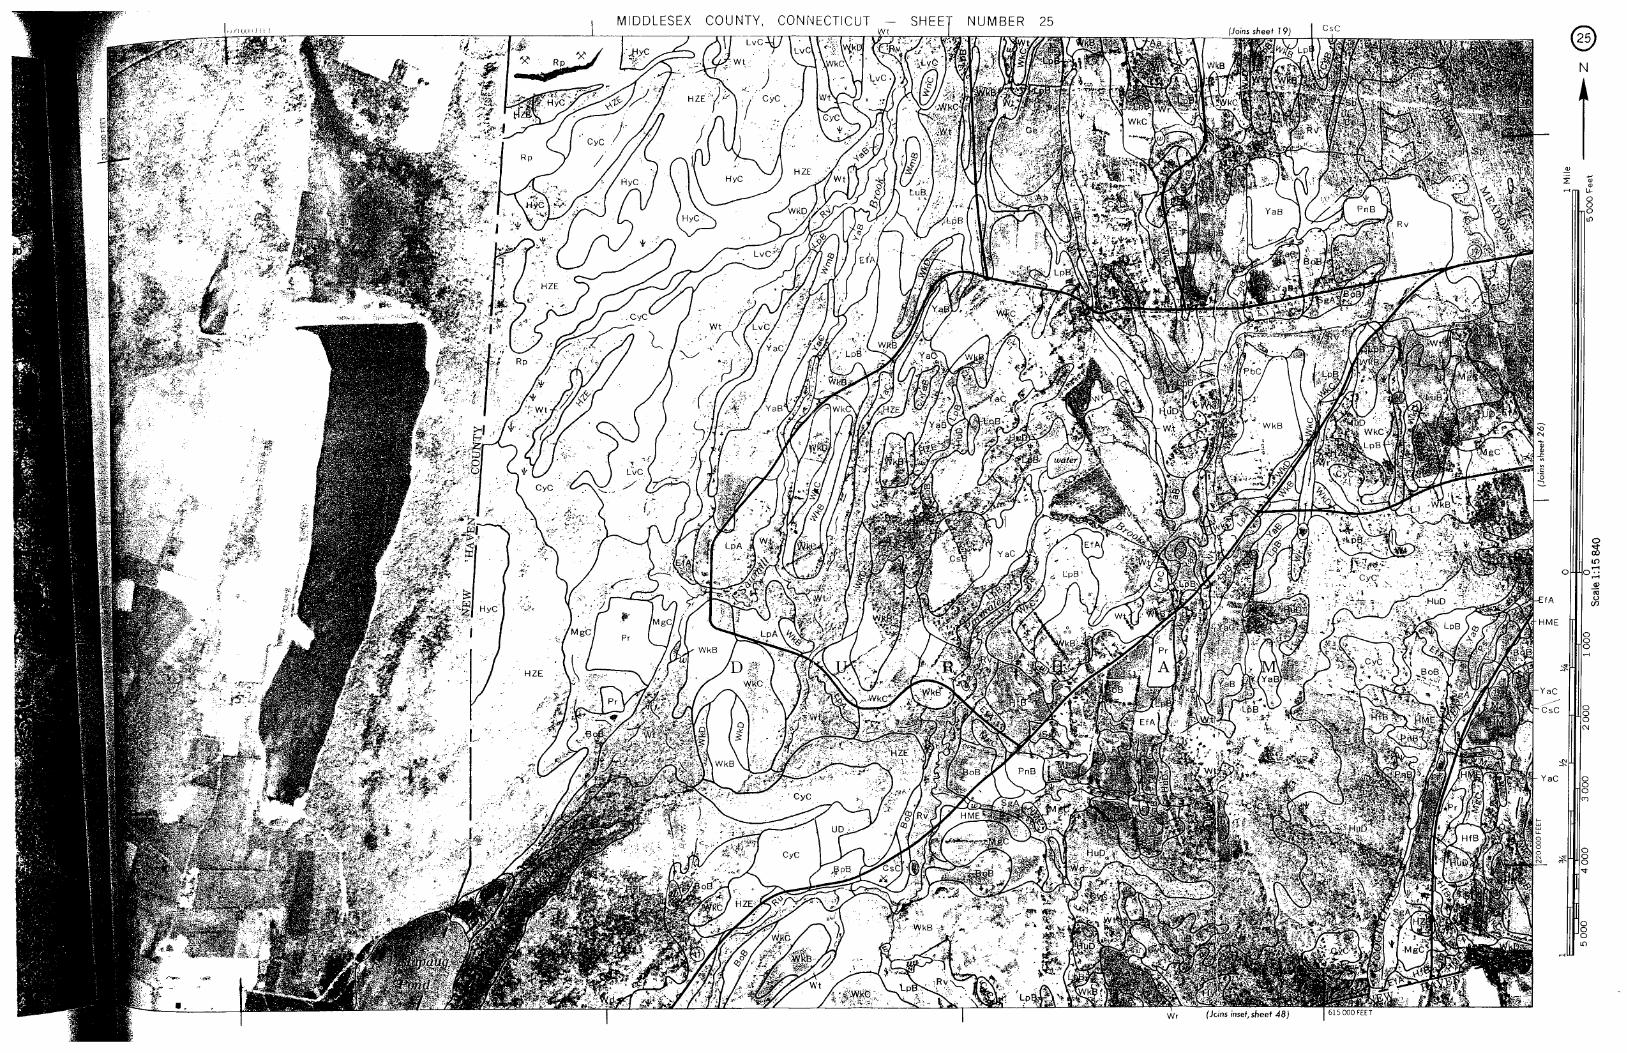
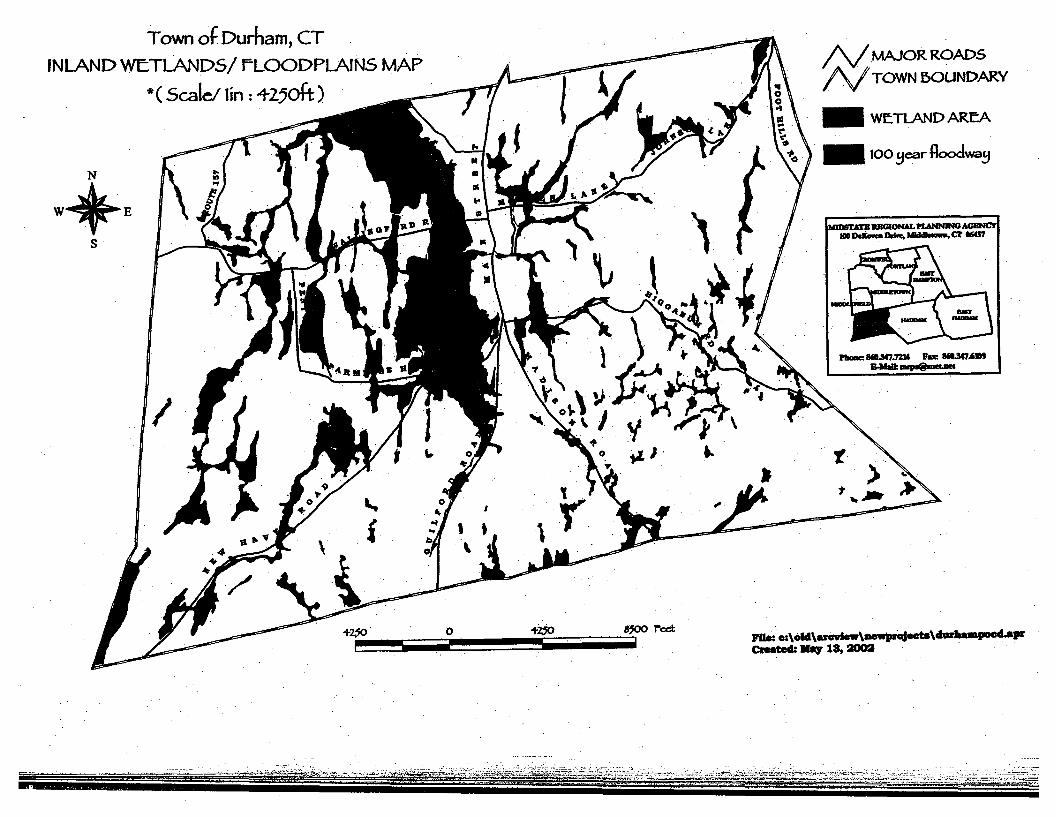