monthly statistics package - fraser valley real estate board 201308.pdf · surrey, bc – buyers...
TRANSCRIPT

Fraser Valley Real Estate Board Monthly Statistics Package
August 2013

News Release Fraser Valley Real Estate Board
Contact Laurie Dawson, Assistant Manager, Communications [email protected] Fraser Valley Real Estate Board Telephone 604.930.7657 Fax 604.930.7623 www.fvreb.bc.ca
For Immediate Release: Sept. 4, 2013
Continued improvement in Fraser Valley’s housing market
SURREY, BC – Buyers and sellers continued to show greater confidence in the market last month as home sales on the Fraser Valley Real Estate Board’s Multiple Listing Service® (MLS®) edged closer to typical levels.
The Board processed 1,258 sales in August, an increase of 17 per cent compared to the 1,073 sales in August of last year however, the volume remains 13 per cent below the 10‐year average for the month.
Ron Todson, President of the Board, explains, “The best way to describe our market currently is one of continued, modest improvement as buyers and sellers become more confident.
“In the last month in the Fraser Valley, we’ve seen an increase in sellers willing to accept an offer subject to another sale, we’re seeing fewer deals collapse and we’re seeing more move‐up buyers, either improving on the size or quality of their existing home. These are all indicators of a return to a more typical, stable market.”
In terms of inventory, the Board received 2,353 new listings in August, a decrease of 2 per cent compared to the 2,406 new listings received during the same month last year – leaving the volume of active properties at 10,127 a decrease of 2 per cent compared to August 2012.
Todson says, “An important measure of the balance between housing supply and demand is the number of months it would take to sell our existing inventory. We’re currently sitting at eight months’ supply in the Fraser Valley, indicating a balanced market, which is also being reflected in the stability of home prices.
“Home prices generally remain unchanged or down slightly from a year ago; however, do check with your local REALTOR® if you’re in need of specific values because the range between property type and community can be sizeable.”
In August, the benchmark price of single family detached homes in the Fraser Valley was $551,000, virtually on par with $551,400 during the same month last year. For townhouses, the benchmark price was $298,200, a decrease of 1.6 per cent compared to $303,000 in August 2012 and the benchmark price of apartments was $203,900, 1.3 per cent less than in August 2012 when it was $206,600.
—30 —
The Fraser Valley Real Estate Board is an association of 2,795 real estate professionals who live and work in the BC communities of
North Delta, Surrey, White Rock, Langley, Abbotsford, and Mission. The FVREB marked its 90‐year anniversary in 2011.

MLS® Summary - Fraser ValleyAugust 2013
All Property Types All Property Types
Grand Totals Aug-13 Aug-12 % change Jul-13 % change Grand Totals - year to date 2013 2012 % change
Sales 1,258 1,073 17.2% 1,456 -13.6% Sales - year to date 9,421 10,425 -9.6%
New Listings 2,353 2,406 -2.2% 2,777 -15.3% New Listings - year to date 21,840 23,346 -6.5%
Active Listings 10,127 10,366 -2.3% 10,428 -2.9%
Average Price 478,376$ 483,024$ -1.0% 498,230$ -4.0%
Detached Townhouse Apartment
All Areas Combined Aug-13 Aug-12 % change Jul-13 % change Aug-13 Aug-12 % change Jul-13 % change Aug-13 Aug-12 % change Jul-13 % change
Sales 630 519 21.4% 774 -18.6% 286 210 36.2% 280 2.1% 220 199 10.6% 239 -7.9%
New Listings 1,136 1,104 2.9% 1,284 -11.5% 445 390 14.1% 467 -4.7% 367 443 -17.2% 501 -26.7%
Active Listings 4,021 4,197 -4.2% 4,149 -3.1% 1,526 1,543 -1.1% 1,563 -2.4% 1,846 1,918 -3.8% 1,943 -5.0%
Benchmark Price 551,000$ 551,400$ -0.1% 551,000$ 0.0% 298,200$ 303,000$ -1.6% 297,800$ 0.1% 203,900$ 206,600$ -1.3% 202,000$ 0.9%
Median Price 548,000$ 533,013$ 2.8% 548,500$ -0.1% 326,500$ 329,500$ -0.9% 328,500$ -0.6% 192,250$ 203,000$ -5.3% 203,000$ -5.3%
Average Price 618,884$ 623,897$ -0.8% 617,085$ 0.3% 334,240$ 349,172$ -4.3% 346,158$ -3.4% 217,166$ 204,084$ 6.4% 225,204$ -3.6%
Detached Townhouse Apartment
Abbotsford Aug-13 Aug-12 % change Jul-13 % change Aug-13 Aug-12 % change Jul-13 % change Aug-13 Aug-12 % change Jul-13 % change
S % % % % % %
Source: Fraser Valley Real Estate Board MLS Summary Page 1 of 3
Sales 89 75 18.7% 99 -10.1% 42 25 68.0% 36 16.7% 48 57 -15.8% 48 0.0%
New Listings 141 148 -4.7% 169 -16.6% 62 54 14.8% 58 6.9% 84 92 -8.7% 84 0.0%
Active Listings 552 649 -14.9% 577 -4.3% 216 227 -4.8% 215 0.5% 339 334 1.5% 349 -2.9%
Benchmark Price 432,900$ 432,000$ 0.2% 432,900$ 0.0% 236,900$ 243,200$ -2.6% 241,300$ -1.8% 166,900$ 174,100$ -4.1% 166,300$ 0.4%
Median Price 422,500$ 405,000$ 4.3% 420,000$ 0.6% 264,950$ 285,000$ -7.0% 261,875$ 1.2% 140,000$ 140,000$ 0.0% 150,800$ -7.2%
Average Price 438,112$ 460,987$ -5.0% 462,401$ -5.3% 275,885$ 275,052$ 0.3% 264,893$ 4.1% 139,083$ 138,861$ 0.2% 153,045$ -9.1%
Detached Townhouse Apartment
Mission Aug-13 Aug-12 % change Jul-13 % change Aug-13 Aug-12 % change Jul-13 % change Aug-13 Aug-12 % change Jul-13 % change
Sales 38 33 15.2% 56 -32.1% 1 1 0.0% 1 0.0% 4 1 300.0% 2 100.0%
New Listings 89 68 30.9% 79 12.7% 4 1 300.0% 3 33.3% 5 9 -44.4% 4 25.0%
Active Listings 322 362 -11.0% 303 6.3% 32 27 18.5% 33 -3.0% 33 34 -2.9% 36 -8.3%
Benchmark Price 355,300$ 359,800$ -1.3% 359,600$ -1.2% 223,900$ 228,100$ -1.8% 225,900$ -0.9% 155,700$ 166,400$ -6.4% 156,000$ -0.2%
Median Price 373,750$ 402,000$ -7.0% 371,000$ 0.7% 289,000$ 165,000$ 75.2% 183,500$ 57.5% 146,000$ 68,000$ 114.7% 154,000$ -5.2%
Average Price 367,284$ 404,974$ -9.3% 366,741$ 0.1% 289,000$ 165,000$ 75.2% 183,500$ 57.5% 152,750$ 68,000$ 124.6% 154,000$ -0.8%
Source: Fraser Valley Real Estate Board MLS Summary Page 1 of 3

Detached Townhouse Apartment
White Rock / South Surrey Aug-13 Aug-12 % change Jul-13 % change Aug-13 Aug-12 % change Jul-13 % change Aug-13 Aug-12 % change Jul-13 % change
Sales 94 81 16.0% 117 -19.7% 50 36 38.9% 52 -3.8% 41 34 20.6% 71 -42.3%
New Listings 203 165 23.0% 205 -1.0% 73 58 25.9% 90 -18.9% 77 106 -27.4% 93 -17.2%
Active Listings 728 654 11.3% 750 -2.9% 258 232 11.2% 273 -5.5% 419 412 1.7% 426 -1.6%
Benchmark Price 841,600$ 875,400$ -3.9% 849,500$ -0.9% 447,700$ 468,400$ -4.4% 449,300$ -0.4% 246,700$ 244,700$ 0.8% 246,300$ 0.2%
Median Price 793,941$ 820,000$ -3.2% 825,000$ -3.8% 403,891$ 450,750$ -10.4% 478,900$ -15.7% 295,000$ 261,250$ 12.9% 280,000$ 5.4%
Average Price 1,034,280$ 1,118,633$ -7.5% 1,033,291$ 0.1% 420,611$ 507,137$ -17.1% 485,769$ -13.4% 341,207$ 286,993$ 18.9% 306,858$ 11.2%
Detached Townhouse Apartment
Langley Aug-13 Aug-12 % change Jul-13 % change Aug-13 Aug-12 % change Jul-13 % change Aug-13 Aug-12 % change Jul-13 % change
Sales 114 93 22.6% 133 -14.3% 58 54 7.4% 42 38.1% 39 28 39.3% 35 11.4%
New Listings 143 167 -14.4% 167 -14.4% 78 86 -9.3% 92 -15.2% 56 77 -27.3% 78 -28.2%
Active Listings 480 615 -22.0% 506 -5.1% 262 268 -2.2% 267 -1.9% 275 334 -17.7% 289 -4.8%
Benchmark Price 560,400$ 548,000$ 2.3% 558,000$ 0.4% 288,400$ 289,100$ -0.2% 285,200$ 1.1% 207,900$ 216,200$ -3.8% 207,900$ 0.0%
Median Price 579,000$ 540,000$ 7.2% 525,000$ 10.3% 325,000$ 312,450$ 4.0% 306,250$ 6.1% 192,500$ 221,100$ -12.9% 200,000$ -3.8%
Average Price 598,485$ 562,173$ 6.5% 540,960$ 10.6% 328,610$ 313,778$ 4.7% 306,083$ 7.4% 204,888$ 223,464$ -8.3% 204,244$ 0.3%
Detached Townhouse Apartment
% % % % % %
Source: Fraser Valley Real Estate Board MLS Summary Page 2 of 3
Delta - North Aug-13 Aug-12 % change Jul-13 % change Aug-13 Aug-12 % change Jul-13 % change Aug-13 Aug-12 % change Jul-13 % change
Sales 45 27 66.7% 55 -18.2% 6 6 0.0% 4 50.0% 5 - - 3 66.7%
New Listings 73 68 7.4% 95 -23.2% 20 6 233.3% 8 150% 5 11 -54.5% 5 0.0%
Active Listings 220 221 -0.5% 230 -4.3% 44 24 83.3% 37 18.9% 26 32 -18.8% 31 -16.1%
Benchmark Price 527,900$ 526,200$ 0.3% 528,300$ -0.1% 294,700$ 299,100$ -1.5% 294,500$ 0.1% 160,200$ 171,700$ -6.7% 155,500$ 3.0%
Median Price 550,000$ 526,000$ 4.6% 526,000$ 4.6% 536,500$ 408,450$ 31.4% 354,500$ 51.3% 203,500$ -$ - 200,000$ 1.8%
Average Price 585,893$ 529,347$ 10.7% 581,613$ 0.7% 511,916$ 401,616$ 27.5% 391,750$ 30.7% 173,100$ -$ - 181,166$ -4.5%
Source: Fraser Valley Real Estate Board MLS Summary Page 2 of 3

Detached Townhouse Apartment
Surrey - Combined* Aug-13 Aug-12 % change Jul-13 % change Aug-13 Aug-12 % change Jul-13 % change Aug-13 Aug-12 % change Jul-13 % change
Sales 248 209 18.7% 314 -21.0% 129 88 46.6% 145 -11.0% 83 79 5.1% 80 3.8%
Average Price 581,595$ 566,113$ 2.7% 593,878$ -2.1% 314,380$ 325,843$ -3.5% 327,740$ -4.1% 212,577$ 210,316$ 1.1% 208,632$ 1.9%
*Central Surrey, Cloverdale and North Surrey
Detached Townhouse Apartment
Surrey - Central Aug-13 Aug-12 % change Jul-13 % change Aug-13 Aug-12 % change Jul-13 % change Aug-13 Aug-12 % change Jul-13 % change
Sales 131 117 12.0% 151 -13.2% 74 47 57.4% 89 -16.9% 25 28 -10.7% 21 19.0%
New Listings 290 285 1.8% 338 -14.2% 132 112 17.9% 137 -3.6% 34 38 -10.5% 73 -53.4%
Active Listings 1,023 993 3.0% 1,051 -2.7% 452 426 6.1% 453 -0.2% 205 230 -10.9% 229 -10.5%
Benchmark Price 574,200$ 567,800$ 1.1% 572,700$ 0.3% 298,800$ 304,900$ -2.0% 297,700$ 0.4% 189,400$ 196,800$ -3.8% 184,100$ 2.9%
Median Price 570,000$ 543,000$ 5.0% 585,000$ -2.6% 328,500$ 332,900$ -1.3% 325,000$ 1.1% 204,500$ 213,750$ -4.3% 186,000$ 9.9%
Average Price 587,726$ 570,083$ 3.1% 594,157$ -1.1% 325,023$ 333,274$ -2.5% 327,519$ -0.8% 206,349$ 206,332$ 0.0% 189,716$ 8.8%
Detached Townhouse Apartment
Surrey - Cloverdale Aug-13 Aug-12 % change Jul-13 % change Aug-13 Aug-12 % change Jul-13 % change Aug-13 Aug-12 % change Jul-13 % change
Sales 53 40 32.5% 68 -22.1% 35 30 16.7% 38 -7.9% 12 9 33.3% 10 20.0%
New Listings 92 100 -8.0% 90 2.2% 39 46 -15.2% 46 -15.2% 15 20 -25.0% 26 -42.3%
% % % % % %
Source: Fraser Valley Real Estate Board MLS Summary Page 3 of 3
Active Listings 271 290 -6.6% 280 -3.2% 135 217 -37.8% 155 -12.9% 88 89 -1.1% 94 -6.4%
Benchmark Price 578,200$ 574,200$ 0.7% 572,200$ 1.0% 325,400$ 322,900$ 0.8% 323,700$ 0.5% 227,800$ 229,500$ -0.7% 225,300$ 1.1%
Median Price 567,000$ 545,950$ 3.9% 560,750$ 1.1% 301,900$ 315,773$ -4.4% 331,500$ -8.9% 242,500$ 186,900$ 29.7% 213,750$ 13.5%
Average Price 576,767$ 563,290$ 2.4% 572,785$ 0.7% 301,355$ 330,597$ -8.8% 337,817$ -10.8% 250,783$ 215,177$ 16.5% 246,595$ 1.7%
Detached Townhouse Apartment
Surrey - North Aug-13 Aug-12 % change Jul-13 % change Aug-13 Aug-12 % change Jul-13 % change Aug-13 Aug-12 % change Jul-13 % change
Sales 64 52 23.1% 95 -32.6% 20 11 81.8% 18 11.1% 46 42 9.5% 49 -6.1%
New Listings 104 103 1.0% 141 -26.2% 37 27 37.0% 33 12.1% 91 90 1.1% 138 -34.1%
Active Listings 422 411 2.7% 448 -5.8% 127 122 4.1% 130 -2.3% 461 451 2.2% 489 -5.7%
Benchmark Price 532,400$ 529,600$ 0.5% 531,400$ 0.2% 243,900$ 245,000$ -0.4% 242,600$ 0.5% 207,000$ 201,700$ 2.6% 203,700$ 1.6%
Median Price 527,500$ 508,000$ 3.8% 554,000$ -4.8% 330,775$ 275,000$ 20.3% 327,750$ 0.9% 192,500$ 215,500$ -10.7% 204,000$ -5.6%
Average Price 573,041$ 559,349$ 2.4% 608,531$ -5.8% 297,792$ 281,127$ 5.9% 307,556$ -3.2% 205,994$ 211,929$ -2.8% 208,990$ -1.4%
Source: Fraser Valley Real Estate Board MLS Summary Page 3 of 3

MLS® Home Price Index - Fraser ValleyAugust 2013
BENCHMARK INDEX ONE MONTH THREE MONTH SIX MONTH ONE YEAR THREE YEAR FIVE YEAR
PRICE (HPI) % CHANGE % CHANGE % CHANGE % CHANGE % CHANGE % CHANGE
RESIDENTIAL LOWER MAINLAND 542,300 153.1 0.0 0.5 1.7 -1.1 5.3 6.5COMBINED FRASER VALLEY BOARD 428,400 143.4 0.1 0.3 1.3 -0.6 4.2 1.3
NORTH DELTA 490,800 152.1 0.0 1.6 2.1 -0.3 5.3 8.5NORTH SURREY 376,800 155.3 0.7 0.6 2.0 1.1 7.6 2.3SURREY 451,700 146.0 0.5 0.4 1.3 -0.3 5.6 4.4CLOVERDALE 478,500 142.4 0.9 0.7 2.8 0.5 3.0 3.3SOUTH SURREY & WHITE ROCK 593,300 147.8 -0.7 -0.1 1.0 -2.7 9.6 7.0LANGLEY 422,500 137.4 0.5 0.2 1.6 0.8 0.2 -1.1ABBOTSFORD 332,500 135.9 -0.2 0.0 0.5 -1.5 1.3 -4.5MISSION 336,100 126.7 -1.1 0.6 0.7 -1.6 -4.7 -10.9
DETACHED LOWER MAINLAND 758,100 161.1 0.3 0.6 2.3 -1.2 10.5 14.6FRASER VALLEY BOARD 551,000 147.1 0.0 0.3 1.9 -0.1 7.4 7.3NORTH DELTA 527,900 154.0 -0.1 2.1 2.6 0.3 6.6 10.9NORTH SURREY 532,400 152.8 0.2 0.4 0.5 0.5 8.8 9.7SURREY 574,200 153.4 0.3 0.6 2.3 1.1 12.1 12.9CLOVERDALE 578,200 145.1 1.0 -0.1 3.3 0.7 5.9 8.3SOUTH SURREY & WHITE ROCK 841,600 159.0 -0.9 -1.2 0.1 -3.9 14.7 13.9LANGLEY 560,400 140.4 0.4 1.1 3.5 2.3 2.0 3.7ABBOTSFORD 432,900 136.1 0.0 0.4 2.2 0.2 2.8 0.1
© Fraser Valley Real Estate BoardAll indices equal 100 in January, 2005. An index of 120 indicates a 20% increase in price since January, 2005.
Lower Mainland combines data across the Fraser Valley and Greater Vancouver real estate board areas.
MISSION 355,300 126.7 -1.2 0.7 1.2 -1.3 -3.9 -10.1
TOWNHOUSE LOWER MAINLAND 390,400 141.7 0.1 0.3 0.4 -1.4 0.1 0.1FRASER VALLEY BOARD 298,200 132.4 0.2 0.1 0.5 -1.6 -1.9 -5.2NORTH DELTA 294,700 143.1 0.1 -0.7 0.4 -1.5 3.9 2.1NORTH SURREY 243,900 135.4 0.5 1.0 2.9 -0.4 -2.5 -9.4SURREY 298,800 131.5 0.4 0.7 0.2 -2.0 -3.6 -5.3CLOVERDALE 325,400 132.2 0.5 2.3 1.9 0.8 -3.1 -5.2SOUTH SURREY & WHITE ROCK 447,700 136.2 -0.4 -1.0 -1.8 -4.4 7.7 4.7LANGLEY 288,400 131.7 1.2 -1.0 0.6 -0.2 -1.6 -5.4ABBOTSFORD 236,900 128.3 -1.8 -0.5 1.3 -2.6 -6.7 -9.9MISSION 223,900 122.1 -0.9 -1.6 -4.2 -1.9 -8.7 -16.1
APARTMENT LOWER MAINLAND 336,000 147.4 -0.3 0.2 1.5 -1.1 0.6 -1.1FRASER VALLEY BOARD 203,900 144.3 1.0 0.3 0.7 -1.3 1.2 -7.7NORTH DELTA 160,200 137.2 3.1 -2.1 -3.5 -6.7 -10.0 -16.5NORTH SURREY 207,000 165.7 1.6 0.7 4.1 2.6 9.2 -2.1SURREY 189,400 143.7 2.9 -1.1 -1.1 -3.8 -5.7 -12.4CLOVERDALE 227,800 157.4 1.1 0.8 2.9 -0.8 2.5 -3.1SOUTH SURREY & WHITE ROCK 246,700 125.4 0.2 3.6 5.4 0.8 -5.9 -10.8LANGLEY 207,900 136.4 0.0 -1.2 -2.6 -3.8 -2.4 -8.0ABBOTSFORD 166,900 141.4 0.4 -0.6 -3.5 -4.1 4.4 -9.1MISSION 155,700 132.5 -0.2 -1.3 -4.0 -6.4 -11.0 -16.8
© Fraser Valley Real Estate BoardAll indices equal 100 in January, 2005. An index of 120 indicates a 20% increase in price since January, 2005.
Lower Mainland combines data across the Fraser Valley and Greater Vancouver real estate board areas.

20
25
30
35
40
45
Ratio
Sales‐to‐Active Listings Ratio, All Types, Fraser Valley
Sellers Market
Balanced Market
0
5
10
15
2005
2006
2007
2008
2009
2010
2011
2012
2013
Buyers Market
AUGUST: 12%
© Fraser Valley Real Estate Board

6 000
8,000
10,000
12,000
14,000
Sales, Listings & Active Inventory, All Types, Fraser Valley
Actives Listings Sales
0
2,000
4,000
6,000
2005
2006
2007
2008
2009
2010
2011
2012
2013
© Fraser Valley Real Estate Board

110
120
130
140
150
160
170
MLS® Home Price Index, Fraser ValleyDetached Townhouse Apartment
50
60
70
80
90
100
2005
2006
2007
2008
2009
2010
2011
2012
2013
© Fraser Valley Real Estate Board

$400,000
$500,000
$600,000
$700,000
MLS® Home Price Index Benchmark Prices, Fraser ValleyDetached Townhouse Apartment
$0
$100,000
$200,000
$300,000
2005
2006
2007
2008
2009
2010
2011
2012
2013
© Fraser Valley Real Estate Board
$300,000
$400,000
$500,000
$600,000
$700,000
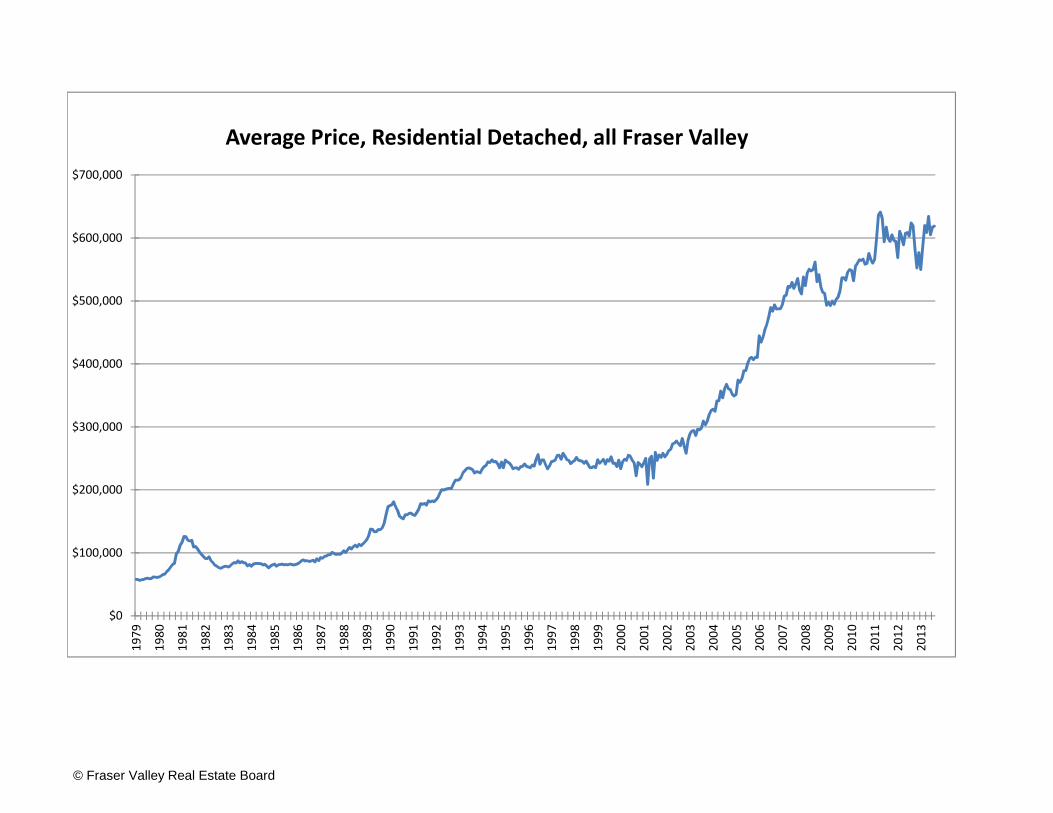
Average Price, Residential Detached, all Fraser Valley
$0
$100,000
$200,000
1979
1980
1981
1982
1983
1984
1985
1986
1987
1988
1989
1990
1991
1992
1993
1994
1995
1996
1997
1998
1999
2000
2001
2002
2003
2004
2005
2006
2007
2008
2009
2010
2011
2012
2013
© Fraser Valley Real Estate Board

$300,000
$400,000
$500,000
$600,000
20,000
25,000
30,000
35,000
40,000
Annual Sales, New Listings, Average Price All Property Types, Fraser Valley
Sales New Listings Average Price
© Fraser Valley Real Estate Board
$‐
$100,000
$200,000
‐
5,000
10,000
15,000
1990
1991
1992
1993
1994
1995
1996
1997
1998
1999
2000
2001
2002
2003
2004
2005
2006
2007
2008
2009
2010
2011
2012
© Fraser Valley Real Estate Board